Embed Size (px)
Citation preview
© 2018 Visual BI Solutions, Inc. All rights reserved. www.visualbi.com
Analysis to Action
Enable new and timely insights to grow your business
www.visualbi.com
© 2018 Visual BI Solutions, Inc. All rights reserved. www.visualbi.com 2
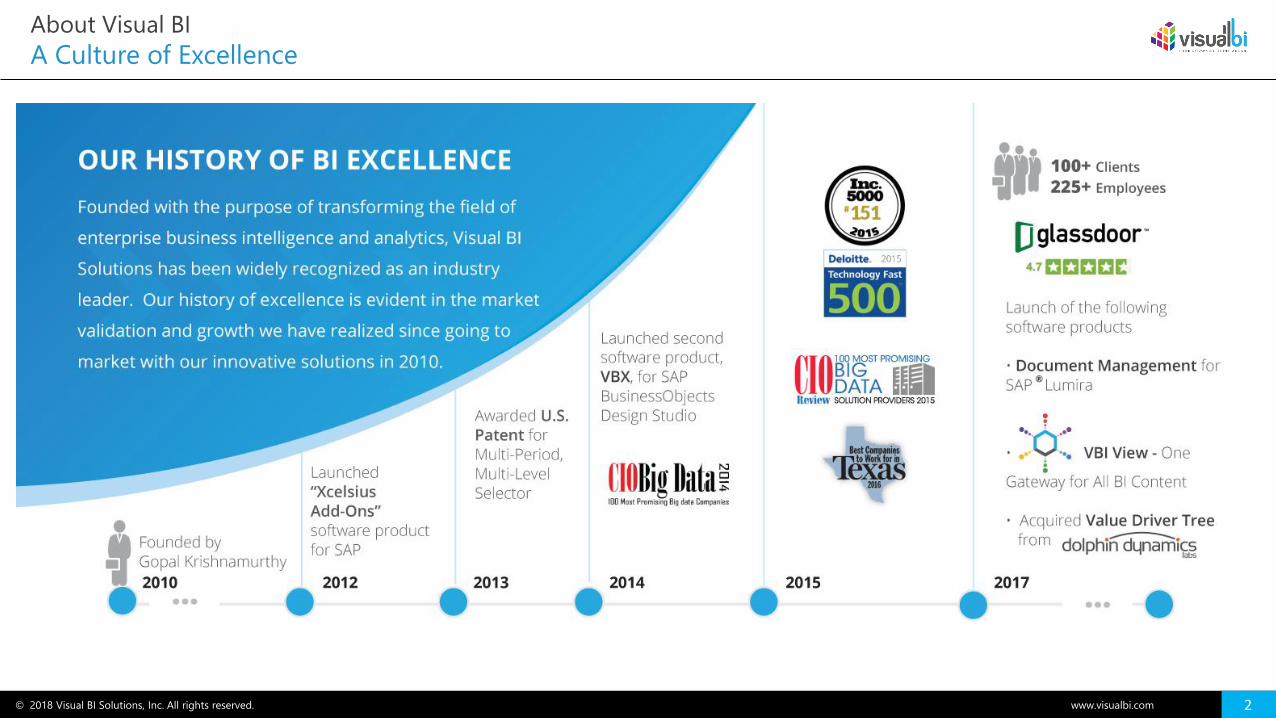
About Visual BI
A Culture of Excellence
© 2018 Visual BI Solutions, Inc. All rights reserved. www.visualbi.com 3
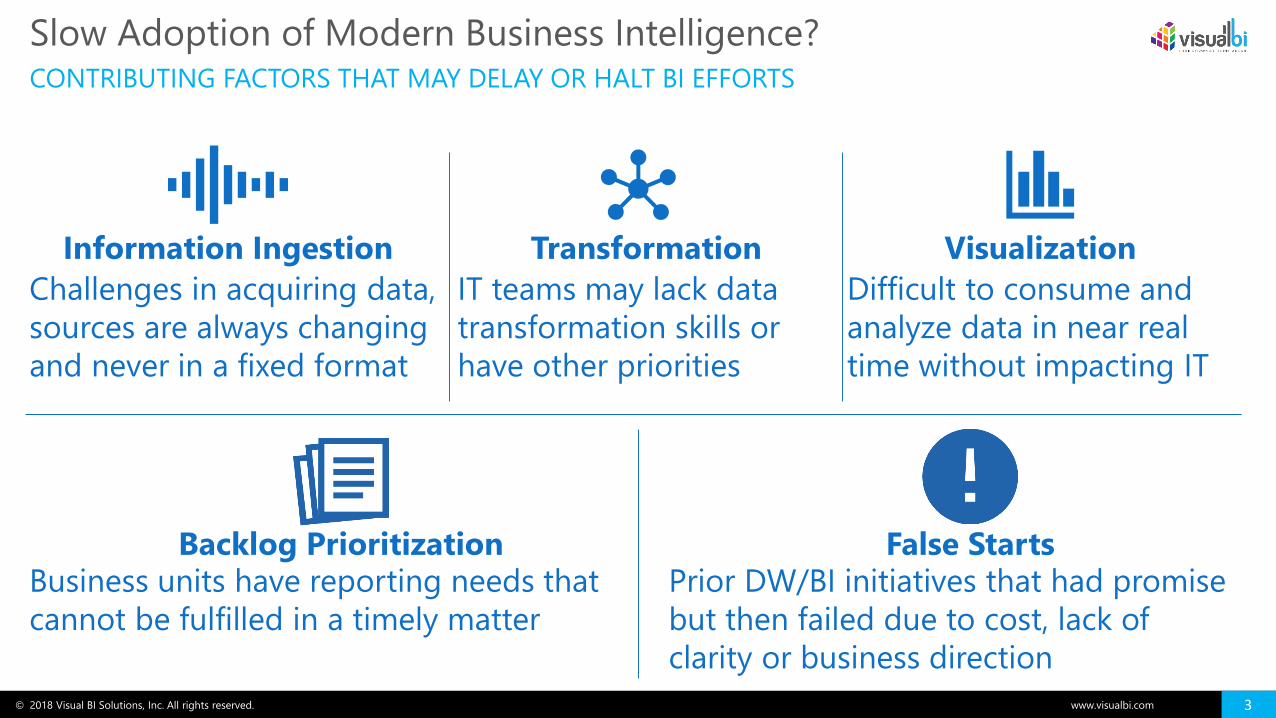
CONTRIBUTING FACTORS THAT MAY DELAY OR HALT BI EFFORTS
Slow Adoption of Modern Business Intelligence?
Visualization
Difficult to consume and
analyze data in near real
time without impacting IT
Transformation
IT teams may lack data
transformation skills or
have other priorities
Information Ingestion
Challenges in acquiring data,
sources are always changing
and never in a fixed format
Backlog PrioritizationBusiness units have reporting needs that
cannot be fulfilled in a timely matter
False StartsPrior DW/BI initiatives that had promise
but then failed due to cost, lack of
clarity or business direction
© 2018 Visual BI Solutions, Inc. All rights reserved. www.visualbi.com 4
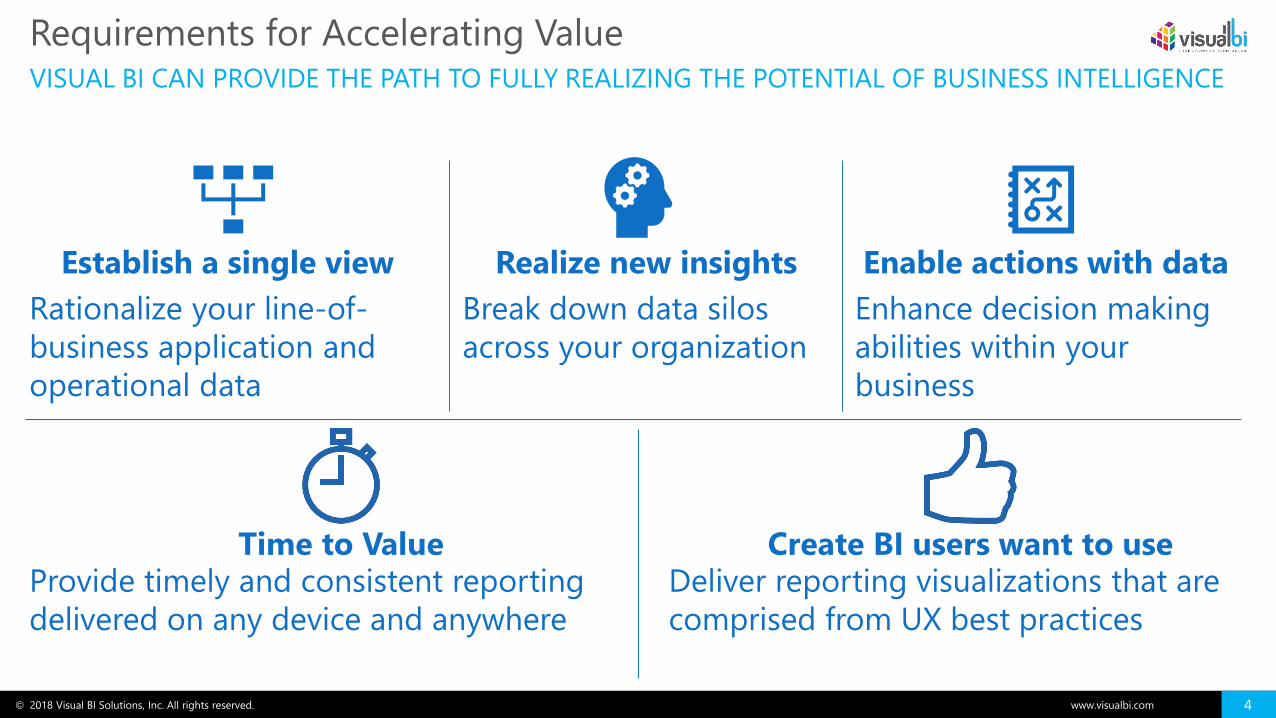
VISUAL BI CAN PROVIDE THE PATH TO FULLY REALIZING THE POTENTIAL OF BUSINESS INTELLIGENCE
Requirements for Accelerating Value
Enable actions with data
Enhance decision making
abilities within your
business
Realize new insights
Break down data silos
across your organization
Establish a single view
Rationalize your line-of-
business application and
operational data
Time to ValueProvide timely and consistent reporting
delivered on any device and anywhere
Create BI users want to useDeliver reporting visualizations that are
comprised from UX best practices
© 2018 Visual BI Solutions, Inc. All rights reserved. www.visualbi.com 5
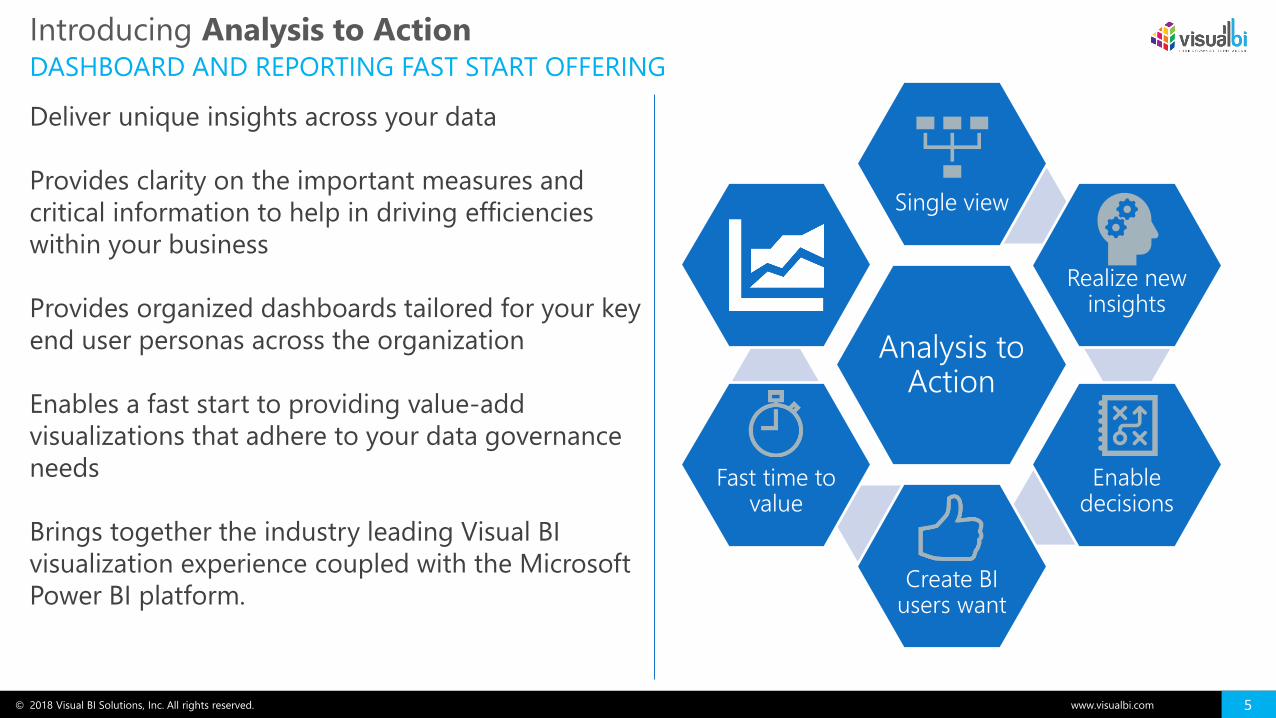
DASHBOARD AND REPORTING FAST START OFFERING
Introducing Analysis to Action
Deliver unique insights across your data
Provides clarity on the important measures and
critical information to help in driving efficiencies
within your business
Provides organized dashboards tailored for your key
end user personas across the organization
Enables a fast start to providing value-add
visualizations that adhere to your data governance
needs
Brings together the industry leading Visual BI
visualization experience coupled with the Microsoft
Power BI platform.
Analysis to Action
Single view
Realize new insights
Enable decisions
Create BI users want
Fast time to value
© 2018 Visual BI Solutions, Inc. All rights reserved. www.visualbi.com 6
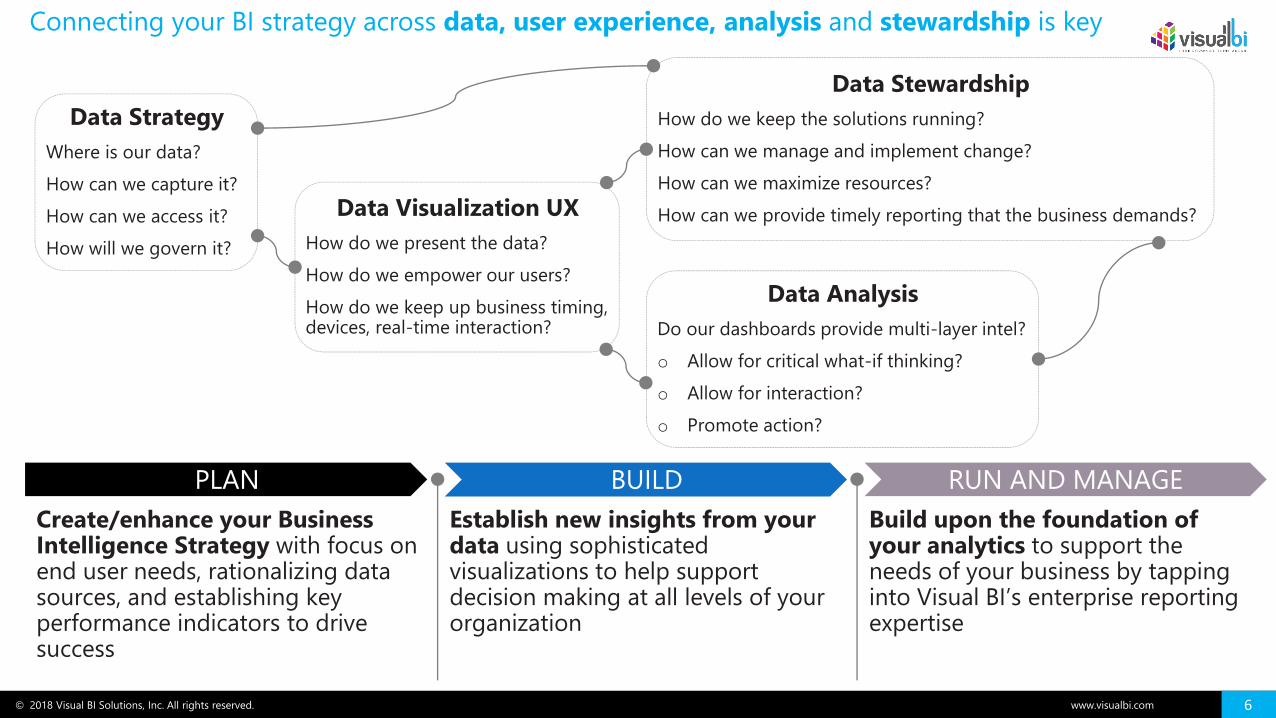
Connecting your BI strategy across data, user experience, analysis and stewardship is key
PLAN RUN AND MANAGEBUILD
Data Strategy
Where is our data?
How can we capture it?
How can we access it?
How will we govern it?
Data Visualization UX
How do we present the data?
How do we empower our users?
How do we keep up business timing, devices, real-time interaction?
Data Stewardship
How do we keep the solutions running?
How can we manage and implement change?
How can we maximize resources?
How can we provide timely reporting that the business demands?
Build upon the foundation of your analytics to support the needs of your business by tapping into Visual BI’s enterprise reporting expertise
Create/enhance your Business Intelligence Strategy with focus on end user needs, rationalizing data sources, and establishing key performance indicators to drive success
Establish new insights from your data using sophisticated visualizations to help support decision making at all levels of your organization
Data Analysis
Do our dashboards provide multi-layer intel?
o Allow for critical what-if thinking?
o Allow for interaction?
o Promote action?
© 2018 Visual BI Solutions, Inc. All rights reserved. www.visualbi.com 7
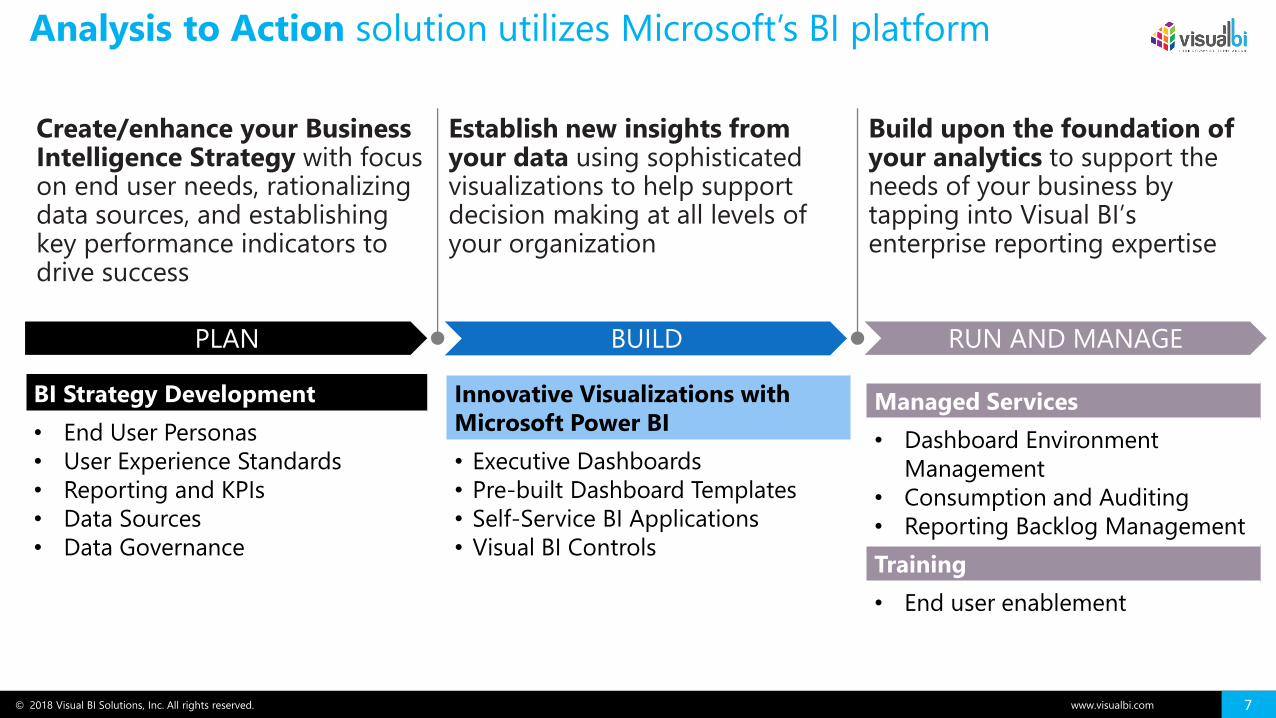
Analysis to Action solution utilizes Microsoft’s BI platform
Build upon the foundation of your analytics to support the needs of your business by tapping into Visual BI’s enterprise reporting expertise
Create/enhance your Business Intelligence Strategy with focus on end user needs, rationalizing data sources, and establishing key performance indicators to drive success
Establish new insights from your data using sophisticated visualizations to help support decision making at all levels of your organization
PLAN RUN AND MANAGEBUILD
BI Strategy Development
• End User Personas
• User Experience Standards
• Reporting and KPIs
• Data Sources
• Data Governance
Managed Services
• Dashboard Environment
Management
• Consumption and Auditing
• Reporting Backlog Management
Training
• End user enablement
Innovative Visualizations with
Microsoft Power BI
• Executive Dashboards
• Pre-built Dashboard Templates
• Self-Service BI Applications
• Visual BI Controls
© 2018 Visual BI Solutions, Inc. All rights reserved. www.visualbi.com 8
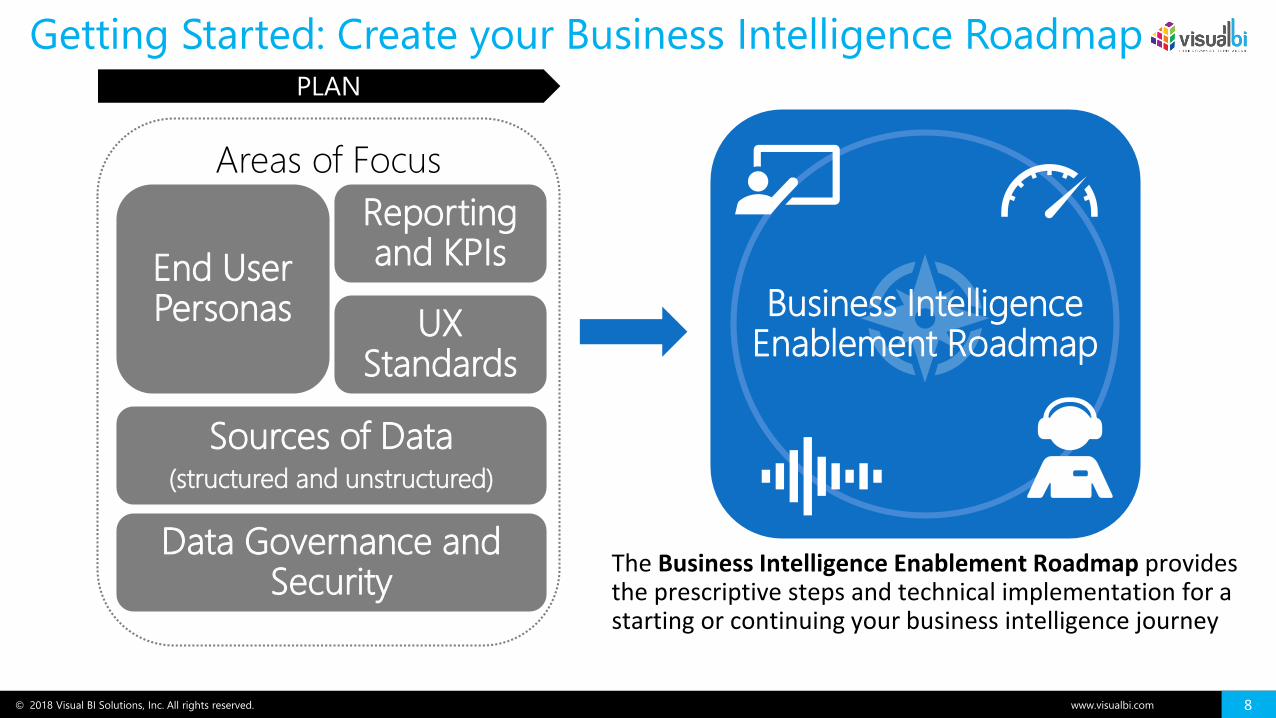
Getting Started: Create your Business Intelligence Roadmap
End User Personas
Areas of Focus
Sources of Data(structured and unstructured)
Reporting and KPIs
Business Intelligence Enablement Roadmap
The Business Intelligence Enablement Roadmap provides the prescriptive steps and technical implementation for a starting or continuing your business intelligence journey
Data Governance and Security
UX Standards
PLAN
© 2018 Visual BI Solutions, Inc. All rights reserved. www.visualbi.com 9
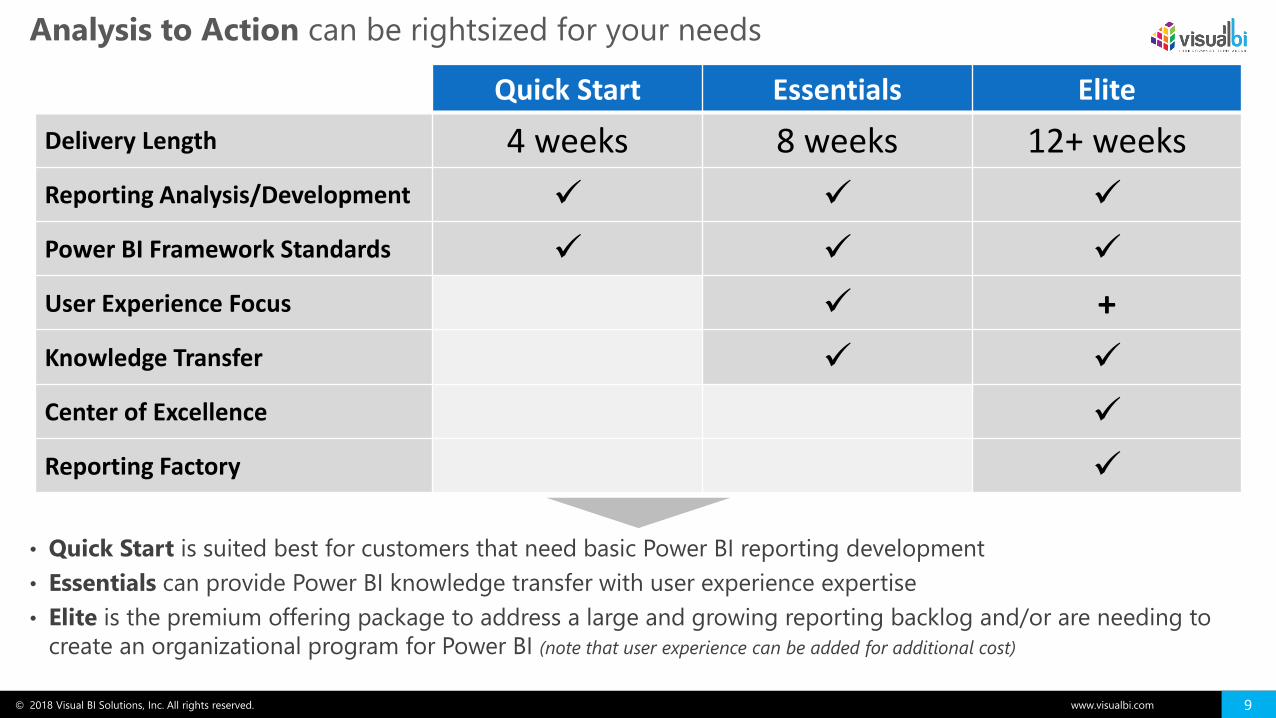
Analysis to Action can be rightsized for your needs
• Quick Start is suited best for customers that need basic Power BI reporting development
• Essentials can provide Power BI knowledge transfer with user experience expertise
• Elite is the premium offering package to address a large and growing reporting backlog and/or are needing to
create an organizational program for Power BI (note that user experience can be added for additional cost)
Quick Start Essentials Elite
Delivery Length 4 weeks 8 weeks 12+ weeks
Reporting Analysis/Development ✓ ✓ ✓
Power BI Framework Standards ✓ ✓ ✓
User Experience Focus ✓ +
Knowledge Transfer ✓ ✓
Center of Excellence ✓
Reporting Factory ✓
© 2018 Visual BI Solutions, Inc. All rights reserved. www.visualbi.com 10
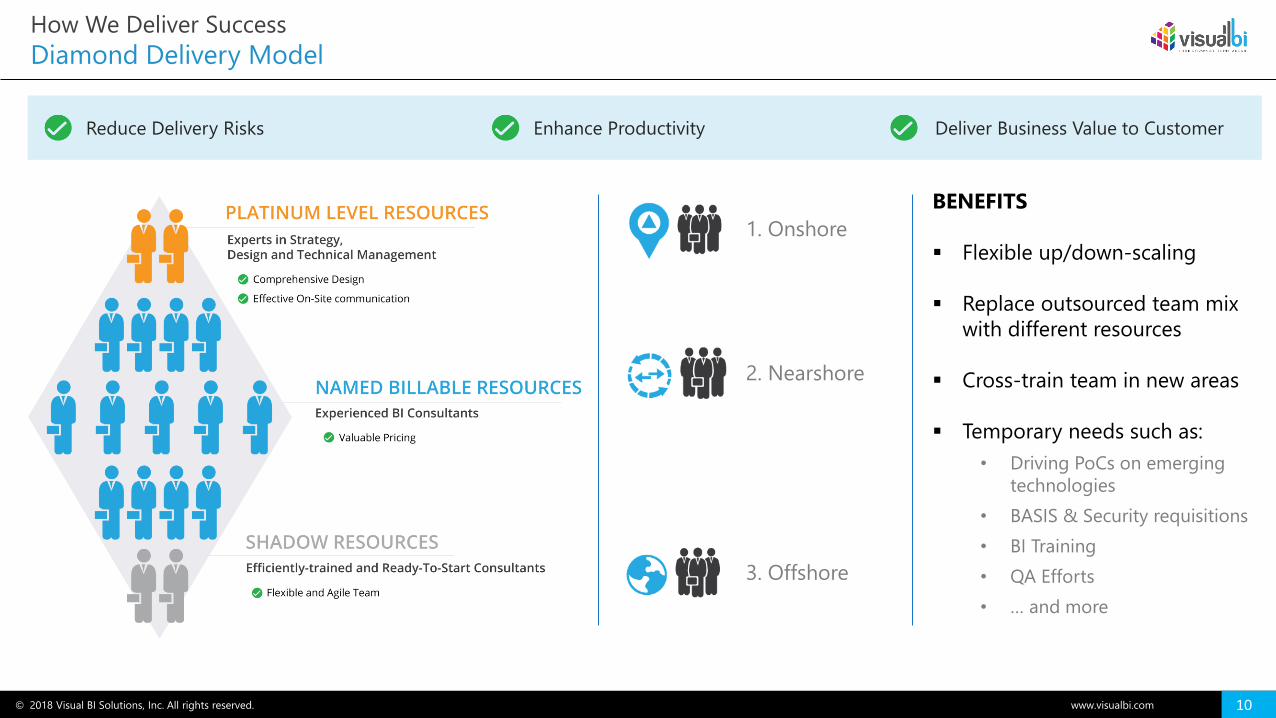
How We Deliver Success
Diamond Delivery Model
Enhance Productivity
BENEFITS
▪ Flexible up/down-scaling
▪ Replace outsourced team mix
with different resources
▪ Cross-train team in new areas
▪ Temporary needs such as:
• Driving PoCs on emerging
technologies
• BASIS & Security requisitions
• BI Training
• QA Efforts
• … and more
1. Onshore
2. Nearshore
3. Offshore
Reduce Delivery Risks Deliver Business Value to Customer
© 2018 Visual BI Solutions, Inc. All rights reserved. www.visualbi.com 11
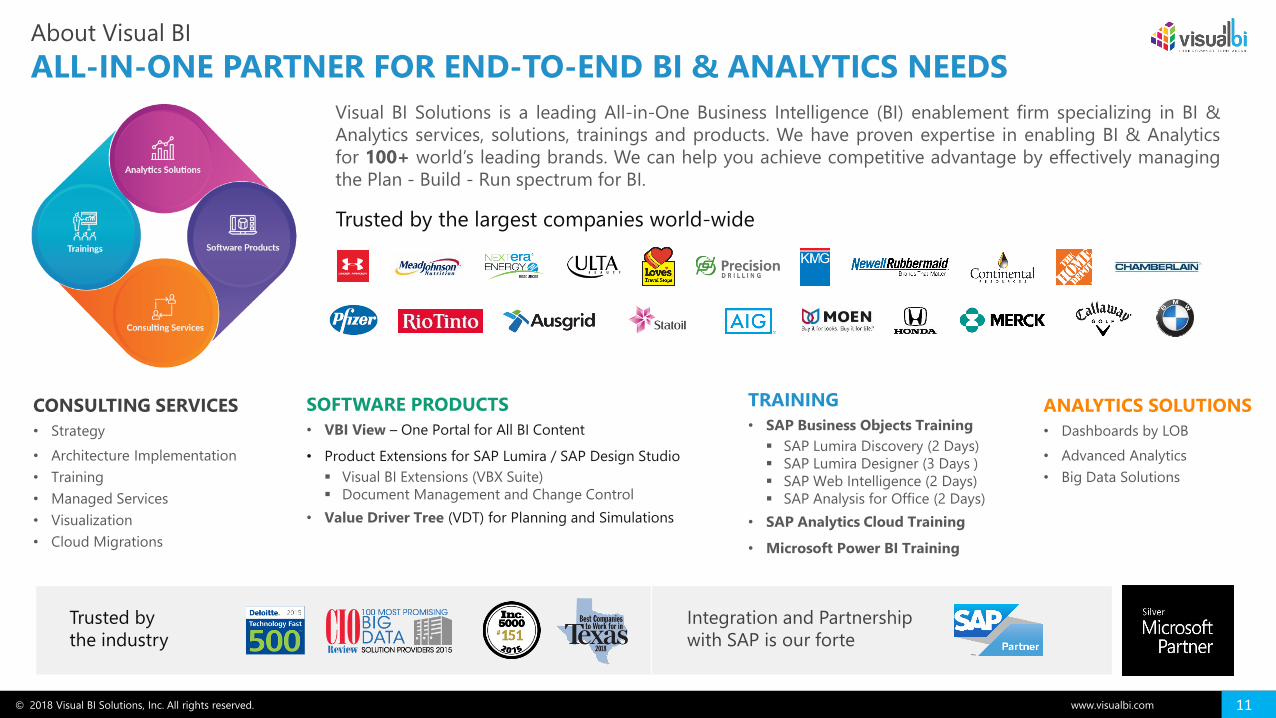
About Visual BI
ALL-IN-ONE PARTNER FOR END-TO-END BI & ANALYTICS NEEDS
Visual BI Solutions is a leading All-in-One Business Intelligence (BI) enablement firm specializing in BI &
Analytics services, solutions, trainings and products. We have proven expertise in enabling BI & Analytics
for 100+ world’s leading brands. We can help you achieve competitive advantage by effectively managing
the Plan - Build - Run spectrum for BI.
Trusted by the largest companies world-wide
Trusted by
the industry
Integration and Partnership
with SAP is our forte
CONSULTING SERVICES
• Strategy
• Architecture Implementation
• Training
• Managed Services
• Visualization
• Cloud Migrations
ANALYTICS SOLUTIONS
• Dashboards by LOB
• Advanced Analytics
• Big Data Solutions
TRAINING
• SAP Business Objects Training
▪ SAP Lumira Discovery (2 Days)
▪ SAP Lumira Designer (3 Days )
▪ SAP Web Intelligence (2 Days)
▪ SAP Analysis for Office (2 Days)
• SAP Analytics Cloud Training
• Microsoft Power BI Training
SOFTWARE PRODUCTS
• VBI View – One Portal for All BI Content
• Product Extensions for SAP Lumira / SAP Design Studio
▪ Visual BI Extensions (VBX Suite)
▪ Document Management and Change Control
• Value Driver Tree (VDT) for Planning and Simulations
© 2018 Visual BI Solutions, Inc. All rights reserved. www.visualbi.com 12
About Visual BI
CUSTOMER PORTFOLIO (Software, Services, Training)
© 2018 Visual BI Solutions, Inc. All rights reserved. www.visualbi.com 13
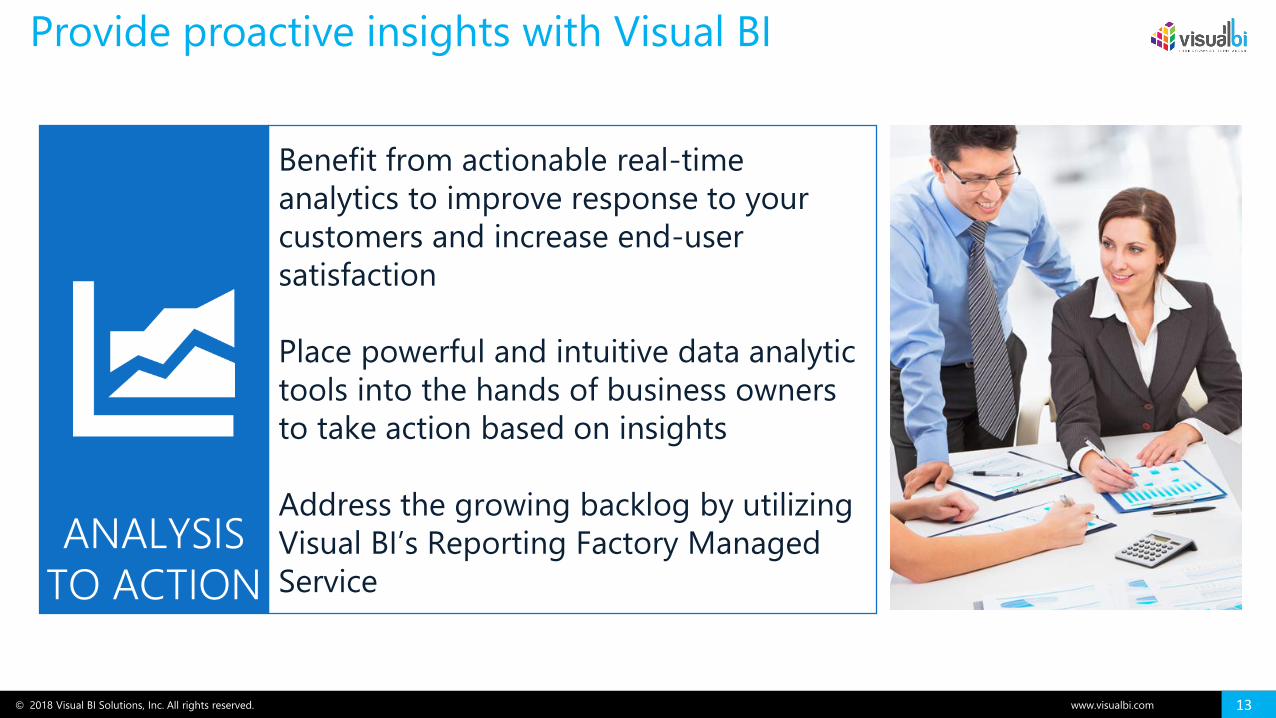
Provide proactive insights with Visual BI
ANALYSIS
TO ACTION
Benefit from actionable real-time
analytics to improve response to your
customers and increase end-user
satisfaction
Place powerful and intuitive data analytic
tools into the hands of business owners
to take action based on insights
Address the growing backlog by utilizing
Visual BI’s Reporting Factory Managed
Service
© 2018 Visual BI Solutions, Inc. All rights reserved. www.visualbi.com 14
www.visualbi.com
THANK YOU!
© 2018 Visual BI Solutions, Inc. All rights reserved. www.visualbi.com 15
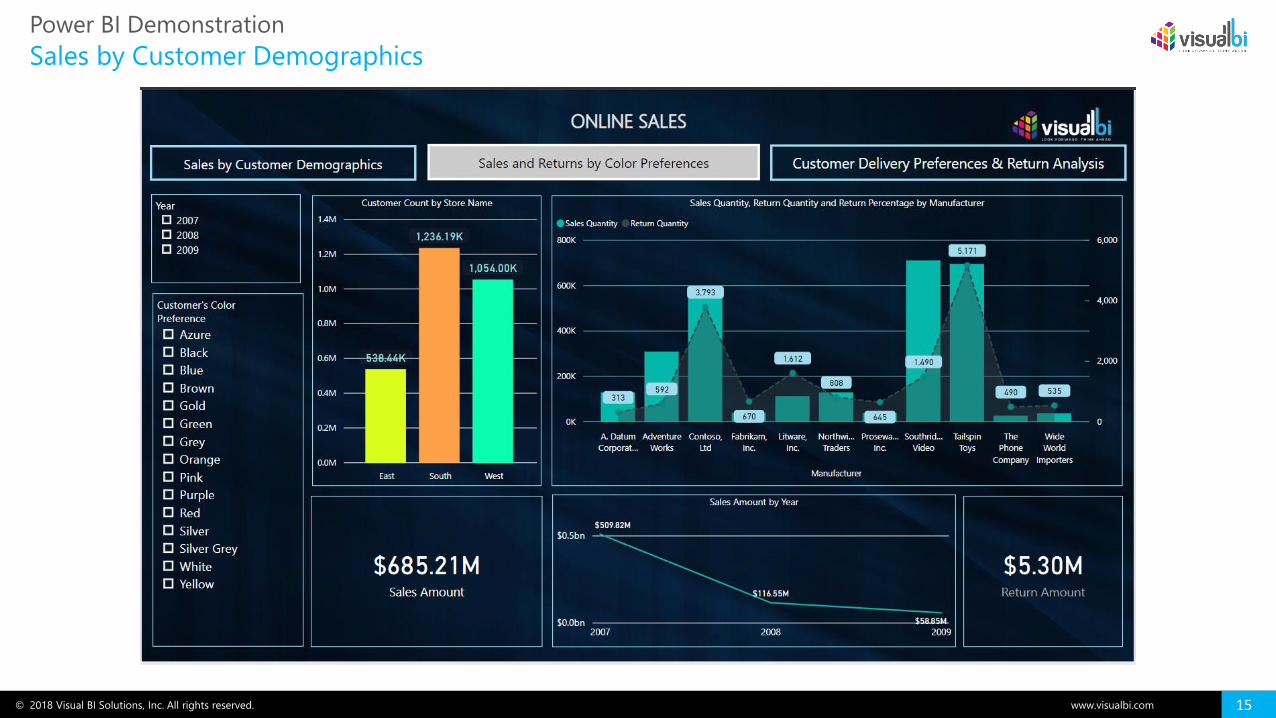
Sales by Customer Demographics
Power BI Demonstration
© 2018 Visual BI Solutions, Inc. All rights reserved. www.visualbi.com 16
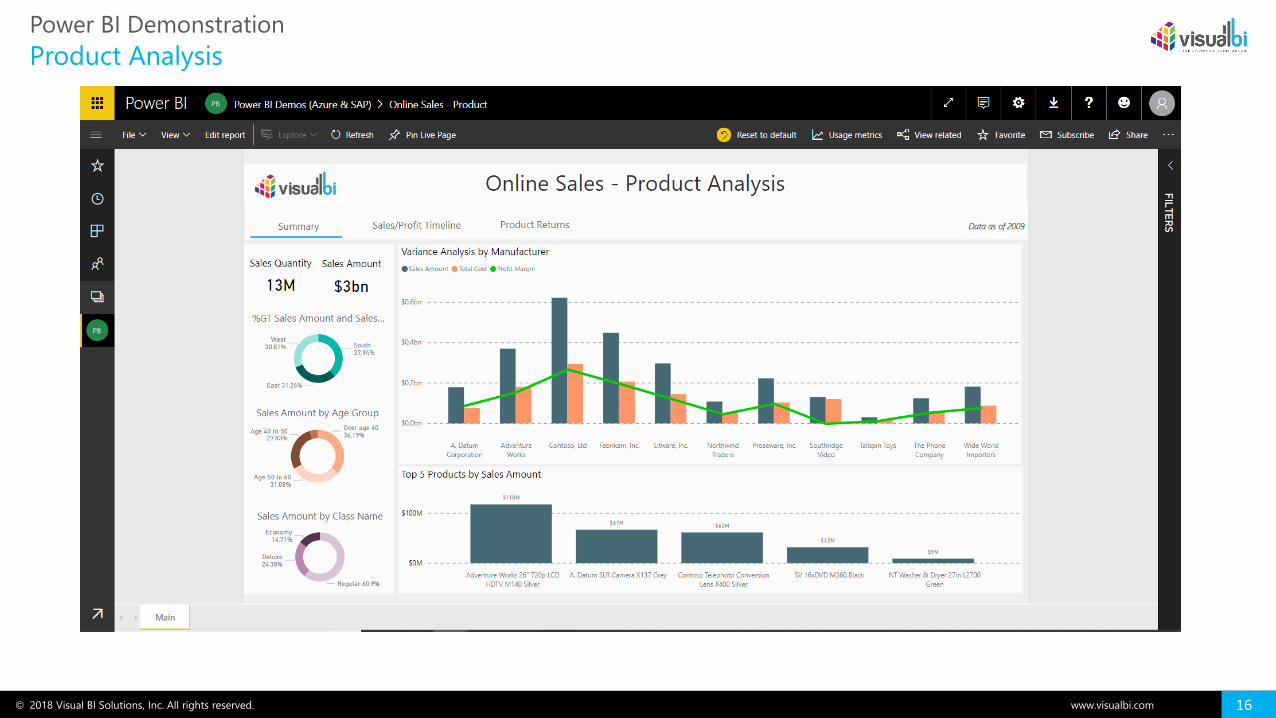
Product Analysis
Power BI Demonstration
© 2018 Visual BI Solutions, Inc. All rights reserved. www.visualbi.com 17
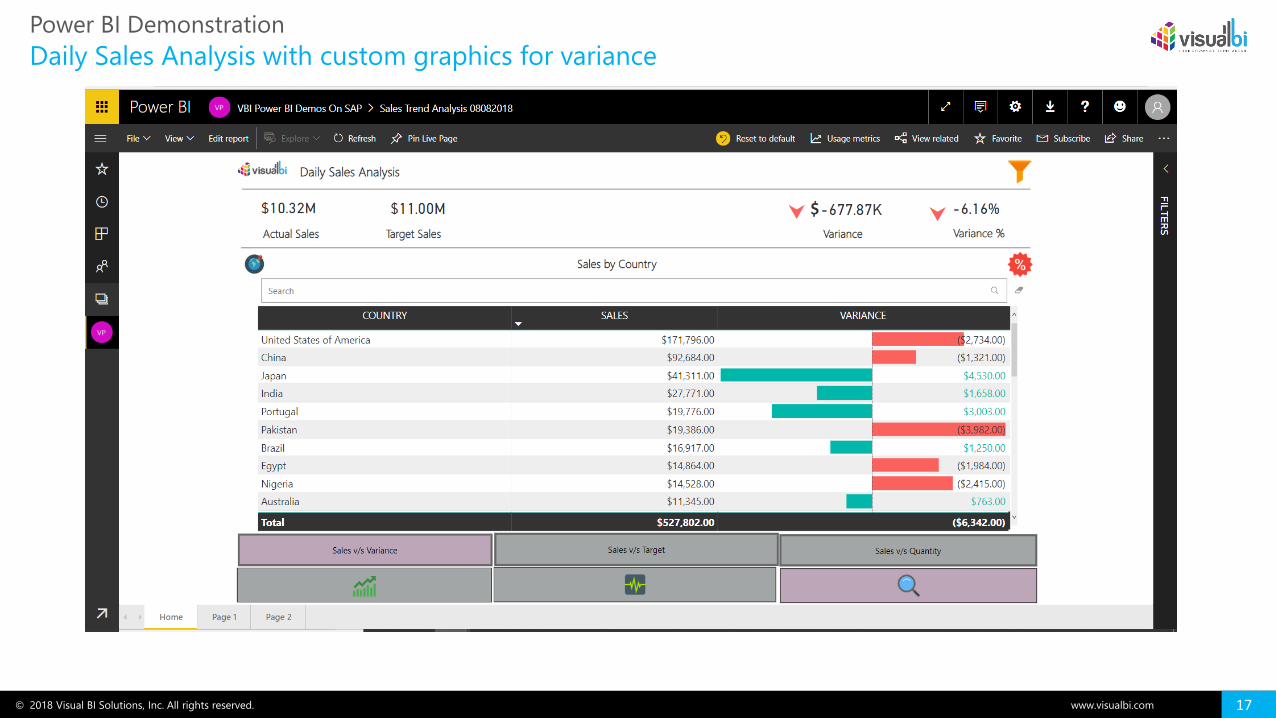
Daily Sales Analysis with custom graphics for variance
Power BI Demonstration