Embed Size (px)
Citation preview
ANALYSIS ON WATER PROVISIONING VULNERABILITY CONSUMPTION
LEVELSPRESENTER NAMES
Econ. Roberto Lucero RomeroIng. María Elisa Vaca Boada
Descriptive study of sensitivity for the support of technical criteria in the establishment of rates of
drinking water to the residential sector

Objective:
GENERATE ANALYSIS TOOLS THAT STRENGTHEN THE CORRECT ADDRESS OF STRUCTURAL FUND RATES, CONSIDERING MULTIVARIABLE ANALYSIS BASED ON:
1. STRATIFICATION OF THE RESIDENTIAL SECTOR AS REGARDS VULNERABILITY IN THE SUPPLY OF THE DRINKING WATER SERVICE.
2. SEGMENTATION OF THE STATE OF SERVICE PROVIDERS AS A FUNCTION OF THE EFFICIENCY IN THEIR MANAGEMENT.
3. ANÁLISIS COMPLEMENTARIO DE FACTORES NATURALES BIOFÍSICOS QUE CARACTERIZEN MEJOR LA VULNERABILIDAD DE ZONAS ESPECIFICAS.

PHASE 1.- NATIONAL STRATEGY -REFERENCE
PHASE 2.- STRATIFICATION AT CANTONAL LEVEL
PROVIDER CATEGORIZATION - BASED ON CASE STUDIES
BY SIZE
COMPLEMENTARY ANALYSIS OF VULNERABILITY AND
TERRITORIAL IMBALANCES
DESCRIPTIVE DIAGNOSISWATER SUPPLY
VARIABLES, EFFICIENCY PROVIDERS, BIOPHYSICAL
FACTORS
A) VULNERABLE POPULATION STRATEGIESB) PROVIDERS MORE SENSITIVE TO THE MODELC) LESS FAVORED TERRITORIES IN BIOPHYSICAL FACTORS
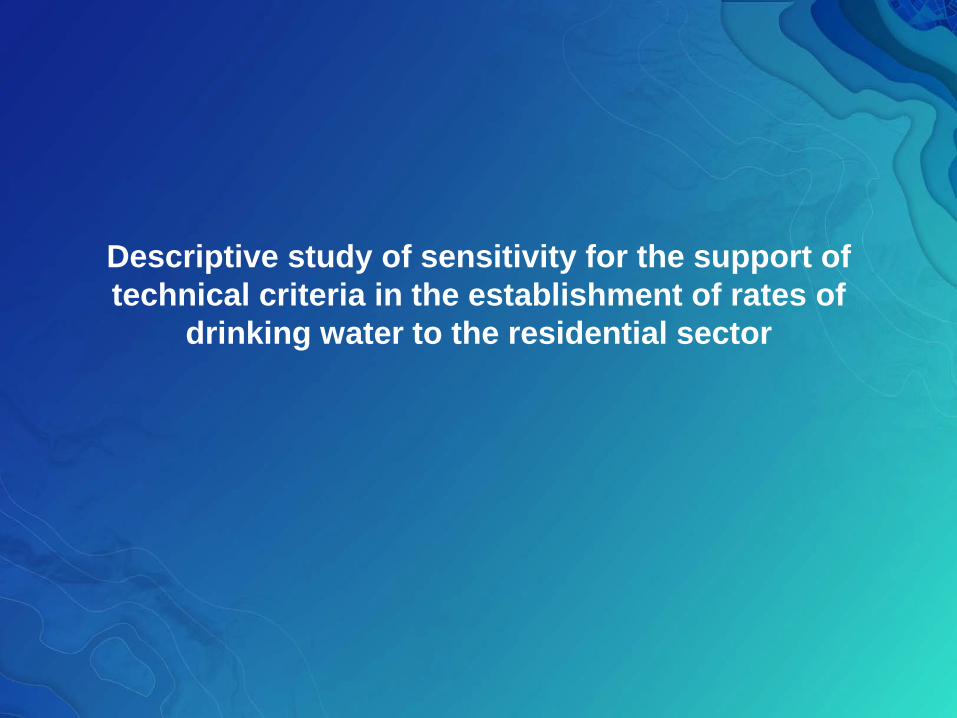
POPULATION STRATIFICATION OF VULNERABILITY IN THE SERVICEPROPOSAL ADJUSTED
PESO PUNTOSProvisioning 56,0% 560
Forma de aprovisionamiento 22,0% 220Regularidad de abastecimiento 19,0% 190
Tipo de conexión 15,0% 150Perception of water affectation 15,0% 150Housing conditions 13,0% 130
Housing type 6,0% 60Wall material 3,5% 35
Floor material 3,5% 35Consumption habits 9,0% 90
Internal water treatment 3,0% 30Saving water 3,0% 30Water refuse 1,5% 15
Close stopcock 1,5% 15Service payment 7,0% 70
Weight of payment regarding other services 5,0% 50
Payment habits 2,0% 20
100%
Selection of specific variables around the vulnerability aspect of the water - assessment of weights and scores according to importance
STRATIFICATION BY CANTONS
A 31 14,8%B 81 38,6%C 61 29,0%C- 29 13,8%D 8 3,8%
210
Subsidized versus non-subsidized sector
Rótulos de filaForma de
aprovisionamientoRegularidad de abastecimiento
Tipo de conexión
Percepción de afectación del agua
Tipo de vivienda
Ahorro del agua
Rehuso del agua
Cierra la llave de paso
Hábitos de pago PUNTAJE FINAL
24 DE MAYO 188 55 105 163 58 21 4 7 16 616AGUARICO 250 0 150 140 70 17 3 7 21 658ALAUSI 236 180 62 138 59 35 3 9 35 758ALFREDO BAQUERIZO MOR 0 69 0 0 0 0 0 0 0 69AMBATO 246 170 155 153 67 36 4 11 37 880ANTONIO ANTE 248 95 137 140 61 35 7 8 34 766ARAJUNO 192 0 30 102 70 13 1 4 11 422ARCHIDONA 216 81 69 90 57 21 5 6 22 567ARENILLAS 232 67 123 141 57 24 4 7 37 694ATACAMES 205 12 53 123 48 26 8 7 29 511ATAHUALPA 0 165 0 128 0 40 4 14 37 387
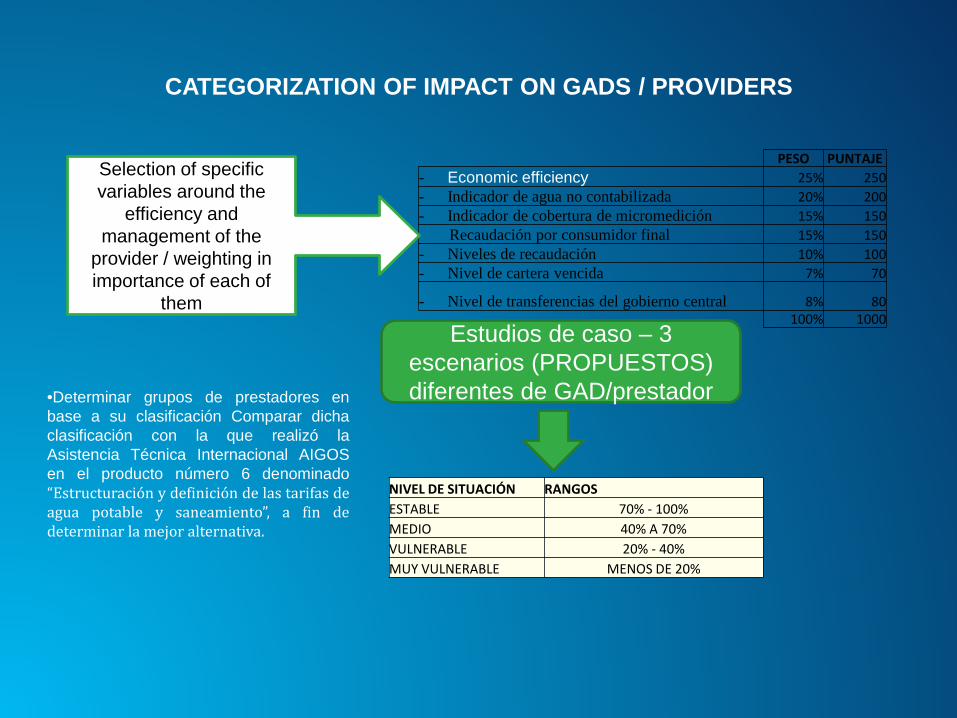
CATEGORIZATION OF IMPACT ON GADS / PROVIDERS
PESO PUNTAJE- Economic efficiency 25% 250- Indicador de agua no contabilizada 20% 200- Indicador de cobertura de micromedición 15% 150
Recaudación por consumidor final 15% 150- Niveles de recaudación 10% 100- Nivel de cartera vencida 7% 70
- Nivel de transferencias del gobierno central 8% 80100% 1000
Selection of specific variables around the
efficiency and management of the
provider / weighting in importance of each of
them
Estudios de caso – 3 escenarios (PROPUESTOS) diferentes de GAD/prestador
NIVEL DE SITUACIÓN RANGOSESTABLE 70% - 100%MEDIO 40% A 70%VULNERABLE 20% - 40%MUY VULNERABLE MENOS DE 20%
•Determinar grupos de prestadores enbase a su clasificación Comparar dichaclasificación con la que realizó laAsistencia Técnica Internacional AIGOSen el producto número 6 denominado“Estructuración y definición de las tarifas deagua potable y saneamiento”, a fin dedeterminar la mejor alternativa.
GOBIERNO NACIONAL DELA REPÚBLICA DEL ECUADOR
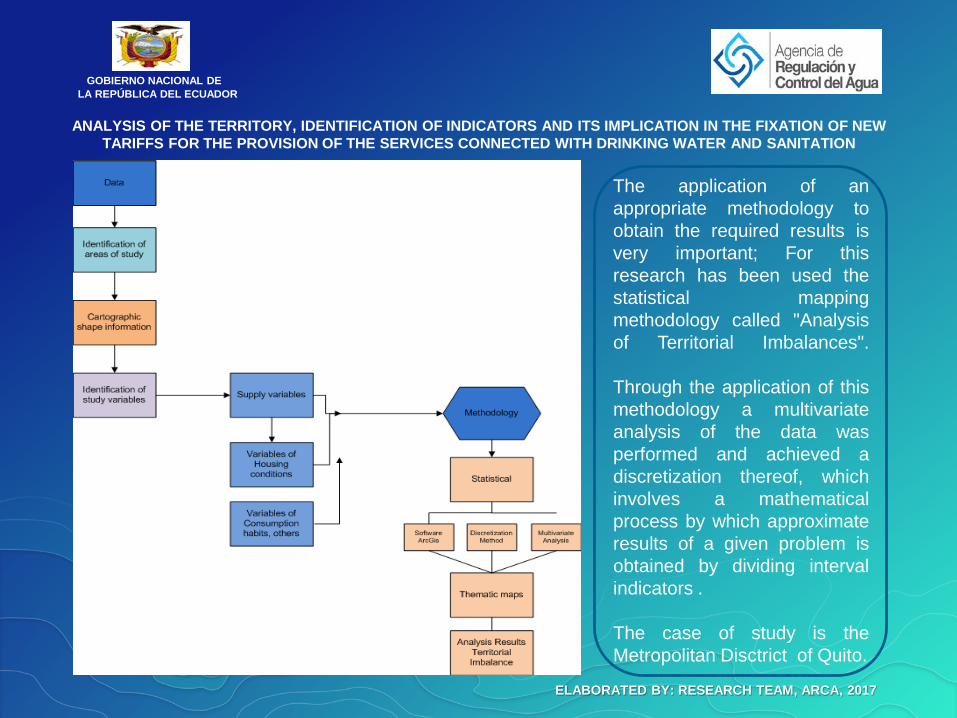
ANALYSIS OF THE TERRITORY, IDENTIFICATION OF INDICATORS AND ITS IMPLICATION IN THE FIXATION OF NEW TARIFFS FOR THE PROVISION OF THE SERVICES CONNECTED WITH DRINKING WATER AND SANITATION
The application of anappropriate methodology toobtain the required results isvery important; For thisresearch has been used thestatistical mappingmethodology called "Analysisof Territorial Imbalances".
Through the application of thismethodology a multivariateanalysis of the data wasperformed and achieved adiscretization thereof, whichinvolves a mathematicalprocess by which approximateresults of a given problem isobtained by dividing intervalindicators .
The case of study is theMetropolitan Disctrict of Quito.
ELABORATED BY: RESEARCH TEAM, ARCA, 2017
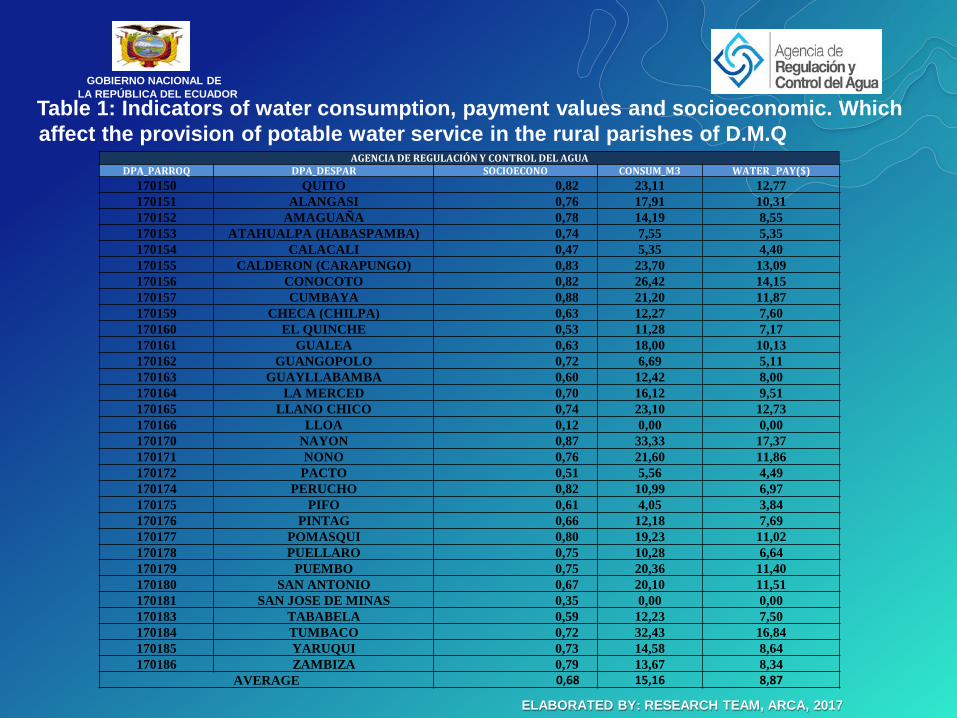
Table 1: Indicators of water consumption, payment values and socioeconomic. Which affect the provision of potable water service in the rural parishes of D.M.Q
GOBIERNO NACIONAL DELA REPÚBLICA DEL ECUADOR
AGENCIA DE REGULACIÓN Y CONTROL DEL AGUADPA_PARROQ DPA_DESPAR SOCIOECONO CONSUM_M3 WATER _PAY($)
170150 QUITO 0,82 23,11 12,77170151 ALANGASI 0,76 17,91 10,31170152 AMAGUAÑA 0,78 14,19 8,55170153 ATAHUALPA (HABASPAMBA) 0,74 7,55 5,35170154 CALACALI 0,47 5,35 4,40170155 CALDERON (CARAPUNGO) 0,83 23,70 13,09170156 CONOCOTO 0,82 26,42 14,15170157 CUMBAYA 0,88 21,20 11,87170159 CHECA (CHILPA) 0,63 12,27 7,60170160 EL QUINCHE 0,53 11,28 7,17170161 GUALEA 0,63 18,00 10,13170162 GUANGOPOLO 0,72 6,69 5,11170163 GUAYLLABAMBA 0,60 12,42 8,00170164 LA MERCED 0,70 16,12 9,51170165 LLANO CHICO 0,74 23,10 12,73170166 LLOA 0,12 0,00 0,00170170 NAYON 0,87 33,33 17,37170171 NONO 0,76 21,60 11,86170172 PACTO 0,51 5,56 4,49170174 PERUCHO 0,82 10,99 6,97170175 PIFO 0,61 4,05 3,84170176 PINTAG 0,66 12,18 7,69170177 POMASQUI 0,80 19,23 11,02170178 PUELLARO 0,75 10,28 6,64170179 PUEMBO 0,75 20,36 11,40170180 SAN ANTONIO 0,67 20,10 11,51170181 SAN JOSE DE MINAS 0,35 0,00 0,00170183 TABABELA 0,59 12,23 7,50170184 TUMBACO 0,72 32,43 16,84170185 YARUQUI 0,73 14,58 8,64170186 ZAMBIZA 0,79 13,67 8,34
AVERAGE 0,68 15,16 8,87
ELABORATED BY: RESEARCH TEAM, ARCA, 2017
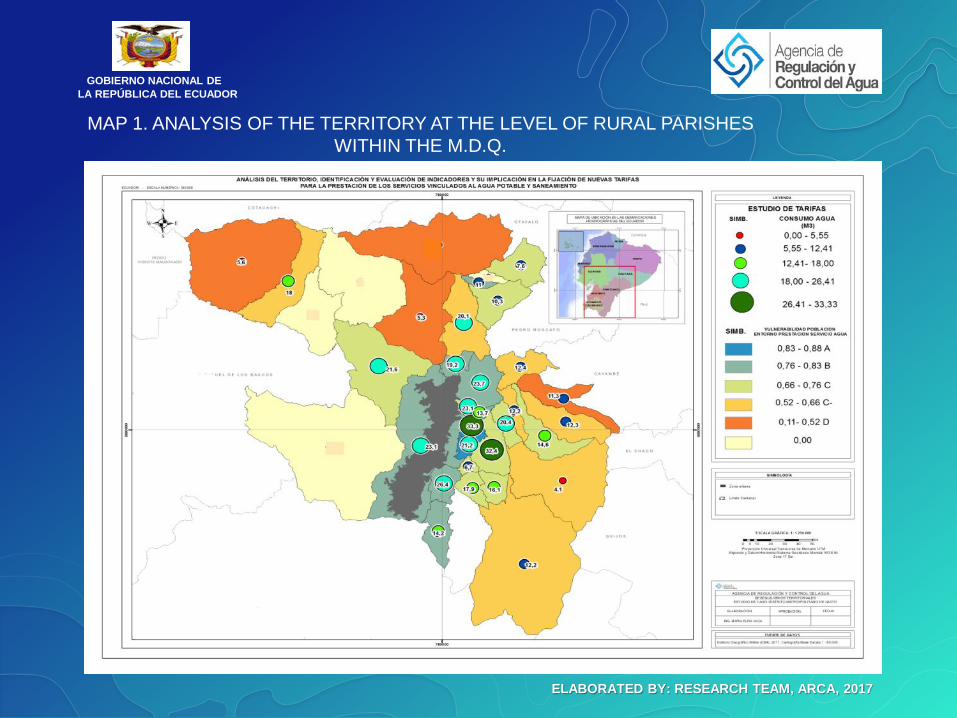
MAP 1. ANALYSIS OF THE TERRITORY AT THE LEVEL OF RURAL PARISHES WITHIN THE M.D.Q.
GOBIERNO NACIONAL DELA REPÚBLICA DEL ECUADOR
ELABORATED BY: RESEARCH TEAM, ARCA, 2017
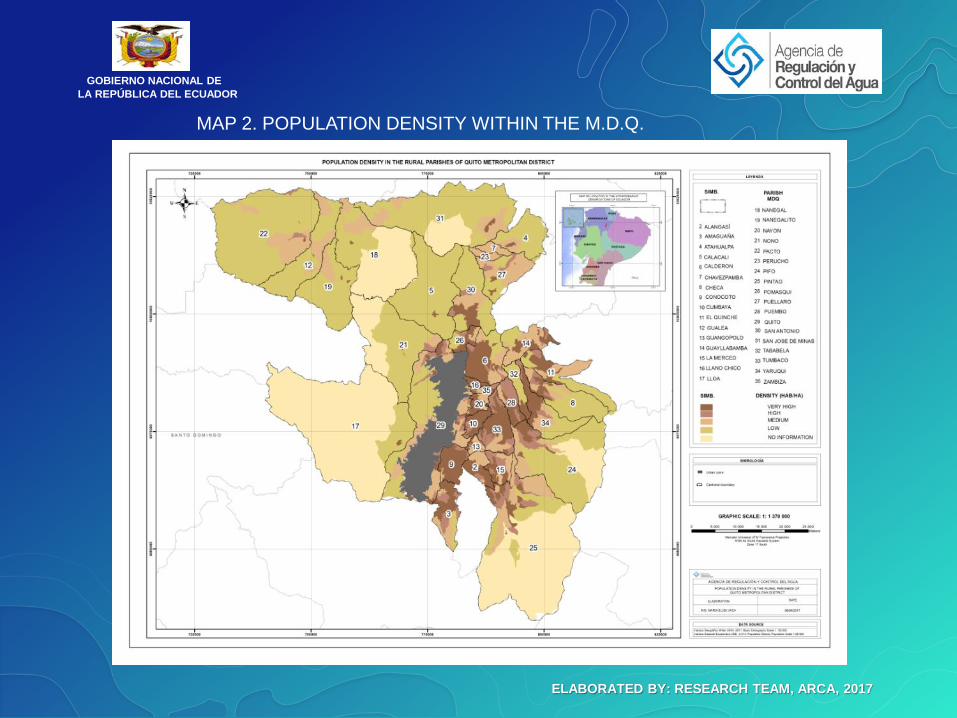
MAP 2. POPULATION DENSITY WITHIN THE M.D.Q.
GOBIERNO NACIONAL DELA REPÚBLICA DEL ECUADOR
ELABORATED BY: RESEARCH TEAM, ARCA, 2017
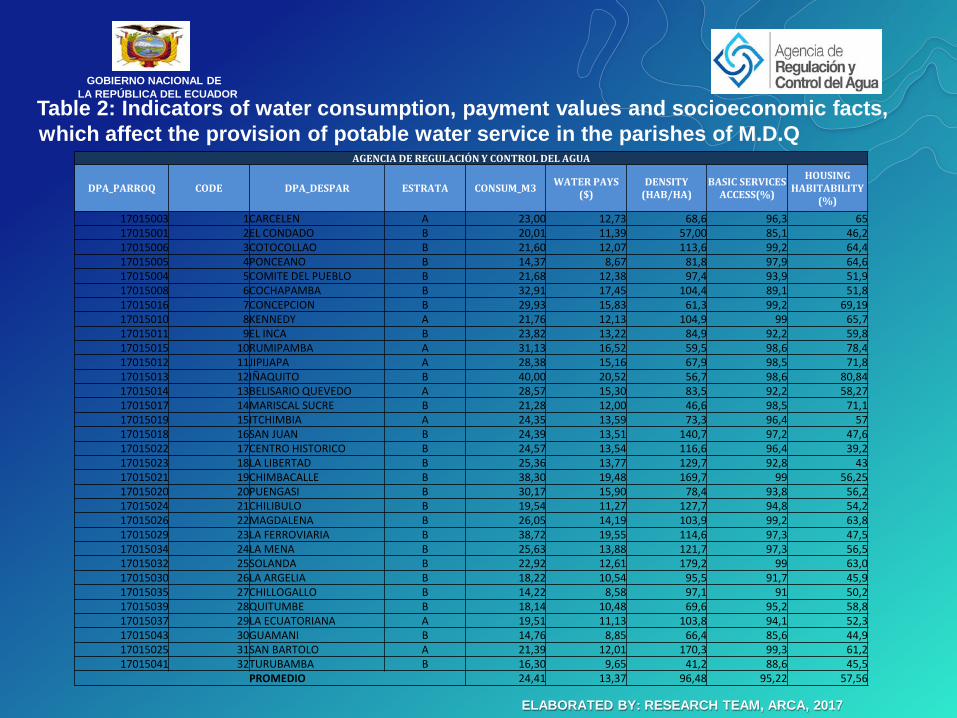
Table 2: Indicators of water consumption, payment values and socioeconomic facts, which affect the provision of potable water service in the parishes of M.D.Q
GOBIERNO NACIONAL DELA REPÚBLICA DEL ECUADOR
ELABORATED BY: RESEARCH TEAM, ARCA, 2017
AGENCIA DE REGULACIÓN Y CONTROL DEL AGUA
DPA_PARROQ CODE DPA_DESPAR ESTRATA CONSUM_M3 WATER PAYS ($)
DENSITY (HAB/HA)
BASIC SERVICES ACCESS(%)
HOUSING HABITABILITY
(%)
17015003 1CARCELEN A 23,00 12,73 68,6 96,3 6517015001 2EL CONDADO B 20,01 11,39 57,00 85,1 46,217015006 3COTOCOLLAO B 21,60 12,07 113,6 99,2 64,417015005 4PONCEANO B 14,37 8,67 81,8 97,9 64,617015004 5COMITE DEL PUEBLO B 21,68 12,38 97,4 93,9 51,917015008 6COCHAPAMBA B 32,91 17,45 104,4 89,1 51,817015016 7CONCEPCION B 29,93 15,83 61,3 99,2 69,1917015010 8KENNEDY A 21,76 12,13 104,9 99 65,717015011 9EL INCA B 23,82 13,22 84,9 92,2 59,817015015 10RUMIPAMBA A 31,13 16,52 59,5 98,6 78,417015012 11JIPIJAPA A 28,38 15,16 67,9 98,5 71,817015013 12IÑAQUITO B 40,00 20,52 56,7 98,6 80,8417015014 13BELISARIO QUEVEDO A 28,57 15,30 83,5 92,2 58,2717015017 14MARISCAL SUCRE B 21,28 12,00 46,6 98,5 71,117015019 15ITCHIMBIA A 24,35 13,59 73,3 96,4 5717015018 16SAN JUAN B 24,39 13,51 140,7 97,2 47,617015022 17CENTRO HISTORICO B 24,57 13,54 116,6 96,4 39,217015023 18LA LIBERTAD B 25,36 13,77 129,7 92,8 4317015021 19CHIMBACALLE B 38,30 19,48 169,7 99 56,2517015020 20PUENGASI B 30,17 15,90 78,4 93,8 56,217015024 21CHILIBULO B 19,54 11,27 127,7 94,8 54,217015026 22MAGDALENA B 26,05 14,19 103,9 99,2 63,817015029 23LA FERROVIARIA B 38,72 19,55 114,6 97,3 47,517015034 24LA MENA B 25,63 13,88 121,7 97,3 56,517015032 25SOLANDA B 22,92 12,61 179,2 99 63,017015030 26LA ARGELIA B 18,22 10,54 95,5 91,7 45,917015035 27CHILLOGALLO B 14,22 8,58 97,1 91 50,217015039 28QUITUMBE B 18,14 10,48 69,6 95,2 58,817015037 29LA ECUATORIANA A 19,51 11,13 103,8 94,1 52,317015043 30GUAMANI B 14,76 8,85 66,4 85,6 44,917015025 31SAN BARTOLO A 21,39 12,01 170,3 99,3 61,217015041 32TURUBAMBA B 16,30 9,65 41,2 88,6 45,5
PROMEDIO 24,41 13,37 96,48 95,22 57,56
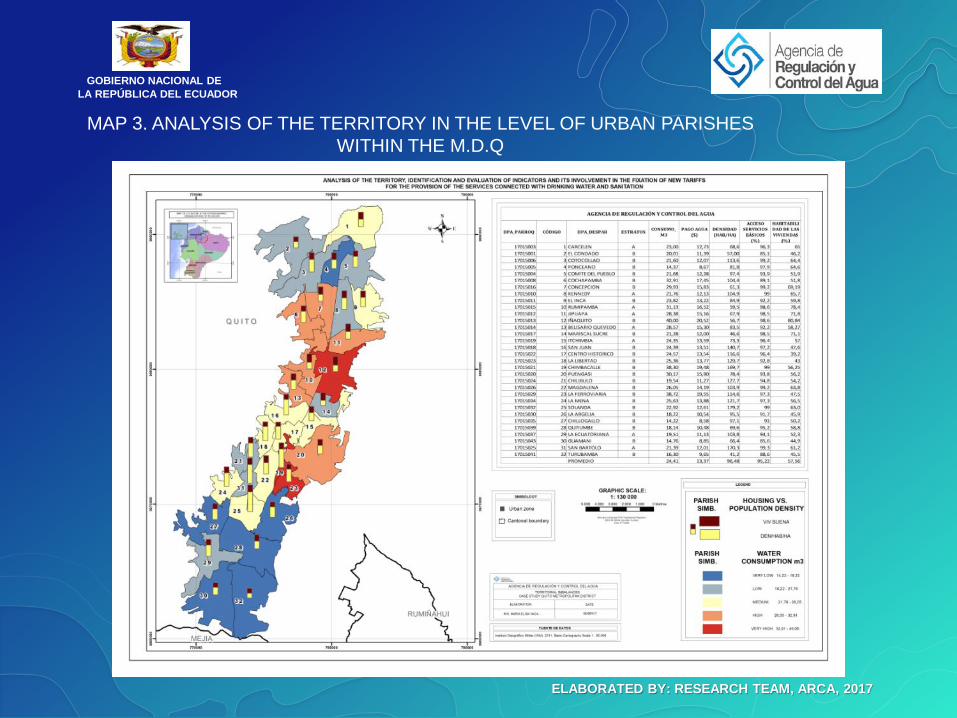
MAP 3. ANALYSIS OF THE TERRITORY IN THE LEVEL OF URBAN PARISHES WITHIN THE M.D.Q
GOBIERNO NACIONAL DELA REPÚBLICA DEL ECUADOR
ELABORATED BY: RESEARCH TEAM, ARCA, 2017

MAP 4. ANALYSIS OF THE TERRITORY, SITUATIONAL PATTERN IDENTIFICATION No.1
GOBIERNO NACIONAL DELA REPÚBLICA DEL ECUADOR
ELABORATED BY: RESEARCH TEAM, ARCA, 2017
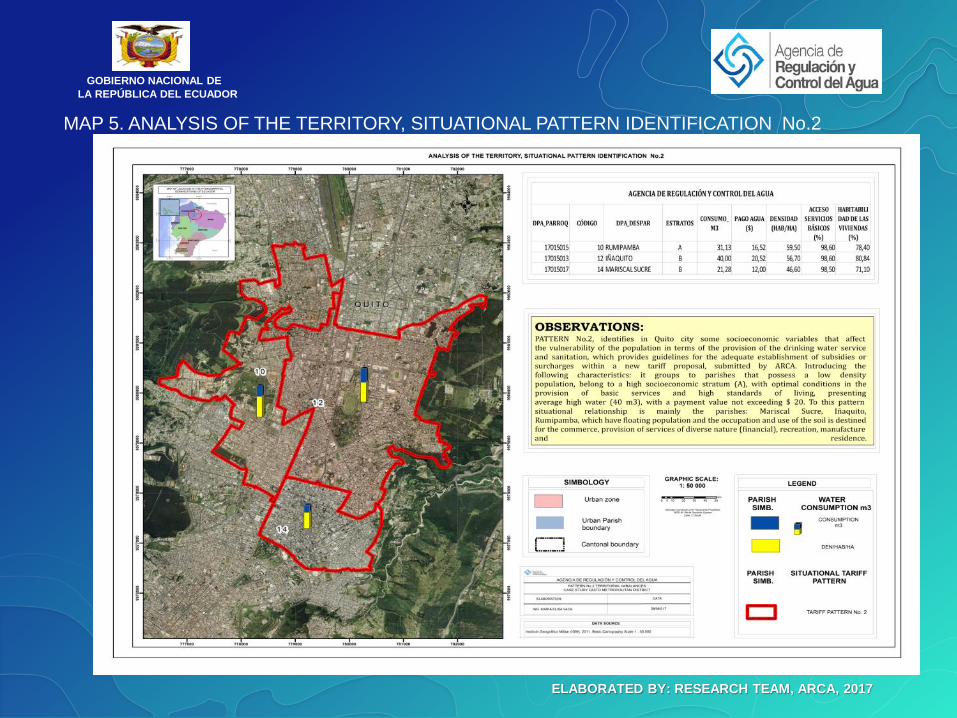
MAP 5. ANALYSIS OF THE TERRITORY, SITUATIONAL PATTERN IDENTIFICATION No.2
GOBIERNO NACIONAL DELA REPÚBLICA DEL ECUADOR
ELABORATED BY: RESEARCH TEAM, ARCA, 2017

Conclusions
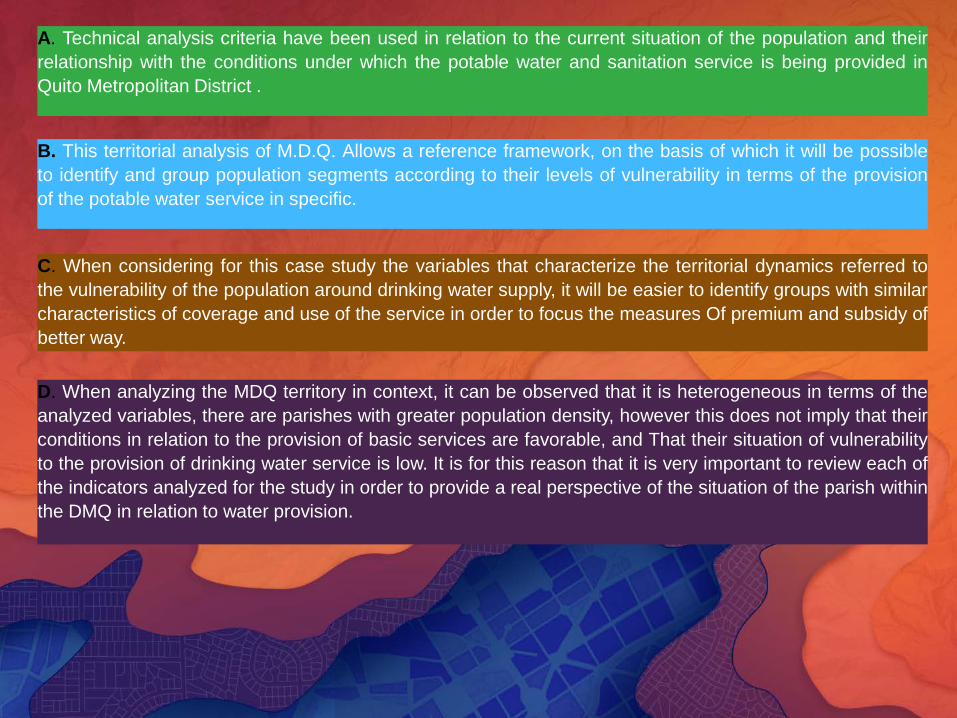
A. Technical analysis criteria have been used in relation to the current situation of the population and theirrelationship with the conditions under which the potable water and sanitation service is being provided inQuito Metropolitan District .
B. This territorial analysis of M.D.Q. Allows a reference framework, on the basis of which it will be possibleto identify and group population segments according to their levels of vulnerability in terms of the provisionof the potable water service in specific.
C. When considering for this case study the variables that characterize the territorial dynamics referred tothe vulnerability of the population around drinking water supply, it will be easier to identify groups with similarcharacteristics of coverage and use of the service in order to focus the measures Of premium and subsidy ofbetter way.
D. When analyzing the MDQ territory in context, it can be observed that it is heterogeneous in terms of theanalyzed variables, there are parishes with greater population density, however this does not imply that theirconditions in relation to the provision of basic services are favorable, and That their situation of vulnerabilityto the provision of drinking water service is low. It is for this reason that it is very important to review each ofthe indicators analyzed for the study in order to provide a real perspective of the situation of the parish withinthe DMQ in relation to water provision.
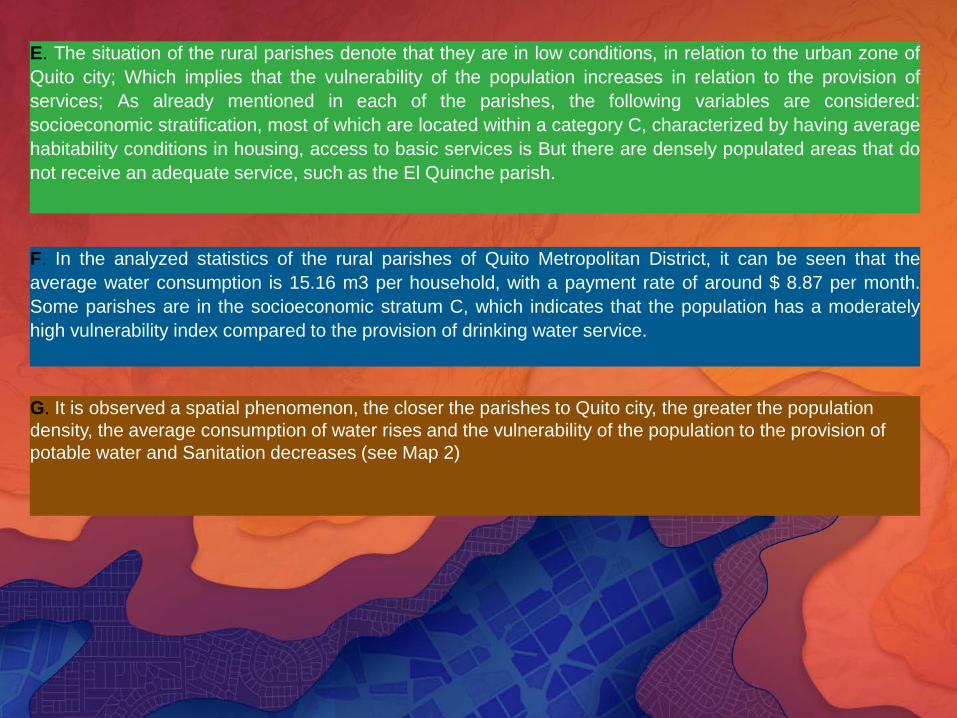
E. The situation of the rural parishes denote that they are in low conditions, in relation to the urban zone ofQuito city; Which implies that the vulnerability of the population increases in relation to the provision ofservices; As already mentioned in each of the parishes, the following variables are considered:socioeconomic stratification, most of which are located within a category C, characterized by having averagehabitability conditions in housing, access to basic services is But there are densely populated areas that donot receive an adequate service, such as the El Quinche parish.
F. In the analyzed statistics of the rural parishes of Quito Metropolitan District, it can be seen that theaverage water consumption is 15.16 m3 per household, with a payment rate of around $ 8.87 per month.Some parishes are in the socioeconomic stratum C, which indicates that the population has a moderatelyhigh vulnerability index compared to the provision of drinking water service.
G. It is observed a spatial phenomenon, the closer the parishes to Quito city, the greater the population density, the average consumption of water rises and the vulnerability of the population to the provision of potable water and Sanitation decreases (see Map 2)

Recommendations
1
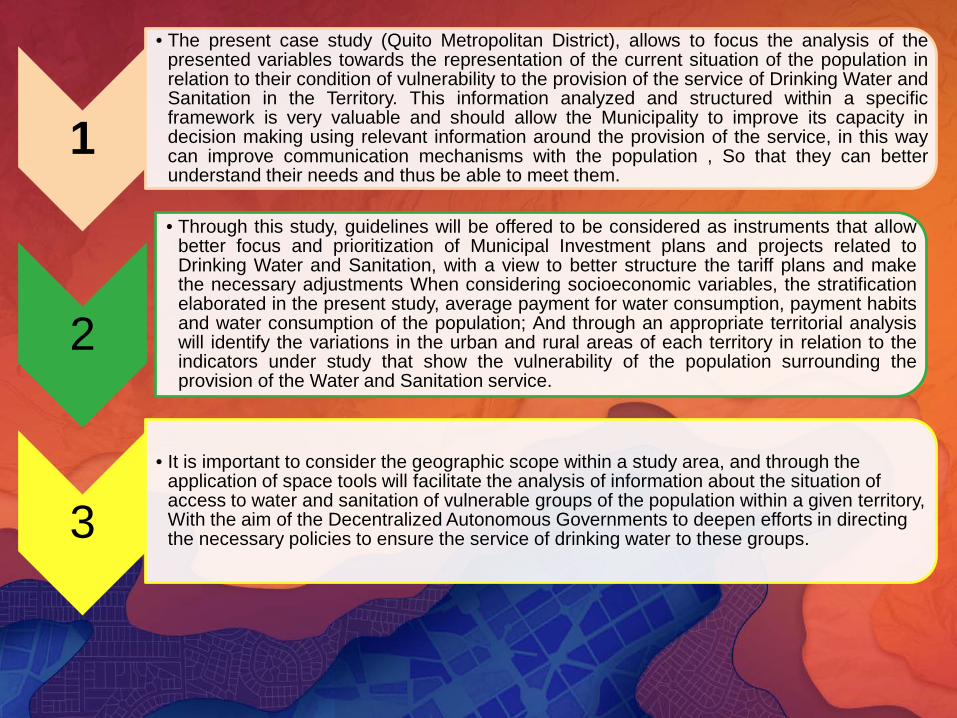
• The present case study (Quito Metropolitan District), allows to focus the analysis of thepresented variables towards the representation of the current situation of the population inrelation to their condition of vulnerability to the provision of the service of Drinking Water andSanitation in the Territory. This information analyzed and structured within a specificframework is very valuable and should allow the Municipality to improve its capacity indecision making using relevant information around the provision of the service, in this waycan improve communication mechanisms with the population , So that they can betterunderstand their needs and thus be able to meet them.
2
• Through this study, guidelines will be offered to be considered as instruments that allowbetter focus and prioritization of Municipal Investment plans and projects related toDrinking Water and Sanitation, with a view to better structure the tariff plans and makethe necessary adjustments When considering socioeconomic variables, the stratificationelaborated in the present study, average payment for water consumption, payment habitsand water consumption of the population; And through an appropriate territorial analysiswill identify the variations in the urban and rural areas of each territory in relation to theindicators under study that show the vulnerability of the population surrounding theprovision of the Water and Sanitation service.
3• It is important to consider the geographic scope within a study area, and through the
application of space tools will facilitate the analysis of information about the situation of access to water and sanitation of vulnerable groups of the population within a given territory, With the aim of the Decentralized Autonomous Governments to deepen efforts in directing the necessary policies to ensure the service of drinking water to these groups.

Header for Demo SlideSupporting Text