Embed Size (px)
Citation preview

University of Southern Queensland
Faculty of Health, Engineering and Sciences
Analysis on the Behaviour of FRP Reinforced
Concrete Railway Sleepers
A dissertation submitted by
Trent Baker
in fulfilment of the requirements of
ENG4111 and 4112 Research Project
towards the degree of
Bachelor of Engineering (Honours) (Civil)
Submitted October, 2016
ii
ABSTRACT
The most commonly used materials for railway sleepers include timber, steel and concrete;
with each of these materials possessing different characteristics that leave them susceptible
to various failure modes. Due to this many sleepers fail before they reach their target design
life, which is estimated to cost the Australian Railway Industry up to $80 million per year,
therefore highlighting the need for a more durable sleeper design. This dissertation assesses
the potential of concrete railway sleepers reinforced glass fibre reinforced polymer (GFRP)
bars as a solution to this problem.
The dissertation involved analysing the current proposed pressure distribution patterns
under the sleeper for varied ballast conditions, to determine which assumed pressure
distribution gave the most critical design forces. With the critical patterns determined the
effect of key sleeper parameters of support modulus and sleeper modulus were then
evaluated. The results indicated that the bearing pressure distribution had a significant
effect on the design forces, while the other parameters’ effects were negligible.
With the critical design forces and corresponding parameters determined the required
reinforcement layout for a narrow gauge concrete sleeper for both steel and GFRP bars
were calculated. A finite element model was then developed for both alternative
reinforcement materials, to compare and evaluate the performance of the new GFRP
reinforced sleeper against a traditional steel reinforced concrete sleeper.
From the results it was concluded that the concrete sleeper reinforced with GFRP bars
performs just as well as the steel reinforced sleeper, but due to the lower modulus of
elasticity for GFRP compared to steel, this design requires a significantly larger percentage
of reinforcement (approximately 50%) to meet serviceability requirements. Therefore,
further work needs to be undertaken to determine if there is an overall cost benefit in
adopting this new design.

iii
University of Southern Queensland
Faculty of Health, Engineering and Sciences
ENG4111/ENG4112 Research Project
Limitations of Use
The Council of the University of Southern Queensland, its Faculty of Health,
Engineering & Sciences, and the staff of the University of Southern Queensland,
do not accept any responsibility for the truth, accuracy or completeness of material
contained within or associated with this dissertation.
Persons using all or any part of this material do so at their own risk, and not at the
risk of the Council of the University of Southern Queensland, its Faculty of Health,
Engineering & Sciences or the staff of the University of Southern Queensland.
This dissertation reports an educational exercise and has no purpose or validity
beyond this exercise. The sole purpose of the course pair entitled “Research
Project” is to contribute to the overall education within the student’s chosen degree
program. This document, the associated hardware, software, drawings, and other
material set out in the associated appendices should not be used for any other
purpose: if they are so used, it is entirely at the risk of the user.
iv
Certification
I certify that the ideas, designs and experimental work, results, analyses and
conclusions set out in this dissertation are entirely my own effort, except where
otherwise indicated and acknowledged.
I further certify that the work is original and has not been previously submitted for
assessment in any other course or institution, except where specifically stated.
Trent Baker
Student Number: 0061046529

v
ACKNOWLEDGEMENTS
I would like to acknowledge the following people:
Dr Allan Manalo for his invaluable guidance and support throughout the preparation of this
dissertation.
Also I would like to thank my family and friends for their ongoing support and
encouragement throughout my studies.
vi
Table of Contents
ABSTRACT ........................................................................................................................ ii
ACKNOWLEDGEMENTS ................................................................................................ v
Table of Contents ............................................................................................................... vi
List of Figures .................................................................................................................... ix
List of Tables ..................................................................................................................... xi
Nomenclature and Acronyms ............................................................................................ xii
CHAPTER 1 INTRODUCTION................................................................................... 1
1.1 Background ......................................................................................................... 1
1.2 Aims and Objectives ........................................................................................... 2
1.3 Expected Outcomes and Benefits ........................................................................ 2
CHAPTER 2 LITERATURE REVIEW ........................................................................ 4
2.1 Background on Railway Sleepers ....................................................................... 4
2.2 Failure Modes of Sleepers ................................................................................... 6
2.2.1 Timber sleeper failure ................................................................................. 7
2.2.2 Steel sleeper failure ..................................................................................... 7
2.2.3 Concrete Sleeper failure .............................................................................. 7
2.3 GFRP Bar Properties ......................................................................................... 10
2.3.1 The general characteristics of FRP Composites ........................................ 10
2.3.2 The performance of GFRP bars in reinforced concrete structures ............ 11
2.4 Design of Sleepers............................................................................................. 12
2.4.1 Rail Seat Load ........................................................................................... 12
2.4.2 Dynamic Coefficient Factor ...................................................................... 15
2.4.3 Bearing Pressure Patterns .......................................................................... 16
2.5 Analytical Solution............................................................................................ 18
2.6 2.6 Summary of research in the area ................................................................. 20
CHAPTER 3 Design and Analysis of Sleepers ........................................................... 23
vii
3.1 Stage 1 Overview .............................................................................................. 23
3.2 Developing the model ....................................................................................... 25
3.2.1 Rail Parameters and Load ......................................................................... 25
3.2.2 Concrete sleeper model parameters ........................................................... 25
3.2.3 Finite Element Model ................................................................................ 26
3.3 Strand7 Model Verification ............................................................................... 28
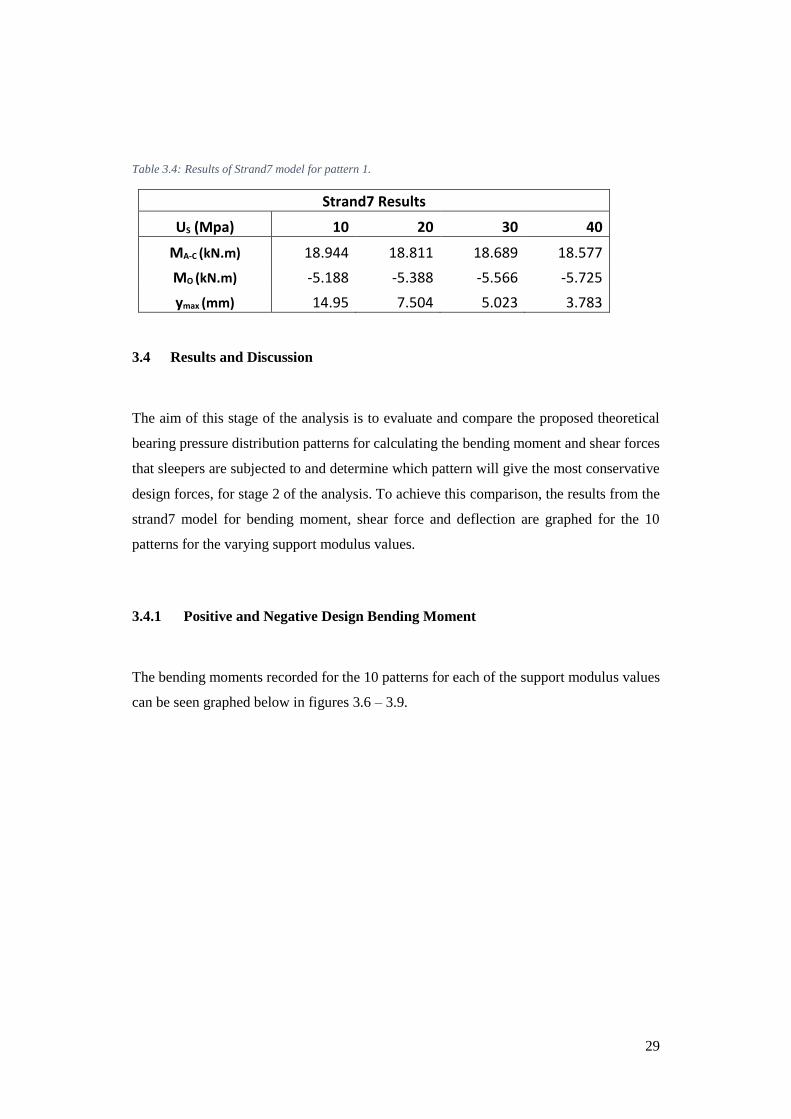
3.4 Results and Discussion ...................................................................................... 29
3.4.1 Positive and Negative Design Bending Moment ...................................... 29
3.4.2 Shear forces ............................................................................................... 35
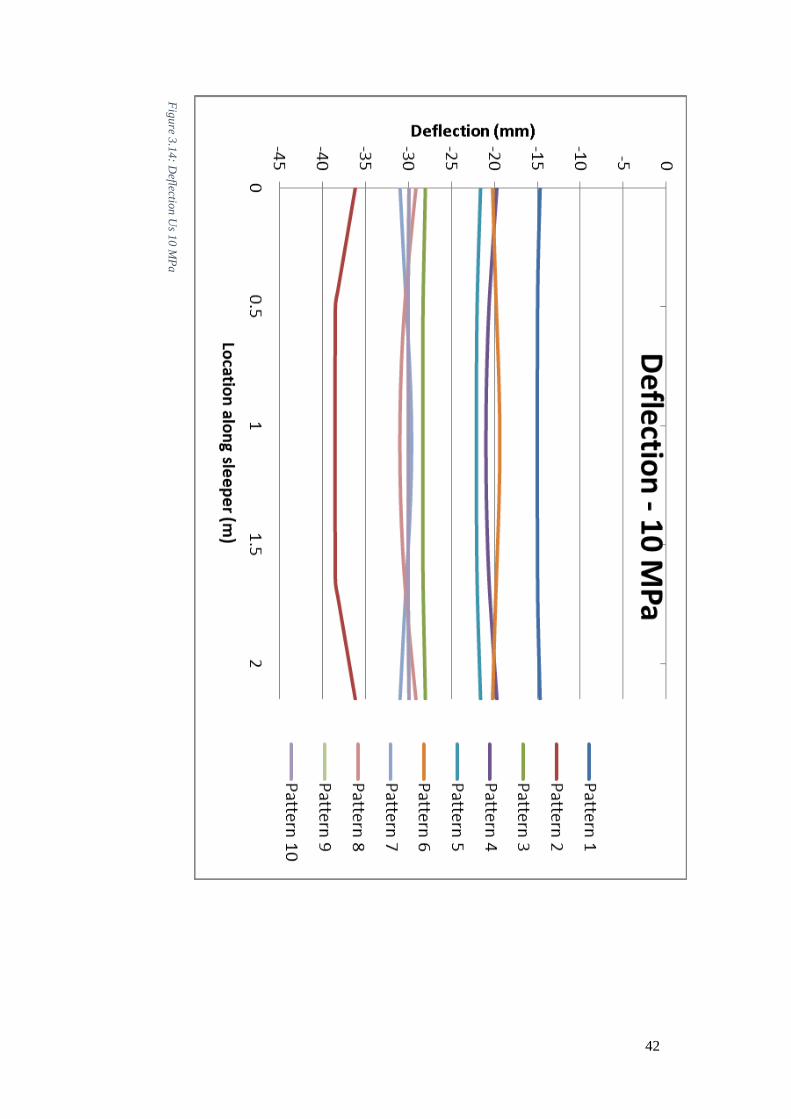
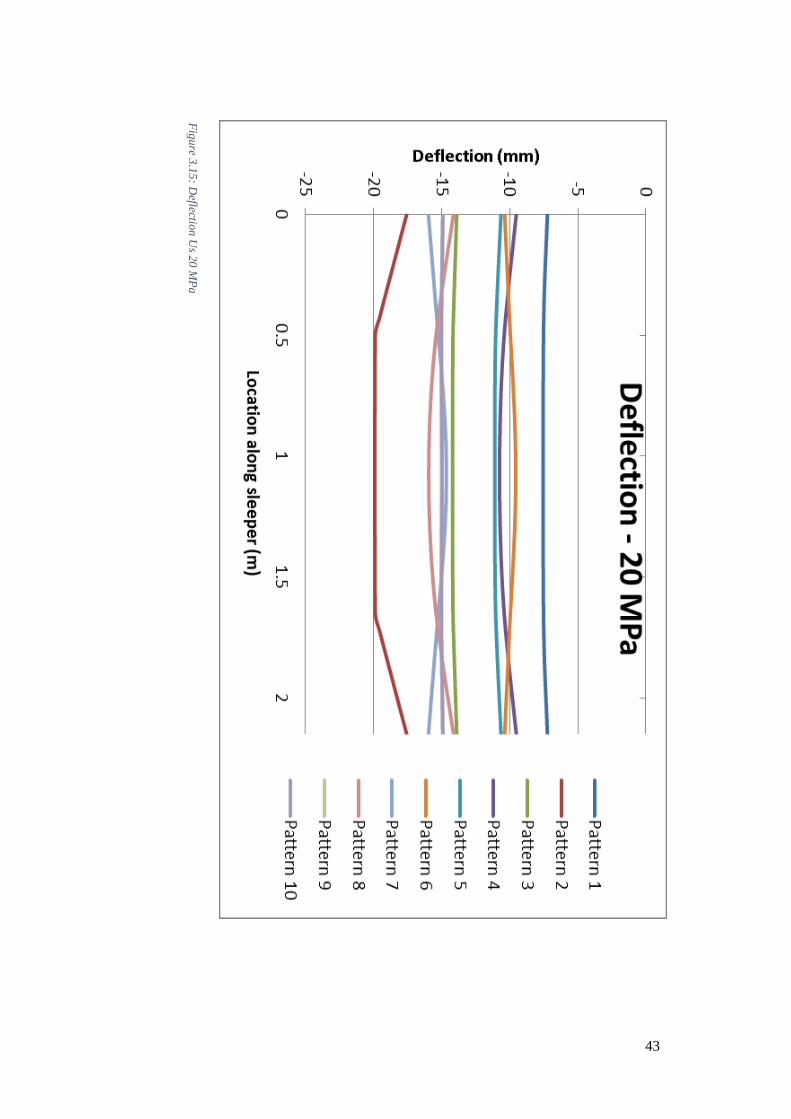
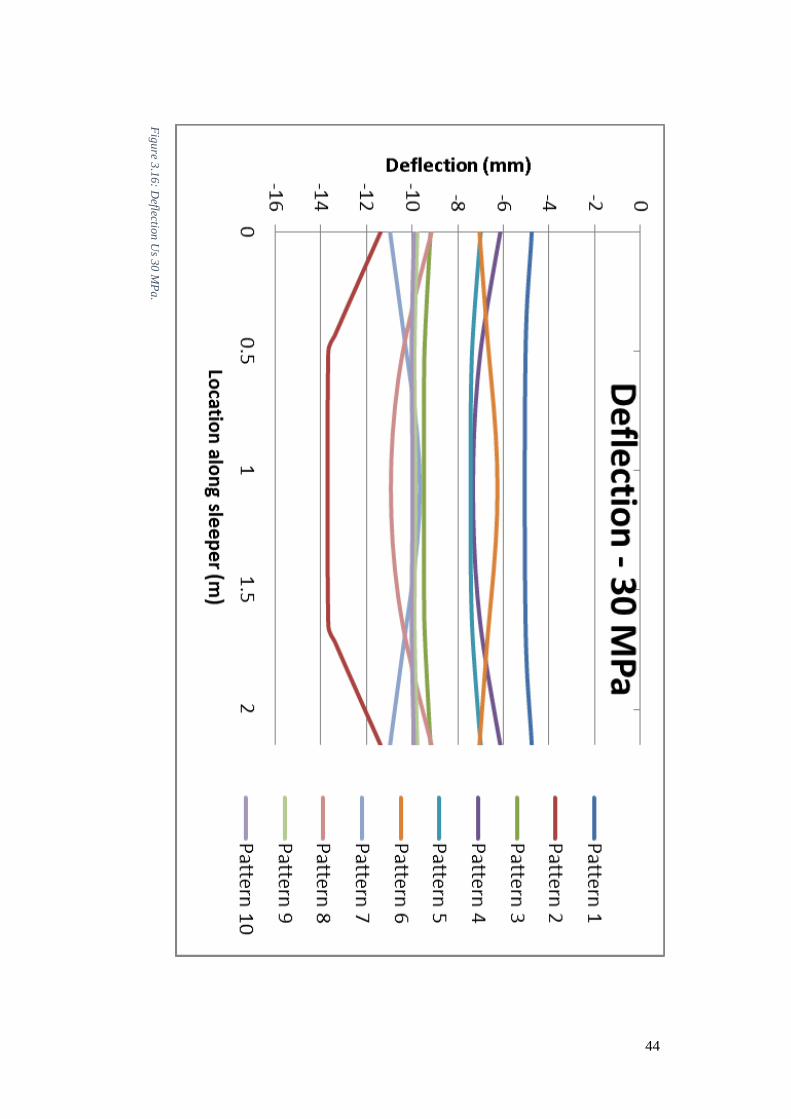
3.4.3 Deflection .................................................................................................. 41
3.5 Conclusion ........................................................................................................ 45
CHAPTER 4 Parametric Study ................................................................................... 47
4.1 Chapter Overview ............................................................................................. 47
4.2 Parameters ......................................................................................................... 47
4.3 Parametric Study Results .................................................................................. 48
4.3.1 Strand7 Results.......................................................................................... 48
4.3.2 Strand 7 Model Verification ...................................................................... 52
4.3.3 Results and Discussion .............................................................................. 53
4.4 Conclusion ........................................................................................................ 54
CHAPTER 5 Evaluation of Behaviour of Concrete Sleeper with GFRP Reinforcement
55
5.1 Chapter Overview ............................................................................................. 55
5.2 Sleeper Parameters ............................................................................................ 55
5.3 Steel Reinforcement Design .............................................................................. 56
5.3.1 Flexural Strength ....................................................................................... 56
5.3.2 Shear Strength ........................................................................................... 59
5.4 GFRP Reinforcement Design ............................................................................ 61
5.4.1 Flexural Strength ....................................................................................... 61
5.5 Finite Element Analysis .................................................................................... 64
viii
5.5.1 Model Development .................................................................................. 64
5.6 Results and Discussion ...................................................................................... 68
5.7 Conclusion ........................................................................................................ 71
CHAPTER 6 Conclusions and Further Work ............................................................. 72
6.1 Conclusion ........................................................................................................ 72
6.2 Future Work ...................................................................................................... 73
Appendix A: Project Specification .................................................................................... 78
ix
List of Figures
Figure 2.1: Typical ballasted track structure (Remennikov and Kaewunruen 2005) .......... 4
Figure 2.2: Delayed ettringite formation (DEF) process (Ferdous and Manalo 2014). ...... 9
Figure 2.3: Alkali-aggregate reaction (AAR) failure (Ferdous and Manalo 2014). ............ 9
Figure 2.4: Axle Load Distribution Factor (AS1085.14, 2012) ........................................ 15
Figure 2.5: A schematic of the sleeper analysed as a beam on elastic foundation (Jeffs and
Tew 1991). ........................................................................................................................ 18
Figure 2.6: Moment in the region A-C (Jeffs and Tew 1991). .......................................... 19
Figure 2.7: Moment at the sleeper centre (Jeffs and Tew 1991). ...................................... 19
Figure 2.8: Maximum deflection of sleeper (Jeffs and Tew, 1991). ................................. 19
Figure 2.9: Proposed distribution of sleeper bearing pressure and bending moment
diagrams (Jeffs and Tew, 1981). ....................................................................................... 21
Figure 2.10: Maximum bending moment for varying parameters (Manalo et.al, 2012). .. 22
Figure 2.11: Vertical deflection and sleeper ballast pressure for varying parameters
(Manalo et.al, 2012). ......................................................................................................... 22
Figure 3.1: 3-D view of the concrete sleeper model. ........................................................ 26
Figure 3.2: Subdivision of the model for pattern 3. .......................................................... 27
Figure 3.3: Subdivision of the model for pattern 2. .......................................................... 27
Figure 3.4: Subdivision of the model for pattern 1. .......................................................... 27
Figure 3.5: Subdivision of the model for pattern 4, 5, 6, 7, 8, 9 and 10........................... 28
Figure 3.6: Bending Moment Diagram Us 10 MPa. ......................................................... 30
Figure 3.7: Bending Moment Diagram Us 20 MPa. ......................................................... 31
Figure 3.8: Bending Moment Diagram Us 30 MPa. ......................................................... 32
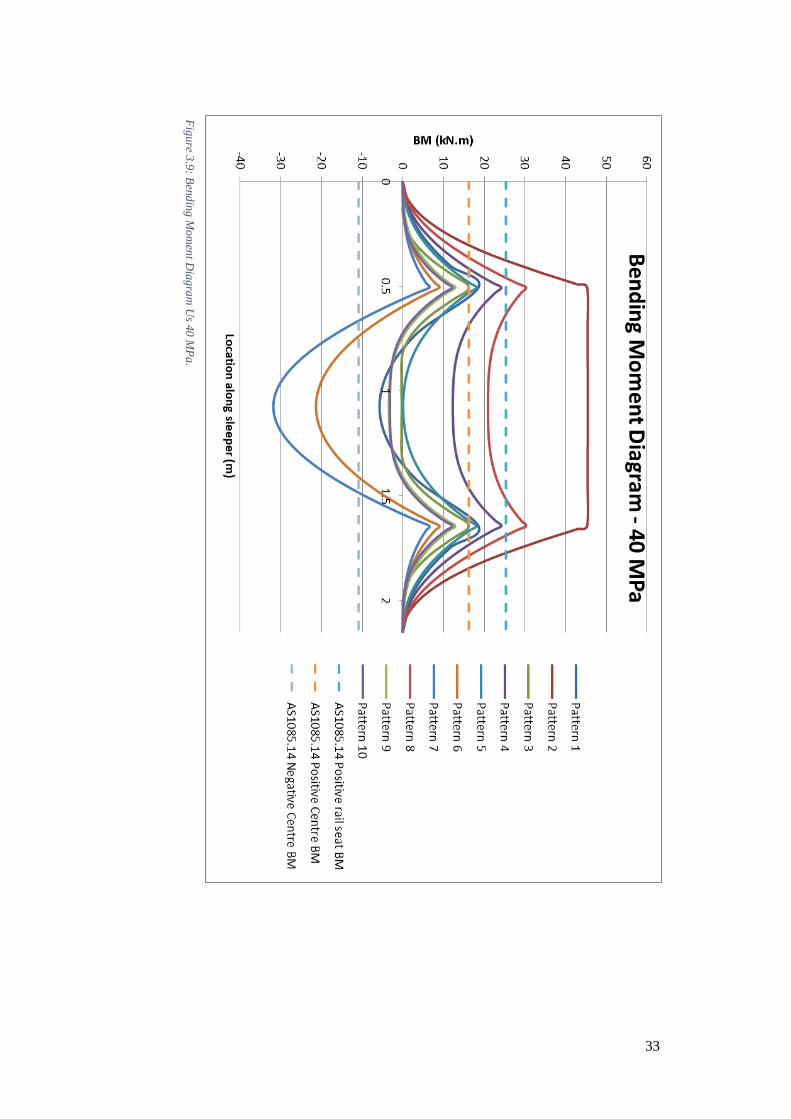
Figure 3.9: Bending Moment Diagram Us 40 MPa. ......................................................... 33
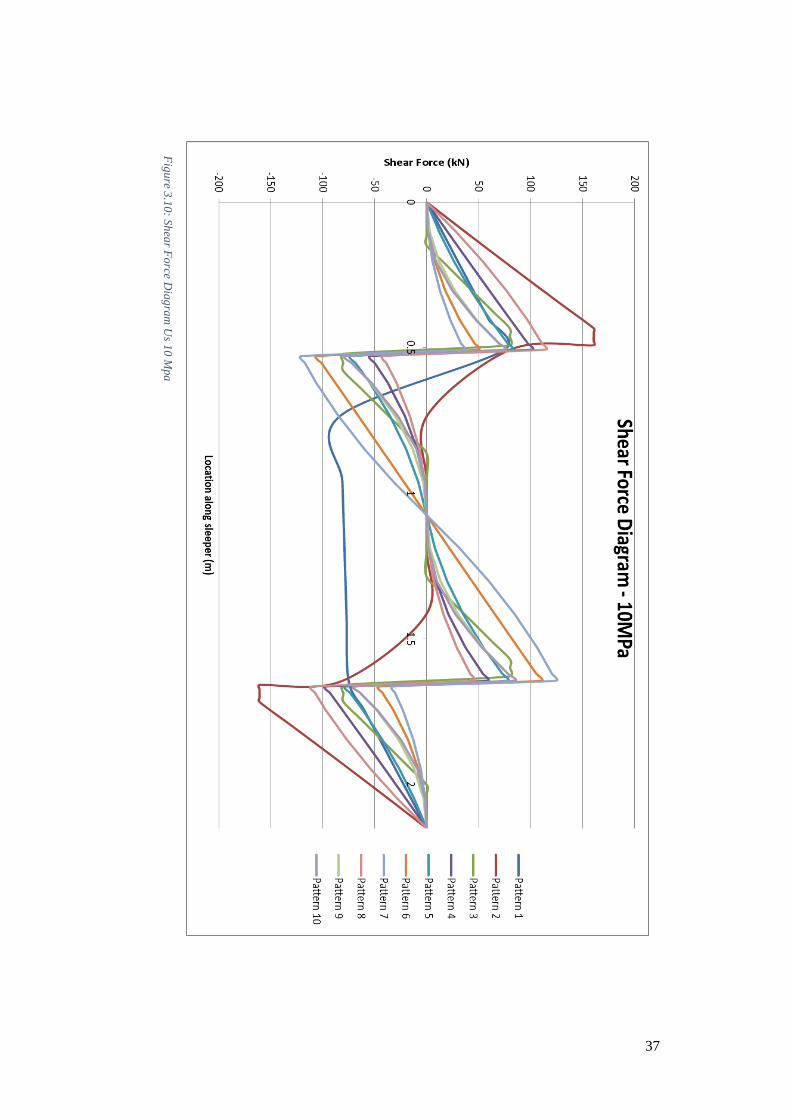
Figure 3.10: Shear Force Diagram Us 10 Mpa ................................................................. 37
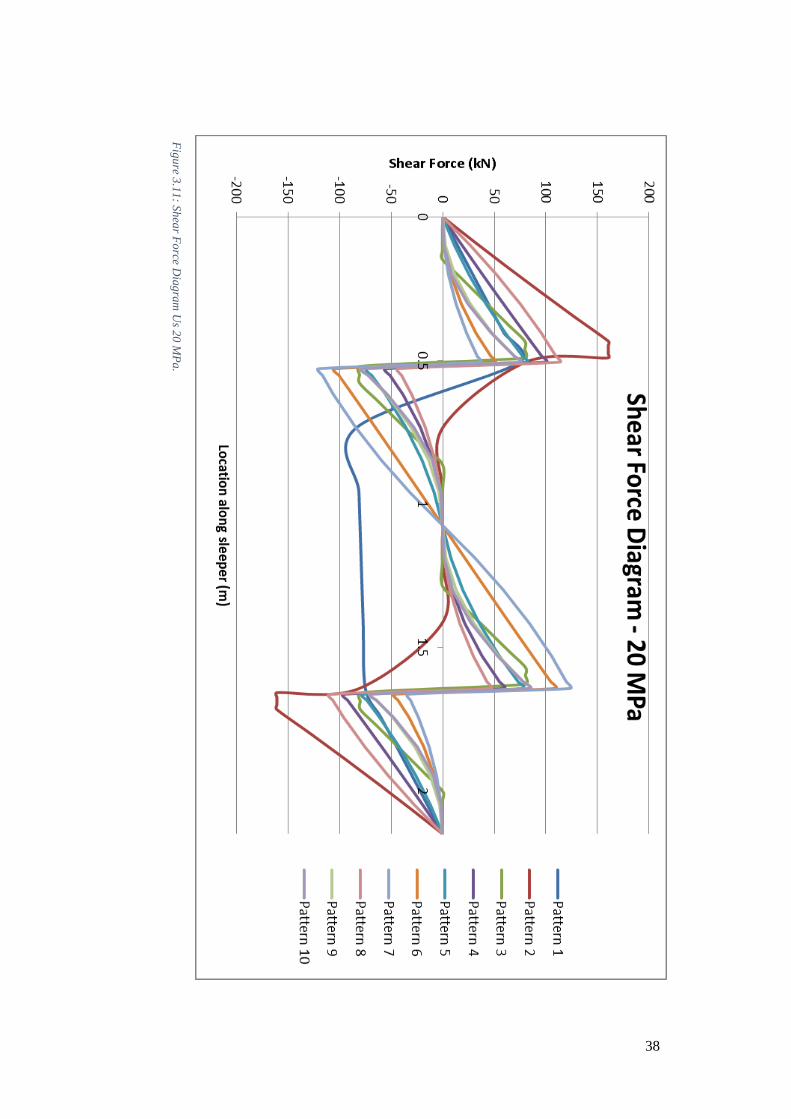
Figure 3.11: Shear Force Diagram Us 20 MPa. ................................................................ 38
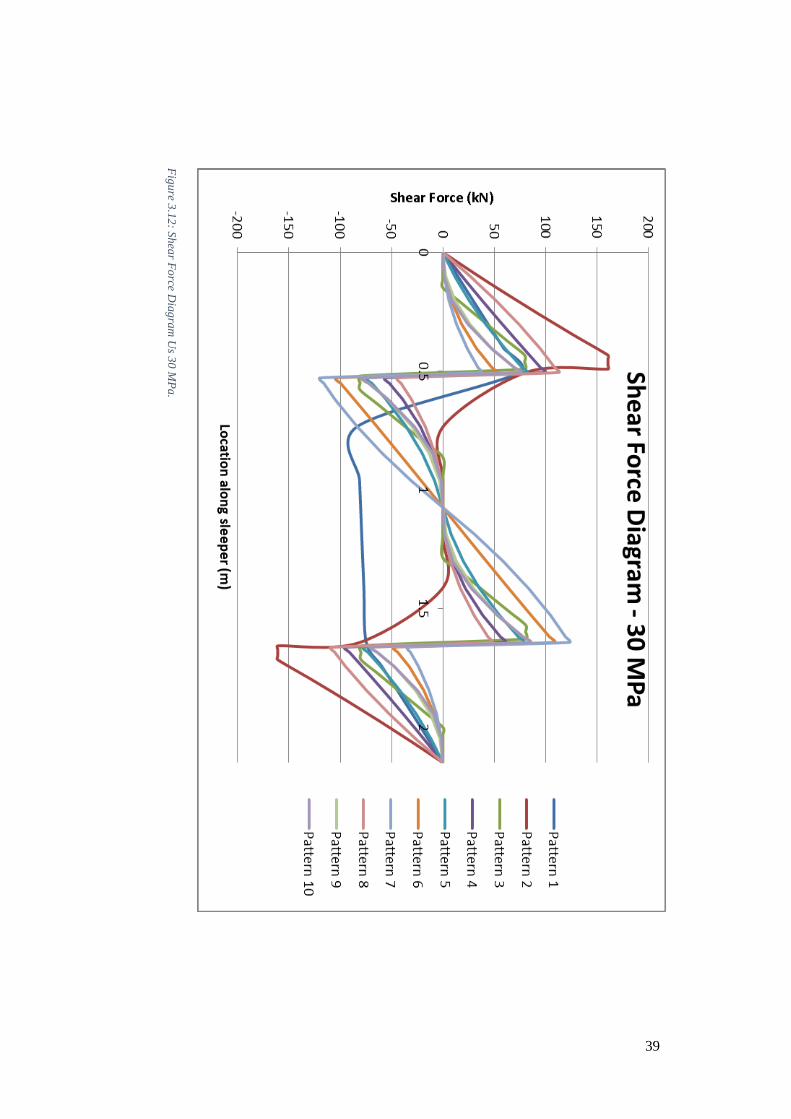
Figure 3.12: Shear Force Diagram Us 30 MPa. ................................................................ 39
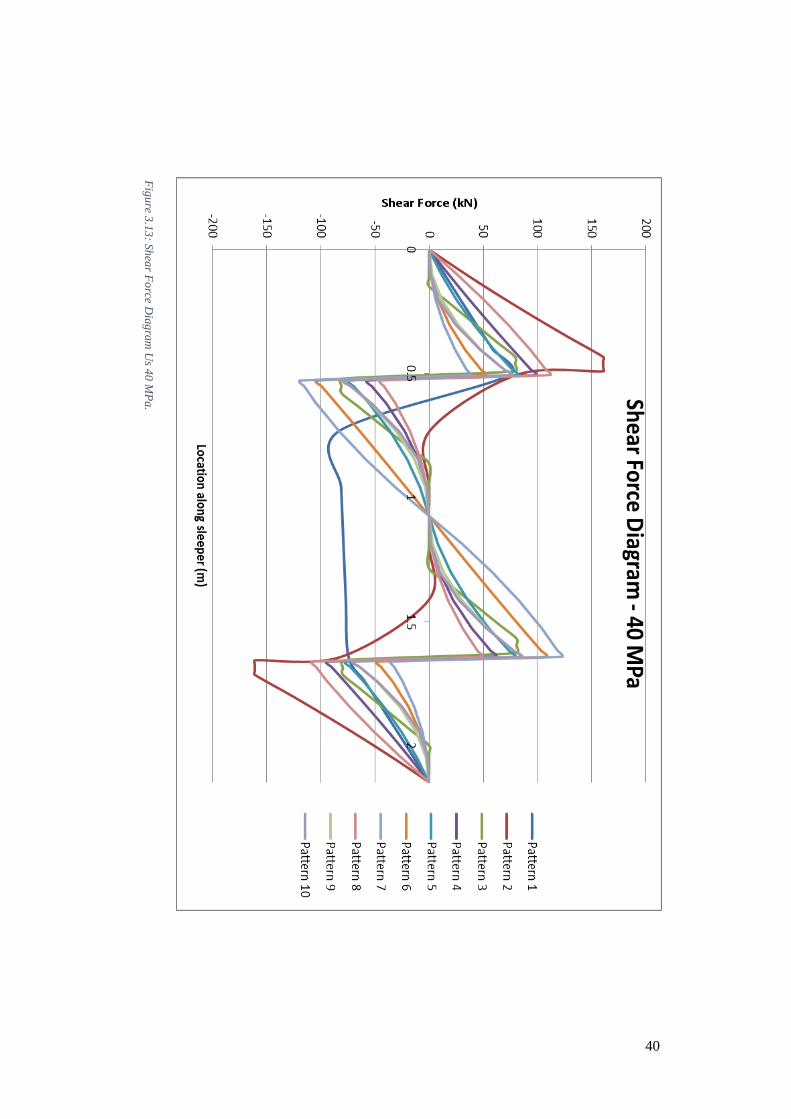
Figure 3.13: Shear Force Diagram Us 40 MPa. ................................................................ 40
Figure 3.14: Deflection Us 10 MPa .................................................................................. 42
Figure 3.15: Deflection Us 20 MPa .................................................................................. 43
Figure 3.16: Deflection Us 30 MPa. ................................................................................. 44
Figure 3.17: Deflection Us 40 MPa. ................................................................................. 45
Figure 5.1: Typical cross section adopted for this analysis. .............................................. 56
Figure 5.2: Stress strain relationship of concrete section due to applied moment. ........... 57
x
Figure 5.3: Steel reinforcement layout. ............................................................................. 60
Figure 5.4: Design of GFRP reinforced structures (Vrodaustralia, 2011). ....................... 61
Figure 5.5: GFRP reinforcement layout. ........................................................................... 63
Figure 5.6: GFRP model with square elements to create reinforcing bar locations. ......... 64
Figure 5.7: GFRP model with reinforcing bar holes created. ........................................... 65
Figure 5.8: Complete plate model for GFRP reinforced sleeper. ...................................... 66
Figure 5.9: Setup model for steel reinforced concrete sleeper. ......................................... 67
Figure 5.10: Load- deflection relationship for alternative sleeper designs. ...................... 68
Figure 5.11: Deformed shape of the GFRP reinforced concrete sleeper. .......................... 69
Figure 5.12: Deformed shape of the steel reinforced concrete sleeper. ............................ 70

xi
List of Tables
Table 2.1: Sleepers used throughout the world’s railway networks (adopted from Ferdous
and Manalo 2014) ............................................................................................................... 6
Table 2.2: Comparison of tensile properties of GFRP and mild steel bars (Tang, Lo and
Balendran, 2008) ............................................................................................................... 12
Table 2.3: Relationships for dynamic coefficient factors. (Sadeghi and Youldashkhan
2005). ................................................................................................................................ 16
Table 2.4: Hypothetical sleeper bearing pressure distributions (Sadeghi and Youldashkhan
2005). ................................................................................................................................ 17
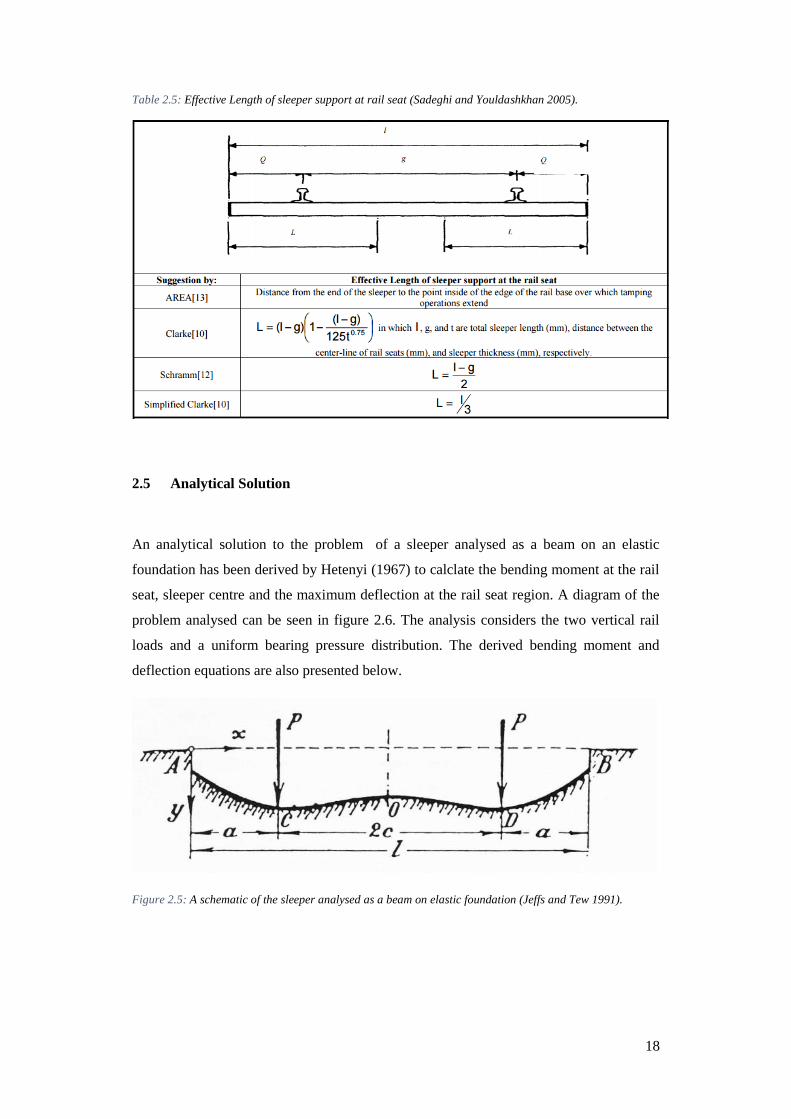
Table 2.5: Effective Length of sleeper support at rail seat (Sadeghi and Youldashkhan
2005). ................................................................................................................................ 18
Table 3.1: Bearing pressure distribution patterns adopted for analysis. ........................... 24
Table 3.2: Properties of the sleeper model. ....................................................................... 26
Table 3.3: Results of Analytical solution for pattern 1. .................................................... 28
Table 3.4: Results of Strand7 model for pattern 1. ........................................................... 29
Table 4.1: Concrete Properties at 28 days (AS3600, 2009). ............................................. 48
Table 4.2: Parametric study values. .................................................................................. 48
Table 4.3: Pattern 1 Strand 7 Results. ............................................................................... 49
Table 4.4: Pattern 2 Strand 7 Results. ............................................................................... 50
Table 4.5: Pattern 7 Strand 7 Results. ............................................................................... 51
Table 4.6: Analytical Results for f’c = 25 MPa. ............................................................... 52
Table 4.7: Analytical results for f’c = 50 MPa. ................................................................. 52
Table 5.1: Bar types and their corresponding yield strength. ............................................ 58
Table 5.2: Required Steel Tensile Reinforcement. ........................................................... 59
Table 5.3: GFRP bar properties (V- ROD, 2012). ............................................................ 62
Table 5.4: Required GFRP Tensile Reinforcement. ......................................................... 63
Table 5.5: Material input properties for Strand 7. ............................................................. 67
xii
Nomenclature and Acronyms
GFRP - Glass Fibre Reinforced Polymer
FRP - Fibre Reinforced Polymer
MPa - Mega Pascals
GPa - Giga Pascals
kN - Kilo-Newton
mm - Millimetres
DEF - Delayed Ettringite Formation
AAR - Alkali-Aggregate Reaction
ROA - Railway of Australia
FEM - Finite Element Model
FEA - Finite Element Analysis
AUD - Australian Dollars
BTM - Bottom

1
CHAPTER 1 INTRODUCTION
1.1 Background
The safety and reliability of railways as a mode of transportation is dependent on the quality
of the railway track system and each of its components, in particular the railway sleepers.
The sleepers are the beams laid underneath the rail tracks, which as explained by Zhao,
Chan and Burrow (2006) serve the function of transferring and distributing the loads of the
rail to the ballast, transversely securing the rails at the correct gauge, resisting cutting and
abrading actions of the bearing plates and the ballast and preventing lateral and longitudinal
movement of the track.
Timber, steel and concrete are the main materials used for railway sleepers, with target life
spans of 20, 50 and 50 years respectively. A large number of these traditional sleepers,
even with perfect support conditions, do not reach their target life due to unexpected failure
modes. It is estimated that the Australian railway industry could reduce its operating cost
by up to $80 million per annum by improving its operation and maintenance procedures
(Ferdous and Manalo, 2014).
While prestressed steel reinforced concrete sleepers possess characteristics that make it
more suitable as a sleeper material compared to timber and steel, this alternative is still
vulnerable to different failure modes. The major failure modes include: rail seat
deterioration, centre-bound damage, derailment, high impact loading, delayed ettringite
formation (DEF), Alkali-Aggregate reaction (AAR), acid attack in concrete, ice forming in
sleepers. These failure modes all lead to cracking of the sleeper and/or deterioration of the
concrete cover which then leaves the sleeper susceptible to bar corrosion and ultimately
early failure.
This highlights the need for a solution to the current sleeper maintenance issue. Therefore,
this research will assess the potential of concrete railway sleepers reinforced with glass
fibre reinforced polymer (GFRP) bars, as a potential solution to this problem.

2
1.2 Aims and Objectives
GFRP bars possess superior corrosion resistant properties and are a light weight alternative
to steel reinforcement. These qualities make concrete sleepers reinforced with GFRP bars
a potential solution to the current railway sleeper maintenance problem being experienced
around the world. As a part of the assessment of the potential of this new design this project
will aim to complete the following tasks:
Research background information on the design and analysis of concrete railway
sleepers.
Compare and evaluate the existing equations and theories for calculating the
maximum positive and negative bending moment and shear forces that the
sleepers are subjected to, using theoretical and Finite Element Modelling (FEM)
analyses.
Perform parametric investigations utilising either theoretical or FEM analysis to
determine the effect of important design parameters on the behaviour of precast
concrete sleepers and evaluate against the performance requirements for a
Queensland precast concrete railway sleeper.
Evaluate the structural behaviour of the precast concrete sleeper reinforced with
GFRP bars and compare with the performance of an existing precast concrete
sleeper reinforced with steel reinforcement, using FEM simulation.
The scope of this undergraduate project restricts the analysis of the new concrete sleeper to
only the basic structural behaviour of the design, including load-deflection, flexural and
shear strength. Due to the nature of the project and time and resource limitations other
characteristics of the design such as its durability and the effects of temperature and fatigue
due to the cyclic loading on the sleeper were not considered.
1.3 Expected Outcomes and Benefits
Although GFRP reinforced concrete structures are becoming more common in the
construction industry, this reinforcing technology is yet to be applied to concrete railway
sleepers. Therefore, this project is being undertaken to investigate the potential of pre cast
concrete railway sleepers reinforced with GFRP bars. The success of this design could

3
potentially provide a solution to the timber sleeper replacement issues currently being
experienced by the railway industries.
The expected outcomes of the project are:
To determine equations/theories that can accurately calculate the bending moment
and shear force that the concrete sleepers reinforced with GFRP bars will be
subjected to.
To determine which sleeper bearing pressure distribution most accurately
represents the current methods employed by the Australian prestressed concrete
sleeper standard.
To determine the effects of concrete strength and arrangement of GFRP bars on
the structural behaviour of the sleeper.
A comparison between the performance of the proposed new design and existing
steel reinforced concrete sleepers.
The information determined from this project could highlight the potential for further
research on this topic. Successful development of this sleeper design could provide benefits
for railway industries all around the world.
4
CHAPTER 2 LITERATURE REVIEW
2.1 Background on Railway Sleepers
Rail plays an important role in the transportation of both people and products around the
world, with many industries, especially the Australian mining industry heavily relying on
this form of transportation. It is reported that in 1998 the Australian railway industry spent
approximately 25-35 percent of its annual budget on track maintenance with sleeper
replacement accounting for a significant portion of this (Remennikov and Kaewunruen
2005). This highlights the fact that there needs to be improvements made in certain aspects
of the design of sleepers in particular durability.
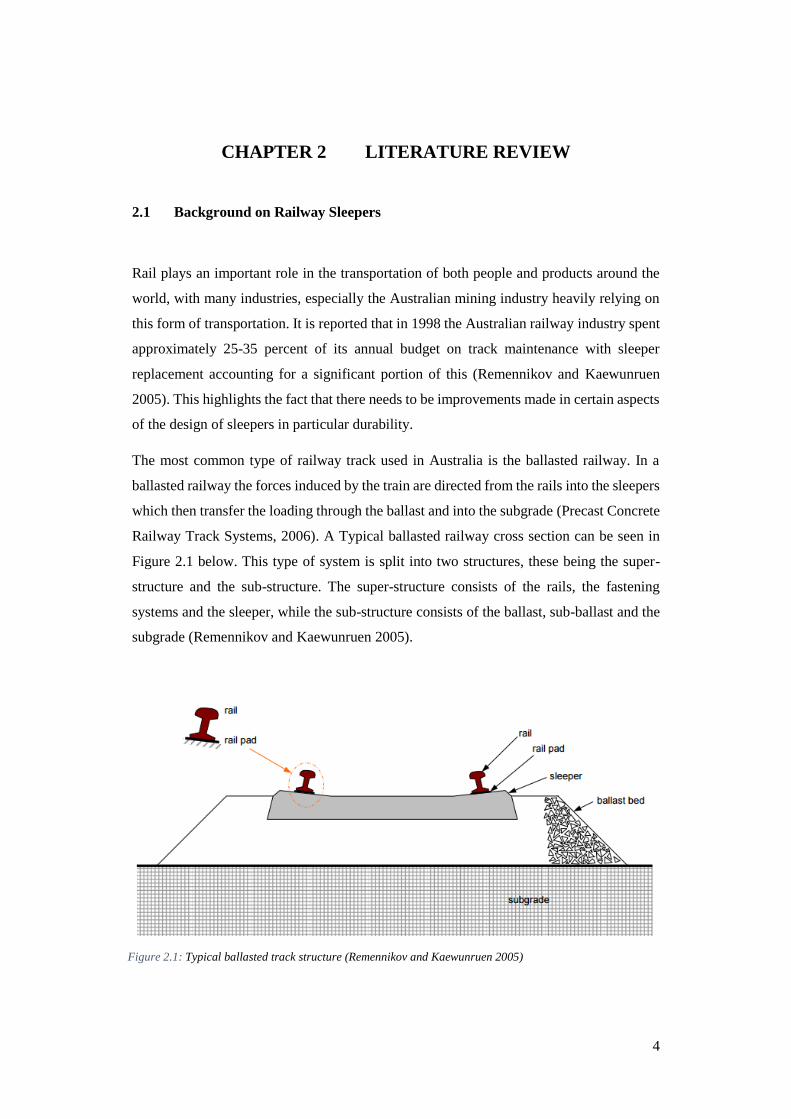
The most common type of railway track used in Australia is the ballasted railway. In a
ballasted railway the forces induced by the train are directed from the rails into the sleepers
which then transfer the loading through the ballast and into the subgrade (Precast Concrete
Railway Track Systems, 2006). A Typical ballasted railway cross section can be seen in
Figure 2.1 below. This type of system is split into two structures, these being the super-
structure and the sub-structure. The super-structure consists of the rails, the fastening
systems and the sleeper, while the sub-structure consists of the ballast, sub-ballast and the
subgrade (Remennikov and Kaewunruen 2005).
Figure 2.1: Typical ballasted track structure (Remennikov and Kaewunruen 2005)

5
Some of the advantages of ballasted track compared to non-ballasted track include (Precast
Concrete Railway Track Systems, 2006):
Lower initial construction costs.
Lower noise levels due to the ballast absorbing some noise.
Lower difficulty and cost to repair track damage.
Shorter construction time.
As can be seen from figure 2.1 the sleepers are transverse structural members which are
placed on top of the ballast and support the rails. As explained by Remennikov and
Kaewunruen (2005), railway sleepers were initially made from timber and then from steel
for limited applications and now the majority of sleepers used in Australian railway tracks
are made of prestressed concrete. Jeffs and Tew (1991) highlighted in their research that in
1986 Australia had approximately 77 million sleepers making up the countries 49,000 km
of railway track, with 84% of these sleepers made of timber, 15% from concrete and 1%
made of steel. At this time the number of sleepers being replaced each year was around
3,000,000 timber, 500,000 concrete and 250,000 steel sleepers (Hansard, 1988). Due to the
large increase in the popularity of concrete sleepers in Australian railway track since this
time it is reasonable to assume that the number of concrete sleepers being replaced each
year would be in the millions.
As adapted from Remennikov and Kaewunruen (2005) the main functions of the sleepers
are to:
Support and restrain the rail
Transfer loads from the rail to the supporting ballast
Maintain the rail gauge and inclination
Withstand lateral, longitudinal and vertical rail movements
Maintain resistance to wearing and loading throughout changes in temperature
and weather conditions
6
The type of sleeper considered in this project will be a mono block concrete sleeper.
Concrete sleepers come in two main types – reinforced twin block sleepers and prestressed
mono block sleepers. Twin block sleepers are commonly used around the world on standard
lines for 25tonne axle loads up to speeds of 200km/hr while mono block sleepers are used
throughout the world for all types of rail lines, especially heavy haul lines with axle loads
of up to 35 tonnes (Precast Concrete Railway Track Systems, 2006).
2.2 Failure Modes of Sleepers
Due to the decreasing availability of natural resources for production of new sleepers and
the increasing costs involved with replacement of sleepers, it is clear that the failure
mechanisms of sleepers need to be understood and alternative designs developed. It has
been reported that the Australian railway industry could potentially save $80 million AUD
in annual expenses by improving on the current railway operation and maintenance
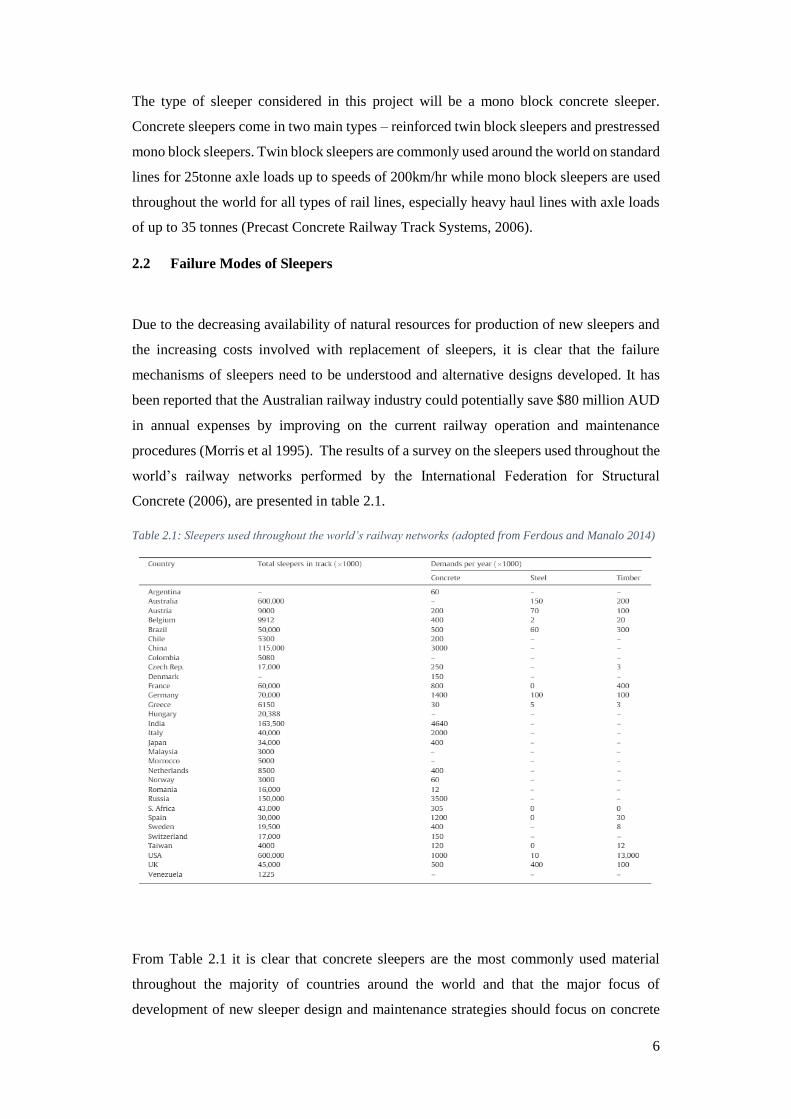
procedures (Morris et al 1995). The results of a survey on the sleepers used throughout the
world’s railway networks performed by the International Federation for Structural
Concrete (2006), are presented in table 2.1.
Table 2.1: Sleepers used throughout the world’s railway networks (adopted from Ferdous and Manalo 2014)
From Table 2.1 it is clear that concrete sleepers are the most commonly used material
throughout the majority of countries around the world and that the major focus of
development of new sleeper design and maintenance strategies should focus on concrete
7
sleeper failure mechanisms. This is supported by Palomo et al (2007), who reported that
there are over 400 million concrete sleepers throughout the world’s railway networks, with
2 – 5% needing replacement each year. Due to these findings this section will only briefly
cover timber and steel failure mechanisms and focus in detail on concrete sleepers.
2.2.1 Timber sleeper failure
There are number of different causes of failure in timber sleepers, with some more common
than others depending on the loading set up and the surrounding environmental conditions.
As explained by Ferdous and Manalo (2014), the Railway of Australia (ROA) (1991)
performed a survey on 2200 timber sleepers in Queensland Railway tracks to identify the
main cause of damage to the timber sleepers. The results of this survey showed that there
were a number of different causes of damage including fungal decay, end splitting, termites,
still sound, sapwood, shelling, rail cut, weathering, spike kill and knots. From the survey it
was found that fungal decay, end splitting and termite attacks were the most encountered
causes of damage with 53%, 10%, 7% of the overall damage modes respectively.
2.2.2 Steel sleeper failure
Steel has a number of characteristics which make it problematic as a sleeper material; hence
there has been limited application of steel sleepers in mainline railway tracks throughout
the world. These characteristics identified by Ferdous and Manalo (2014), include the high
risk of corrosion, high electrical conductivity, fatigue cracking and due to the difficulties
that arise in trying to pack steel sleepers with ballast. It was explained in this study that
corrosion in steel sleepers can occur due to the contact with salty elements which can come
from soil, groundwater and aggregates while fatigue cracking can occur as a result of the
cyclic loading at the rail seat due to the passing train.
2.2.3 Concrete Sleeper failure
While concrete has many characteristics that make it more suitable for use as a sleeper
material compared to steel and timber, it is still vulnerable to different types of failure. The
main types of failure that occur are rail seat deterioration, Centre-bound damage,
derailment, high-impact loading, delayed ettringite formation (DEF), Alkali- aggregate
reaction (AAR), acid attack in concrete, bar corrosion and ice forming in the sleeper.
Rail seat deterioration is the most commonly occurring failure mode for concrete sleepers
for many different countries around the world (Ferdous and Manalo 2014). According to
8
Bakharev and Struble (1997) this type of failure is generally caused by rail-seat abrasion
but can also be due to hydro abrasive erosion, hydraulic pressure cracking, freeze thaw
cracking or chemical deterioration.
Centre-bound damage occurs due to heavy loading causing tensile fractures in the sleeper.
Studies by González-Nicieza et al (2008) and Rezaie et al (2012) both report on clear
examples of centre-bound damage, with the former finding failure by vertical cracking
caused by tensile cracking and the latter finding longitudinal cracking caused by tensile
fracture.
As reported by Ferdous and Manalo (2014) derailment is caused by defects in the sleepers
which generally occur throughout the operational stages due to manpower faults and
defects in the track. This is considered the worst case of failure as derailment can cause
series harm or loss of life and requires expensive repair work before the track can be
reopened.
The next common concrete sleeper failure mode is due to High-impact loading. This high-
impact loading is caused by either wheel flats or dipped rails, which is not considered in
current design methods. This high loading can therefore induce loads higher than were
considered for the design and can cause cracking of the sleeper, generally at the sleeper
centre (Ferdous and Manalo 2014).
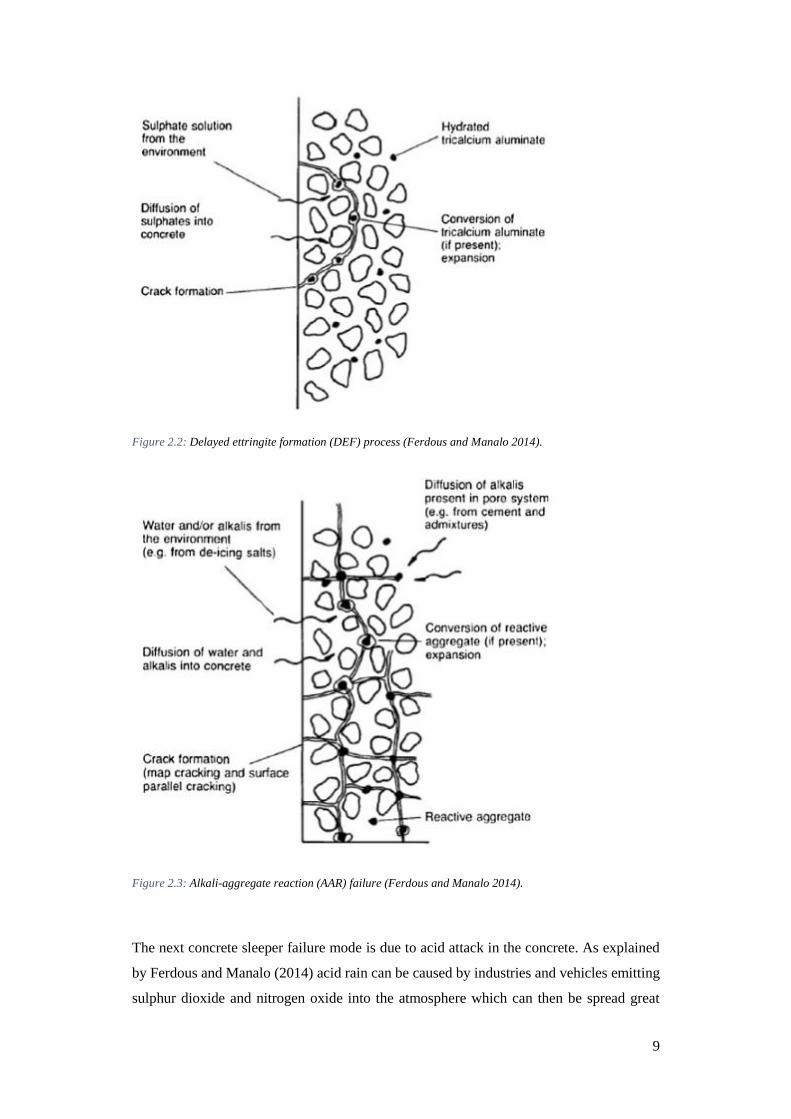
Delayed ettringite formation is another type of failure mode that can cause concrete railway
sleepers to fail before they reach their intended design life. This type of failure occurs when
either soil, groundwater or aggregates containing sulfates of sodium, potassium,
magnesium and calcium react with the tricalcium aluminate or calcium hydroxide in the
cement paste causing expansion and eventually cracking of the concrete which can lead to
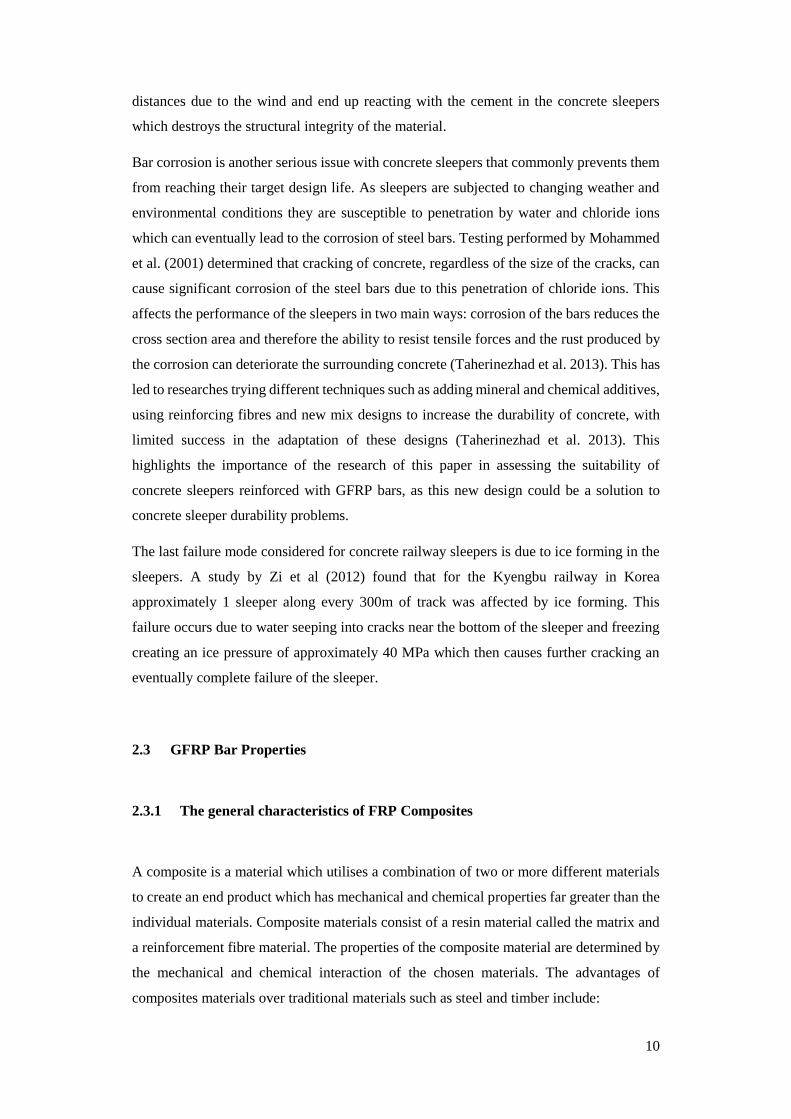
complete failure (Narayanan and Beeby 2005 and Neville 2012). The next failure mode
Alkali-aggregate reaction is a similar process as DEF except in this case alkalis diffuse into
the concrete and react with the aggregate in the concrete and cause expansion and cracking
leading to complete failure (Thomas Telford 1992). These processes are displayed in
figures 2.2 and 2.3.
9
Figure 2.2: Delayed ettringite formation (DEF) process (Ferdous and Manalo 2014).
Figure 2.3: Alkali-aggregate reaction (AAR) failure (Ferdous and Manalo 2014).
The next concrete sleeper failure mode is due to acid attack in the concrete. As explained
by Ferdous and Manalo (2014) acid rain can be caused by industries and vehicles emitting
sulphur dioxide and nitrogen oxide into the atmosphere which can then be spread great
10
distances due to the wind and end up reacting with the cement in the concrete sleepers
which destroys the structural integrity of the material.
Bar corrosion is another serious issue with concrete sleepers that commonly prevents them
from reaching their target design life. As sleepers are subjected to changing weather and
environmental conditions they are susceptible to penetration by water and chloride ions
which can eventually lead to the corrosion of steel bars. Testing performed by Mohammed
et al. (2001) determined that cracking of concrete, regardless of the size of the cracks, can
cause significant corrosion of the steel bars due to this penetration of chloride ions. This
affects the performance of the sleepers in two main ways: corrosion of the bars reduces the
cross section area and therefore the ability to resist tensile forces and the rust produced by
the corrosion can deteriorate the surrounding concrete (Taherinezhad et al. 2013). This has
led to researches trying different techniques such as adding mineral and chemical additives,
using reinforcing fibres and new mix designs to increase the durability of concrete, with
limited success in the adaptation of these designs (Taherinezhad et al. 2013). This
highlights the importance of the research of this paper in assessing the suitability of
concrete sleepers reinforced with GFRP bars, as this new design could be a solution to
concrete sleeper durability problems.
The last failure mode considered for concrete railway sleepers is due to ice forming in the
sleepers. A study by Zi et al (2012) found that for the Kyengbu railway in Korea
approximately 1 sleeper along every 300m of track was affected by ice forming. This
failure occurs due to water seeping into cracks near the bottom of the sleeper and freezing
creating an ice pressure of approximately 40 MPa which then causes further cracking an
eventually complete failure of the sleeper.
2.3 GFRP Bar Properties
2.3.1 The general characteristics of FRP Composites
A composite is a material which utilises a combination of two or more different materials
to create an end product which has mechanical and chemical properties far greater than the
individual materials. Composite materials consist of a resin material called the matrix and
a reinforcement fibre material. The properties of the composite material are determined by
the mechanical and chemical interaction of the chosen materials. The advantages of
composites materials over traditional materials such as steel and timber include:
11
Corrosion resistance
High strength/low weight
Dimensional stability
Excellent electrical properties and low moisture absorption
There are many different types of fibres used in composites with each fibre being classified
as either a synthetic or natural fibre. The most commonly used synthetic fibres include
glass (E-glass most common glass fibre) which is strong and possesses high heat resistance
and electrical properties, and carbon which is light weight and has a very high strength and
a modulus of elasticity that can match that of steel. Another synthetic fibre regularly used
is Aramid which has a high strength and low density and is used in high impact
applications. The most commonly used natural fibres include Sisal, Hemp and Flax which
are limited in application due to their low strength and susceptibility to moisture and high
humidity (Molded Fibre Glass Companies).
For composite materials used for structural applications thermoset resins are used for the
matrix material. The most common types of thermoset resins are Polyesters, Vinylesters,
Epoxies and Polyurethanes. Polyesters provide low cost, a balance of good mechanical,
chemical and electrical properties and have good dimensional stability. Vinylesters possess
chemical resistance and strength and properties. While Epoxies are more expensive, they
possess excellent adhesion properties, heat resistance capabilities and higher fatigue
properties. The last commonly used thermoset resin Polyurethane possesses high toughness
and elongation properties and has faster curing times than other resins (Molded Fibre Glass
Companies).
2.3.2 The performance of GFRP bars in reinforced concrete structures
The use of GFRP bars as internal reinforcement in concrete structures is gaining popularity
due to its corrosion resistant properties, which makes it suitable for reinforcement of
concrete structures in corrosive environments where steel reinforcement will not last. The
mechanical properties of FRP bars are different from steel bars as they exhibit a higher
tensile strength, a lower modulus of elasticity and have an elastic brittle stress- strain
relationship (Ashour, 2005). Due to these properties concrete structures reinforced with
12
FRP bars cannot be designed in the same way as steel reinforced members and therefore
research has had to be conducted to develop models which can estimate the flexural and
shear capacity of these structures.
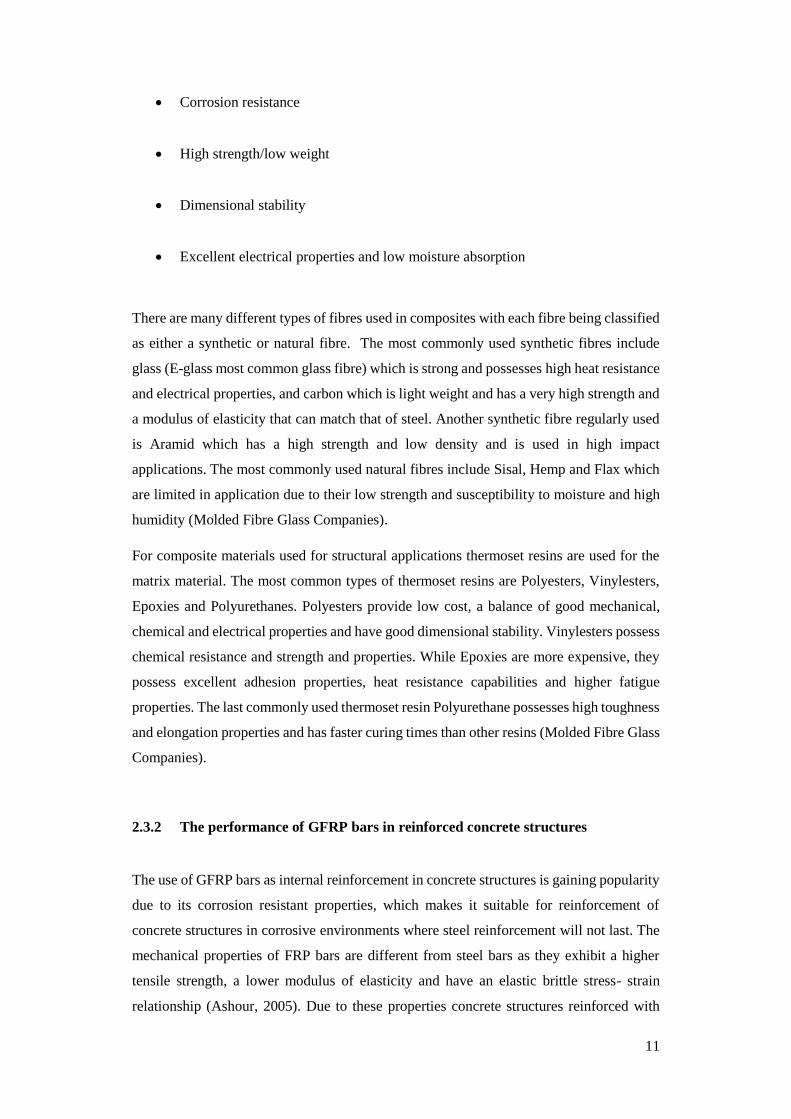
Work by Tang, Lo and Balendran (2008) investigated the tensile properties of smooth
circular GFRP bar, smooth elliptical GFRP bar and compared the results to a mild steel bar.
The results of this investigation shown in table 1, highlight the significantly lower modulus
of elasticity of the GFRP bars (approximately 25% of mild steel) and the superior tensile
strength/ ultimate yield stress of the GFRP bars (approximately 2.5 times mild steel).
2.4 Design of Sleepers
There are different practices adopted in the design of railway sleepers from country to
country, although they all comprise the same basic four steps. These include calculation of
the rail seat load, determination of a dynamic coefficient factor, assuming an appropriate
stress distribution pattern and then analysing a model of the sleeper (Sadeghi and
Youldashkhan 2005).
2.4.1 Rail Seat Load
As reported by Jeffs and Tew (1991) the rail seat load is dependent on a number of factors.
These include:
The weight of the rail
Spacing of the sleepers
Table 2.2: Comparison of tensile properties of GFRP and mild steel bars (Tang, Lo and Balendran, 2008)

13
The stiffness of the sleeper
The track modulus per rail
The rail pad stiffness
The amount of play between the rail and the sleeper
The amount of play between the sleeper and the ballast
The influence that the play between the rail and sleeper and the sleeper and ballast has on
the rail seat load is dependent on the level of track maintenance.
There are a number of different researchers who have developed methods to calculate the
rail seat load. The most commonly used methods as described in Jeffs and TEW (1991)
will be highlighted in this section.
The first method for calculating the maximum rail seat load was developed by Talbot
(1918-1934) and Clarke (1957) using a beam on elastic foundation model. This method
determined the maximum rail seat load by the following equation:
𝑞𝑟 = 𝑆 · 𝑘 · 𝑦𝑚 · 𝐹1 (2.0)
where 𝑞𝑟 = predicted rail seat load
𝑆 = sleeper spacing
𝑘 = track modulus
𝑦𝑚 = the maximum rail deflection caused by the interaction of a number of
axle loads about a given reference position
𝐹1 = factor of safety to allow for variations in track support
O’Rourke (1978) found that for 1.8m spacing between axles in the same bogie and
2.3m spacing between adjacent wagon axles the value of 𝑘 · 𝑦𝑚 / unit load was a
constant 0.56 for any track modulus. This simplified the previous equation to:
𝑞𝑟 = 0.56 · 𝑆 · 𝐹1 · 𝑃 (2.1)
Where P = design wheel load (kN) and the remaining parameters are as previously defined.
14
Research was performed by both AREA (1975) and ORE (1969) to further develop this
into two new methods for determining the maximum rail seat load. These methods are
presented below:
AREA method:
𝑞𝑟 = 𝐷𝑓 𝑥 𝑃 (2.2)
where 𝑞𝑟 = maximum rail seat load (kN)
𝑃 = design wheel load (kN)
𝐷𝑓 = distribution factor, expressed as a proportion of the wheel load.
ORE method:
𝑞𝑟 = ɛ̅ · 𝑐1 · 𝑃 (2.3)
where P = design wheel load based on ORE formula
ɛ̅ = dynamic mean value of the ratio q̅r / P̅S where q̅r and P̅S are the mean values of
the rail seat load and static axle load respectively and:
c1 = ɛ/ ɛ̅ (2.4)
where ɛ = the maximum value of the ratio qr/ PS and c1is equal to 1.35
The last method considered is the three adjacent sleepers method. This method
assumes that as the load moves along the rail it is distributed along three adjacent
sleepers with the maximum load considered for one of the sleepers as 50 percent.
This formula is shown below:
𝑞𝑟 = 0.5𝑃 (2.5)
where P = design wheel load
𝑞𝑟 = predicted maximum rail seat load.
The Australian Standard for Prestressed sleepers AS1085.14 (2012) follows a similar
method for determining the rail seat load as the AREA method. The difference being that
the Australian standard method determines the vertical design wheel load incorporating a
dynamic coefficient first and then applies the distribution factor. The method can be seen
below:
15
𝑃𝑑𝑉 = 𝑘 𝑠𝑄 (2.6)
Where 𝑘 𝑠 = dynamic coefficient, default value of 2.5 when no field measurements are
available.
𝑄 = maximum static wheel load (kN)
𝑃𝑑𝑉 = vertical design wheel load (kN)
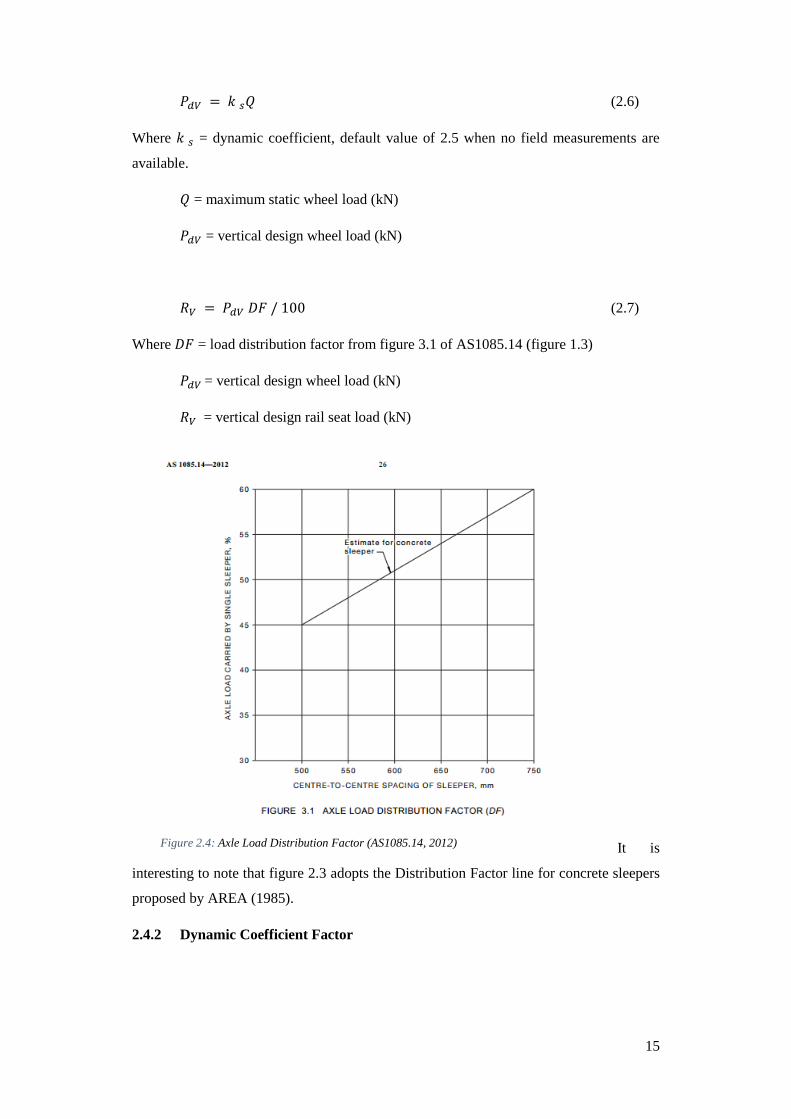
𝑅𝑉 = 𝑃𝑑𝑉 𝐷𝐹 / 100 (2.7)
Where 𝐷𝐹 = load distribution factor from figure 3.1 of AS1085.14 (figure 1.3)
𝑃𝑑𝑉 = vertical design wheel load (kN)
𝑅𝑉 = vertical design rail seat load (kN)
It is
interesting to note that figure 2.3 adopts the Distribution Factor line for concrete sleepers
proposed by AREA (1985).
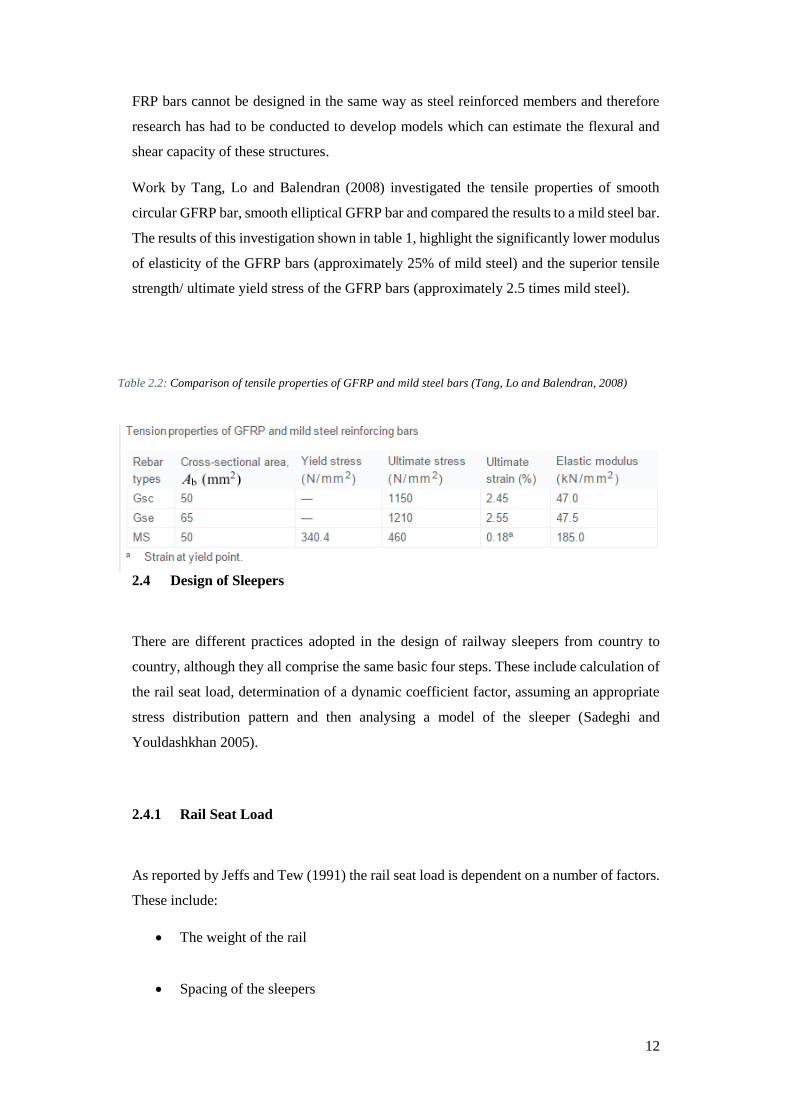
2.4.2 Dynamic Coefficient Factor
Figure 2.4: Axle Load Distribution Factor (AS1085.14, 2012)
16
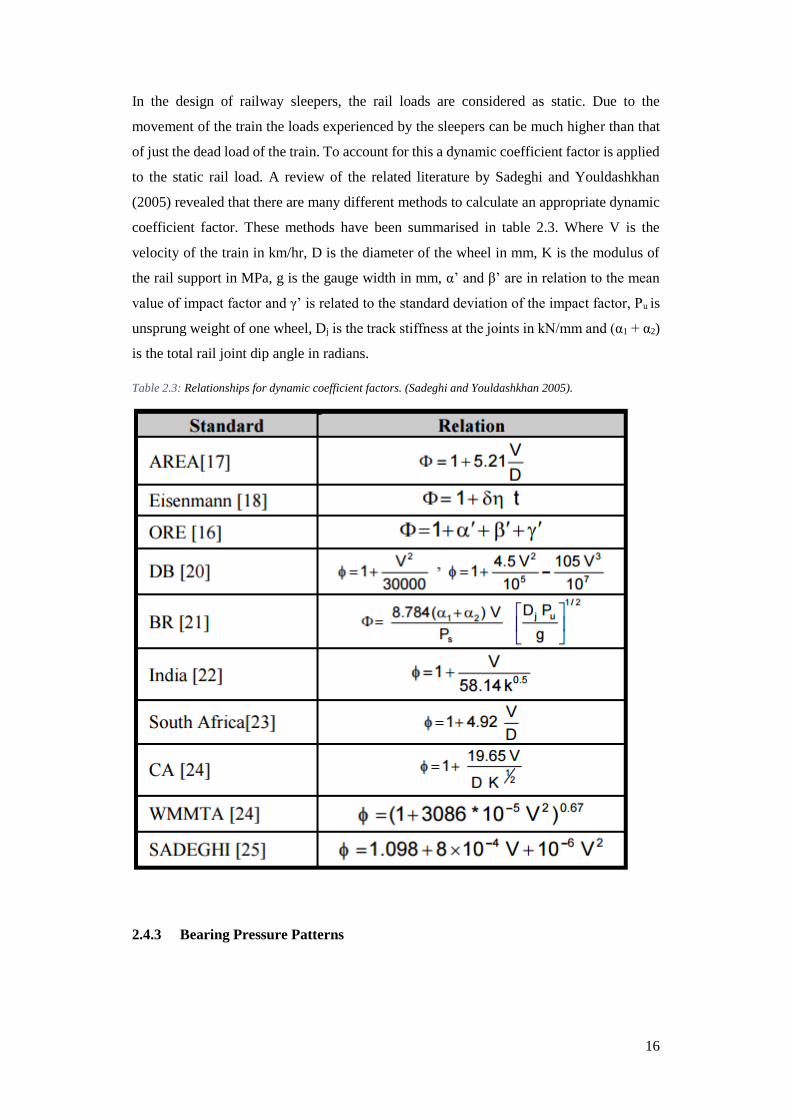
In the design of railway sleepers, the rail loads are considered as static. Due to the
movement of the train the loads experienced by the sleepers can be much higher than that
of just the dead load of the train. To account for this a dynamic coefficient factor is applied
to the static rail load. A review of the related literature by Sadeghi and Youldashkhan
(2005) revealed that there are many different methods to calculate an appropriate dynamic
coefficient factor. These methods have been summarised in table 2.3. Where V is the
velocity of the train in km/hr, D is the diameter of the wheel in mm, K is the modulus of
the rail support in MPa, g is the gauge width in mm, α’ and β’ are in relation to the mean
value of impact factor and γ’ is related to the standard deviation of the impact factor, Pu is
unsprung weight of one wheel, Dj is the track stiffness at the joints in kN/mm and (α1 + α2)
is the total rail joint dip angle in radians.
Table 2.3: Relationships for dynamic coefficient factors. (Sadeghi and Youldashkhan 2005).
2.4.3 Bearing Pressure Patterns
17
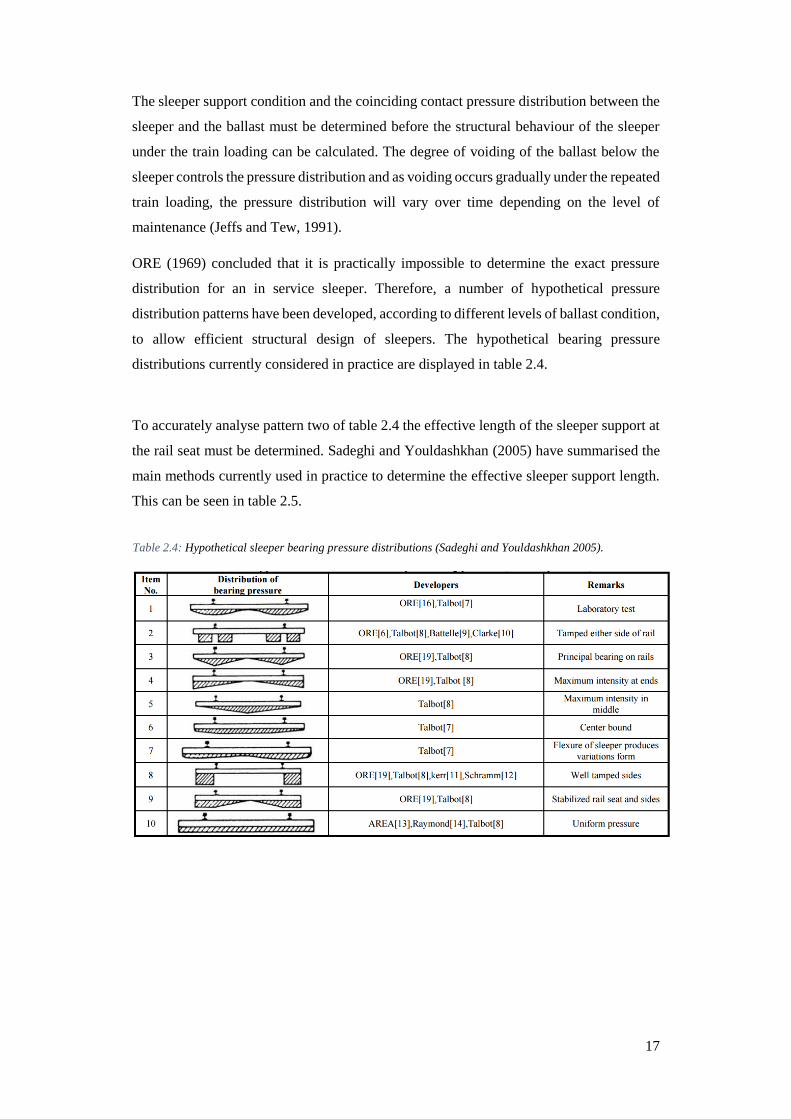
The sleeper support condition and the coinciding contact pressure distribution between the
sleeper and the ballast must be determined before the structural behaviour of the sleeper
under the train loading can be calculated. The degree of voiding of the ballast below the
sleeper controls the pressure distribution and as voiding occurs gradually under the repeated
train loading, the pressure distribution will vary over time depending on the level of
maintenance (Jeffs and Tew, 1991).
ORE (1969) concluded that it is practically impossible to determine the exact pressure
distribution for an in service sleeper. Therefore, a number of hypothetical pressure
distribution patterns have been developed, according to different levels of ballast condition,
to allow efficient structural design of sleepers. The hypothetical bearing pressure
distributions currently considered in practice are displayed in table 2.4.
To accurately analyse pattern two of table 2.4 the effective length of the sleeper support at
the rail seat must be determined. Sadeghi and Youldashkhan (2005) have summarised the
main methods currently used in practice to determine the effective sleeper support length.
This can be seen in table 2.5.
Table 2.4: Hypothetical sleeper bearing pressure distributions (Sadeghi and Youldashkhan 2005).
18
Table 2.5: Effective Length of sleeper support at rail seat (Sadeghi and Youldashkhan 2005).
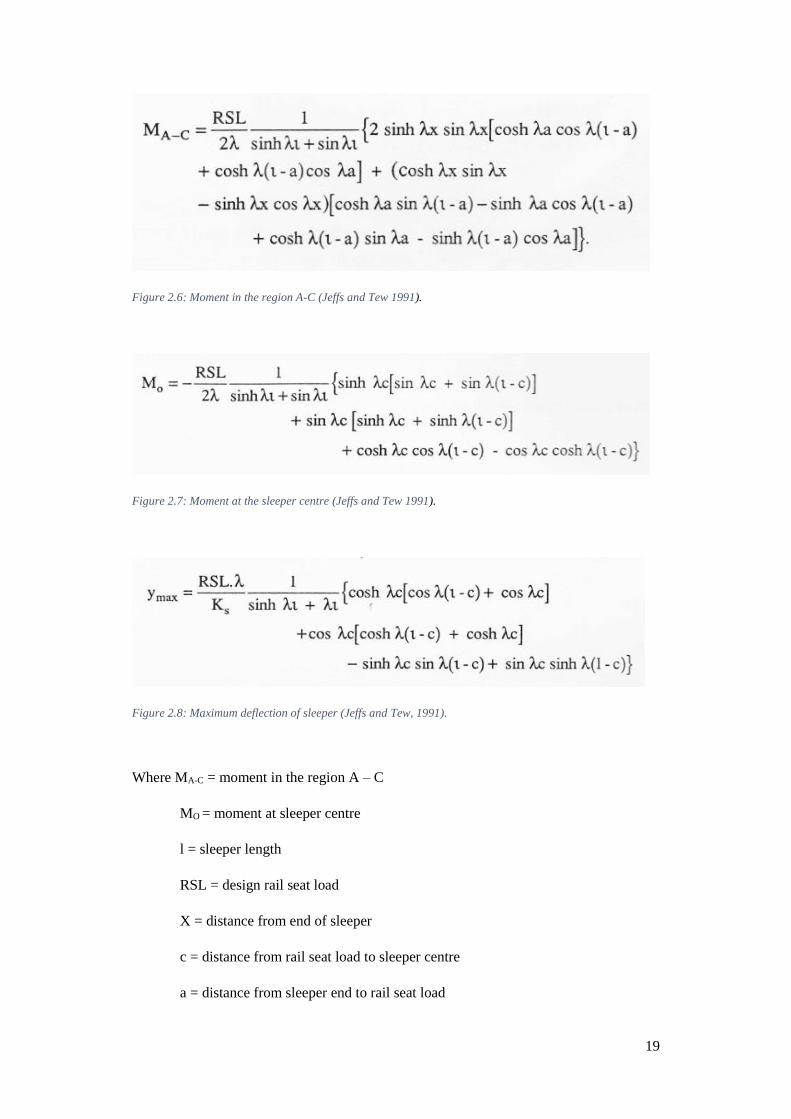
2.5 Analytical Solution
An analytical solution to the problem of a sleeper analysed as a beam on an elastic
foundation has been derived by Hetenyi (1967) to calclate the bending moment at the rail
seat, sleeper centre and the maximum deflection at the rail seat region. A diagram of the
problem analysed can be seen in figure 2.6. The analysis considers the two vertical rail
loads and a uniform bearing pressure distribution. The derived bending moment and
deflection equations are also presented below.
Figure 2.5: A schematic of the sleeper analysed as a beam on elastic foundation (Jeffs and Tew 1991).
19
Figure 2.6: Moment in the region A-C (Jeffs and Tew 1991).
Figure 2.7: Moment at the sleeper centre (Jeffs and Tew 1991).
Figure 2.8: Maximum deflection of sleeper (Jeffs and Tew, 1991).
Where MA-C = moment in the region A – C
MO = moment at sleeper centre
l = sleeper length
RSL = design rail seat load
X = distance from end of sleeper
c = distance from rail seat load to sleeper centre
a = distance from sleeper end to rail seat load

20
l = sleeper stiffness parameter = (KS/4. ES.IS)0.25
KS = sleeper support modulus (N/m2)
ES = Young’s modulus of sleeper (N/m2)
IS = sleeper moment of inertia about horizontal neutral axis (m4)
ymax = deflection at the rail seat region (m)
2.6 2.6 Summary of research in the area
This section provides a summary of some of the previous work on the design of railway
sleepers and also research on the application of GFRP in railway sleepers. As a part of this
research the bearing distribution patterns highlighted in previous sections will be analysed
to determine which one gives the highest design forces and therefore allow the ultimate
strength design of the sleeper. Figure 2.10 highlights the typical bending moment diagram
shape for the different bearing pressure distributions, as developed by Jeffs and Tew
(1991). These will be useful when assessing the accuracy of the flexural results in chapter
3.

21
Figure 2.9: Proposed distribution of sleeper bearing pressure and bending moment diagrams (Jeffs and Tew,
1981).
Research similar to the parametric study that will be conducted as a part of this research
has been performed by Manalo et.al (2012). This paper considers a simplified grillage beam
analogy to investigate the behaviour of a railway turnout sleeper with varying elastic
modulus and support modulus values. The aim of the study was to determine suitable
parameters for a new fibre composite sleeper design. This research found that the change
in support modulus and in particular the sleeper modulus has a considerable effect on the
maximum bending moment experienced by the sleepers. The change in support modulus
from 10 to 40 MPa resulted in a 15% increase in the maximum bending moment while the
change in sleeper modulus from 1 to 10 GPa resulted in a significant increase of up to 75%
in bending moment. The resulting effect of changing the support and sleeper modulus on
the bending moment, deflection and pressure experienced by the sleeper, can be seen in
figures 2.11 and 2.12.
22
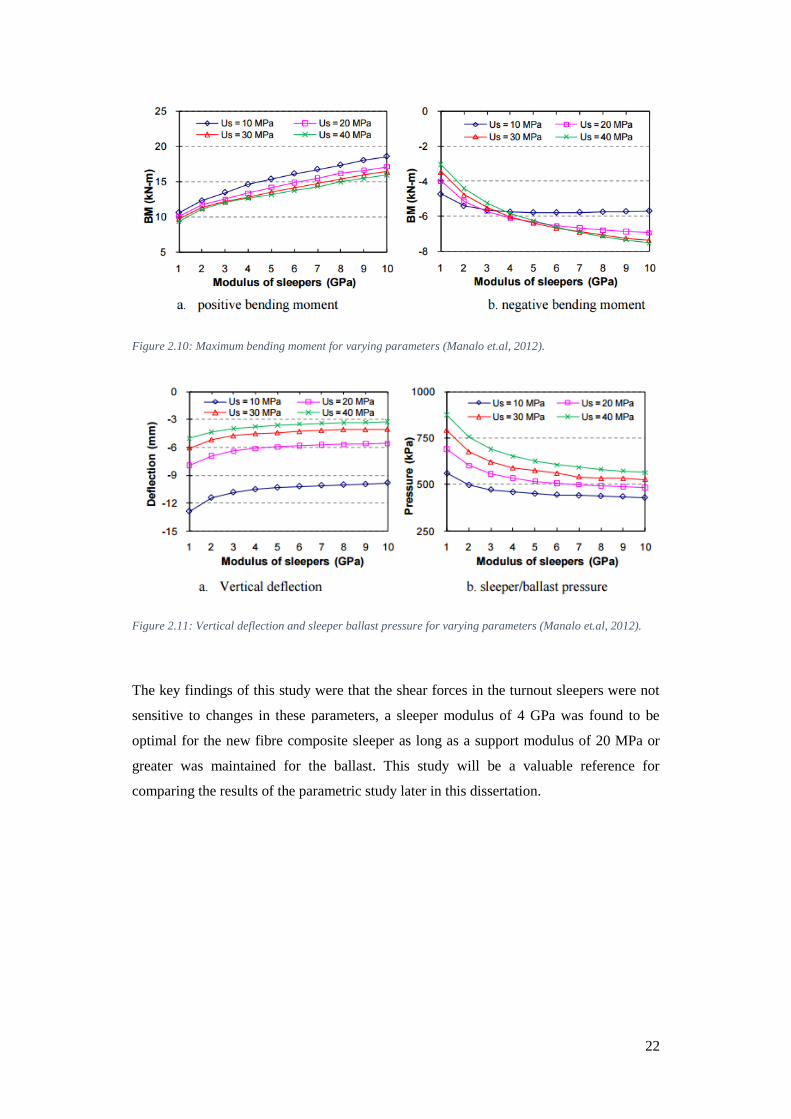
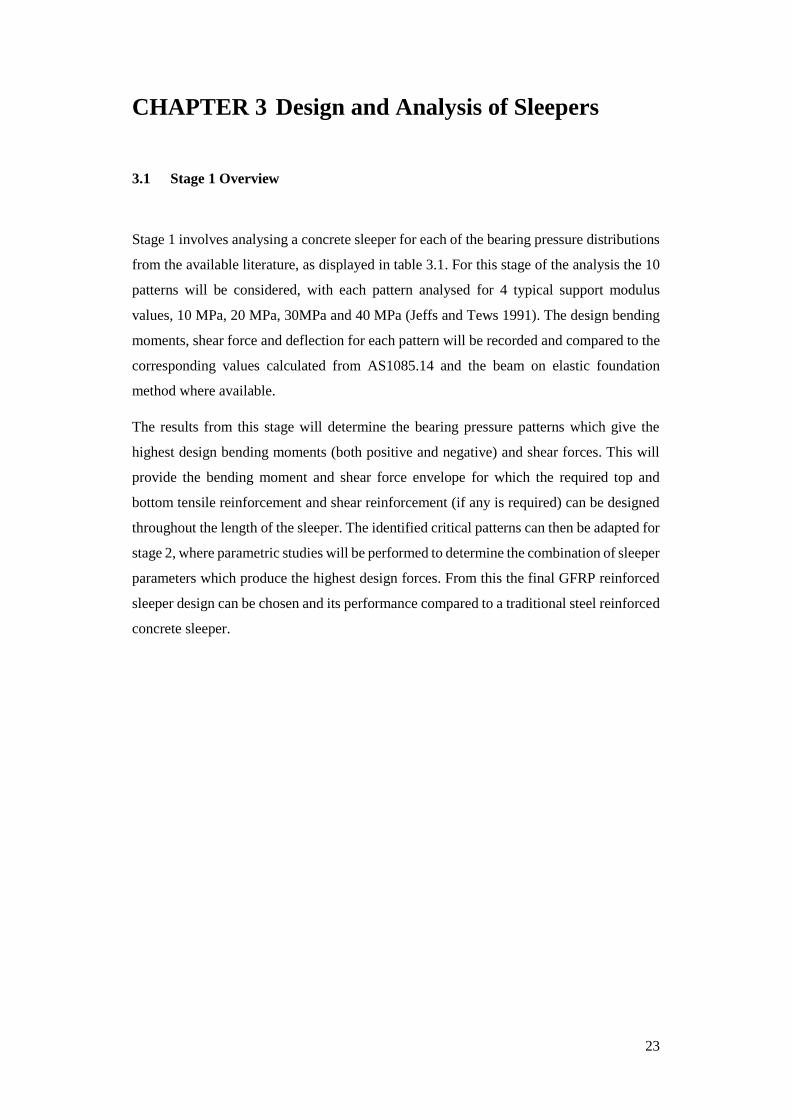
Figure 2.10: Maximum bending moment for varying parameters (Manalo et.al, 2012).
Figure 2.11: Vertical deflection and sleeper ballast pressure for varying parameters (Manalo et.al, 2012).
The key findings of this study were that the shear forces in the turnout sleepers were not
sensitive to changes in these parameters, a sleeper modulus of 4 GPa was found to be
optimal for the new fibre composite sleeper as long as a support modulus of 20 MPa or
greater was maintained for the ballast. This study will be a valuable reference for
comparing the results of the parametric study later in this dissertation.
23
CHAPTER 3 Design and Analysis of Sleepers
3.1 Stage 1 Overview
Stage 1 involves analysing a concrete sleeper for each of the bearing pressure distributions
from the available literature, as displayed in table 3.1. For this stage of the analysis the 10
patterns will be considered, with each pattern analysed for 4 typical support modulus
values, 10 MPa, 20 MPa, 30MPa and 40 MPa (Jeffs and Tews 1991). The design bending
moments, shear force and deflection for each pattern will be recorded and compared to the
corresponding values calculated from AS1085.14 and the beam on elastic foundation
method where available.
The results from this stage will determine the bearing pressure patterns which give the
highest design bending moments (both positive and negative) and shear forces. This will
provide the bending moment and shear force envelope for which the required top and
bottom tensile reinforcement and shear reinforcement (if any is required) can be designed
throughout the length of the sleeper. The identified critical patterns can then be adapted for
stage 2, where parametric studies will be performed to determine the combination of sleeper
parameters which produce the highest design forces. From this the final GFRP reinforced
sleeper design can be chosen and its performance compared to a traditional steel reinforced
concrete sleeper.

24
Table 3.1: Bearing pressure distribution patterns adopted for analysis.
No. Bearing Pressure Distribution Pattern
1
2
3
4
5
6
7
8
9
10
25
3.2 Developing the model
3.2.1 Rail Parameters and Load
The first step of completing stage 2 was to define rail parameters and calculate the rail load.
For this project a Queensland railway sleeper is being considered so the rail gauge g is
taken as 1067mm with the distance between rail centres G = 1137mm. A 25 tonne design
axle load was considered for this first stage of the project analysis (Manalo et al. 2012).
With these parameters defined the method for determining the rail seat load provided in
AS1085.14 (2012) was then followed.
Calculation of the vertical design wheel load using equation 2.6:
𝑃𝑑𝑉 = 𝑘 𝑠𝑄
Where Q = 25tonnes/2 wheels = (25/2) tonnes x 9.81m/s2 = 122.63 kN, and
𝑘 𝑠 is assumed as 2.5 due to the lack of field measurements.
𝑃𝑑𝑉 = 2.5 x 122.63 kN = 306.58 kN
Calculation of the vertical design rail seat load:
𝑅𝑉 = 𝑃𝑑𝑉 𝐷𝐹 / 100
Where DF = load distribution factor from figure 3.1 of AS1085.14
Adopting a sleeper spacing of 600mm gives a 𝐷𝐹 value of 52% from figure 1.3.
𝑅𝑉 = 306.58 kN x (52/100) = 159.42 kN
Therefore, the approximate vertical rail load that will be assumed for the analysis is 160
kN.
3.2.2 Concrete sleeper model parameters
Before the model can be created the properties and dimensions of the concrete sleeper must
be quantified. For this first stage of the analysis typical concrete properties were assumed
and a typical narrow gauge concrete sleeper size was adopted and simplified to a constant
rectangular section. The details of the concrete sleeper parameters can be seen in table 3.2.
The rail base width was also needed for modelling some of the patterns. A typical value of
146mm for a 60kg/m rail was used (AS1085.1, 2012). The effective length of sleeper
26
support at the rail seat was also required to correctly analyse bearing distribution 2. The
simplified Clarke method (Table 2.5) was used to calculate a length of 0.717m.
Table 3.2: Properties of the sleeper model.
Item Value
Sleeper length 2.15m
Sleeper height 0.25m
Sleeper width 0.18m
Concrete Density 2500 kg/m2
Young’s Modulus 30 GPa
Poisson’s Ratio 0.15
Rail base width 0.146mm
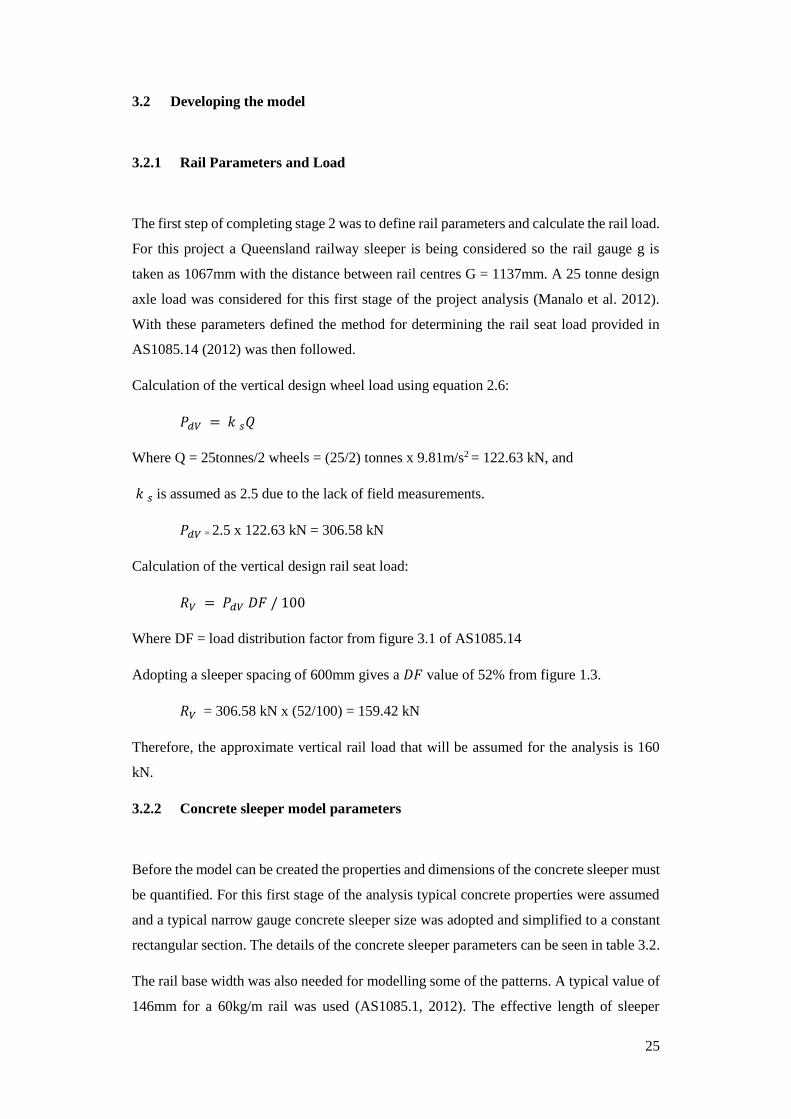
3.2.3 Finite Element Model
With all the required parameters now chosen the sleeper was then modelled using the Finite
Element Software Strand7. A 3dimensional view of the concrete sleeper model can be seen
in figure 3.1.
Figure 3.1: 3-D view of the concrete sleeper model.
Due to the differences in the patterns some of the elements had to be subdivided at different
positions. Most noticeably pattern 2 and 3 had to be subdivided so that the pattern could be
correctly modelled allowing for the rail width. Pattern 1 was simply modelled as one
element due to the constant bearing pressure.
27
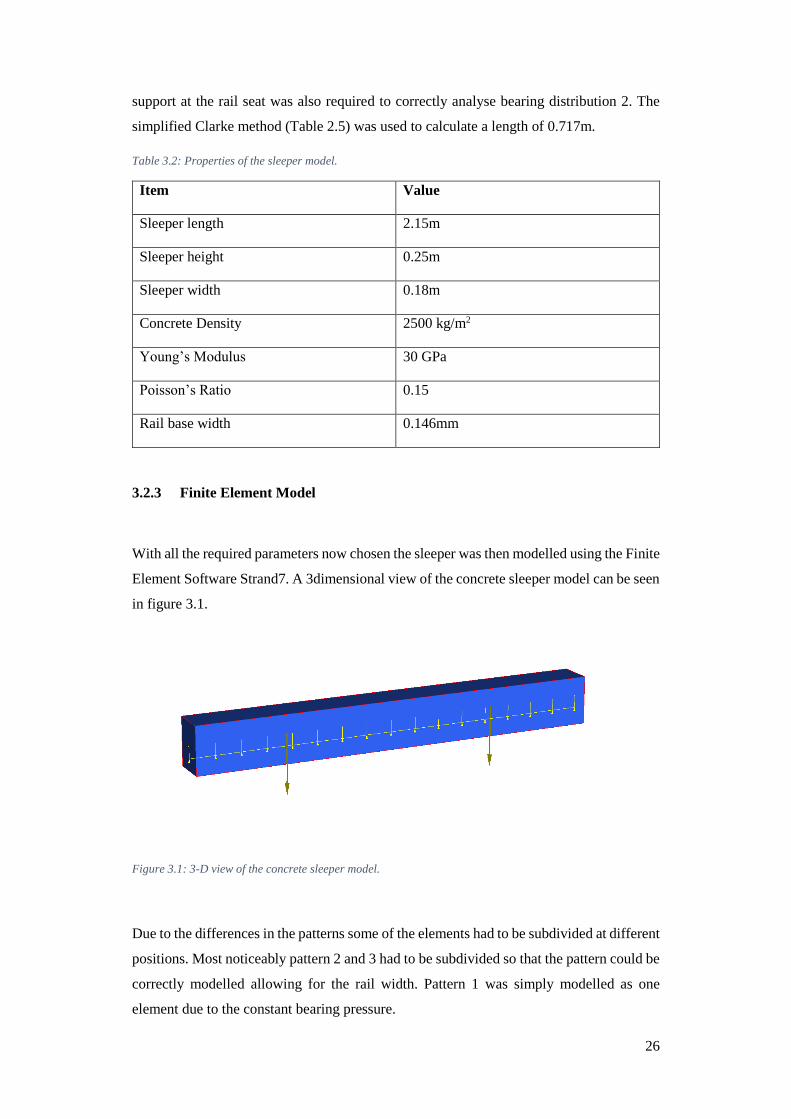
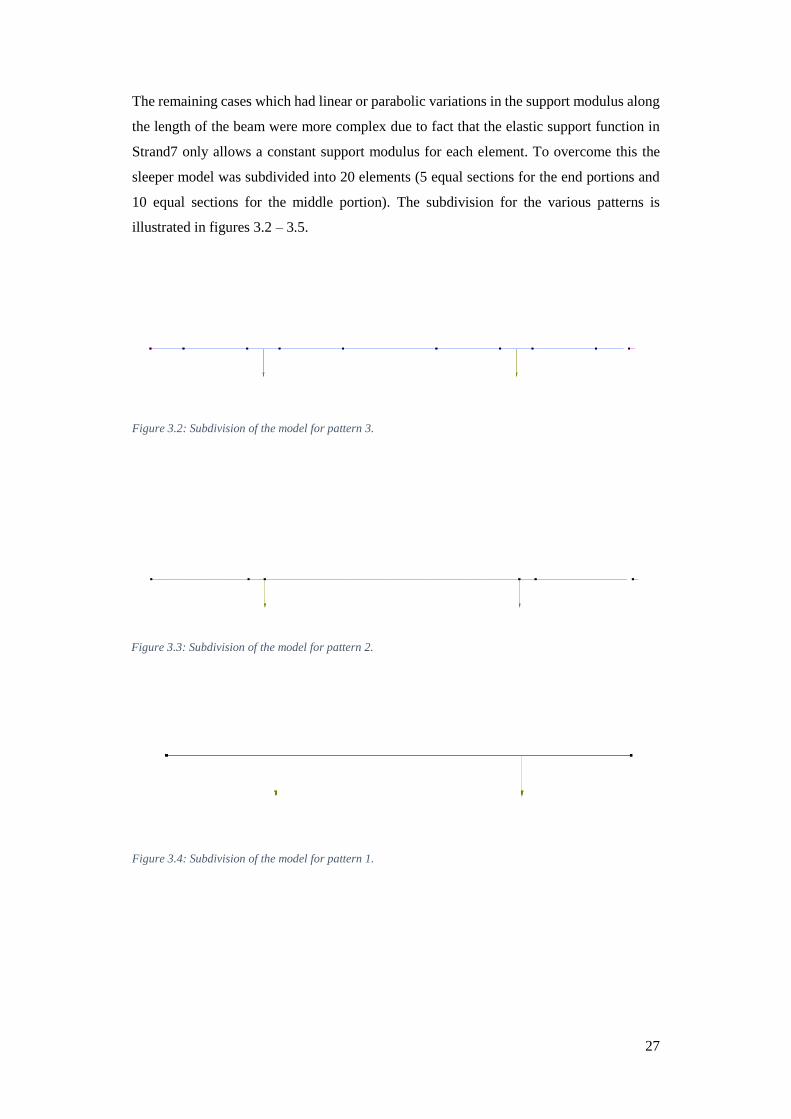
The remaining cases which had linear or parabolic variations in the support modulus along
the length of the beam were more complex due to fact that the elastic support function in
Strand7 only allows a constant support modulus for each element. To overcome this the
sleeper model was subdivided into 20 elements (5 equal sections for the end portions and
10 equal sections for the middle portion). The subdivision for the various patterns is
illustrated in figures 3.2 – 3.5.
Figure 3.2: Subdivision of the model for pattern 3.
Figure 3.4: Subdivision of the model for pattern 1.
Figure 3.3: Subdivision of the model for pattern 2.
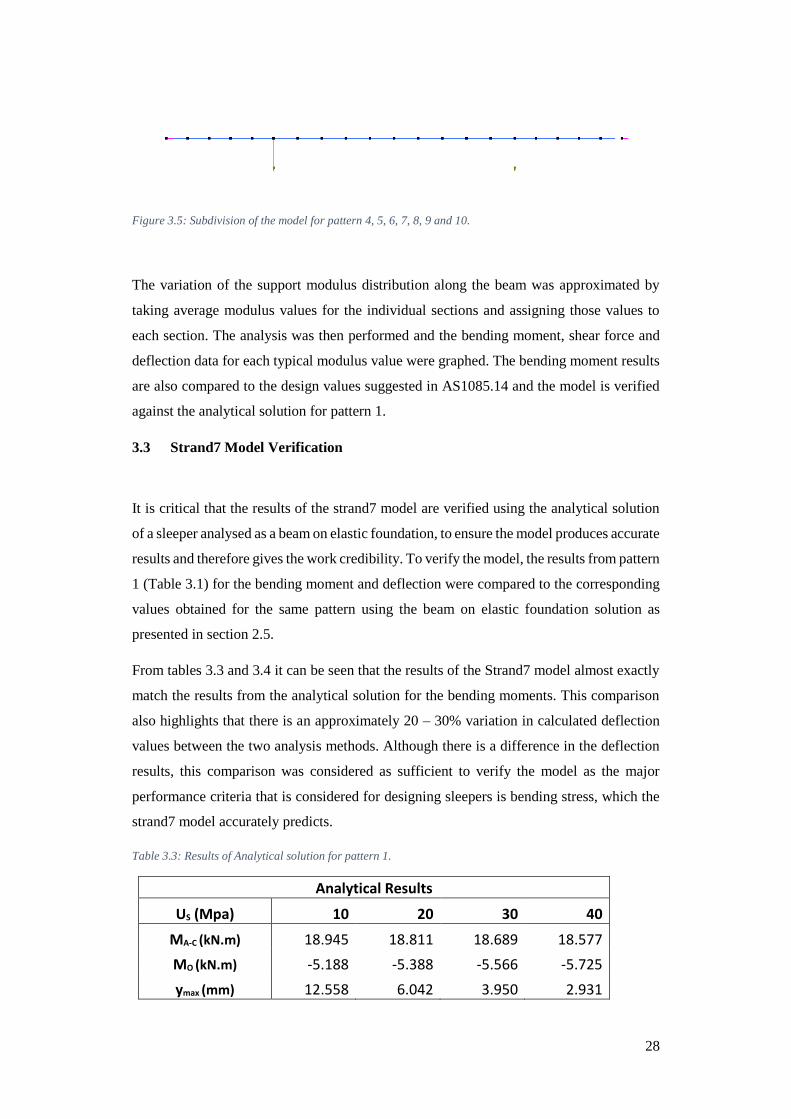
28
Figure 3.5: Subdivision of the model for pattern 4, 5, 6, 7, 8, 9 and 10.
The variation of the support modulus distribution along the beam was approximated by
taking average modulus values for the individual sections and assigning those values to
each section. The analysis was then performed and the bending moment, shear force and
deflection data for each typical modulus value were graphed. The bending moment results
are also compared to the design values suggested in AS1085.14 and the model is verified
against the analytical solution for pattern 1.
3.3 Strand7 Model Verification
It is critical that the results of the strand7 model are verified using the analytical solution
of a sleeper analysed as a beam on elastic foundation, to ensure the model produces accurate
results and therefore gives the work credibility. To verify the model, the results from pattern
1 (Table 3.1) for the bending moment and deflection were compared to the corresponding
values obtained for the same pattern using the beam on elastic foundation solution as
presented in section 2.5.
From tables 3.3 and 3.4 it can be seen that the results of the Strand7 model almost exactly
match the results from the analytical solution for the bending moments. This comparison
also highlights that there is an approximately 20 – 30% variation in calculated deflection
values between the two analysis methods. Although there is a difference in the deflection
results, this comparison was considered as sufficient to verify the model as the major
performance criteria that is considered for designing sleepers is bending stress, which the
strand7 model accurately predicts.
Table 3.3: Results of Analytical solution for pattern 1.
Analytical Results
US (Mpa) 10 20 30 40
MA-C (kN.m) 18.945 18.811 18.689 18.577
MO (kN.m) -5.188 -5.388 -5.566 -5.725
ymax (mm) 12.558 6.042 3.950 2.931
29
Table 3.4: Results of Strand7 model for pattern 1.
Strand7 Results
US (Mpa) 10 20 30 40
MA-C (kN.m) 18.944 18.811 18.689 18.577
MO (kN.m) -5.188 -5.388 -5.566 -5.725
ymax (mm) 14.95 7.504 5.023 3.783
3.4 Results and Discussion
The aim of this stage of the analysis is to evaluate and compare the proposed theoretical
bearing pressure distribution patterns for calculating the bending moment and shear forces
that sleepers are subjected to and determine which pattern will give the most conservative
design forces, for stage 2 of the analysis. To achieve this comparison, the results from the
strand7 model for bending moment, shear force and deflection are graphed for the 10
patterns for the varying support modulus values.
3.4.1 Positive and Negative Design Bending Moment
The bending moments recorded for the 10 patterns for each of the support modulus values
can be seen graphed below in figures 3.6 – 3.9.

30
Fig
ure 3
.6: B
end
ing
Mo
men
t Dia
gra
m U
s 10
MP
a.

31
Fig
ure 3
.7: B
end
ing
Mo
men
t Dia
gra
m U
s 20
MP
a.

32
Fig
ure 3
.8: B
end
ing
Mo
men
t Dia
gra
m U
s 30
MP
a.
33
Fig
ure 3
.9: B
end
ing
Mo
men
t Dia
gra
m U
s 40
MP
a.
34
From these graphs it can be seen that pattern 2 experiences the highest bending moment at
both the rail seat location and the sleeper centre, with values of approximately 46.2 – 45.3
kN.m and 46.4 – 45.5 kN.m respectively in the order of increasing support modulus. The
high positive bending moment at the rail seat and sleeper centre is expected as this pattern
represents the ballast condition where the side ballast has been well compacted and there
is gaping of the ballast under the centre. This means the rail load is supported by only a
small section of ballast at the side; therefore, there is no resistance to bending at the centre
of the sleeper.
Following this pattern 4 and 8 have quite a similar bending moment diagram, with their rail
seat moments varying from 25.5 – 24.2 kN.m and 31.7 – 30.3 kN.m respectively, while
their centre bending moments vary from 14.2 – 12.3 kN.m and 22.9 – 20.9 kN.m
respectively. Patterns 1,3,5,9 and 10 bending moments all follow a similar shape with
smaller rail seat moments and close to zero bending moment at the centre. The bending
moments at the rail seat for this group vary from 6.13 – 18.5 kN.m for 10 MPa modulus
and 5.77 – 18.6 kN.m for 40 MPa modulus, while the centre bending moments exhibit a
similar range with values of 0.733 to – 4.22 kN.m and 0.07 to – 4.76 kN.m for support
modulus 10 MPa and 40 MPa respectively. The last two patterns, 6 and 7 are both of a very
similar shape with a very low bending moment at the rail seat but a large negative bending
moment at the centre. The values for pattern 6 and 7 at the rail seat vary from approximately
7.59 – 8.98 kN.m and 6.13 kN.m respectively, while at the centre vary from -22.6 to – 21.4
kN.m and -33.1 to -31.8 kN.m respectively.
This visual representation of the bending moment results also allows an interpretation of
what support conditions are assumed for the calculation of design bending moments in
AS1085.14 Prestressed concrete sleepers. From figures 3.6 – 3.9, the closest fit for the
design positive rail seat bending moment and the design positive centre bending moment
is pattern 4 with values of 25.51 and 14.23 kN.m with 10 MPa support, compared to the
standard values of 25.325 and 16.21 kN.m. From this it can be deduced that for the positive
design moments a pattern similar to pattern 4 must have been considered with constant
bearing pressure between the ends and the rail and then decreasing pressure from the rail
to the centre of the sleeper. This pattern seems to be a reasonable assumption for the design
positive bending moments as this deteriorated ballast condition is more likely to occur in
practice than pattern 2.
The standard value for the design negative centre bending moment is greater than 10.86
kN.m so this means that only patterns 6 and 7 meet this requirement. While for the negative
bending moment a distribution similar to pattern 6 or 7 must have been assumed with

35
increasing pressure towards the centre of the sleeper. These patterns both have high stress
concentrations at the centre of the sleeper as there is higher bearing resistance at this
location. This creates negative curvature of the sleeper centre and therefore high negative
bending moments. This type of pattern seems like an accurate prediction for negative
bending as the ballast could be deteriorated from the outside in due to a combination of
cyclic loading at the rail seat and environmental conditions.
The bending moment diagrams developed in strand 7 match quite closely the expected
bending moments from the published literature (figure 2.10). In comparison of figure 2.10
and the recorded results, it is concluded that the strand7 results are reasonable. In particular
the critical patterns 2 and 7 match the expected bending moment diagram shape quite
closely. Pattern 2 increases sharply from the end of the sleeper until the rail load, and then
is practically flat from the rail to the sleeper centre, which matches the literature. The
calculated bending moment diagram for Pattern 7 is also very similar to the expected result
from the literature. In comparing figure 3.6 to figure 2.10, it is seen that the shape from the
rail to the centre of the sleeper is approximately the same, although there is a small positive
bending moment at the rail seat from the calculated results compared to no bending from
the rail to the end of the sleeper for the proposed bending moment diagram. This slight
difference could be due to different support modulus and/or rail seat loads. Furthermore,
based on these comparisons both the critical patterns appear to be accurate and will be
considered for determining the maximum bending moments for the sleeper design.
3.4.2 Shear forces
The shear force diagrams from the strand7 model can be seen in figures 3.10 – 3.13. From
these figures it is clear that pattern 2 gives the highest design shear forces acting on the
sleeper. The point of maximum shear occurs to the left of the rail with the value remaining
at approximately 160.7 kN for all support modulus values. This is quite high compared to
pattern 7 which has the next highest shear force, which ranges from approximately 120 to
115 kN for increasing support modulus. It can also be seen that besides pattern 1 and 2 the
rest of the bearing pressure distribution patterns give a similar shear force diagram shape.
The reason for such a large shear force occurring for pattern 2 is because the ballast only
provides resistance to the rail load for a small section of the sleeper compared to the other
patterns. Further to this pattern 7 also experiences a high shear force at the rail seat as the
majority of the bearing resistance occurs at the centre of the sleeper. The remaining patterns
result in similar shear force diagrams as the stresses induced by the rail load are more
36
evenly distributed. From these results it is clear that pattern 2 should also be chosen for the
calculation of design shear forces for the final sleeper design.
37
Fig
ure 3
.10
: Sh
ear F
orce D
iag
ram
Us 1
0 M
pa
38
Fig
ure 3
.11
: Sh
ear F
orce D
iag
ram
Us 2
0 M
Pa.
39
Fig
ure 3
.12
: Sh
ear F
orce D
iag
ram
Us 3
0 M
Pa.
40
Fig
ure 3
.13
: Sh
ear F
orce D
iag
ram
Us 4
0 M
Pa.
41
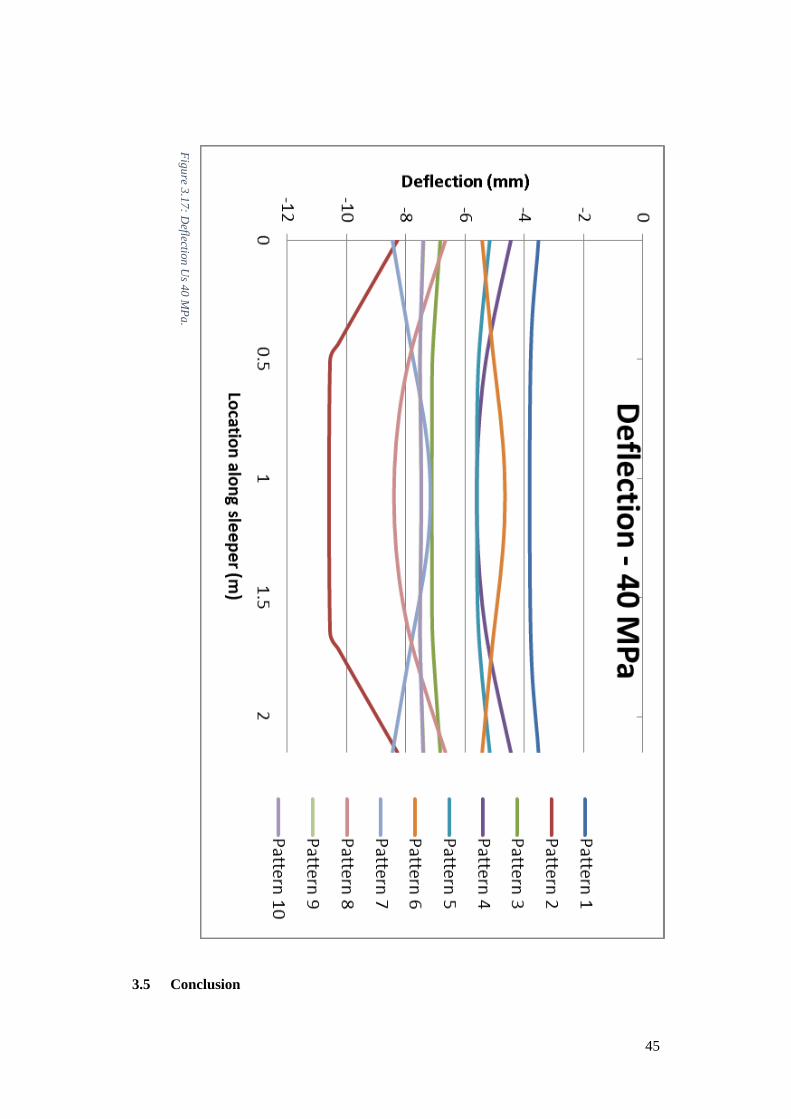
3.4.3 Deflection
The deflection data from the strand 7 analysis for support modulus values 10 MPa, 20 MPa,
30 MPa and 40 MPa can be seen in figures 3.14 – 3.17. From these figures it can be seen
that pattern 2 subjects the sleeper to the most deflection. This is expected as pattern 2 also
produces the largest bending moment and shear forces. The graphs also highlight that
patterns 1, 3, 5, 9 and 10 produce almost no variation in deflection along the length of the
sleeper, while for pattern 2, 4 and 8 deflection increases towards the centre and for patterns
6 and 7 the opposite occurs with increasing deflection towards the ends of the sleeper. The
results of this analysis suggest that the deflection of the sleepers will be largely dependent
on what support modulus value is chosen.
42
Fig
ure 3
.14
: Deflectio
n U
s 10
MP
a
43
Fig
ure 3
.15
: Deflectio
n U
s 20
MP
a
44
Fig
ure 3
.16
: Deflectio
n U
s 30
MP
a.
45
3.5 Conclusion
Fig
ure 3
.17
: Deflectio
n U
s 40
MP
a.
46
The objective of this chapter was to compare and evaluate the existing theoretical bearing
pressure distribution patterns used to calculate the design bending moment and shear forces
that sleepers are subjected to due to rail loading and determine which pattern will give the
most conservative design forces for the next stage of the analysis. The patterns available
from published literature have been analysed in strand7 and the results have been discussed
above. The main findings from this stage of the study include:
Pattern 2 will give the highest design positive bending moments and shear forces.
Pattern 7 will give the highest design negative bending moment.
AS1085.14 design positive rail seat and positive centre bending moments most
closely match pattern 4.
AS1085.14 negative centre bending moments most closely match pattern 6 and 7.
The chosen patterns 2 and 7 will be used for the next chapter to perform parametric studies
and determine the combination of parameters which give the highest design forces, which
will then be sued to design the arrangement of GFRP reinforcement.
47
CHAPTER 4 Parametric Study
4.1 Chapter Overview
Stage 2 involves undertaking a parametric study to determine the maximum design forces
the concrete railway sleeper will be subjected to. To achieve this, the two chosen patterns
from chapter 3 will be re analysed in Strand7, once again using typical support modulus
values of 10 MPa, 20 MPa, 30 MPa and 40 MPa, this time with varied characteristic
compressive strength values. Pattern 1 will also be re analysed with the varying parameters
to allow a comparison with the Beam on Elastic Foundation results and to verify the
Strand7 results are accurate.
The results of this section will provide the combination of pattern, support modulus and
characteristic compressive strength of concrete which will give the highest positive and
negative bending moments and shear force. From this the required reinforcement for both
GFRP and steel alternatives can be determined and then the behaviour of the different
concepts can be compared through finite element analysis.
4.2 Parameters
The parametric study involves varying the bearing pressure distribution patterns, the
support modulus and the characteristic compressive strength. The 10 different hypothetical
bearing pressure distribution patterns (Table 3.1) were analysed as a part of the first stage
and from this patterns 2 and 7 were chosen for this stage of the study. Pattern 1 is also
considered in this stage as a verification tool because the analytical solution only considers
this support condition. Further to this the same typical support modulus values of 10 MPa,
20 MPa, 30 MPa and 40 MPa are used in this chapter.
The new parameter introduced for this stage of the analysis is concrete characteristic
compressive strength (f’c). The first stage of the analysis considered a Young’s modulus
value of 30 GPa which correlates to f’c = 32 MPa according to AS3600 Concrete Structures
(2012). For this stage two additional f’c values of 25 MPa and 50 MPa will be considered.
These compressive strength values are input into Strand7 through the corresponding
Young’s modulus (Ec), which can be seen in Table 4.1 (AS3600, 2012).
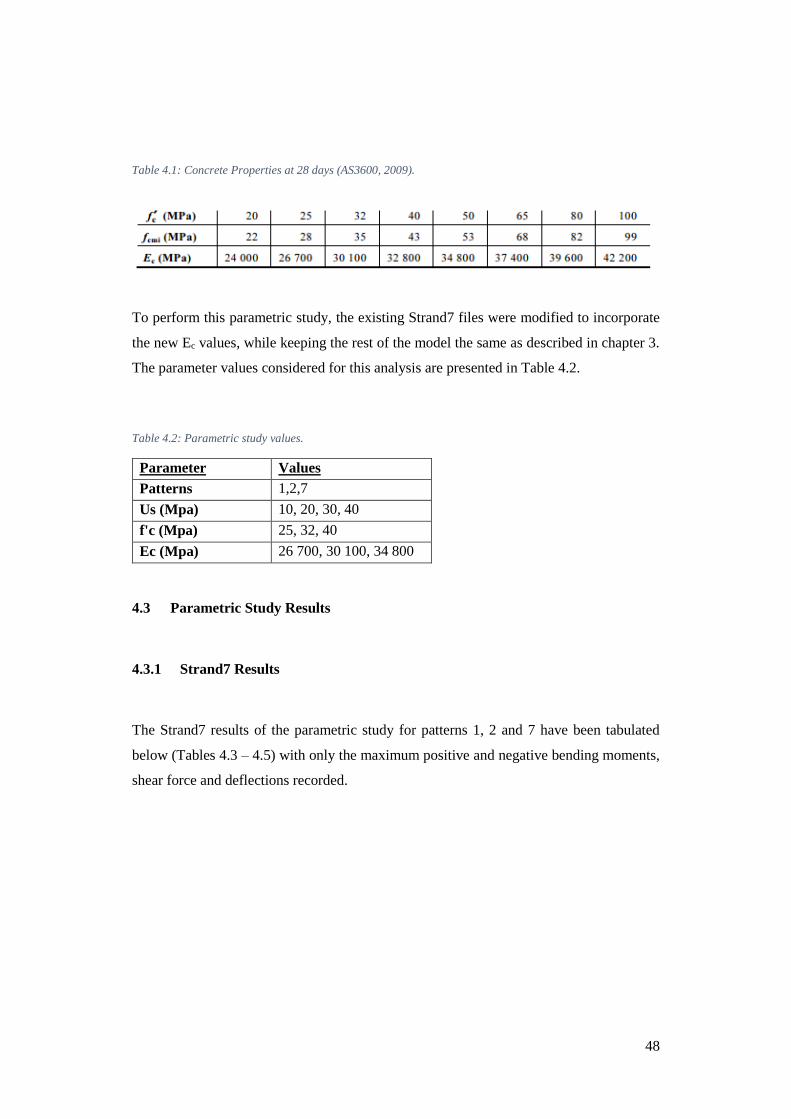
48
To perform this parametric study, the existing Strand7 files were modified to incorporate
the new Ec values, while keeping the rest of the model the same as described in chapter 3.
The parameter values considered for this analysis are presented in Table 4.2.
Table 4.2: Parametric study values.
Parameter Values
Patterns 1,2,7
Us (Mpa) 10, 20, 30, 40
f'c (Mpa) 25, 32, 40
Ec (Mpa) 26 700, 30 100, 34 800
4.3 Parametric Study Results
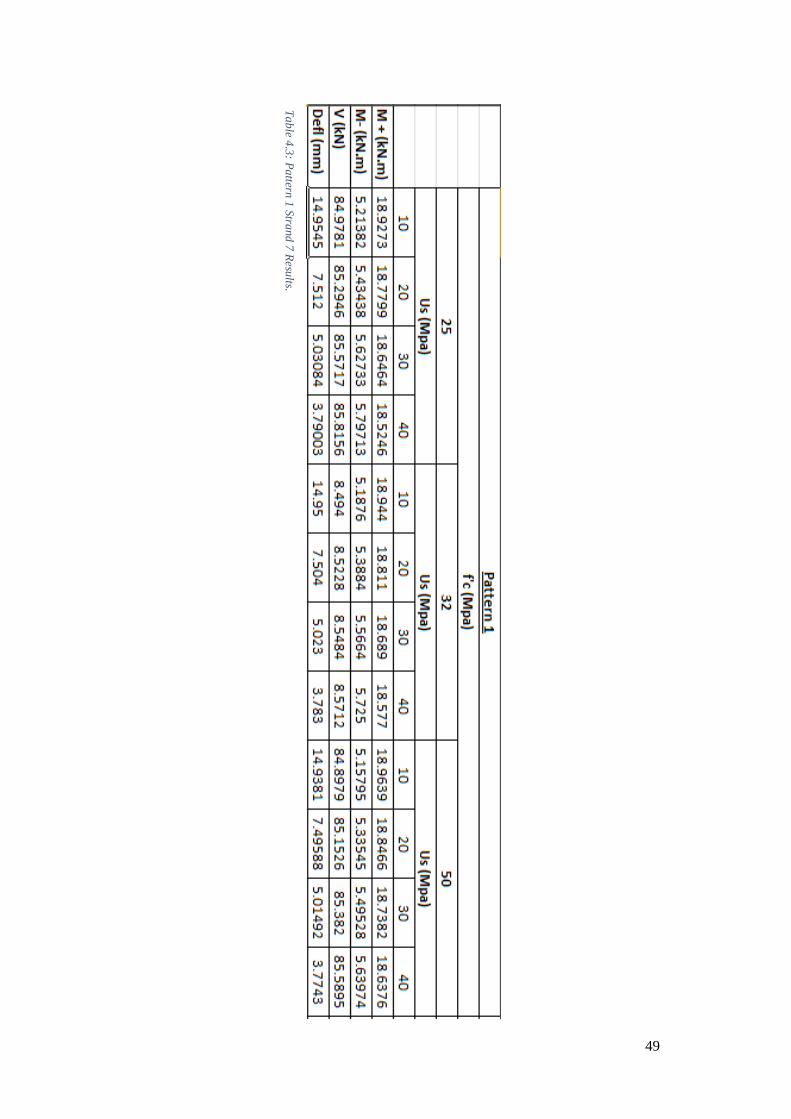
4.3.1 Strand7 Results
The Strand7 results of the parametric study for patterns 1, 2 and 7 have been tabulated
below (Tables 4.3 – 4.5) with only the maximum positive and negative bending moments,
shear force and deflections recorded.
Table 4.1: Concrete Properties at 28 days (AS3600, 2009).
49
Ta
ble 4
.3: P
attern
1 S
trand
7 R
esults.
50
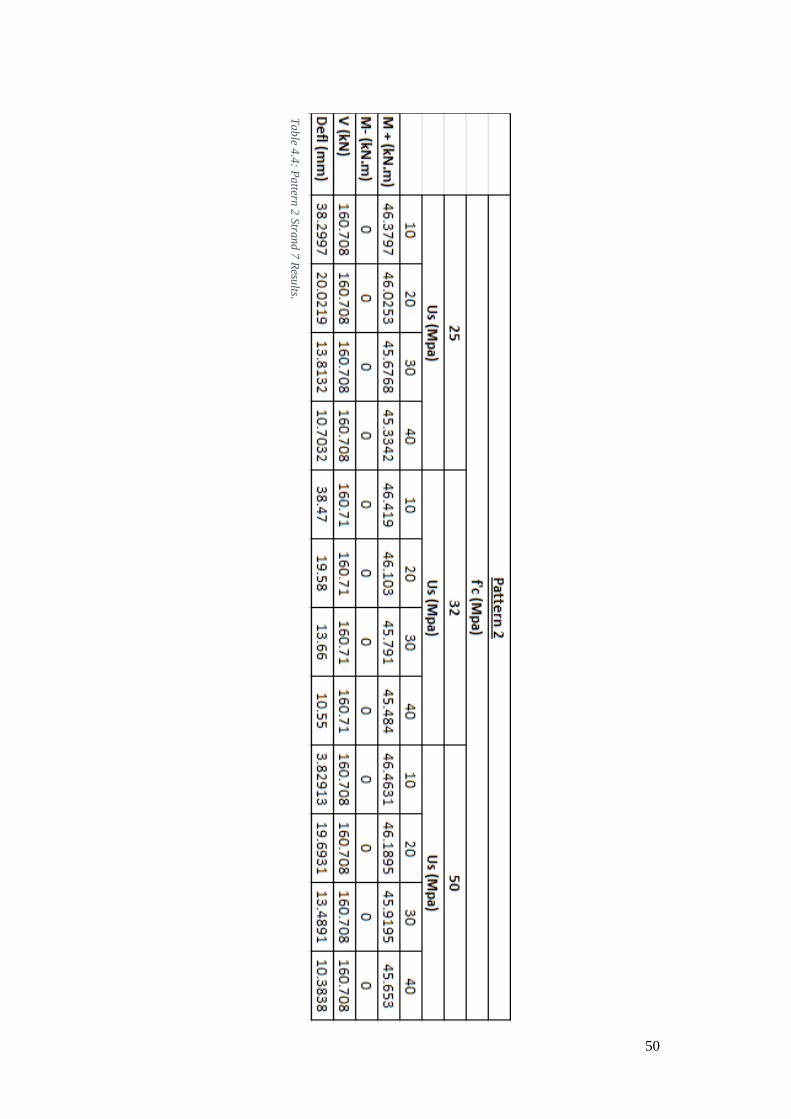
Ta
ble 4
.4: P
attern
2 S
trand
7 R
esults.
51
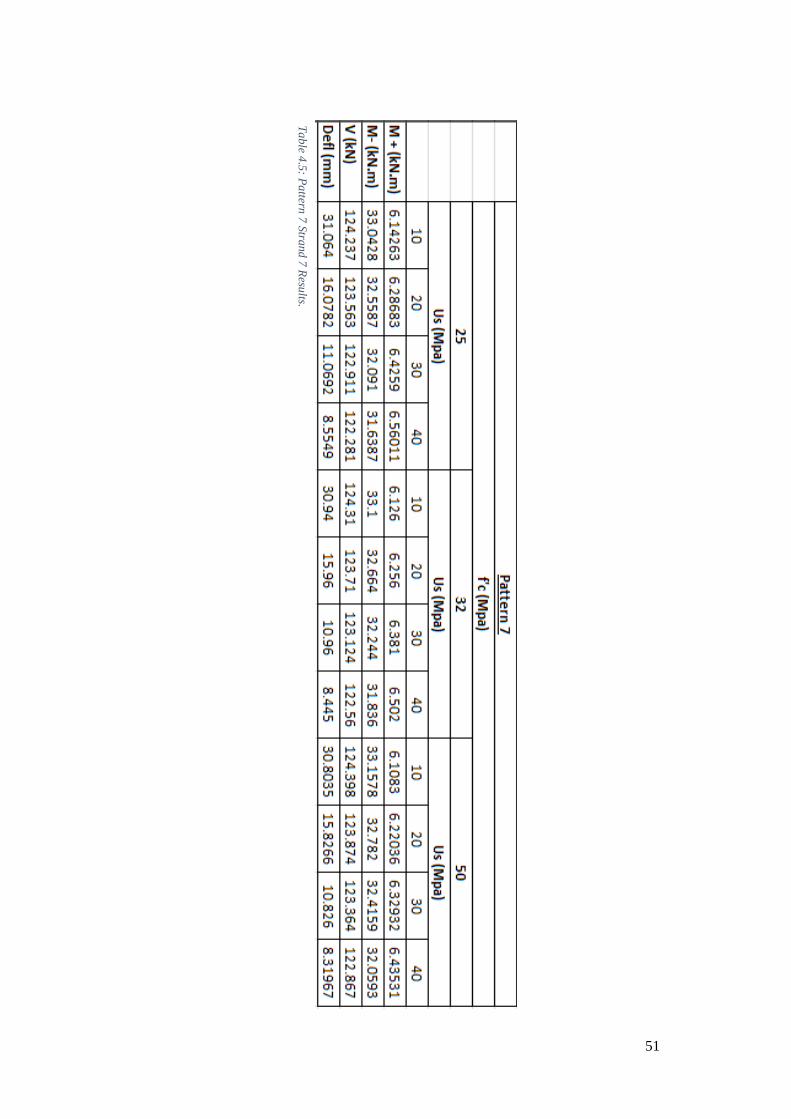
Ta
ble 4
.5: P
attern
7 S
trand
7 R
esults.
52
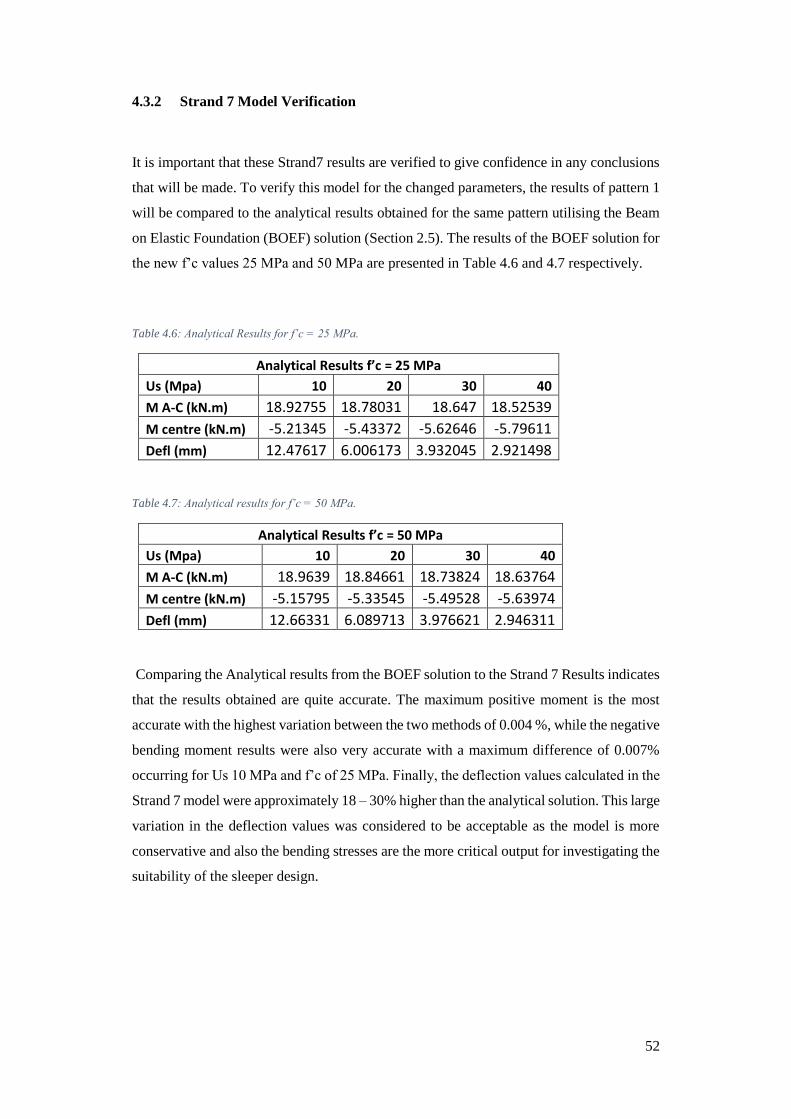
4.3.2 Strand 7 Model Verification
It is important that these Strand7 results are verified to give confidence in any conclusions
that will be made. To verify this model for the changed parameters, the results of pattern 1
will be compared to the analytical results obtained for the same pattern utilising the Beam
on Elastic Foundation (BOEF) solution (Section 2.5). The results of the BOEF solution for
the new f’c values 25 MPa and 50 MPa are presented in Table 4.6 and 4.7 respectively.
Table 4.6: Analytical Results for f’c = 25 MPa.
Analytical Results f’c = 25 MPa
Us (Mpa) 10 20 30 40
M A-C (kN.m) 18.92755 18.78031 18.647 18.52539
M centre (kN.m) -5.21345 -5.43372 -5.62646 -5.79611
Defl (mm) 12.47617 6.006173 3.932045 2.921498
Table 4.7: Analytical results for f’c = 50 MPa.
Analytical Results f’c = 50 MPa
Us (Mpa) 10 20 30 40
M A-C (kN.m) 18.9639 18.84661 18.73824 18.63764
M centre (kN.m) -5.15795 -5.33545 -5.49528 -5.63974
Defl (mm) 12.66331 6.089713 3.976621 2.946311
Comparing the Analytical results from the BOEF solution to the Strand 7 Results indicates
that the results obtained are quite accurate. The maximum positive moment is the most
accurate with the highest variation between the two methods of 0.004 %, while the negative
bending moment results were also very accurate with a maximum difference of 0.007%
occurring for Us 10 MPa and f’c of 25 MPa. Finally, the deflection values calculated in the
Strand 7 model were approximately 18 – 30% higher than the analytical solution. This large
variation in the deflection values was considered to be acceptable as the model is more
conservative and also the bending stresses are the more critical output for investigating the
suitability of the sleeper design.
53
4.3.3 Results and Discussion
The effect of the different patterns has been covered in detail in chapter 3, but it is again
clear that the assumptions made about the distribution of bearing pressure along the sleeper
for patterns 2 and 7 produce high positive and negative bending moments respectively.
The effects of changing the support modulus have been compared in stage 1 of the analysis
and again for this stage as a part of the parametric study. The comparison of loading for
different support modulus allows the sensitivity of this parameter to be evaluated. From the
above results it is evident that the variation in support modulus does not have a significant
impact on the design forces that the sleeper will experience, it only affects the amount of
deflection that occurs due to the rail loading. This is expected as the increase in support
modulus doesn’t increase the area that supports the load it simply offers increased
resistance to settlement of the sleeper into the ballast.
These results differ from the parametric study by Manalo et.al (2012), which recorded a
15% reduction of bending moment for change in support modulus from 10 to 40 MPa
assuming a uniform bearing pressure consistent with pattern 1. In comparison, for pattern
1 the average reduction for the bending moment experienced by the sleeper for increased
support modulus from 10 to 40 MPa was approximately 2%. This could be due to the
difference in the sleeper lengths which mean an increase in support modulus would have a
greater improvement on the sleeper with a larger support area. The significantly lower
sleeper modulus of 1 to 10 GPa for the fibre composite compared to the concrete sleeper
modulus of approximately 30 GPa would also reduce the effect of increasing the support
modulus. From this comparison it is inferred that the insignificant effect of the support
modulus on the design forces is reasonable for the concrete sleeper adopted for this
analysis.
One of the requirements for a concrete railway sleeper is that the longitudinal straightness
of the sleeper is within 6mm. This requirement will only be considered for pattern 1 as this
is the expected normal service support condition, while patterns 2 and 7 are only considered
for the worst case condition for strength considerations. From the Strand 7 results for
pattern 1 it can be seen that only cases with Us 30 MPa and 40 MPa meet the requirement
of < 6mm deflection, therefore only these support modulus values will be considered for
the next stage.
It can be seen from the results that the change in characteristic compressive strength has an
insignificant effect on any of the design loads or the deflection of the sleeper. This is due
to the increase in stiffness of the concrete not dramatically changing the behaviour of the
54
sleeper under loading and because it does not improve the support conditions. This result
is different to the 75% increase in bending moment calculated by Manalo et.al (2012) for
sleeper modulus increase from 1 to 10 GPa. This significant difference is believed to be
due to the much higher concrete sleeper modulus values compared to the fibre composite
sleeper. The high modulus of the concrete in comparison to the rail seat load means that
the deflection of the sleeper and the design loads are not significantly affected by the
increase in compressive strength.
Taking into consideration only support modulus 30MPa and 40 MPa and patterns 2 and 7,
it is determined that the maximum positive bending moment is 45.9 kN.m from pattern 2
and the maximum negative bending moment is 32.4 kN.m from pattern 7, both with Us =
30 MPa and f’c = 50 MPa. The maximum shear force can also be seen to be 160.7 kN from
pattern 7 for all combinations of parameters.
4.4 Conclusion
The aim of this chapter was to undertake a parametric study and determine the combination
of bearing pressure distribution pattern, support modulus and concrete character
compressive strength that would produce the highest design forces. The main findings of
this chapter are presented below:
Support modulus values of 10 MPa and 20 MPa will not be considered as they
do not meet the Australian Standard deflection requirements for a concrete
sleeper.
Characteristic compressive strength of concrete does not have a significant effect
on the performance of the sleeper.
Maximum design forces were determined as: M+ = 45.9 kN.m, M- = 32.4 kN.m
and SF = 160.7 kN for Us = 30 MPa and f’c = 50 MPa.
These design forces and parameters will now be used to determine the amount of
reinforcement required for both GFRP and steel reinforced sleeper designs. Once the
arrangement of reinforcement is determined the two sleeper types will be compared
through 3dimensial finite element modelling.
55
CHAPTER 5 Evaluation of Behaviour of Concrete Sleeper
with GFRP Reinforcement
5.1 Chapter Overview
This stage of the project involves combining the chosen critical combination of bearing
pressure distribution, support modulus and characteristic compressive strength and the
resulting design forces to determine the required reinforcement for both steel and GFRP
alternatives. Adopting an f’c value of 50 MPa and a typical cross section of a narrow gauge
concrete sleeper, the longitudinal tensile reinforcement required for both materials was
calculated and the Shear capacity of the sleeper checked.
A Finite Element Model (FEM) of both designs was then created based on the chosen
layout of reinforcement. From the results of the FEM analysis a load deflection relationship
was determined for each sleeper alternative which allows a comparison of the designs and
ultimately allows the behaviour of the GFRP reinforced concrete sleeper to be evaluated.
5.2 Sleeper Parameters
Before the reinforcement could be determined the sleeper cross section had to be chosen
and the amount of concrete cover decided. As this project considers a Queensland concrete
railway sleeper, a typical narrow gauge sleeper cross section was adopted; this can be seen
in figure 5.1.
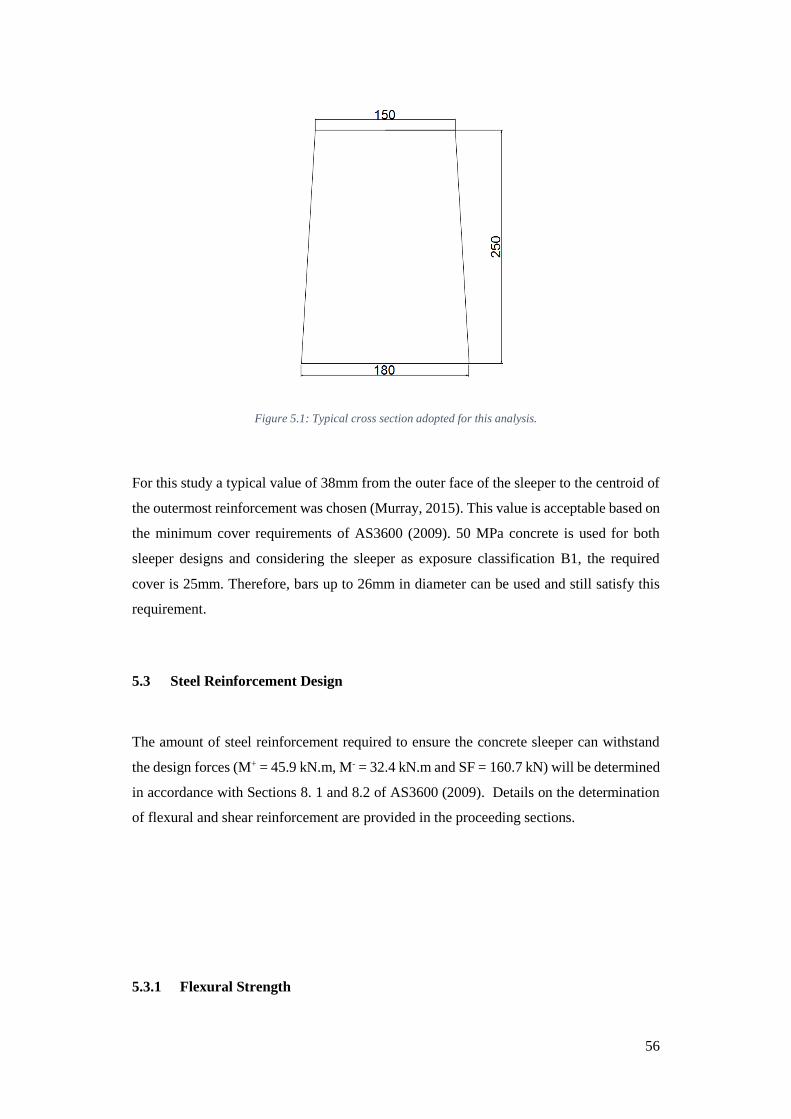
56
Figure 5.1: Typical cross section adopted for this analysis.
For this study a typical value of 38mm from the outer face of the sleeper to the centroid of
the outermost reinforcement was chosen (Murray, 2015). This value is acceptable based on
the minimum cover requirements of AS3600 (2009). 50 MPa concrete is used for both
sleeper designs and considering the sleeper as exposure classification B1, the required
cover is 25mm. Therefore, bars up to 26mm in diameter can be used and still satisfy this
requirement.
5.3 Steel Reinforcement Design
The amount of steel reinforcement required to ensure the concrete sleeper can withstand
the design forces (M+ = 45.9 kN.m, M- = 32.4 kN.m and SF = 160.7 kN) will be determined
in accordance with Sections 8. 1 and 8.2 of AS3600 (2009). Details on the determination
of flexural and shear reinforcement are provided in the proceeding sections.
5.3.1 Flexural Strength
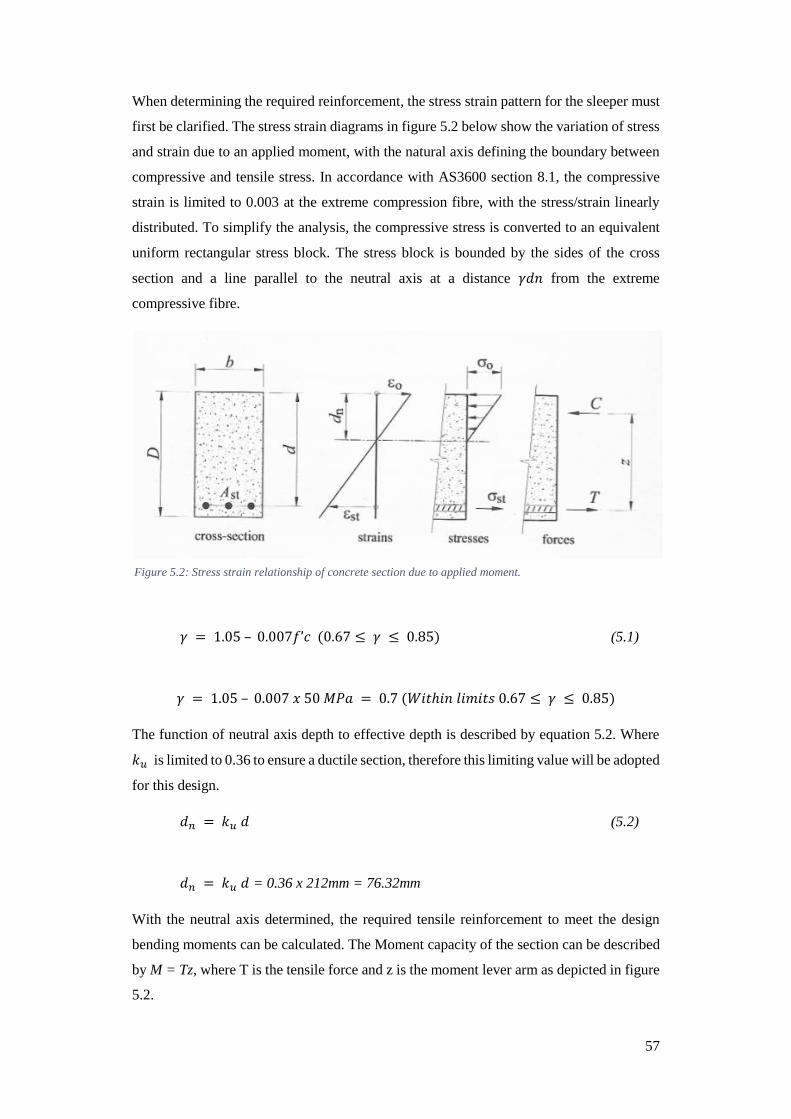
57
When determining the required reinforcement, the stress strain pattern for the sleeper must
first be clarified. The stress strain diagrams in figure 5.2 below show the variation of stress
and strain due to an applied moment, with the natural axis defining the boundary between
compressive and tensile stress. In accordance with AS3600 section 8.1, the compressive
strain is limited to 0.003 at the extreme compression fibre, with the stress/strain linearly
distributed. To simplify the analysis, the compressive stress is converted to an equivalent
uniform rectangular stress block. The stress block is bounded by the sides of the cross
section and a line parallel to the neutral axis at a distance 𝛾𝑑𝑛 from the extreme
compressive fibre.
𝛾 = 1.05 – 0.007𝑓’𝑐 (0.67 ≤ 𝛾 ≤ 0.85) (5.1)
𝛾 = 1.05 – 0.007 𝑥 50 𝑀𝑃𝑎 = 0.7 (𝑊𝑖𝑡ℎ𝑖𝑛 𝑙𝑖𝑚𝑖𝑡𝑠 0.67 ≤ 𝛾 ≤ 0.85)
The function of neutral axis depth to effective depth is described by equation 5.2. Where
𝑘𝑢 is limited to 0.36 to ensure a ductile section, therefore this limiting value will be adopted
for this design.
𝑑𝑛 = 𝑘𝑢 𝑑 (5.2)
𝑑𝑛 = 𝑘𝑢 𝑑 = 0.36 x 212mm = 76.32mm
With the neutral axis determined, the required tensile reinforcement to meet the design
bending moments can be calculated. The Moment capacity of the section can be described
by M = Tz, where T is the tensile force and z is the moment lever arm as depicted in figure
5.2.
Figure 5.2: Stress strain relationship of concrete section due to applied moment.

58
To meet the strength requirements, the reduced section moment capacity must be greater
than or equal to the design moment. The capacity reduction factor ɸ, is a function of ku as
described in equation 5.3.
ɸ = 1.19 – 13 𝑘𝑢𝑜/12 (5.3)
ɸ = 1.19 – 13 x0.36/12= 0.8
Therefore, the required moment capacity is:
𝑀𝑢 = 𝑀 ∗/ ɸ (5.4)
Therefore:
𝑀𝑢+ = 45.9 𝑘𝑁. 𝑚/ 0.8 = 57.4 𝑘𝑁. 𝑚
𝑀𝑢− = 32.4 𝑘𝑁. 𝑚/ 0.8 = 40.5 𝑘𝑁. 𝑚
The resultant compression force is approximated to occur at the midpoint of the stress
block. As the width of the sleeper changes slightly throughout the depth of the section, this
would not be the exact location of the centroid but is accurate enough for this purpose.
With this information and assuming only one layer of reinforcement for both positive and
negative bending, the moment capacity can be described (Eq. 5.5) and rearranged to find
the required area of steel reinforcement (Eq. 5.6).
𝑀𝑢 = 𝑇𝑧 = 𝐴𝑠𝑡 𝑓𝑦 (𝑑 −𝛾𝑑𝑛
2) (5.5)
∴ 𝐴𝑠𝑡 =𝑀𝑢
𝑓𝑦( 𝑑−𝛾𝑑𝑛
2) (5.6)
The calculated area of reinforcing was then converted to the equivalent required number of
bars. The required quantity of R6, N10, N12, N16 and N20 bars were calculated, to
determine the most suitable bar size for the sleeper cross section. The varying yield
strengths of the different bar types had to be considered, with these values shown in table
5.1.
Table 5.1: Bar types and their corresponding yield strength.
Bar Type Yield Strength fy (MPa)
R6 250
N10 500
N12 500
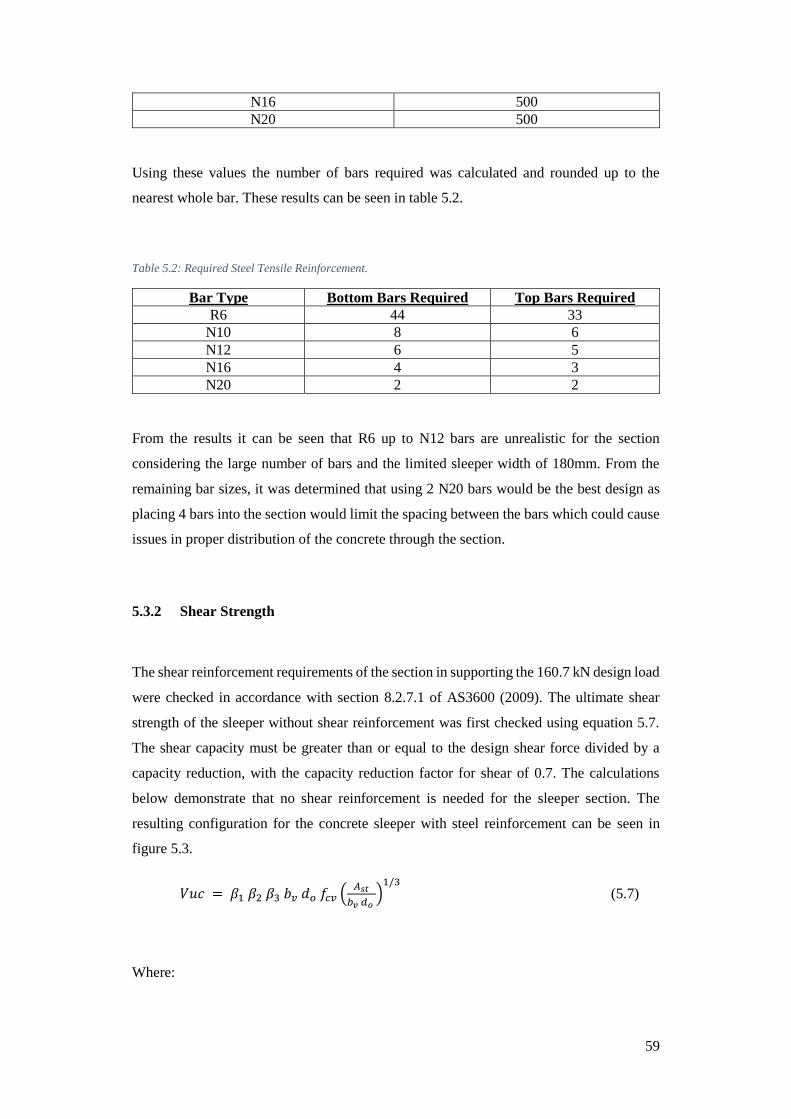
59
N16 500
N20 500
Using these values the number of bars required was calculated and rounded up to the
nearest whole bar. These results can be seen in table 5.2.
Table 5.2: Required Steel Tensile Reinforcement.
Bar Type Bottom Bars Required Top Bars Required
R6 44 33
N10 8 6
N12 6 5
N16 4 3
N20 2 2
From the results it can be seen that R6 up to N12 bars are unrealistic for the section
considering the large number of bars and the limited sleeper width of 180mm. From the
remaining bar sizes, it was determined that using 2 N20 bars would be the best design as
placing 4 bars into the section would limit the spacing between the bars which could cause
issues in proper distribution of the concrete through the section.
5.3.2 Shear Strength
The shear reinforcement requirements of the section in supporting the 160.7 kN design load
were checked in accordance with section 8.2.7.1 of AS3600 (2009). The ultimate shear
strength of the sleeper without shear reinforcement was first checked using equation 5.7.
The shear capacity must be greater than or equal to the design shear force divided by a
capacity reduction, with the capacity reduction factor for shear of 0.7. The calculations
below demonstrate that no shear reinforcement is needed for the sleeper section. The
resulting configuration for the concrete sleeper with steel reinforcement can be seen in
figure 5.3.
𝑉𝑢𝑐 = 𝛽1 𝛽2 𝛽3 𝑏𝑣 𝑑𝑜 𝑓𝑐𝑣 (𝐴𝑠𝑡
𝑏𝑣 𝑑𝑜 )
1/3 (5.7)
Where:

60
𝑉𝑢𝑐 =𝑉∗
𝜑=
160.7
0.7= 229.6 𝑘𝑁
𝛽1 = 1.1(1.6 −𝑑𝑜
1000) ≥ 1.1 (5.8)
𝛽1 = 1.1 (1.6 −212
1000) = 1.527 ≥ 1.1
𝛽2 = 𝛽3 = 1
𝑏𝑣 = 𝑏𝑎𝑣𝑒 = 162.7𝑚𝑚
𝑓𝑐𝑣 = 𝑓′𝑐1
3 ≤ 4𝑀𝑃𝑎 (5.9)
𝑓𝑐𝑣 = 501
3 = 3.68 𝑀𝑃𝑎 ≤ 4𝑀𝑃𝑎
𝐴𝑠𝑡 = 628.3𝑚𝑚2
∴ 𝑉𝑢𝑐 = 1.527 × 1 × 1 × 162.7 × 3.68 × (628.3
162.7×212)
1/3= 240.6 kN> 229.6 kN
Figure 5.3: Steel reinforcement layout.
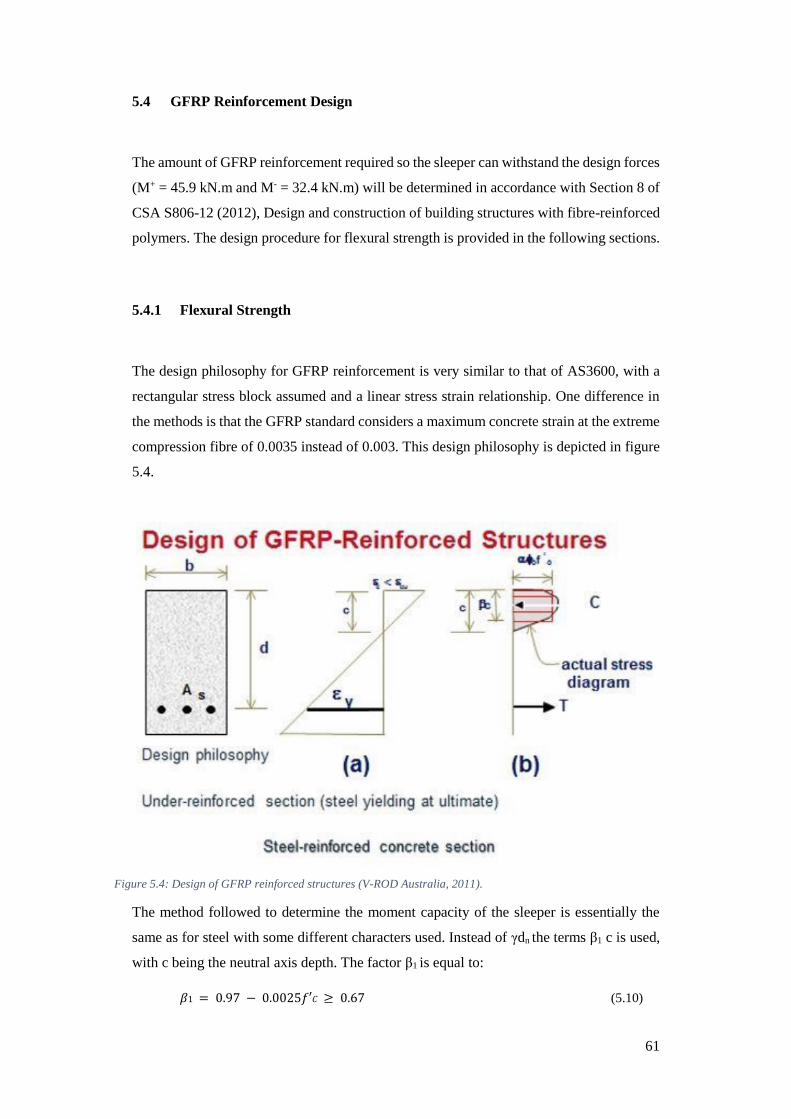
61
5.4 GFRP Reinforcement Design
The amount of GFRP reinforcement required so the sleeper can withstand the design forces
(M+ = 45.9 kN.m and M- = 32.4 kN.m) will be determined in accordance with Section 8 of
CSA S806-12 (2012), Design and construction of building structures with fibre-reinforced
polymers. The design procedure for flexural strength is provided in the following sections.
5.4.1 Flexural Strength
The design philosophy for GFRP reinforcement is very similar to that of AS3600, with a
rectangular stress block assumed and a linear stress strain relationship. One difference in
the methods is that the GFRP standard considers a maximum concrete strain at the extreme
compression fibre of 0.0035 instead of 0.003. This design philosophy is depicted in figure
5.4.
The method followed to determine the moment capacity of the sleeper is essentially the
same as for steel with some different characters used. Instead of γdn the terms β1 c is used,
with c being the neutral axis depth. The factor β1 is equal to:
𝛽1 = 0.97 − 0.0025𝑓′𝐶 ≥ 0.67 (5.10)
Figure 5.4: Design of GFRP reinforced structures (V-ROD Australia, 2011).
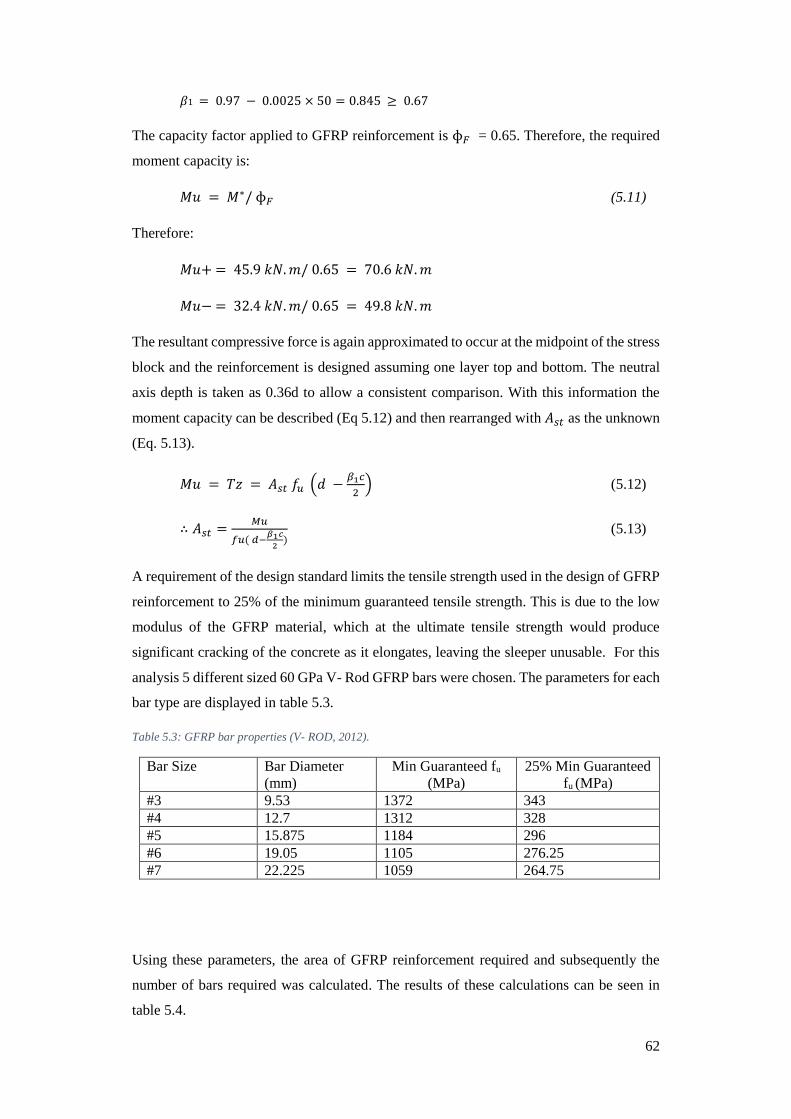
62
𝛽1 = 0.97 − 0.0025 × 50 = 0.845 ≥ 0.67
The capacity factor applied to GFRP reinforcement is ɸ𝐹 = 0.65. Therefore, the required
moment capacity is:
𝑀𝑢 = 𝑀∗/ ɸ𝐹 (5.11)
Therefore:
𝑀𝑢+ = 45.9 𝑘𝑁. 𝑚/ 0.65 = 70.6 𝑘𝑁. 𝑚
𝑀𝑢− = 32.4 𝑘𝑁. 𝑚/ 0.65 = 49.8 𝑘𝑁. 𝑚
The resultant compressive force is again approximated to occur at the midpoint of the stress
block and the reinforcement is designed assuming one layer top and bottom. The neutral
axis depth is taken as 0.36d to allow a consistent comparison. With this information the
moment capacity can be described (Eq 5.12) and then rearranged with 𝐴𝑠𝑡 as the unknown
(Eq. 5.13).
𝑀𝑢 = 𝑇𝑧 = 𝐴𝑠𝑡 𝑓𝑢 (𝑑 −𝛽1𝑐
2) (5.12)
∴ 𝐴𝑠𝑡 =𝑀𝑢
𝑓𝑢( 𝑑−𝛽1𝑐
2) (5.13)
A requirement of the design standard limits the tensile strength used in the design of GFRP
reinforcement to 25% of the minimum guaranteed tensile strength. This is due to the low
modulus of the GFRP material, which at the ultimate tensile strength would produce
significant cracking of the concrete as it elongates, leaving the sleeper unusable. For this
analysis 5 different sized 60 GPa V- Rod GFRP bars were chosen. The parameters for each
bar type are displayed in table 5.3.
Table 5.3: GFRP bar properties (V- ROD, 2012).
Bar Size Bar Diameter
(mm)
Min Guaranteed fu
(MPa)
25% Min Guaranteed
fu (MPa)
#3 9.53 1372 343
#4 12.7 1312 328
#5 15.875 1184 296
#6 19.05 1105 276.25
#7 22.225 1059 264.75
Using these parameters, the area of GFRP reinforcement required and subsequently the
number of bars required was calculated. The results of these calculations can be seen in
table 5.4.

63
Table 5.4: Required GFRP Tensile Reinforcement.
Bar Size (mm) Bottom Bars Required Top Bars Required
9.53 17 12
12.7 10 7
15.875 7 5
19.05 5 4
22.225 4 3
The results indicate that only the 22mm nominal diameter bar is suitable to fit into the cross
section and still provide acceptable spacing between bars while maintaining concrete cover.
The reduction in tensile strength with increasing bar diameter is potentially problematic for
designing smaller sections where space in the section is limited. It was considered that 4
bars in the bottom face would be too congested so 3 bars were chosen for the outermost
layer with another layer above containing 2 22mm bars. This design was again checked
against the design bending moment and met the flexural capacity requirements. The final
chosen design can be seen in figure 5.5.
Figure 5.5: GFRP reinforcement layout.
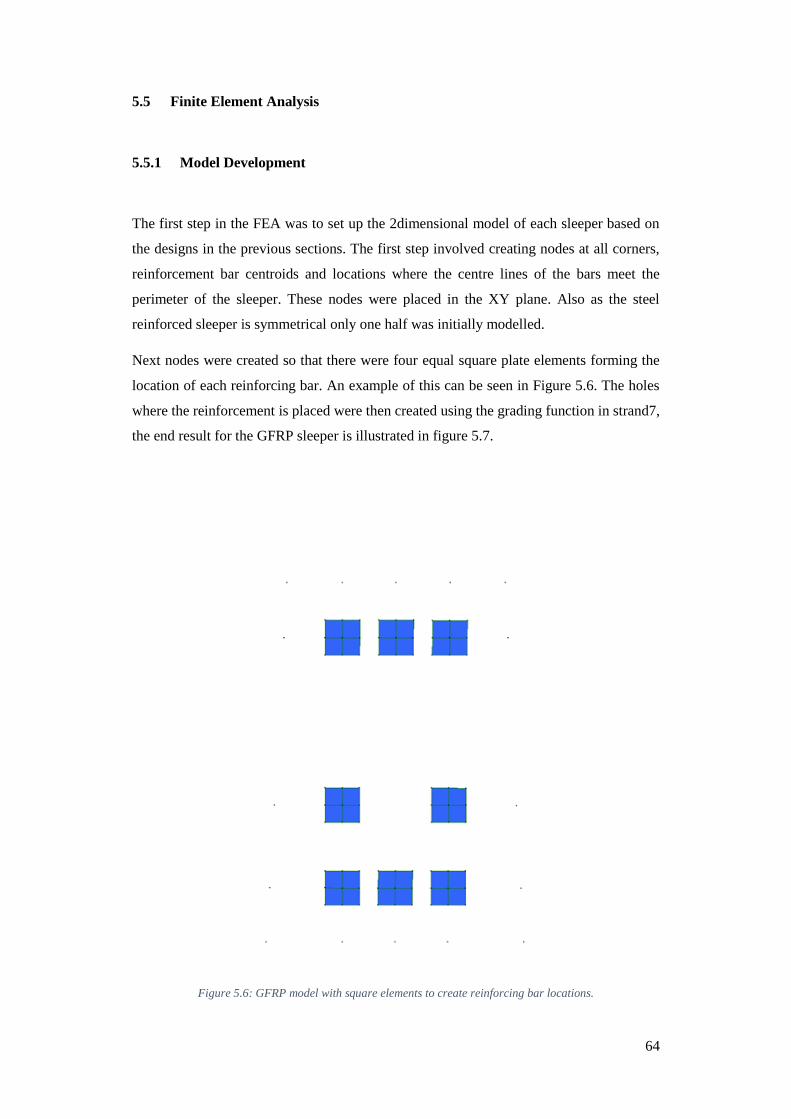
64
5.5 Finite Element Analysis
5.5.1 Model Development
The first step in the FEA was to set up the 2dimensional model of each sleeper based on
the designs in the previous sections. The first step involved creating nodes at all corners,
reinforcement bar centroids and locations where the centre lines of the bars meet the
perimeter of the sleeper. These nodes were placed in the XY plane. Also as the steel
reinforced sleeper is symmetrical only one half was initially modelled.
Next nodes were created so that there were four equal square plate elements forming the
location of each reinforcing bar. An example of this can be seen in Figure 5.6. The holes
where the reinforcement is placed were then created using the grading function in strand7,
the end result for the GFRP sleeper is illustrated in figure 5.7.
Figure 5.6: GFRP model with square elements to create reinforcing bar locations.
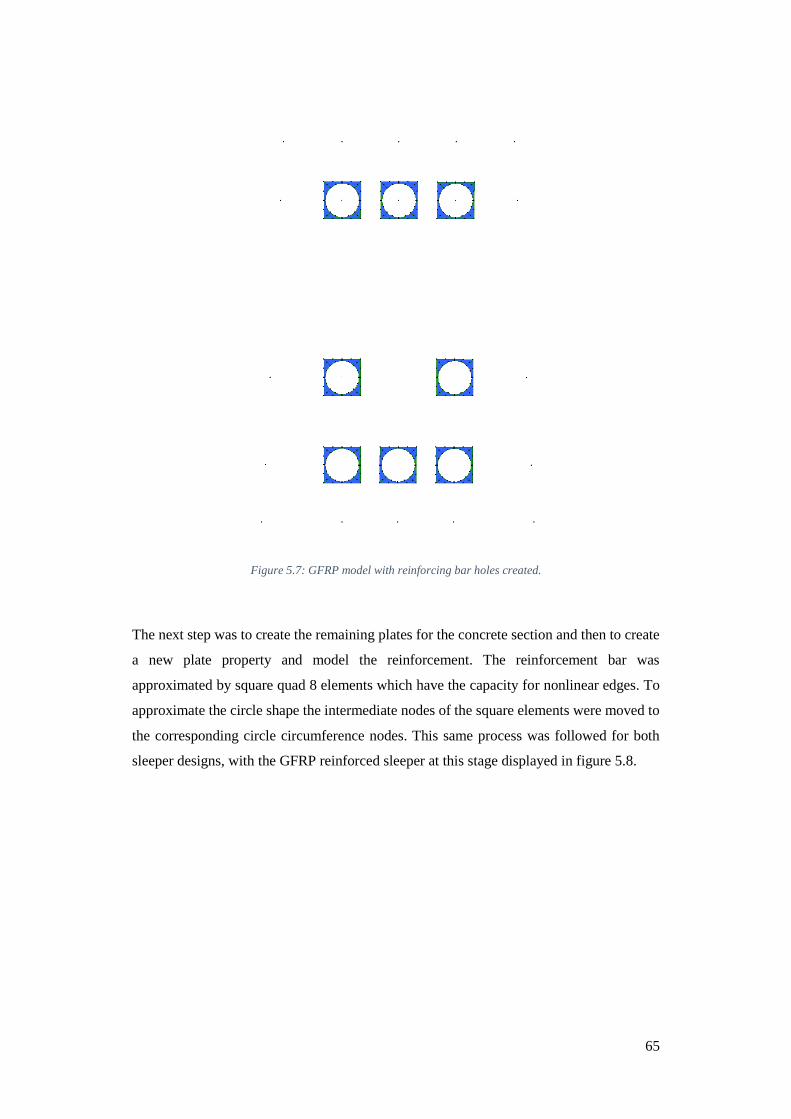
65
Figure 5.7: GFRP model with reinforcing bar holes created.
The next step was to create the remaining plates for the concrete section and then to create
a new plate property and model the reinforcement. The reinforcement bar was
approximated by square quad 8 elements which have the capacity for nonlinear edges. To
approximate the circle shape the intermediate nodes of the square elements were moved to
the corresponding circle circumference nodes. This same process was followed for both
sleeper designs, with the GFRP reinforced sleeper at this stage displayed in figure 5.8.
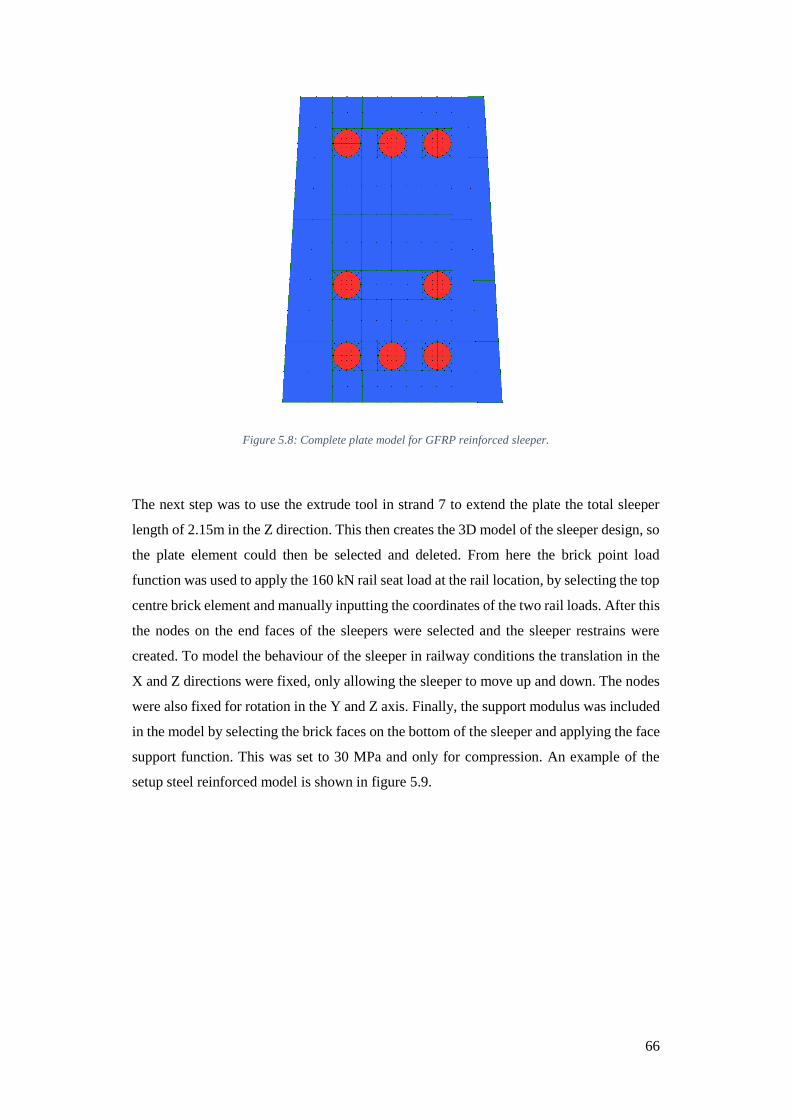
66
Figure 5.8: Complete plate model for GFRP reinforced sleeper.
The next step was to use the extrude tool in strand 7 to extend the plate the total sleeper
length of 2.15m in the Z direction. This then creates the 3D model of the sleeper design, so
the plate element could then be selected and deleted. From here the brick point load
function was used to apply the 160 kN rail seat load at the rail location, by selecting the top
centre brick element and manually inputting the coordinates of the two rail loads. After this
the nodes on the end faces of the sleepers were selected and the sleeper restrains were
created. To model the behaviour of the sleeper in railway conditions the translation in the
X and Z directions were fixed, only allowing the sleeper to move up and down. The nodes
were also fixed for rotation in the Y and Z axis. Finally, the support modulus was included
in the model by selecting the brick faces on the bottom of the sleeper and applying the face
support function. This was set to 30 MPa and only for compression. An example of the
setup steel reinforced model is shown in figure 5.9.
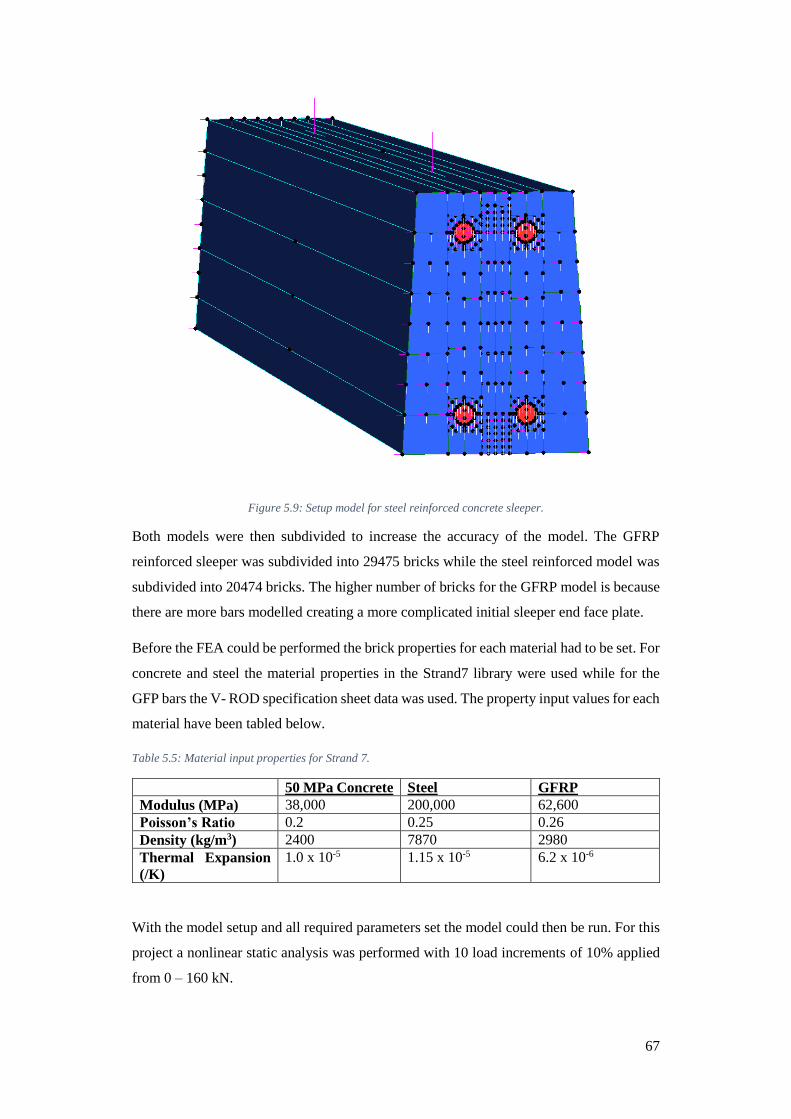
67
Figure 5.9: Setup model for steel reinforced concrete sleeper.
Both models were then subdivided to increase the accuracy of the model. The GFRP
reinforced sleeper was subdivided into 29475 bricks while the steel reinforced model was
subdivided into 20474 bricks. The higher number of bricks for the GFRP model is because
there are more bars modelled creating a more complicated initial sleeper end face plate.
Before the FEA could be performed the brick properties for each material had to be set. For
concrete and steel the material properties in the Strand7 library were used while for the
GFP bars the V- ROD specification sheet data was used. The property input values for each
material have been tabled below.
Table 5.5: Material input properties for Strand 7.
50 MPa Concrete Steel GFRP
Modulus (MPa) 38,000 200,000 62,600
Poisson’s Ratio 0.2 0.25 0.26
Density (kg/m3) 2400 7870 2980
Thermal Expansion
(/K)
1.0 x 10⁻⁵ 1.15 x 10⁻⁵ 6.2 x 10⁻⁶
With the model setup and all required parameters set the model could then be run. For this
project a nonlinear static analysis was performed with 10 load increments of 10% applied
from 0 – 160 kN.

68
5.6 Results and Discussion
From the results the location of the maximum deflection was found for both the steel
reinforced sleeper and the GFRP reinforced sleeper and then the deflection data for each
increment at these critical nodes was recorded. This data was then transferred into excel
and the load deflection behaviour of both sleeper concepts was graphed to allow a
comparison of the structural behaviour. Figure 5.10 shows this relationship.
Figure 5.10: Load- deflection relationship for alternative sleeper designs.
The results displayed in figure 10 indicate that both the GFRP reinforced sleeper and the
steel reinforced sleeper have almost identical deflection for increasing rail seat load up to
the design load of 160.7 kN. This indicates that the GFRP design performs just as well as
the traditional steel reinforced concrete sleeper for a 25 tonne axle load and narrow track
gauge.
The deformed shape of both GFRP reinforced and steel reinforced sleepers can be seen in
figures 5.11 and 5.12 respectively. From this it can be seen that the deformed shape of both
sleepers under the design rail seat load match and approximate the expected sleeper
deflected shape. This indicates that the result of the two models is as expected and allows
0
20
40
60
80
100
120
140
160
180
0.00 5.00 10.00 15.00 20.00 25.00 30.00
Rai
l Se
at L
oad
(kN
)
Maximum Deflection (mm)
Load - Deflection Relationship for Sleeper Alternatives
SteelReinforcement
GFRPReinforcement
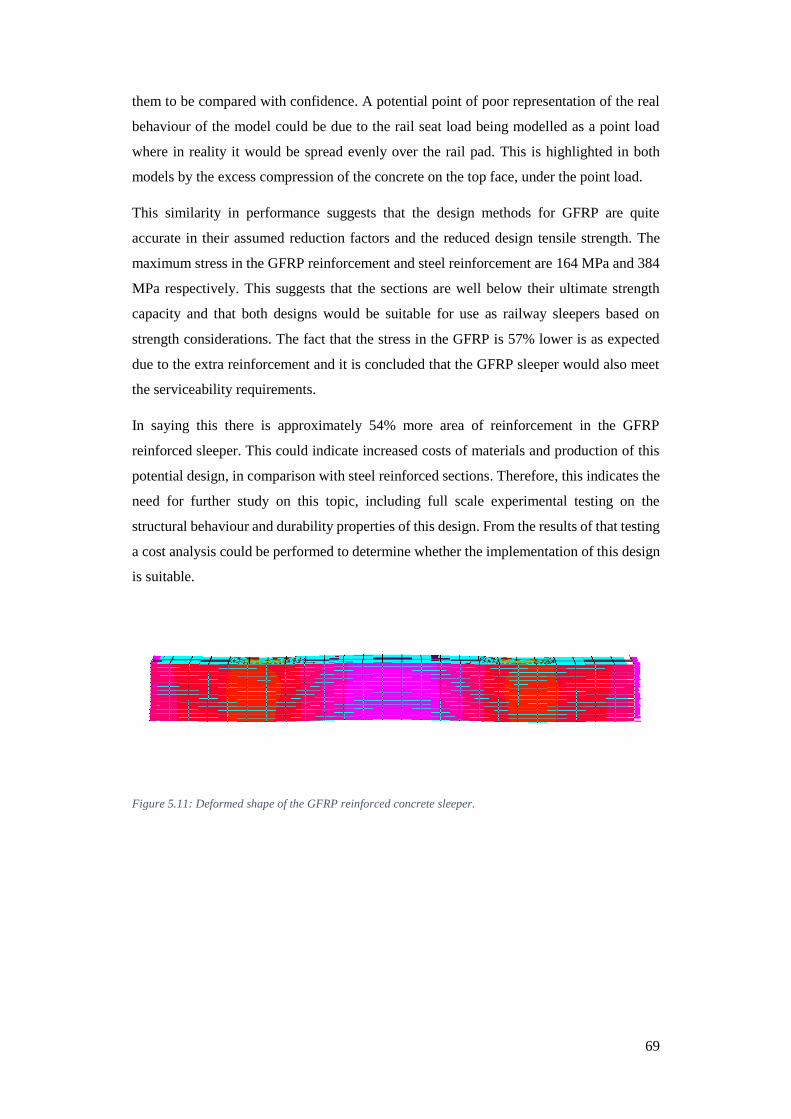
69
them to be compared with confidence. A potential point of poor representation of the real
behaviour of the model could be due to the rail seat load being modelled as a point load
where in reality it would be spread evenly over the rail pad. This is highlighted in both
models by the excess compression of the concrete on the top face, under the point load.
This similarity in performance suggests that the design methods for GFRP are quite
accurate in their assumed reduction factors and the reduced design tensile strength. The
maximum stress in the GFRP reinforcement and steel reinforcement are 164 MPa and 384
MPa respectively. This suggests that the sections are well below their ultimate strength
capacity and that both designs would be suitable for use as railway sleepers based on
strength considerations. The fact that the stress in the GFRP is 57% lower is as expected
due to the extra reinforcement and it is concluded that the GFRP sleeper would also meet
the serviceability requirements.
In saying this there is approximately 54% more area of reinforcement in the GFRP
reinforced sleeper. This could indicate increased costs of materials and production of this
potential design, in comparison with steel reinforced sections. Therefore, this indicates the
need for further study on this topic, including full scale experimental testing on the
structural behaviour and durability properties of this design. From the results of that testing
a cost analysis could be performed to determine whether the implementation of this design
is suitable.
Figure 5.11: Deformed shape of the GFRP reinforced concrete sleeper.
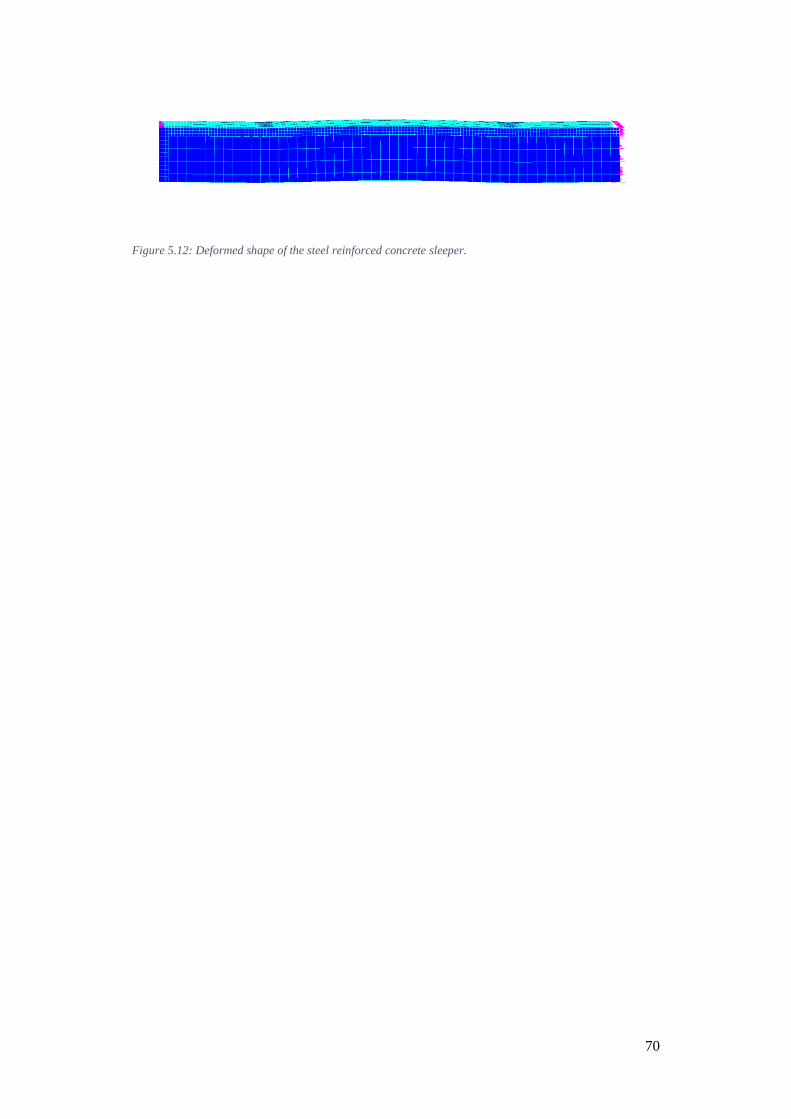
70
Figure 5.12: Deformed shape of the steel reinforced concrete sleeper.
71
5.7 Conclusion
The objective of this chapter was to combine the critical parameters and design loads
determined in the previous chapters to design the layout of both steel and GFRP
reinforcement for the narrow gauge sleeper. A finite element model was then created for
each sleeper alternative to evaluate the performance of this new sleeper concept. The main
findings of this chapter include:
Concrete sleeper required 2 N20 bars top and bottom for steel reinforcement.
Concrete sleeper required 3 #7 bars top and 5 #7 bars bottom for GFRP
reinforcement.
Load deflection behaviour of GFRP reinforced sleeper is equal to or better than
steel alternative.
Both steel and GFRP reinforcement alternatives meet the strength requirements.
54% increase in amount of reinforcement required for GFRP compared to steel.
The findings of this chapter highlight the need for further work to be done on this topic,
both experimental and theoretical. This new concept is structurally adequate but needs to
be proved to be financially feasible before it would be adopted for use in the railway
industry.

72
CHAPTER 6 Conclusions and Further Work
6.1 Conclusion
Traditional sleeper materials of timber, steel and concrete are commonly not reaching their
target design life, due to various failure mechanisms. This costs not only the railway
industry millions of dollars each year in repair work, but also cost the environment large
amounts of resources for the production of these replacement sleepers. Therefore, there is
a significant need for a more durable sleeper design. This research assessed the behaviour
of concrete sleepers reinforced with GFRP bars as a potential solution to this need.
In undertaking this assessment, the current proposed hypothetical bearing distribution
patterns for sleepers were analysed and it was found that patterns 2 and 7 (Table 3.1) gave
the highest design bending moments and shear forces. From this the critical patterns were
again analysed to determine the effect of the support modulus and the sleeper modulus. The
results indicating that the support modulus was only significant to the deflection of the
sleeper, while the sleeper modulus had little effect on either deflection or design forces.
The critical loads and the corresponding parameters were then used to determine a suitable
layout of both GFRP and steel reinforcement. The designs were then assessed using FEM
analysis, with the GFRP alternative performing slightly better than steel reinforced sleeper.
This indicates that the use of concrete sleepers reinforced with GFRP bars meets the
ultimate strength considerations, with the drawback being the excess GFRP reinforcement
required compared to steel to meet the serviceability requirements.
73
6.2 Future Work
There is still a lot more research required before the suitability of concrete sleepers
reinforced with GFRP bars can determined. Further on from this research, full scale
experimental testing on the structural behaviour of this sleeper model could be undertaken
to verify the conclusions made from the theoretical analysis performed. Analysis of a wider
gauge sleeper could also be undertaken to determine if GFRP reinforcement would be more
suitable for larger sleepers.
Further testing could be performed on the serviceability and durability performance of this
sleeper design, to quantify the benefits of this design in comparison to the sleeper materials
currently used in the industry. This could also help to determine if the amount of GFRP
reinforcement could be reduced, which make this sleeper design more appealing.
Finally, a cost benefit analysis of this sleeper design would need to be undertaken to
demonstrate the overall benefits of this new design compared to traditional materials, which
could be assessed by Railway industry for potential application of this design.
74
References
AREA 1975, ‘Manual Recommendations, Special Committee on Concrete Ties, Part
10 Concrete Ties (and -Fastenings)’, AREA Bulletin 655.
AREA 1985, ‘Manual for Railway Engineering’, American Railway Engineering
Association, Washington D.C.
Ashour, AF 2006, 'Flexural and shear capacities of concrete beams reinforced with
GFRP bars', Construction and Building Materials, vol. 20, no. 10, pp. 1005-1015,
<http://www.sciencedirect.com/science/article/pii/S0950061805001820>
Bakharev, T, Struble, LJ 1997, ‘Microstructural features of railseat deterioration in
concrete ties’, J Mater Civil Eng, vol.9, pp.146–153.
Canadian Standards Association 2012, Design and construction of building
structures with fibre-reinforced polymers, S806-12, Canadian Standards
Association, Ontario, Canada.
Clarke, CW 1957,’Track Loading Fundamentals’, The Railway Gazette.
Ferdous, W, Manalo, A 2014, ‘Failures of mainline railway sleepers and suggested
remedies – Review of current practice’, Engineering Failure Analysis, vol. 44, pp. 17-
35.
González-Nicieza, C, Álvarez-Fernández, MI, Menéndez-Díaz, A, Álvarez-Vigil, AE,
Ariznavarreta-Fernández, F 2008, ‘Failure analysis of concrete sleepers in heavy haul
railway tracks’, Engineering Failure Analysis, vol.15, pp.90–117.
Hagaman, BR, McAlpine, RJA 1991, ‘ROA timber sleeper development project’ ,
Conference on railway engineering: demand management of assets, Institution of
Engineers, Barton, ACT, Australia, pp. 233-237.
Hansard, A 1988, ‘Rail Sleepers in Australia’, Journal of the Rail Track Association,
Australian March.
Hetenyi, M 1967, ‘Beams on Elastic Foundation’, The University of Michigan Press.

75
International Federation for Structural Concrete 2006, ‘fib bulletin 37: Precast
Concrete Railway Track Systems’, state-of-the-art report.
Jeffs, T, Tew, G.P 1991, ‘SLEEPERS AND BALLAST’, A REVIEW OF TRACK DESIGN
PROCEDURES, vol. 2, pp. 31-205.
Manalo, A, Aravinthan, T, Karunasena, W & Ticoalu, A 2010, 'A review of
alternative materials for replacing existing timber sleepers', Composite Structures,
vol.92, no.3, pp.603-611,
<http://www.sciencedirect.com/science/article/pii/S0263822309003286>
Manalo, A, Aravinthan, T, Karunasena, W, Stevens, N 2012,’Analysis of a typical
railway turnout sleeper system using grillage beam analogy’, Finite Elements in
Analysis and Design, vol. 48, pp. 1376-1391.
Mohammed, T U, Otuski, N, Hisada, M and Shibata, T 2001, ‘Effect of Crack Width
and Bar Types on Corrosion of Steel in Concrete’, Journal of Material in Civil
Engineering, vol. 13, pp. 194–201.
Molded Fiber Glass Companies n.d, Technical Design Guide for FRP Composite
Products and Parts, Molded Fiber Glass Companies, viewed 20 April 2016,
<http://www.moldedfiberglass.com/sites/default/files/docs/MFG_Technical_Desig
n_Guide_FRP_Composite_0.pdf>
Morris, A, Bland, S, Monday, I 1995,’ Rail freight 1995: international benchmarking
‘, Bureau of Industry Economics, Canberra, Australia.
Murray, M 2015, ‘Heavy Haul Sleeper Design – A Rational Cost – Saving Method’,
IHHA 2015 Conference, 21 -24 June 2015, Perth, Australia.
Narayanan, RS, Beeby, AW 2005, ‘Designers’ guide to EN 1992-1-1 and EN 1992-
1-2. Eurocode 2: design of concrete structures’, General rules and rules for buildings
and structural fire design, Thomas Telford Ltd.
Neville, AM 2012, ‘Properties of concrete’, England: Longman Scientific & Technical.
ORE 1969, ‘Stresses in Concrete Sleepers, Question D17, Stresses in the Rails, the
Ballast and the Formation Resulting from traffic Loads’, Report D71/RP9/E, Utrecht.
76
O'Rourke, MD 1978, ‘Critique of Conventional Track Design Procedures as Applied
to Heavy Axle Load Conditions’, BHP Melb. Res. Labs Rep. No MRL/C77/78/27(1),
(BHP MNM HI/TDC/78/053).
Palomo, A, Jiménez, AF, Hombrados, CL, Lleyda, JL 2007, ’Railway sleepers made of
alkali activated fly ash concrete’, Revista Ingeniería de Construcción, vol.22, pp. 75-
80.
Remennikov, A & Kaewunruen, S 2005, ‘Investigation of vibration characteristics of
prestressed concrete sleepers in free-free and in-situ conditions’, Australian
Structural Engineering Conference 2005 (ASEC 2005), Newcastle, Australia,
< http://ro.uow.edu.au/cgi/viewcontent.cgi?article=1286&context=engpapers>
Rezaie, F, Shiri, MR, Farnam, SM 2012, ‘Experimental and numerical studies of
longitudinal crack control for pre-stressed concrete sleepers’, Engineering Failure
Analysis, vol. 26, pp. 21-30.
Sadeghi, J M, Youldashkhan, M 2005, ‘Investigation on the accuracy of the current
practices in analysis of railway track concrete sleepers’, International Journal of Civil
Engineering, vol. 3, no. 1.
Standards Australia 2012, Concrete Structures, AS3600, Standards Australia,
Sydney, Viewed 10 August 2016,
<http://www.saiglobal.com/online/autologin.asp>
Standards Australia 2012, Railway track material, Part 1: Steel Rails, AS1085.1,
Standards Australia, Sydney, Viewed 25 April 2016,
<http://www.saiglobal.com/online/autologin.asp>
Standards Australia 2012, Railway track material, Part 14: Prestressed concrete
sleepers, AS1085.14, Standards Australia, Sydney, Viewed 25 April 2016,
<http://www.saiglobal.com/online/autologin.asp>
Taherinezhad, J, Sofi, M, Mendis, P A and Ngo, T 2013, ‘A Review of Behaviour of
Prestressed Concrete Sleepers’, Electronic Journal of Structural Engineering, vol. 13.

77
Talbot, AN, (Chairman) et al 1918-1934, ‘Stresses in Railroad Track, Report of the
Special Committee to Report on Stresses in Railroad Track’, AREA proceedings.
Tang, WC, Lo, TY & Balendran, RV 2008, 'Bond performance of polystyrene
aggregate concrete (PAC) reinforced with glass-fibre-reinforced polymer (GFRP)
bars', Building and Environment, vol. 43, no. 1, pp. 98-107,
<http://www.sciencedirect.com/science/article/pii/S0360132306004331>
Thomas Telford 1992, ‘Durable concrete structures: design guide by Comite Euro-
International Du Beton’.
V-ROD Australia 2011, Designing with V-ROD, V-ROD Australia, viewed 25 August
2016, < http://www.vrodaustralia.com.au/wp-
content/uploads/2011/07/Designing-with-V-Rod.pdf>
V-ROD Canada 2012, V-ROD HM- 60 GPa Grade III – Oct. 2012, V-ROD Canada,
viewed 20 August 2016, < http://www.vrodcanada.com/product-data/gfrp-
specification-guide>
Zhao, J, Chan, AHC & Burrow, MPN 2006, 'Reliability analysis and maintenance
decision for railway sleepers using track condition information', J Oper Res Soc, vol.
58, no. 8, pp. 1047-1055, <http://dx.doi.org/10.1057/palgrave.jors.2602251>
Zi, G, Moon, DY, Lee, S-J, Jang, SY, Yang, SC, Kim, S-S 2012, ‘Investigation of a
concrete railway sleeper failed by ice expansion’, Engineering Failure Analysis, vol.
26, pp. 151–163.

78
Appendix A: Project Specification
ENG4111/ 4112 Research Project
Project Specification
For: Trent Baker
Title: Analysis on the behaviour of FRP reinforced concrete railway sleepers
Major: Civil Engineering
Supervisors: Allan Manalo
Enrolment: ENG4111 – ONC S1, 2016
ENG4112 – ONC S2, 2016
Project Aim: To analyse the behaviour of precast concrete railway sleepers reinforced
with glass fibre reinforced polymer (GFRP) bars and examine the
suitability of this new railway sleeper concept.
Programme: Issue A, 16th March 2016
1. Research background information on the design and analysis of concrete railway
sleepers.
2. Compare and evaluate the existing equations and theories for calculating the
maximum positive and negative bending moment and shear forces that the
sleepers are subjected to, using theoretical and Finite Element Modelling (FEM)
analyses.
3. Perform parametric investigations utilising either theoretical or FEM analysis to
determine the effect of important design parameters on the behaviour of precast
concrete sleepers and evaluate against the performance requirements for a
Queensland precast concrete railway sleeper.
4. Evaluate the structural behaviour of the precast concrete sleeper reinforced with
GFRP bars and compare with the performance of an existing precast concrete
sleeper reinforced with steel reinforcement, using FEM simulation.
If time and resources permit:
5. Perform full-scale experimental testing of a precast concrete sleeper reinforced
with GFRP bars to verify the results of the FEM simulation.