Embed Size (px)
Citation preview

Copyright 2012 FUJITSU LABORATORIES LTD.
Ryo ISHIZAKI
Fujitsu Laboratories Ltd.
Analysis of XBRL Reports Using Text Mining
25th XBRL International Conference Nov. 6-8, 2012

Copyright 2012 FUJITSU LABORATORIES LTD.
Background of the Research
The Research of Analysis Technologies in Fujitsu Labs.
We have worked on developing of text mining technologies in various domains. In some approaches, we tried to conduct an analysis that utilizes business information described in Annual Securities Reports. However, we could not it well because of some problems of Data availability and Data formatting.
Progress of Data usability by XBRL
Recently, Annual Securities Reports have become available online. And its XBRL specification will be extended to the textual parts in 2013.
Analysis of XBRL Reports and Discussion
So, we tried analyzing Annual Securities Reports. We will show the progress of our research, and we want to discuss about the effective use of XBRL reports using
1

Copyright 2012 FUJITSU LABORATORIES LTD.
Outline
Part1: What is Text Mining?
Overview of text mining technologies and its applications
Part2: Application of Text Mining to XBRL Reports
Analysis of annual securities reports
Part3: Discussion
2

Copyright 2012 FUJITSU LABORATORIES LTD.
Part1:
What is Text Mining?
What is Mining?
Technologies for Text Mining
Examples of Text Mining
Applications
3
Copyright 2012 FUJITSU LABORATORIES LTD.
What is Mining?
Data Mining and Text Mining
Data Mining: Knowledge discovery from numerical or categorical data
e.g.) Basket analysis on POS data in supermarket which reveals that paper diaper and canned beer are often bought together.
Text Mining: Knowledge discovery from textual data
e.g.) Analysis on Q&A log data in call center to find out consumer’s needs, wants, claims and so on.
Why textual data is important?
To find out unexpected (but described) knowledge i.e.) questionnaire: choice (categorical) answer is for confirmatory
analysis free (textual) answer is for exploratory analysis
Combination of data and text mining
Successful approach is to detect trends and changes with data mining, and to figure out reasons and causes with text mining.
4

Copyright 2012 FUJITSU LABORATORIES LTD.
Technologies for Text Mining
Natural Language Processing Technology To extract the semantic contents from textual
description
Visualization Technology To grasp the overview, characteristics and relations
To extract the semantic contents
e.g. Marketing To extract “reputations“ and "complaints" among customers
e.g. Patent Analysis To extract “purpose“ and “object" of a patent
Visualize the overview, characteristics and relations
Idea & Realization
Analysts
Support Various information sources
Natural Language Processing Technology
Visualization Technology
On the Web
In companies
and so on..
5
Copyright 2012 FUJITSU LABORATORIES LTD.
Natural Language Processing Technology
Visualization
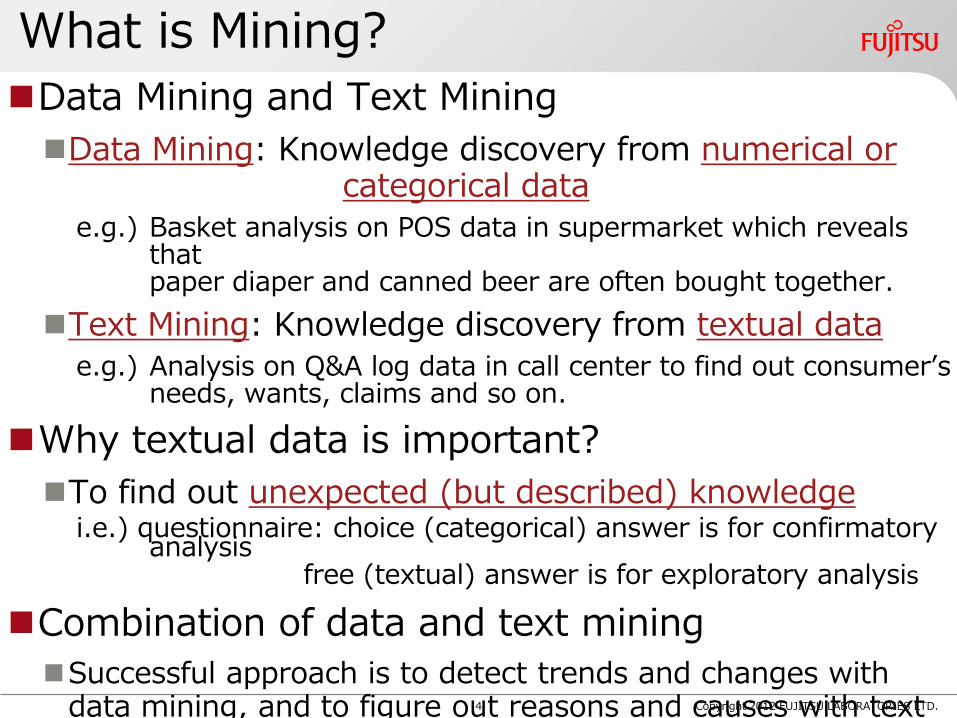
【Sequence】 Titanic, which the entire world was keeping its eye on, was thought to be an unsinkable ship. On April 10, 1912, it left the British port of Southampton toward New York in the US on her maiden voyage with about 2,220 passengers and crew on board a month after its original scheduled departure. After starting on the voyage, …
【Cause】 The direct cause of this accident was a collision with an iceberg. The hull consisted of a large number of compartments, …
Term Extraction Extract words/phrases from textual description entire world, keep one’s eye on, left the British port,
maiden voyage, original scheduled departure, …
Trouble Report
Term Weighting Iceberg, visibility → appeared in some reports → keyword cause, accident → appeared in every report → common word
Calculation of Co-occurrences Iceberg and collision → often used together → strong relationignore and warning → often used together → strong relation
the Titanic accident
Concept Map
Automatic Classificatio
n
Sequential Analysis
6

Copyright 2012 FUJITSU LABORATORIES LTD.
Examples of Text Mining Applications Patent Mining To analyze and evaluate patents to build and grow a
strong patent portfolio
Proactive Risk Management To prevent or avoid troubles before occurrence
Automatic Generation of Near-miss Map To specify areas/spots are strongly related to traffic
accidents
Market Defect Detection To detect sign of malfunctions with products in the
market
7

Copyright 2012 FUJITSU LABORATORIES LTD.
Summery of Part1:What is Text Mining ? Knowledge discovery from textual data
Core technologies Natural Language Processing Technology to extract
the semantic contents from textual data
Visualization Technology to grasp the overview, characteristics and relations
Application to various domains and purposes.
8

Copyright 2012 FUJITSU LABORATORIES LTD.
Part2:
Application of Text Mining to XBRL
Reports(Annual Securities Reports)
Overview of Annual Securities Reports
Comparison Analyses of Description
Contents
9

Copyright 2012 FUJITSU LABORATORIES
LTD.
Sections of Annual Securities Reports There are
7 chapters, 25 sections (in general).
9 sections are mainly described by textual information.
We focused on only these sections in our analysis.
1.Overview of company
1.Summary of business results
2.Company history
3.Description of business
4.Overview of group entities
5.Information about employees
2.Overview of business
1.Overview of business results
2.Overview of production, orders received and sales
3.Issues to address
4.Business risks
5.Critical contracts for operation
6.Research and development activities
7.Analysis of financial position, operating results …
3.Information about facilities
1.Overview of capital expenditures, etc.
2.Major facilities
3.Planned additions, retirements, etc. of facilities
4.Information about reporting company
1.Information about shares, etc.
2.Acquisitions, etc. of treasury shares
3.Dividend policy
4.Historical records of share price
5.Information about officers
6.Explanation about corporate governance, etc.
5.Financial information
1.Consolidated financial statements, etc.
2.Financial statements, etc.
6.Overview of operational procedures for shares
7.Reference information of reporting
1.Information about parent company, etc. …
2.Other reference information
…Sections that describe narrative information
10

Copyright 2012 FUJITSU LABORATORIES LTD.
Image of Process for Analysis
Annual Securities Reports
Company X FY 2007
[volume of] description Existence of
Company Y FY 2007
[volume of] description Existence of
Company Y FY 2008
[volume of] description Existence of
Company X FY 2008
[volume of] description Existence of
1.Preprocessing (Splitting sections)
2.Natural Language
Processing (Keyword
Extraction & Aggregation)
3. Analysis & Visualization
Keywords A B C …
FY 2
007 c
om
pany X
section 1
5 0 1 …
section 2
4 1 2 …
section 3
3 0 1 …
… … … … …
com
pany Y
section 1
3 1 3 …
section 2
4 1 2 …
section 3
7 0 2 …
… … … … …
… … … … … …
FY 2
008 c
om
pany X
section 1
2 2 1 …
section 2
4 1 2 …
section 3
3 0 1 …
… … … … …
Overview of “Business risks” Analysis among Industries
Comparing Company X and Y Comparing FY 2007 and
2008
1 Overview of
1-1 Summary of business
1-2 Company history
1-3 Description
1-4 Overview of gr
1-5 Information
2 Overview
2-2 Overview of
2-3 Issues to address
2-4 Business risks
2-5 Critical contracts
3-2 Major facilities
3-3 Planned additions,.
Aggregation Table
Sales
Acquisition
R&D
→5
→2
→10
Keywords
11
Copyright 2012 FUJITSU LABORATORIES LTD.
Comparing Sections by Description
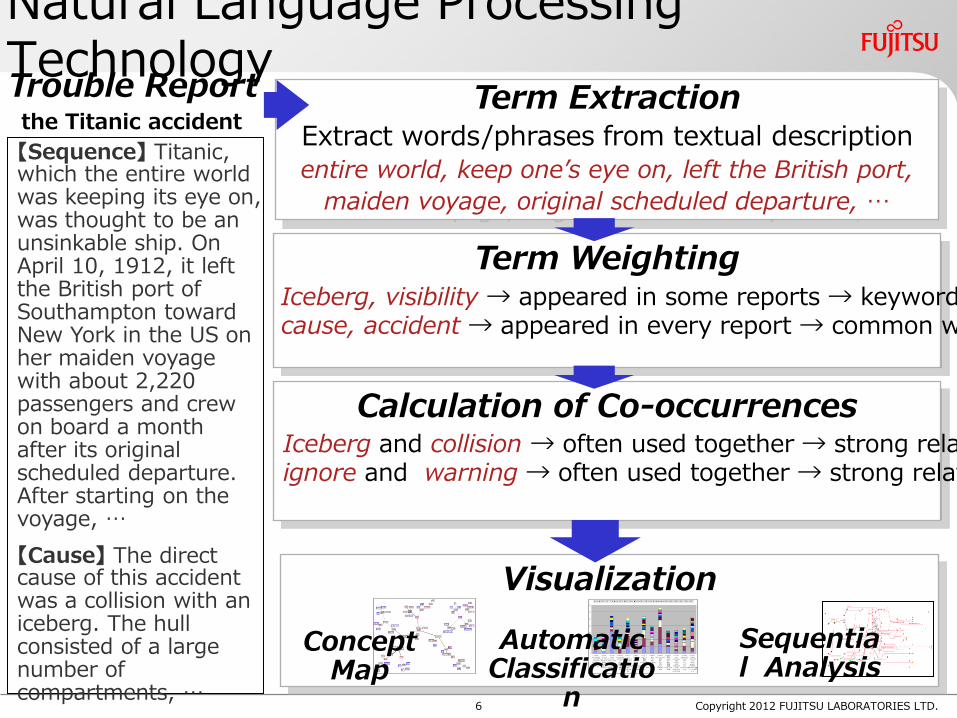
Amounts Upper 3 figures indicate that many companies
tend to describe a large amount of text.
Lower 3 figures indicate that many companies tend to describe a small amount of text.
Overview of business results
Analysis of financial position, operating
results and cash flows
Explanation about corporate governance,
etc.
Issues to address Business risks Research and development activities
Description Amount
Num
ber o
f com
panie
s
The companies in some industries
don’t have R&D department.
12

Copyright 2012 FUJITSU LABORATORIES LTD.
Purpose To reveal differences among industries
Target Text Section “Business risks” that describes about business
risks that the company takes
Text mining tool “Complex Skeleton Map” to visualize relations among
keywords represent “Industry” and keywords related with “Risk”
Analysis 1: Analysis of Differences among Industries
13

Manufacturing
Service Wholesales
Transportation &Communication
Finance and insurance
Construction
Real estate Electric power
1 Influence Influence Influence Influence Influence Influence Possibility Influence 2 Possibility Possibility Possibilit
y Possibility Possibility Possibility Influence Possibility
3 Decision Business Decision Business Risk Decision Business Business
11 Occurrence Important
Important
Important System Work Occurrence
System
12 Fluctuation Investment
Sales Fluctuation Fluctuation
Investment
Interest Decision
13 Sales Information
Product Future Trust Situation Building Disaster
14 Price Future Description
Investment Important Important Investment
Information
15 Manufacturing
Control Control Regulation Situation Price Description Facility
16 Important Descriptio Future Financial Informatio Fluctuatio Trend Adjustment
Copyright 2012 FUJITSU LABORATORIES LTD.
The characteristic keywords(“Disaster”, ”Facility” in Electric Power) of each industry are ranked lower than generic keywords(“Influence”, “Possibility” and so on).
It is unclear whether there is any relation among industries.
Analysis 1: Analysis of Differences among Industries
Characteristic keywords in each industry
…
…
…
…
…
…
…
…
…
14

Analysis 1: Analysis of Differences among Industries
By using “Complex Skeleton Map”, we can figure out relations among industries.
Copyright 2012 FUJITSU LABORATORIES LTD. 15
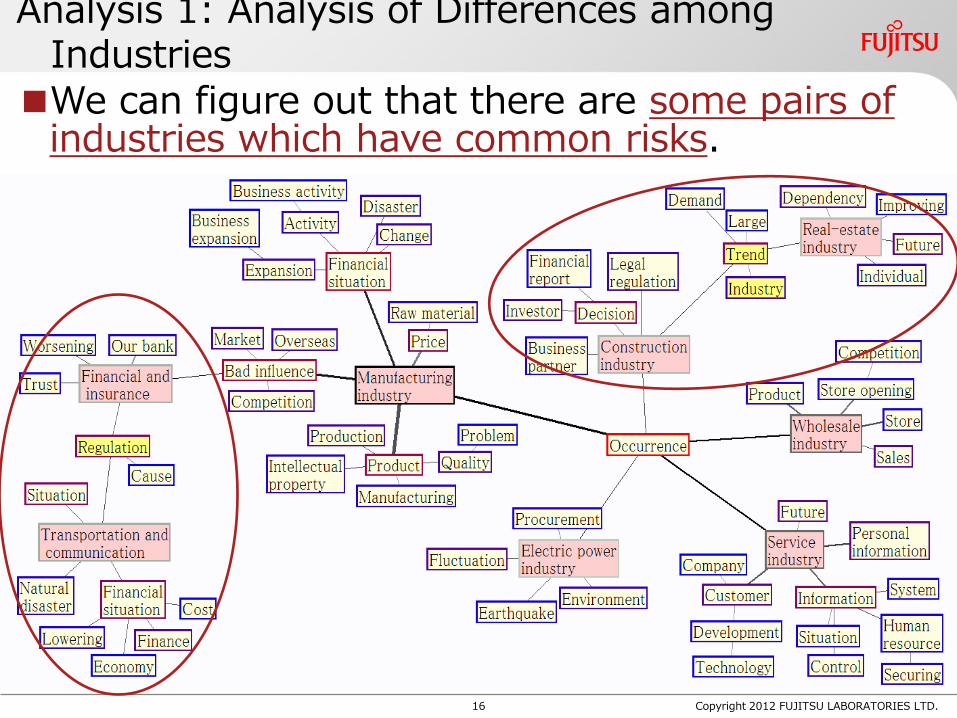
Analysis 1: Analysis of Differences among Industries
Copyright 2012 FUJITSU LABORATORIES LTD.
We can figure out that there are some pairs of industries which have common risks.
16
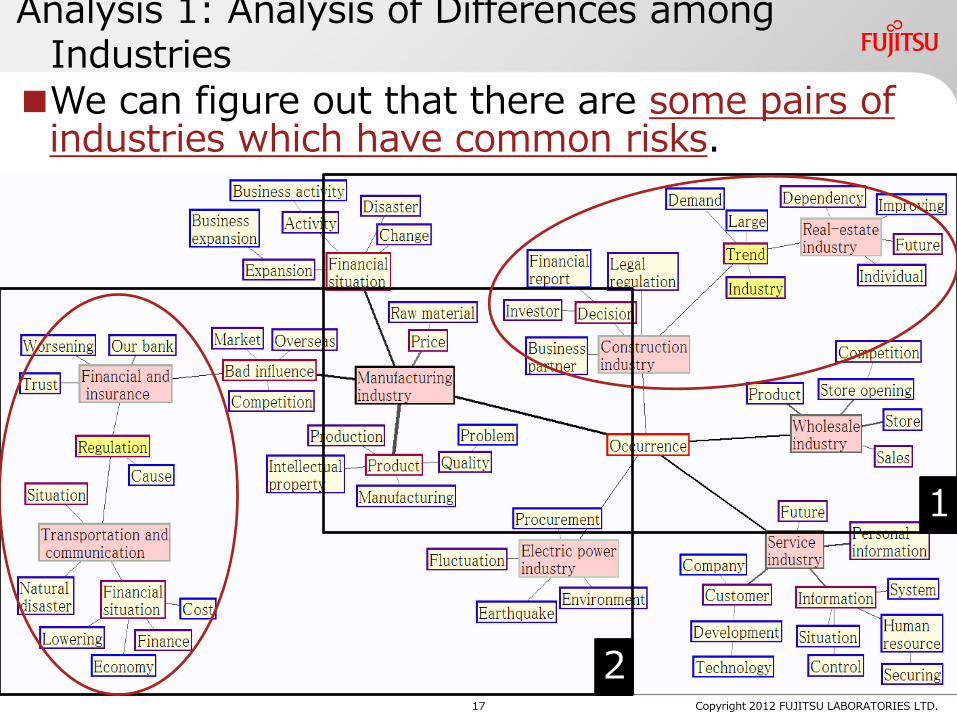
Analysis 1: Analysis of Differences among Industries
We can figure out that there are some pairs of industries which have common risks.
Copyright 2012 FUJITSU LABORATORIES LTD.
1
2 17

Analysis 1: Analysis of Differences among Industries
Copyright 2012 FUJITSU LABORATORIES LTD.
“Real estate” and “Construction” are influenced strongly by “industry trends”
These words represent “Industry
trend”
1 18

Analysis 1: Analysis of Differences among Industries
Copyright 2012 FUJITSU LABORATORIES LTD.
“Finance and insurance” and “Transportation” are influenced strongly by “regulations”.
2
We can see “Regulation”.
19
Copyright 2012 FUJITSU LABORATORIES LTD.
Analysis 2: Analysis of an Event Influence
Purpose To reveal the influence of an event
Target Text Section “Overview of business results” that describes
about business circumstance around the company
Text mining tool
“Comparison Map” to compare a text group and another text group
20

Copyright 2012 FUJITSU LABORATORIES LTD.
Financial crisis
Future
World-wide
Recession
Rapid
Slump
Sub-prime loan
Cooling down
FY2007 FY2008
Keywords that often appear in FY2008
Keywords that often appear in FY2007
By comparing FY2007 and FY2008, we can figure out the influence of “World Finance Crisis”.
Frequency of appearance
Residence
Architecture
Sales Profit
Market
Cost
Price Oil price Unclarity
Analysis 2: Analysis of an Event Influence
21

Copyright 2012 FUJITSU LABORATORIES LTD.
Financial crisis
Future
World-wide
Recession
Rapid
Slump
Sub-prime loan
Cooling down
FY2007 FY2008
“World financial crisis” started from “Sub-prime loan problem” that occurred in FY2007.
We can find “Sub-prime loan” in keywords of FY2007.
Residence
Architecture
Sales Profit
Market
Cost
Price Oil price Unclarity
“Sub-prime loan” was found in FY2007.
Analysis 2: Analysis of an Event Influence
22

Copyright 2012 FUJITSU LABORATORIES LTD.
Financial crisis
Future
World-wide
Recession
Rapid
Slump
Sub-prime loan
Cooling down
FY2007 FY2008
“Sub-prime loan problem" spread into “World financial crisis" in FY2008.
We can figure out the influence of “World Finance Crisis” that was indicated by “Recession”, ”Cooling down” and “Slump”.
Residence
Architecture
Sales Profit
Market
Cost
Price Oil price Unclarity
They represent the influence.
They represent “World financial crisis”.
Analysis 2: Analysis of an Event Influence
23
Copyright 2012 FUJITSU LABORATORIES LTD.
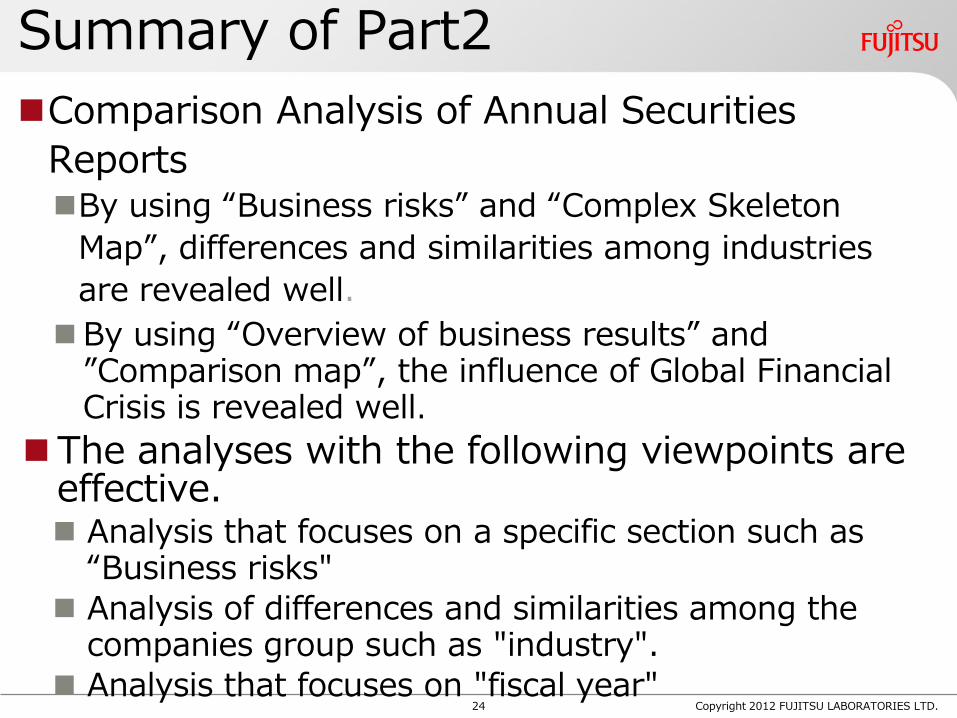
Summary of Part2
Comparison Analysis of Annual Securities
Reports By using “Business risks” and “Complex Skeleton
Map”, differences and similarities among industries
are revealed well.
By using “Overview of business results” and ”Comparison map”, the influence of Global Financial Crisis is revealed well.
The analyses with the following viewpoints are effective. Analysis that focuses on a specific section such as
“Business risks"
Analysis of differences and similarities among the companies group such as "industry".
Analysis that focuses on "fiscal year" 24

Copyright 2012 FUJITSU LABORATORIES LTD.
PART3:
Discussion
25

1.Overview of company
1.Summary of business results
2.Company history
3.Description of business
4.Overview of group entities
5.Information about employees
2.Overview of business
1.Overview of business results
2.Overview of production, orders received and sales
3.Issues to address
4.Business risks
5.Critical contracts for operation
6.Research and development activities
7.Analysis of financial position, operating results …
3.Information about facilities
1.Overview of capital expenditures, etc.
2.Major facilities
3.Planned additions, retirements, etc. of facilities
4.Information about reporting company
1.Information about shares, etc.
2.Acquisitions, etc. of treasury shares
3.Dividend policy
4.Historical records of share price
5.Information about officers
6.Explanation about corporate governance, etc.
5.Financial information
1.Consolidated financial statements, etc.
2.Financial statements, etc.
6.Overview of operational procedures for shares
7.Reference information of reporting
1.Information about parent company, etc. …
2.Other reference information Copyright 2012 FUJITSU LABORATORIES LTD.
Scope Extension of XBRL in FY2013 The target of
XBRL will be extended to all sections.
XBRL Scope from FY 2013
XBRL Scope until FY 2012
Extension
Only Primary Financial Statement
All Sections (Including Text Parts)
26
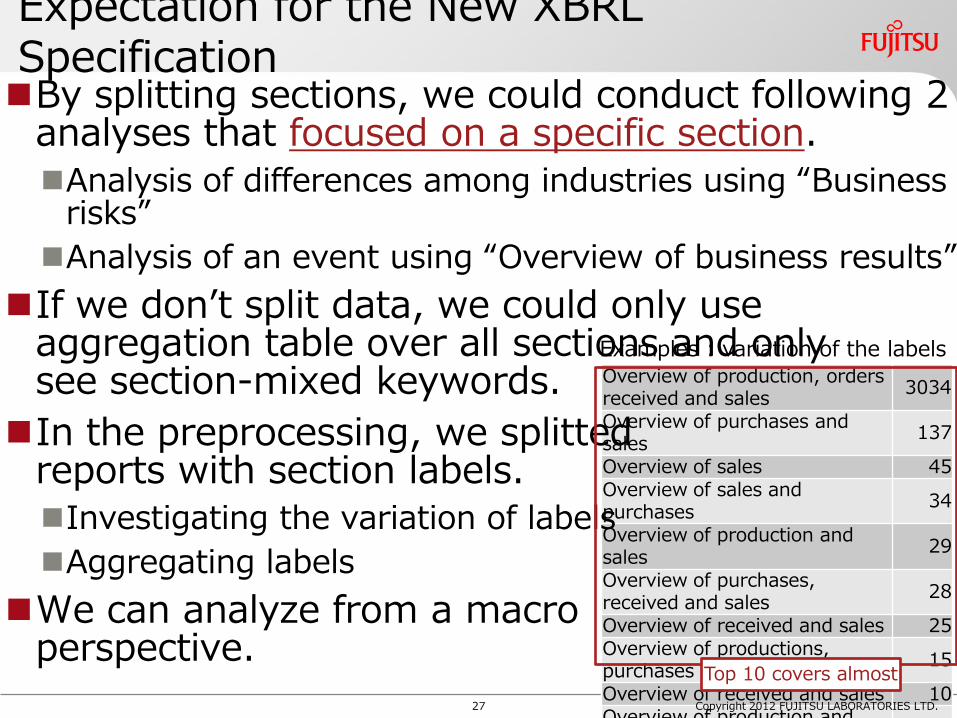
Overview of production, orders received and sales
3034
Overview of purchases and sales
137
Overview of sales 45 Overview of sales and purchases
34
Overview of production and sales
29
Overview of purchases, received and sales
28
Overview of received and sales 25 Overview of productions, purchases and sales
15
Overview of received and sales 10 Overview of production and
8
Copyright 2012 FUJITSU LABORATORIES LTD.
Expectation for the New XBRL Specification By splitting sections, we could conduct following 2
analyses that focused on a specific section. Analysis of differences among industries using “Business
risks”
Analysis of an event using “Overview of business results”
If we don’t split data, we could only use aggregation table over all sections and only see section-mixed keywords.
In the preprocessing, we splitted reports with section labels. Investigating the variation of labels
Aggregating labels
We can analyze from a macro perspective.
Examples : variation of the labels
Top 10 covers almost
27
Copyright 2012 FUJITSU LABORATORIES LTD.
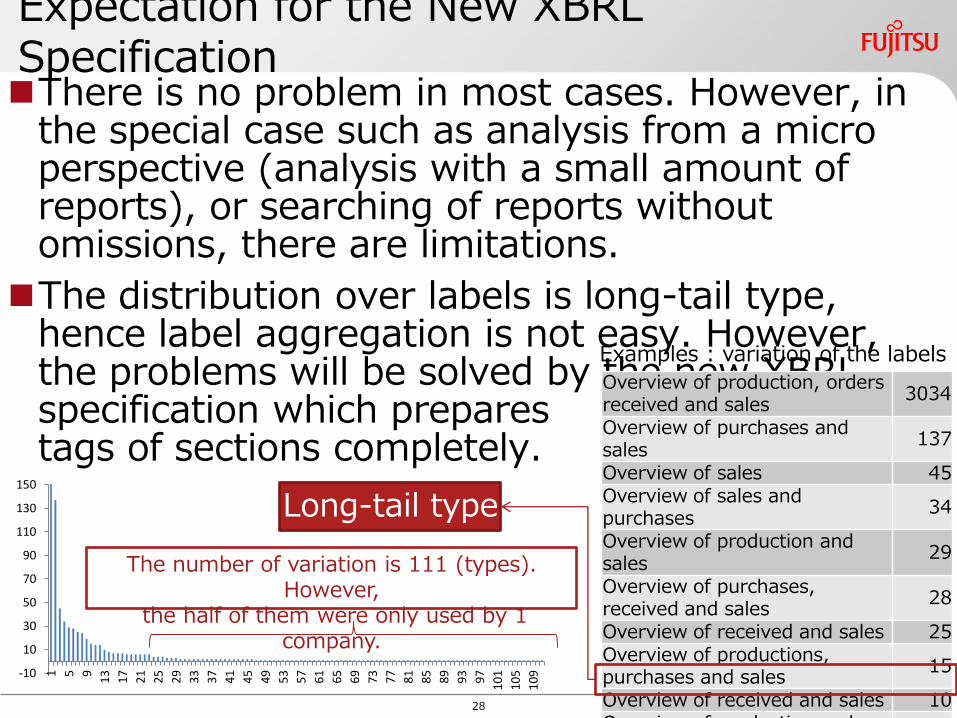
Expectation for the New XBRL Specification There is no problem in most cases. However, in
the special case such as analysis from a micro perspective (analysis with a small amount of reports), or searching of reports without omissions, there are limitations.
The distribution over labels is long-tail type, hence label aggregation is not easy. However, the problems will be solved by the new XBRL specification which prepares tags of sections completely.
-10
10
30
50
70
90
110
130
150
1
5
9
13
17
21
25
29
33
37
41
45
49
53
57
61
65
69
73
77
81
85
89
93
97
10
1
10
5
10
9
Long-tail type
The number of variation is 111 (types). However,
the half of them were only used by 1 company.
Overview of production, orders received and sales
3034
Overview of purchases and sales
137
Overview of sales 45 Overview of sales and purchases
34
Overview of production and sales
29
Overview of purchases, received and sales
28
Overview of received and sales 25 Overview of productions, purchases and sales
15
Overview of received and sales 10 Overview of production and
Examples : variation of the labels
28
Copyright 2012 FUJITSU LABORATORIES LTD.
Analysis Patterns on XBRL Reports Analysis that uses only textual data The analysis that focuses on “Business risks”, to figure
out what kinds of risks are considered among companies
The relation between “Business risks” and “Issues to address”, to reveal whether a company takes measures
Analysis that combines textual data and numerical data To reveal whether a company gets returns of research
investment, with the use of the relation between “Research and development activities” and R&D expense in Financial Statement
Analysis that combines XBRL reports and other data To rate patents evaluating how much the business
and purpose of patent are matched, with the use of
29

Copyright 2012 FUJITSU LABORATORIES LTD.
Analysis Patterns on XBRL Reports Analysis with sequential analyzing technology
applying to non textual data To reveal the propagation of the impact of a
bankruptcy (chain bankruptcy) with the use of dealing relations
Analysis that uses text of section that does not mainly describe about narrative information To help bank to finance by automatic screening with
the use of explanatory notes to Financial Statements
We would like other opinions about analysis patterns orthe effective use of XBRL Reports with text mining.
30

Copyright 2012 FUJITSU LABORATORIES LTD. 31 Copyright 2012 FUJITSU LABORATORIES LTD. 31