Embed Size (px)
Citation preview
University of Connecticut University of Connecticut
OpenCommons@UConn OpenCommons@UConn
Holster Scholar Projects Honors Scholar Program
Fall 2021
Analysis of Tri-lineage Collagen Reporter Mice Growth Plates Analysis of Tri-lineage Collagen Reporter Mice Growth Plates
Through Light Sheet Microscopy Through Light Sheet Microscopy
Olivia Ferrigno University of Connecticut - Storrs, [email protected]
Follow this and additional works at: https://opencommons.uconn.edu/srhonors_holster
Part of the Developmental Biology Commons
Recommended Citation Recommended Citation Ferrigno, Olivia, "Analysis of Tri-lineage Collagen Reporter Mice Growth Plates Through Light Sheet Microscopy" (2021). Holster Scholar Projects. 32. https://opencommons.uconn.edu/srhonors_holster/32
Analysis of Tri-lineage Collagen
Reporter Mice Growth Plates
Through Light Sheet Microscopy
Olivia Ferrigno
Mentor: Dr. Liisa Kuhn
The University of Connecticut May 2021 - August 2021
ABSTRACT
The growth plate is an active area of cartilage in the long bones of children. Its main function is
to enable limb lengthening, but is a relatively weak structure that is prone to fractures and
injuries. These injuries can have severe long term ramifications, as they can create premature
bone fusion, also known as a bony bridge, that causes stunted or crooked growth. Dr. Liisa
Kuhn’s Lab has developed an accurate, reproducible animal model that mimics this same growth
plate behavior and can be used to further analyze the growth plate structure, healing process, and
new treatments. This animal model uses mice with tri-lineage fluorescent reporters for collagen
types I, II, and X. These reporters enable proper visualization of the growth plate and
classification of the different cells of interest in the growth plate: proliferating cartilage,
hypertrophic cartilage, and bone. Due to the importance of the columnar organization of these
cells and the three dimensional nature of the growth plate, 3D light sheet microscopy (LSM) was
used for the first time on mice tibias. Although our LSM imaging was unable to provide more
insight into the cartilage structure and organization of growth plates in three dimensions, it
further confirmed the presence of bony bridge formation and the reliability of the animal model
used.
INTRODUCTION
The main function of the growth plate is to undergo a process called endochondral ossification,
in which limb lengthening and bone development occurs (1). This complex process relies heavily
on the organization and structure of the cartilage itself. This columnar structure can be divided
into five zones: resting, proliferating, maturation and hypertrophic, calcification, and the
ossification zone (2). The stem cells of the resting zone are key to initiating the growth process
and instigate the water-fall like cascade of processes that carry out in limb lengthening (3).
Disrupting these chondrocyte stacks through a fracture or injury, can interrupt this process and
cause a premature fusion. Also known as a bony bridge, bone begins developing in place of the
cartilage and this disruption tethers the two ends of the growth plate together. Since this prevents
the growth plate from working properly, in many cases, the formation of this bony bridge results
in serious lifelong issues such as in stunted or crooked growth (4).
Currently, reactive diagnoses and treatments, such as surgeries and external limb lengthening
devices, are used to treat growth plate injuries of this type. There is a need for a better, less
invasive treatment, but that cannot be adequately prepared without a deeper understanding of the
growth plate cartilage in 3 dimensions. Although the growth plate has been analyzed through
many standard histological and microscopy techniques, such as hematoxylin and eosin and alcian
blue staining, photomicrography, microCT, and light microscopy (1,5), it has never been imaged
through Light Sheet Microscopy (LSM). Since the growth plate is a dynamic, undulating
structure, being able to see the growth plate’s cartilage stacks/organization in 3D would be
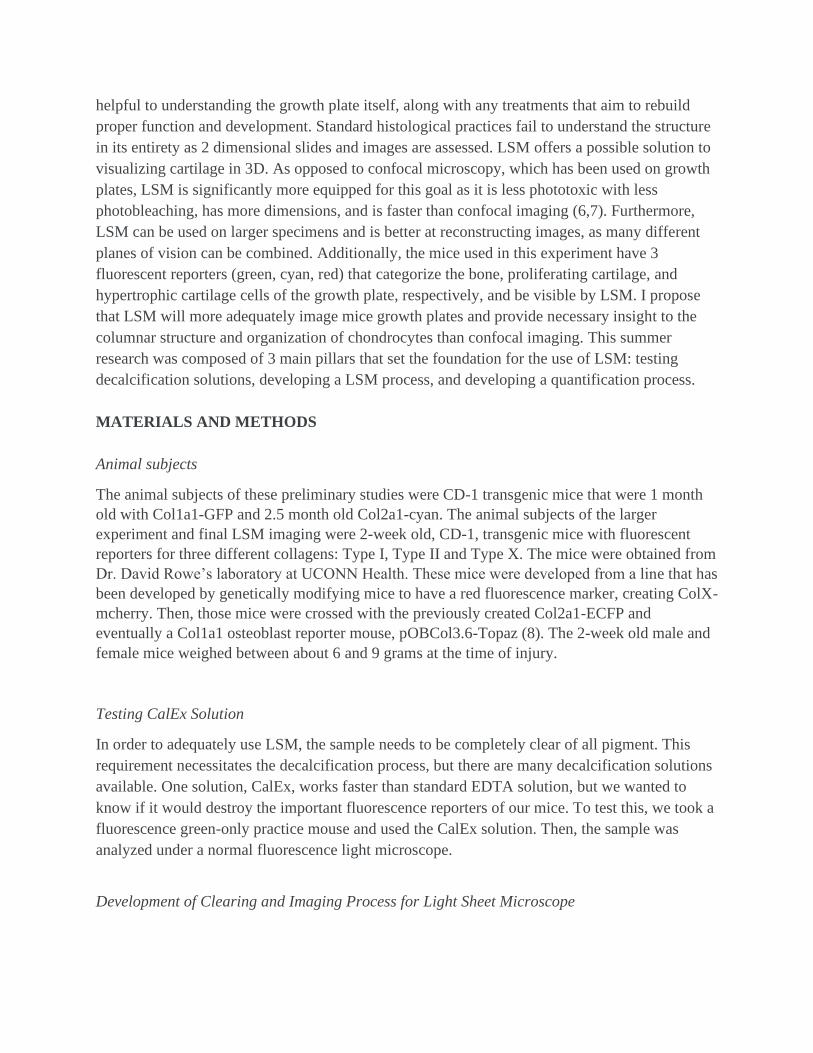
helpful to understanding the growth plate itself, along with any treatments that aim to rebuild
proper function and development. Standard histological practices fail to understand the structure
in its entirety as 2 dimensional slides and images are assessed. LSM offers a possible solution to
visualizing cartilage in 3D. As opposed to confocal microscopy, which has been used on growth
plates, LSM is significantly more equipped for this goal as it is less phototoxic with less
photobleaching, has more dimensions, and is faster than confocal imaging (6,7). Furthermore,
LSM can be used on larger specimens and is better at reconstructing images, as many different
planes of vision can be combined. Additionally, the mice used in this experiment have 3
fluorescent reporters (green, cyan, red) that categorize the bone, proliferating cartilage, and
hypertrophic cartilage cells of the growth plate, respectively, and be visible by LSM. I propose
that LSM will more adequately image mice growth plates and provide necessary insight to the
columnar structure and organization of chondrocytes than confocal imaging. This summer
research was composed of 3 main pillars that set the foundation for the use of LSM: testing
decalcification solutions, developing a LSM process, and developing a quantification process.
MATERIALS AND METHODS
Animal subjects
The animal subjects of these preliminary studies were CD-1 transgenic mice that were 1 month
old with Col1a1-GFP and 2.5 month old Col2a1-cyan. The animal subjects of the larger
experiment and final LSM imaging were 2-week old, CD-1, transgenic mice with fluorescent
reporters for three different collagens: Type I, Type II and Type X. The mice were obtained from
Dr. David Rowe’s laboratory at UCONN Health. These mice were developed from a line that has
been developed by genetically modifying mice to have a red fluorescence marker, creating ColX-
mcherry. Then, those mice were crossed with the previously created Col2a1-ECFP and
eventually a Col1a1 osteoblast reporter mouse, pOBCol3.6-Topaz (8). The 2-week old male and
female mice weighed between about 6 and 9 grams at the time of injury.
Testing CalEx Solution
In order to adequately use LSM, the sample needs to be completely clear of all pigment. This
requirement necessitates the decalcification process, but there are many decalcification solutions
available. One solution, CalEx, works faster than standard EDTA solution, but we wanted to
know if it would destroy the important fluorescence reporters of our mice. To test this, we took a
fluorescence green-only practice mouse and used the CalEx solution. Then, the sample was
analyzed under a normal fluorescence light microscope.
Development of Clearing and Imaging Process for Light Sheet Microscope
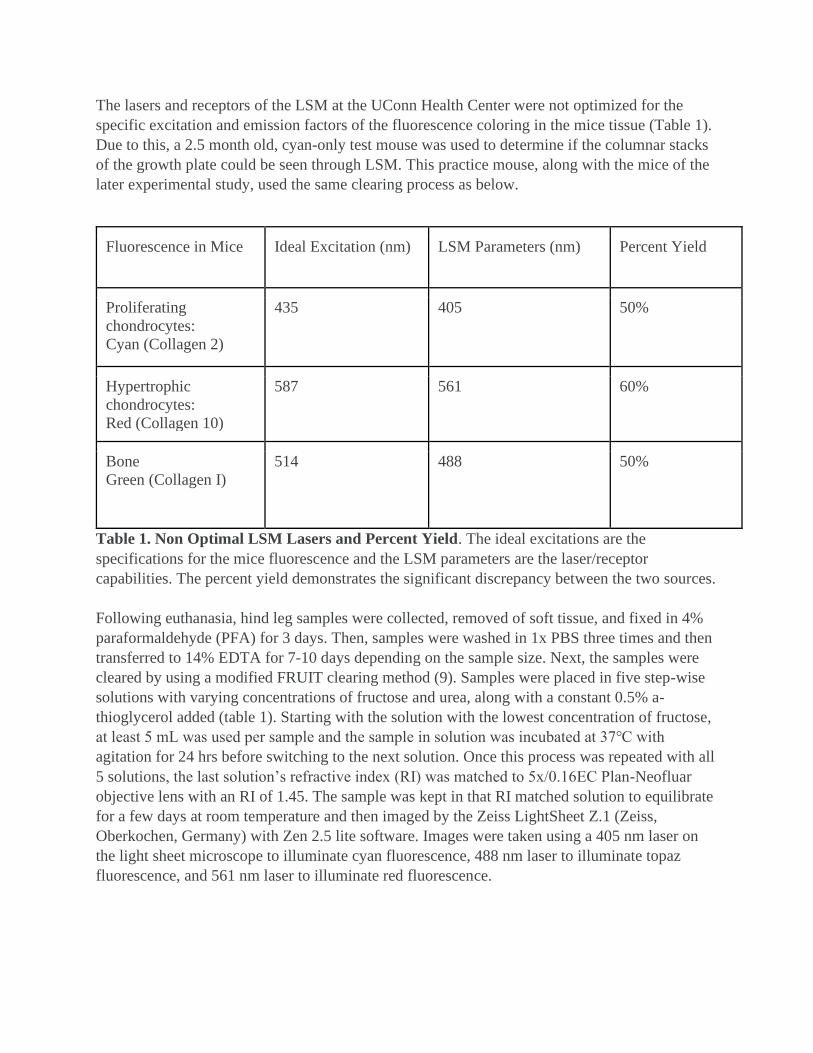
The lasers and receptors of the LSM at the UConn Health Center were not optimized for the
specific excitation and emission factors of the fluorescence coloring in the mice tissue (Table 1).
Due to this, a 2.5 month old, cyan-only test mouse was used to determine if the columnar stacks
of the growth plate could be seen through LSM. This practice mouse, along with the mice of the
later experimental study, used the same clearing process as below.
Fluorescence in Mice Ideal Excitation (nm) LSM Parameters (nm) Percent Yield
Proliferating
chondrocytes:
Cyan (Collagen 2)
435 405 50%
Hypertrophic
chondrocytes:
Red (Collagen 10)
587 561 60%
Bone
Green (Collagen I)
514 488 50%
Table 1. Non Optimal LSM Lasers and Percent Yield. The ideal excitations are the
specifications for the mice fluorescence and the LSM parameters are the laser/receptor
capabilities. The percent yield demonstrates the significant discrepancy between the two sources.
Following euthanasia, hind leg samples were collected, removed of soft tissue, and fixed in 4%
paraformaldehyde (PFA) for 3 days. Then, samples were washed in 1x PBS three times and then
transferred to 14% EDTA for 7-10 days depending on the sample size. Next, the samples were
cleared by using a modified FRUIT clearing method (9). Samples were placed in five step-wise
solutions with varying concentrations of fructose and urea, along with a constant 0.5% a-
thioglycerol added (table 1). Starting with the solution with the lowest concentration of fructose,
at least 5 mL was used per sample and the sample in solution was incubated at 37℃ with
agitation for 24 hrs before switching to the next solution. Once this process was repeated with all
5 solutions, the last solution’s refractive index (RI) was matched to 5x/0.16EC Plan-Neofluar
objective lens with an RI of 1.45. The sample was kept in that RI matched solution to equilibrate
for a few days at room temperature and then imaged by the Zeiss LightSheet Z.1 (Zeiss,
Oberkochen, Germany) with Zen 2.5 lite software. Images were taken using a 405 nm laser on
the light sheet microscope to illuminate cyan fluorescence, 488 nm laser to illuminate topaz
fluorescence, and 561 nm laser to illuminate red fluorescence.
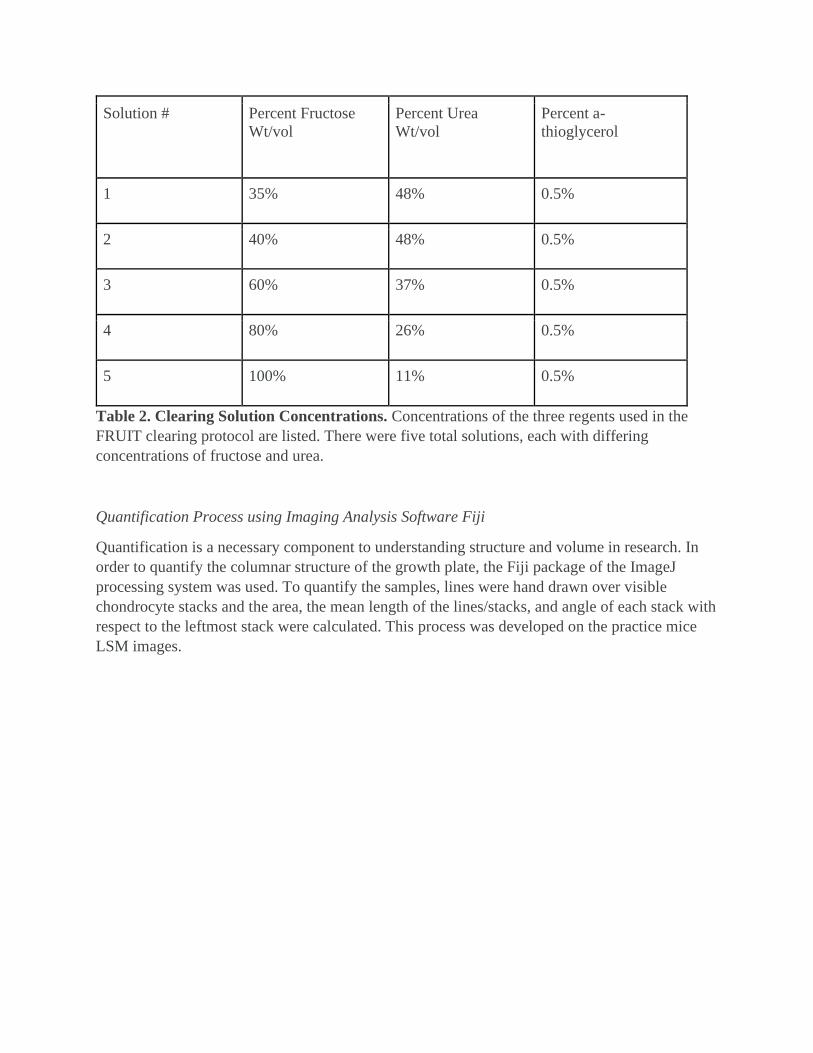
Solution # Percent Fructose
Wt/vol
Percent Urea
Wt/vol
Percent a-
thioglycerol
1 35% 48% 0.5%
2 40% 48% 0.5%
3 60% 37% 0.5%
4 80% 26% 0.5%
5 100% 11% 0.5%
Table 2. Clearing Solution Concentrations. Concentrations of the three regents used in the
FRUIT clearing protocol are listed. There were five total solutions, each with differing
concentrations of fructose and urea.
Quantification Process using Imaging Analysis Software Fiji
Quantification is a necessary component to understanding structure and volume in research. In
order to quantify the columnar structure of the growth plate, the Fiji package of the ImageJ
processing system was used. To quantify the samples, lines were hand drawn over visible
chondrocyte stacks and the area, the mean length of the lines/stacks, and angle of each stack with
respect to the leftmost stack were calculated. This process was developed on the practice mice
LSM images.
RESULTS
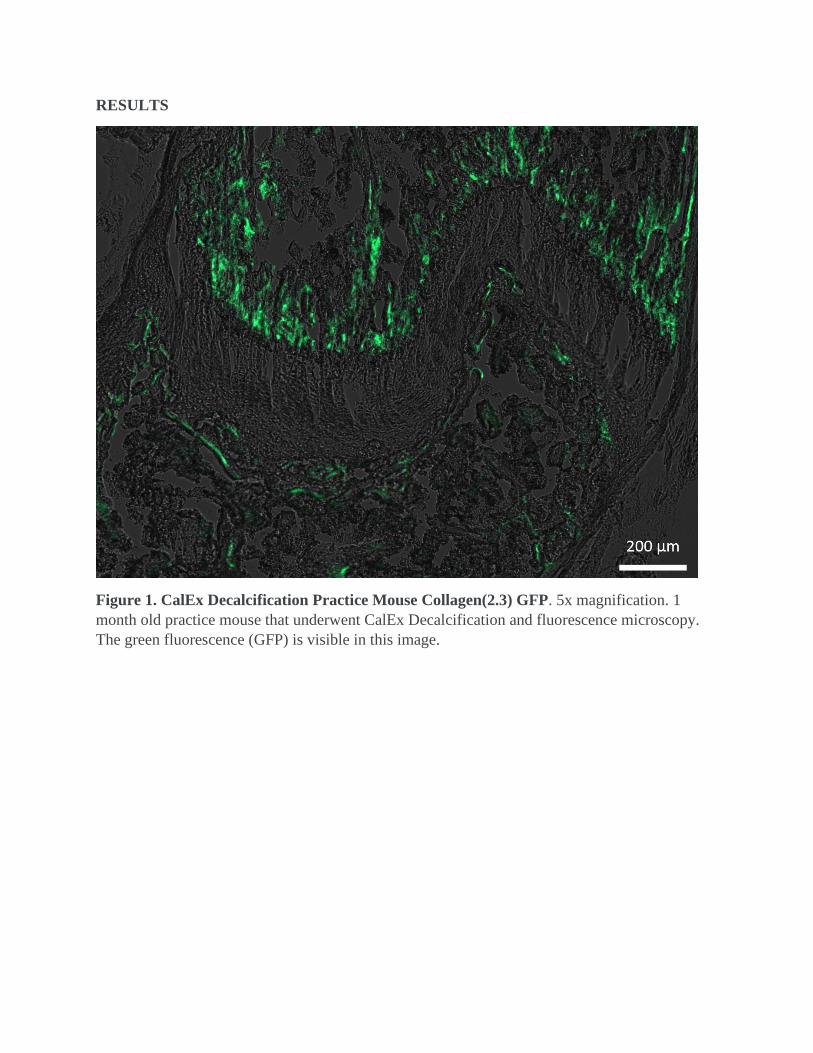
Figure 1. CalEx Decalcification Practice Mouse Collagen(2.3) GFP. 5x magnification. 1
month old practice mouse that underwent CalEx Decalcification and fluorescence microscopy.
The green fluorescence (GFP) is visible in this image.
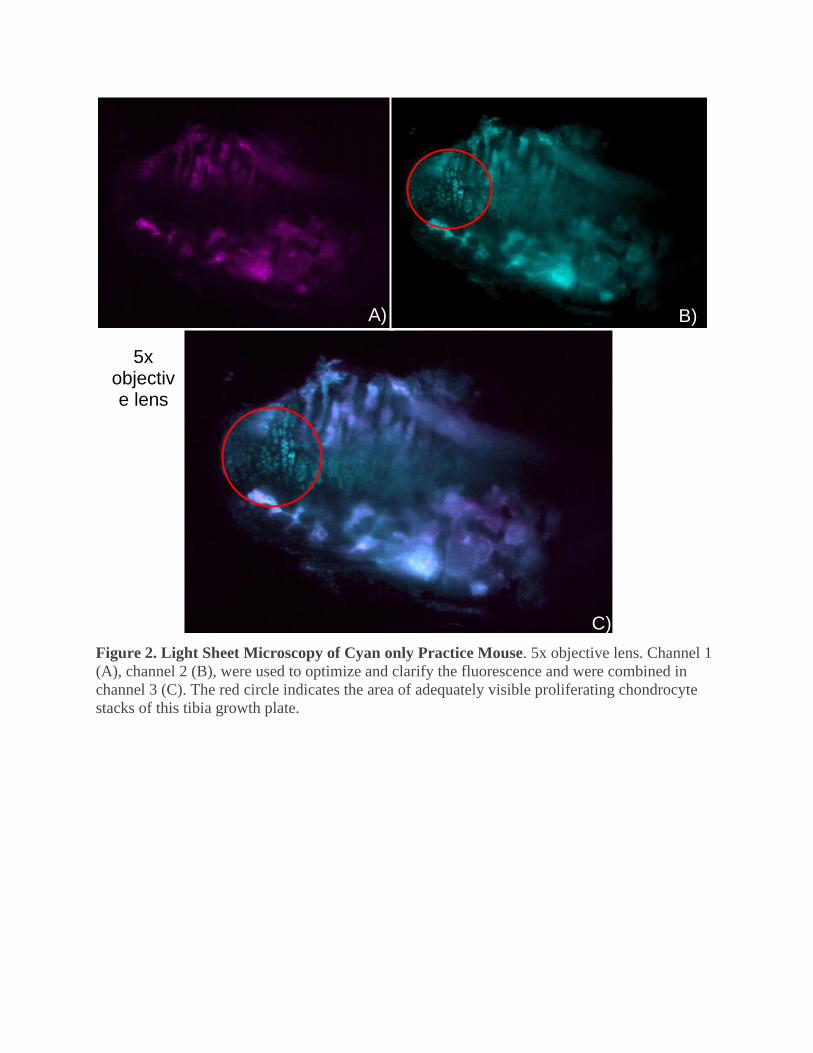
Figure 2. Light Sheet Microscopy of Cyan only Practice Mouse. 5x objective lens. Channel 1
(A), channel 2 (B), were used to optimize and clarify the fluorescence and were combined in
channel 3 (C). The red circle indicates the area of adequately visible proliferating chondrocyte
stacks of this tibia growth plate.
A) B)
C)
5x objective lens
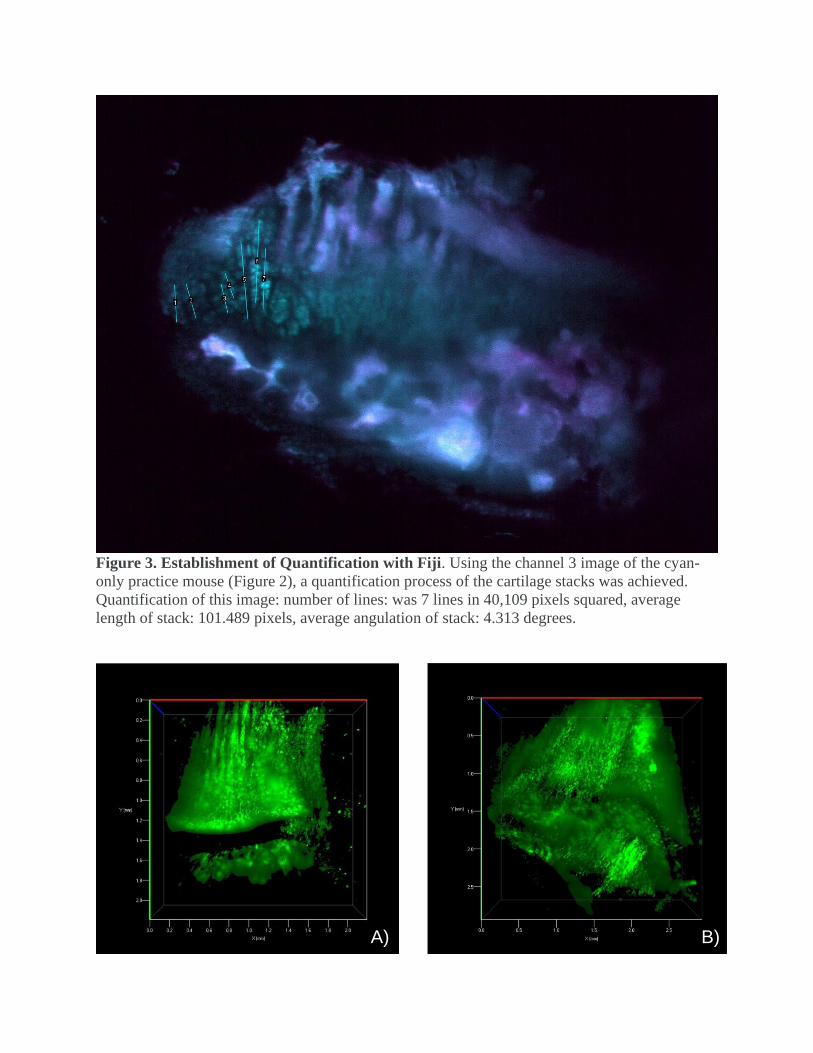
Figure 3. Establishment of Quantification with Fiji. Using the channel 3 image of the cyan-
only practice mouse (Figure 2), a quantification process of the cartilage stacks was achieved.
Quantification of this image: number of lines: was 7 lines in 40,109 pixels squared, average
length of stack: 101.489 pixels, average angulation of stack: 4.313 degrees.
A) B)
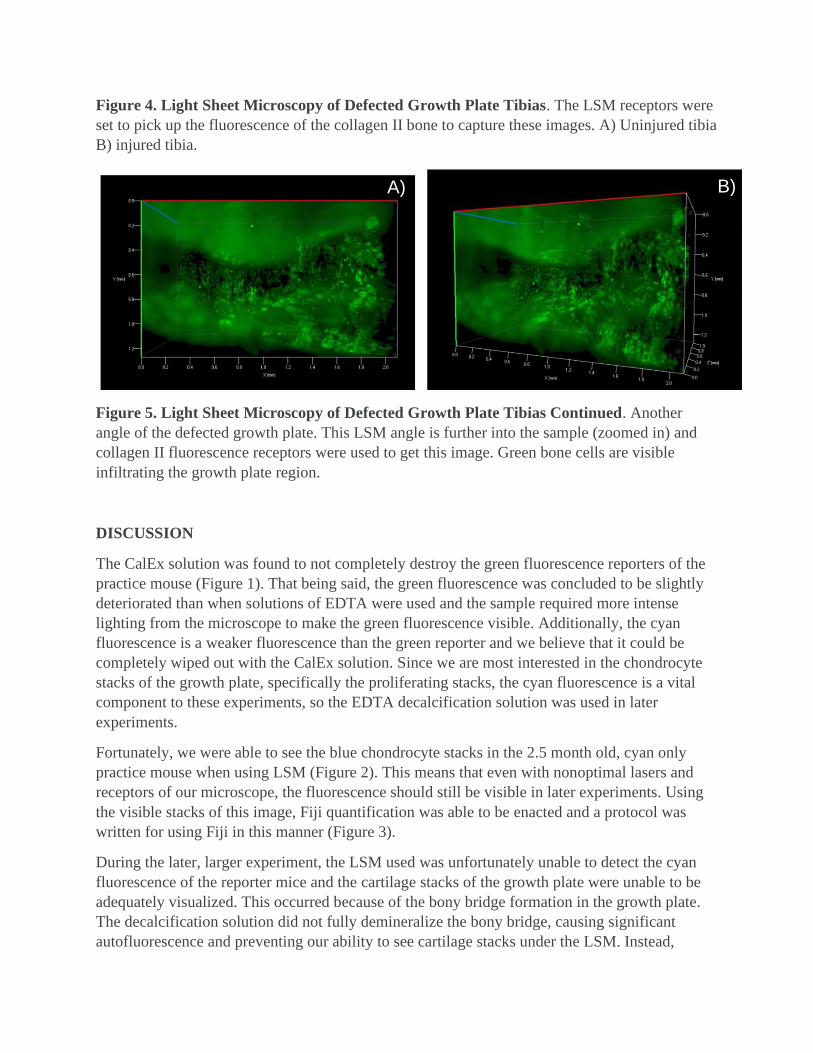
Figure 4. Light Sheet Microscopy of Defected Growth Plate Tibias. The LSM receptors were
set to pick up the fluorescence of the collagen II bone to capture these images. A) Uninjured tibia
B) injured tibia.
Figure 5. Light Sheet Microscopy of Defected Growth Plate Tibias Continued. Another
angle of the defected growth plate. This LSM angle is further into the sample (zoomed in) and
collagen II fluorescence receptors were used to get this image. Green bone cells are visible
infiltrating the growth plate region.
DISCUSSION
The CalEx solution was found to not completely destroy the green fluorescence reporters of the
practice mouse (Figure 1). That being said, the green fluorescence was concluded to be slightly
deteriorated than when solutions of EDTA were used and the sample required more intense
lighting from the microscope to make the green fluorescence visible. Additionally, the cyan
fluorescence is a weaker fluorescence than the green reporter and we believe that it could be
completely wiped out with the CalEx solution. Since we are most interested in the chondrocyte
stacks of the growth plate, specifically the proliferating stacks, the cyan fluorescence is a vital
component to these experiments, so the EDTA decalcification solution was used in later
experiments.
Fortunately, we were able to see the blue chondrocyte stacks in the 2.5 month old, cyan only
practice mouse when using LSM (Figure 2). This means that even with nonoptimal lasers and
receptors of our microscope, the fluorescence should still be visible in later experiments. Using
the visible stacks of this image, Fiji quantification was able to be enacted and a protocol was
written for using Fiji in this manner (Figure 3).
During the later, larger experiment, the LSM used was unfortunately unable to detect the cyan
fluorescence of the reporter mice and the cartilage stacks of the growth plate were unable to be
adequately visualized. This occurred because of the bony bridge formation in the growth plate.
The decalcification solution did not fully demineralize the bony bridge, causing significant
autofluorescence and preventing our ability to see cartilage stacks under the LSM. Instead,
A) B)
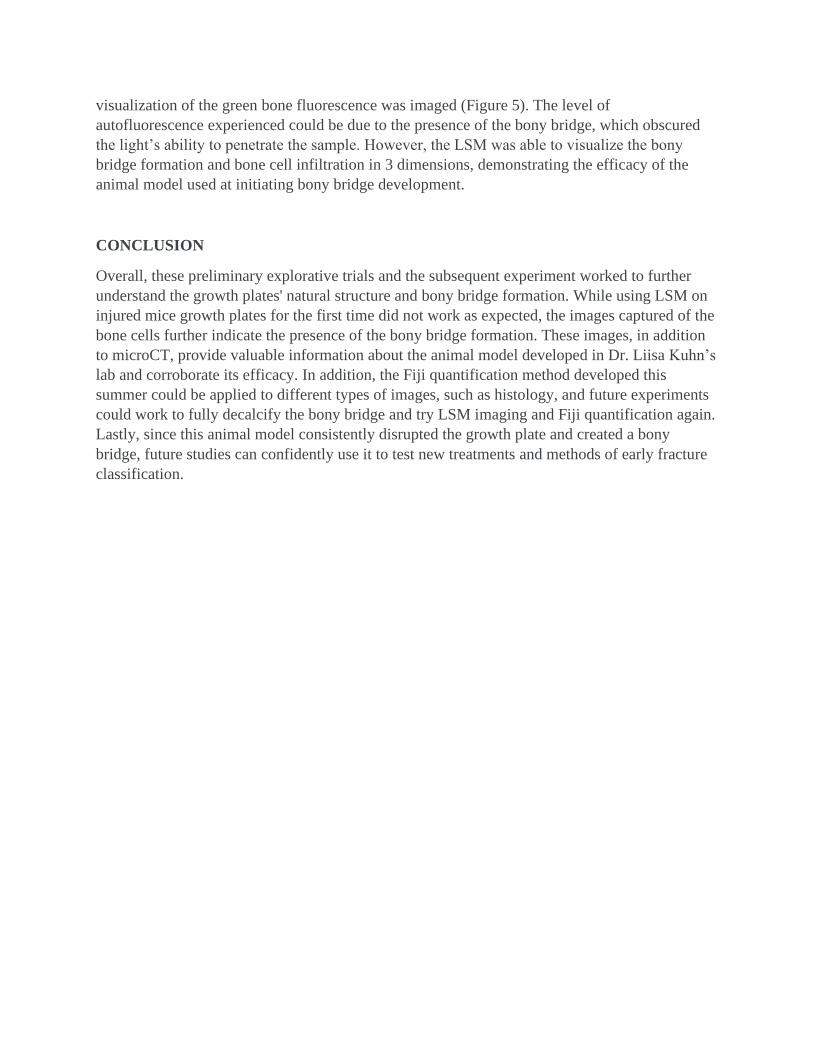
visualization of the green bone fluorescence was imaged (Figure 5). The level of
autofluorescence experienced could be due to the presence of the bony bridge, which obscured
the light’s ability to penetrate the sample. However, the LSM was able to visualize the bony
bridge formation and bone cell infiltration in 3 dimensions, demonstrating the efficacy of the
animal model used at initiating bony bridge development.
CONCLUSION
Overall, these preliminary explorative trials and the subsequent experiment worked to further
understand the growth plates' natural structure and bony bridge formation. While using LSM on
injured mice growth plates for the first time did not work as expected, the images captured of the
bone cells further indicate the presence of the bony bridge formation. These images, in addition
to microCT, provide valuable information about the animal model developed in Dr. Liisa Kuhn’s
lab and corroborate its efficacy. In addition, the Fiji quantification method developed this
summer could be applied to different types of images, such as histology, and future experiments
could work to fully decalcify the bony bridge and try LSM imaging and Fiji quantification again.
Lastly, since this animal model consistently disrupted the growth plate and created a bony
bridge, future studies can confidently use it to test new treatments and methods of early fracture
classification.
Works Cited
1. Lee, M. A., Nissen, T. P., & Otsuka, N. Y. (2000). Utilization of a Murine Model to
Investigate the Molecular Process of Transphyseal Bone Formation. Journal of Pediatric
Orthopaedics,20(6), 802-806.
2. Mackie, E., Ahmed, Y., Tatarczuch, L., Chen, K., & Mirams, M. (2008). Endochondral
ossification: How cartilage is converted into bone in the developing skeleton. The
International Journal of Biochemistry & Cell Biology,40(1), 46-62.
3. Abad, V., Meyers, J. L., Weise, M., Gafni, R. I., Barnes, K. M., Nilsson, O., Bacher, J.
D., & Baron, J. (2002). The role of the resting zone in growth plate chondrogenesis.
Endocrinology, 143(5), 1851–1857. https://doi.org/10.1210/endo.143.5.8776.
4. Shaw, N., Erickson, C., Bryant, S. J., Ferguson, V. L., Krebs, M. D., Hadley-Miller, N.,
& Payne, K. A. (2018). Regenerative Medicine Approaches for the Treatment of
Pediatric Physeal Injuries. Tissue engineering. Part B, Reviews, 24(2), 85–97.
https://doi.org/10.1089/ten.TEB.2017.0274
5. Macsai, C. E., Hopwood, B., Chung, R., Foster, B. K., & Xian, C. J. (2011). Structural
and molecular analyses of bone bridge formation within the growth plate injury site and
cartilage degeneration at the adjacent uninjured area. Bone, 49(4), 904–912.
https://doi.org/10.1016/j.bone.2011.07.024.
6. Santi, P. A. (2011). Light sheet fluorescence microscopy. Journal of Histochemistry &
Cytochemistry, 59(2), 129–138. https://doi.org/10.1369/0022155410394857
7. Reynaud, E. G., Kržič, U., Greger, K., & Stelzer, E. H. (2008). Light sheet‐based
fluorescence microscopy: More dimensions, more photons, and less photodamage. HFSP
Journal, 2(5), 266–275. https://doi.org/10.2976/1.2974980.
8. Maye, P., Fu, Y., Butler, D. L., Chokalingam, K., Liu, Y., Floret, J., Stover, M. L.,
Wenstrup, R., Jiang, X., Gooch, C., & Rowe, D. (2011). Generation and characterization
of Col10a1-mcherry reporter mice. Genesis (New York, N.Y. : 2000), 49(5), 410–418.
https://doi.org/10.1002/dvg.20733.
9. Hou, B., Zhang, D., Zhao, S., Wei, M., Yang, Z., Wang, S., Wang, J., Zhang, X., Liu, B.,
Fan, L., Li, Y., Qiu, Z., Zhang, C., & Jiang, T. (2015). Scalable and DiI-compatible
optical clearance of the mammalian brain. Frontiers in Neuroanatomy .
https://www.frontiersin.org/articles/10.3389/fnana.2015.00019/full.