Embed Size (px)
Citation preview
Analysis of the Signal Transduction DynamicsRegulating mTOR with Mathematical Modeling,
Petri Nets and Dynamic Graphs
Simon V. Hardy1 and Mathieu Pagé Fortin1
Université Laval, Department of computer science and software engineering,Department of biochemistry, microbiology and bioinformatics, Institut Universitaire
en Santé Mentale de Québec, Québec QC, Canada, G1V [email protected],
WWW home page: http://www2.ift.ulaval.ca/˜hardy/Simon_Hardy
Abstract. Signaling networks in the mammalian cell are complex sys-tems. Their dynamic properties can often be explained by the interactionof regulatory network motifs. Mathematical modeling is instrumental inexplaining how these systems function. To accomplish this task in thispaper, we combine numerical simulations of differential equations, whichproduce the individual trajectories of protein concentrations, and struc-tural analysis of the reaction network with Petri nets. In the end, wegenerate dynamic graphs to get a systems view of the signaling networkdynamics. In this paper, we report initial work on the regulatory net-work of the protein mTOR. In neuronal synaptic plasticity, prolongedactivation of this protein is needed to support an increased protein syn-thesis. However, biologists wonder how two brief calcium influxes of 1second each can lead to this long activation downstream. With our com-putational approach, we explore a simple hypothesis for the response ofmTOR, the crosstalk between the Akt and Wnt pathways, with two dif-ferent models. Initial results suggest that this mechanism alone cannotexplain the experimental data.
Keywords: Computational biology, Cell signaling, Mathematical mod-eling, Petri nets, mTOR, Synaptic plasticity
1 Introduction
Signaling pathways are the communication system of the cell. They transmitand process information. These pathways form a complex network with severalregulatory mechanisms and often exhibit emergent properties. Computationalbiology approaches have made several theoretical contributions to the analysisand understanding of these molecular and cellular systems using modeling andsimulation. Some even led to experimental discoveries.
Synaptic plasticity in neurons is a collection of systems properties that haslong been intriguing neurobiologists. Most importantly, it has been shown that
synaptic plasticity is the cellular correlate of learning and memory in the ner-vous system [19]. One of these properties is long-term potentiation (LTP), apersistent strengthening of synapses following certain patterns of electrical ac-tivity. Whether in the early induction phase or the late maintenance phase, LTPrelies on the biochemical regulation of different signaling pathways. For exam-ple, the activity of the protein mammalian target of rapamycin (mTOR) – amodulator of the translation capacity of the cell – is required during the latephase of LTP (L-LTP) to increase protein synthesis [22]. Interestingly, a recentstudy linked memory impairments caused by sleep deprivation to a molecularmechanism involving mTOR [23]. If mTOR is inhibited, potentiated synapsesrevert to their initial state. Ma et al. showed that the activity of two cell sig-naling pathways, the Akt pathway and the Wnt pathway, is required to activatemTOR and induce L-LTP [15]. Despite experimental data supporting this sig-naling mechanism, some questions about its dynamics remain unanswered. Howis it possible that a strong, but very brief, synaptic stimulation can trigger theprolonged activation of mTOR needed to induce L-LTP? How can two 1-secondcalcium influxes lead to a 45-minute mTOR response? This kind of question isbest answered with the help of theoretical analyses.
In this paper, we present the approach that we will be using to study thisquestion. We plan to eventually explore several signaling mechanisms that mightexplain this temporal prolongation of the signal initiated by synaptic activity.We will model each mechanism with reaction-based ordinary differential equa-tions (ODE) and perform numerical simulations. We will also make a structuralanalysis of the reaction network with Petri nets [7]. We will visualize the sim-ulation data in a graph-based representation that our group developed [1, 6].Our goal is twofold: first study different network motifs that could produce suchan effect and gain a better understanding of their dynamic properties with ourdynamic graphs; and second identify likely biological mechanisms to latter testexperimentally.
In the preliminary work presented here, we focus on a simple interactionbetween the Akt pathway and the Wnt pathway. Precisely, we model the cross-regulation by Akt of GSK3, a kinase downstream of the Wnt pathway. Thiscreates a feed-forward motif that Ma et al. hypothesized to be responsible forthe surprisingly long activation of mTOR [15]. We first combined two existingmathematical models to create an integrated signaling model. To have a betteragreement between the experimental and simulation data, we created a moredetailed model with additional molecular mechanisms found in the literature. Inthe following sections, we present the two models, their simulation results and theresulting dynamic graphs. Our initial analysis suggests that this network motifincreases the amplitude of the downstream signal and acts as a coincidence de-tector but that it cannot fully achieve the experimentally observed prolongationof the mTOR activation.
348 BioPPN’16 – Biological Processes and Petri Nets
2 Two iterations of mathematical modeling of the Aktand Wnt signaling pathways and simulation results
2.1 First modeling iteration: a model of a simple Akt-Wnt crosstalk
In neurons, one of the initial events that can trigger signal transduction on manysignaling pathways is the entry of calcium ions through channels or neurotrans-mitter receptors. Calcium is a secondary messenger and once it enters the cell,it activates various proteins. One of the signaling cascades activated by calciumthat culminates with mTOR is the Akt pathway. This pathway was modeledby Jain and Bhalla as part of a larger signaling network involving the growthfactor BDNF and its effect on the activity of mTOR [11]. Their model also in-cluded the protein synthesis process. With this model, Jain and Bhalla studiedif a bistable regime was possible. Bistability could arise from a self-sustainingpositive feedback loop formed by the synthesis of proteins that are involved inthe signaling network controlling protein synthesis itself through mTOR. Jainand Bhalla concluded from their simulation results that the currently knownfeedback mechanisms do not allow for such a switch.
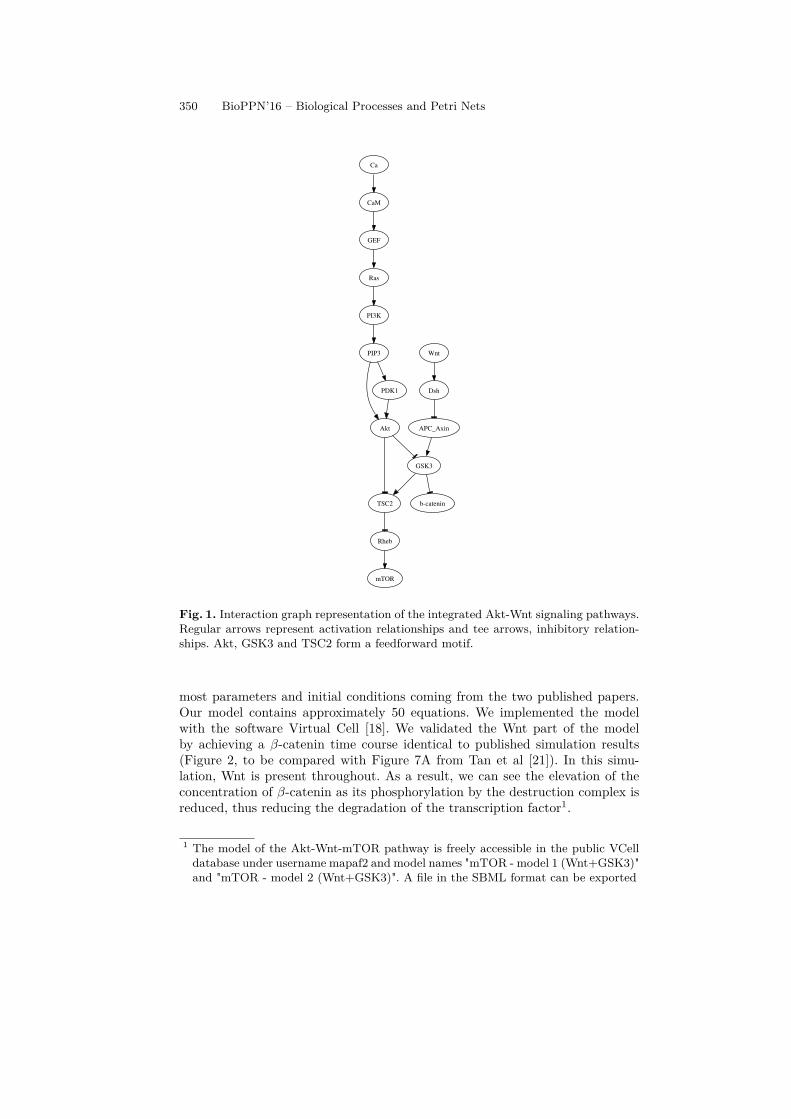
To assemble our Akt-Wnt-mTOR model (shown in Figure 1), we reused partof the model developed by Jain and Bhalla. Calcium (Ca) activates calmoduline(CaM) and then a guanine nucleotide exchange factor (GEF). GEF in turnactivates the GTPase Ras, which then binds to the phosphoinositide 3-kinase(PI3K). Once active, this kinase initiates the production of phosphatidylinositol3-phosphate (PIP3), a membrane bound phospholipid that recruits the proteinsPDK1 and Akt to the membrane where they both become active. Once activated,Akt phosphorylates the TSC2 complex (tuberous sclerosis 1-tuberous sclerosis2) and GSK3, inhibiting both proteins. The inactivation of TSC2 relieves therepression it exerts on the GTP-binding protein Rheb. This last protein can thenbind to mTOR and activate it.
Experimental data also linked the Wnt pathway to the regulation of mTOR inneurons through GSK3 [15]. Wnt is a ligand secreted for autocrine and paracrinesignaling. It has been shown that synaptic stimulation causes the exocytosis ofWnt in the extracellular space where the ligand binds to the receptor Frizzled,which passes the signal to the intracellular protein Disheveled (Dsh). The ac-tivated Dsh protein then recruits the proteins Axin and GSK3 to the recep-tor, preventing the formation of the destruction complex by these proteins withAPC. When operational, this complex phosphorylates the transcription factorβ-catenin, marking it for degradation. Another target of the destruction complexis TSC2. When GSK3 is in the complex, this protein maintains a basal activationof TSC2, thus tonically repressing mTOR. This repression is therefore removedby Wnt signaling. To add this pathway to our dynamical model, we incorporatedthe work from Tan et al [21]. This model is an adaptation for mammalian cellsof the classical Wnt signaling model by Lee et al [13].
The resulting integrated model of the Akt/Wnt pathways is composed ofkinetics-based biochemical reactions like mass action reactions and enzymaticreactions. Reaction rates were defined as ordinary differential equations with
S.V. Hardy M.P. Fortin: Analysis of the Signal Transduction Dynamics 349
Ca
CaM
GEF
Ras
PI3K
PIP3
Akt
PDK1
GSK3
TSC2 b-catenin
Rheb
mTOR
Wnt
Dsh
APC_Axin
Fig. 1. Interaction graph representation of the integrated Akt-Wnt signaling pathways.Regular arrows represent activation relationships and tee arrows, inhibitory relation-ships. Akt, GSK3 and TSC2 form a feedforward motif.
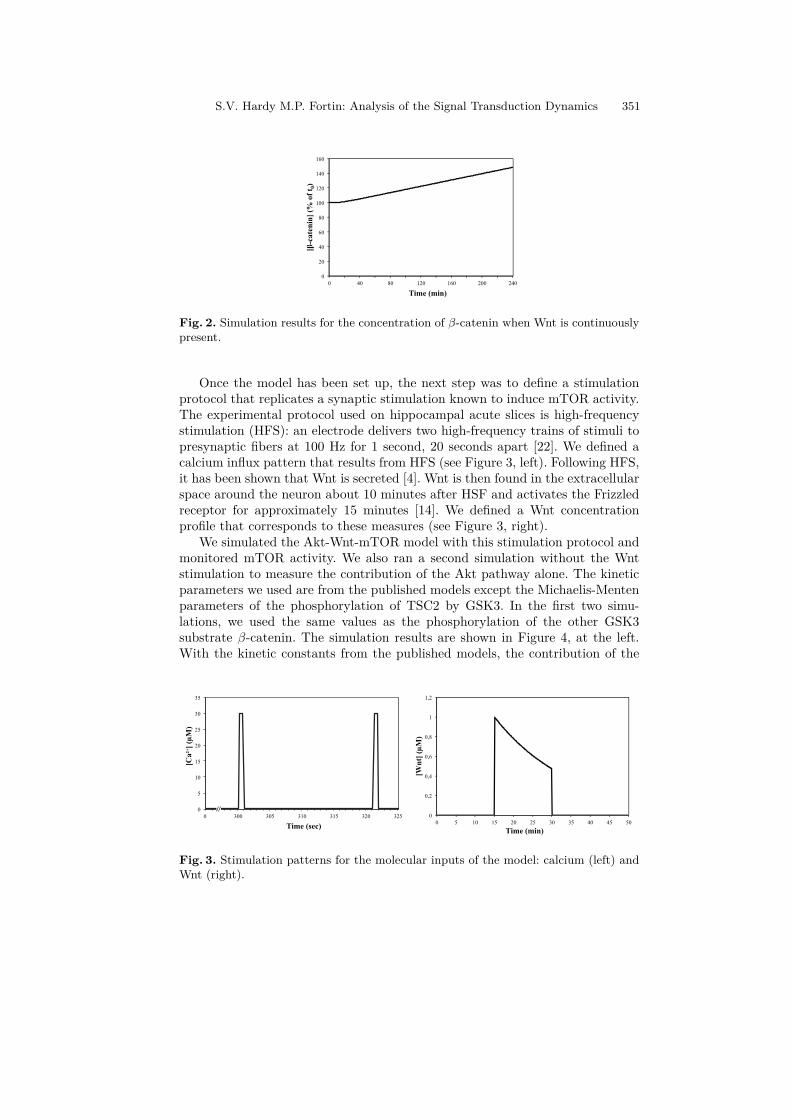
most parameters and initial conditions coming from the two published papers.Our model contains approximately 50 equations. We implemented the modelwith the software Virtual Cell [18]. We validated the Wnt part of the modelby achieving a β-catenin time course identical to published simulation results(Figure 2, to be compared with Figure 7A from Tan et al [21]). In this simu-lation, Wnt is present throughout. As a result, we can see the elevation of theconcentration of β-catenin as its phosphorylation by the destruction complex isreduced, thus reducing the degradation of the transcription factor1.
1 The model of the Akt-Wnt-mTOR pathway is freely accessible in the public VCelldatabase under username mapaf2 and model names "mTOR - model 1 (Wnt+GSK3)"and "mTOR - model 2 (Wnt+GSK3)". A file in the SBML format can be exported
350 BioPPN’16 – Biological Processes and Petri Nets
0
20
40
60
80
100
120
140
160
0 40 80 120 160 200 240
[-c
ate
nin
] (%
of
t 0)
Time (min)
Fig. 2. Simulation results for the concentration of β-catenin when Wnt is continuouslypresent.
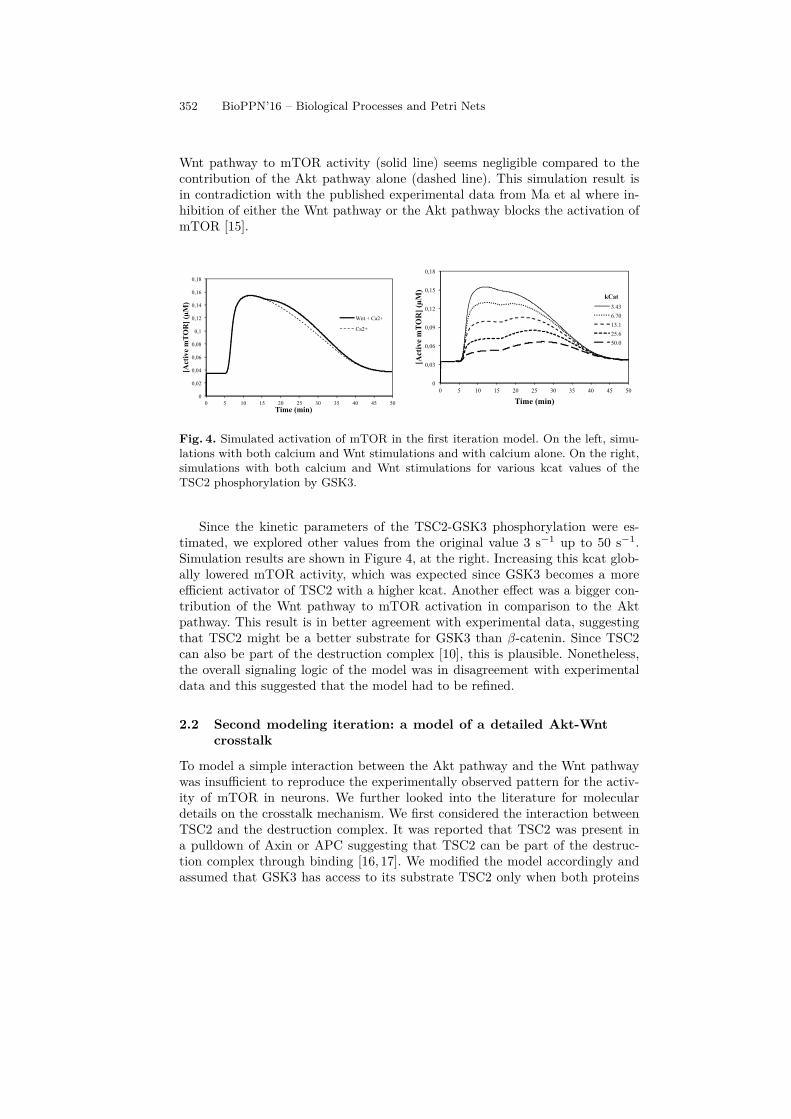
Once the model has been set up, the next step was to define a stimulationprotocol that replicates a synaptic stimulation known to induce mTOR activity.The experimental protocol used on hippocampal acute slices is high-frequencystimulation (HFS): an electrode delivers two high-frequency trains of stimuli topresynaptic fibers at 100 Hz for 1 second, 20 seconds apart [22]. We defined acalcium influx pattern that results from HFS (see Figure 3, left). Following HFS,it has been shown that Wnt is secreted [4]. Wnt is then found in the extracellularspace around the neuron about 10 minutes after HSF and activates the Frizzledreceptor for approximately 15 minutes [14]. We defined a Wnt concentrationprofile that corresponds to these measures (see Figure 3, right).
We simulated the Akt-Wnt-mTOR model with this stimulation protocol andmonitored mTOR activity. We also ran a second simulation without the Wntstimulation to measure the contribution of the Akt pathway alone. The kineticparameters we used are from the published models except the Michaelis-Mentenparameters of the phosphorylation of TSC2 by GSK3. In the first two simu-lations, we used the same values as the phosphorylation of the other GSK3substrate β-catenin. The simulation results are shown in Figure 4, at the left.With the kinetic constants from the published models, the contribution of the
0
5
10
15
20
25
30
35
0 300 305 310 315 320 325
[Ca
2+]
(µM
)
Time (sec)
0
0,2
0,4
0,6
0,8
1
1,2
0 5 10 15 20 25 30 35 40 45 50
[Wn
t] (
M)
Time (min)
Fig. 3. Stimulation patterns for the molecular inputs of the model: calcium (left) andWnt (right).
S.V. Hardy M.P. Fortin: Analysis of the Signal Transduction Dynamics 351
Wnt pathway to mTOR activity (solid line) seems negligible compared to thecontribution of the Akt pathway alone (dashed line). This simulation result isin contradiction with the published experimental data from Ma et al where in-hibition of either the Wnt pathway or the Akt pathway blocks the activation ofmTOR [15].
0
0,02
0,04
0,06
0,08
0,1
0,12
0,14
0,16
0,18
0 5 10 15 20 25 30 35 40 45 50
[Acti
ve m
TO
R]
(M
)
Time (min)
Wnt + Ca2+
Ca2+
0
0,03
0,06
0,09
0,12
0,15
0,18
0 5 10 15 20 25 30 35 40 45 50
[Acti
ve m
TO
R]
(M
)
Time (min)
3.43
6.70
13.1
25.6
50.0
kCat
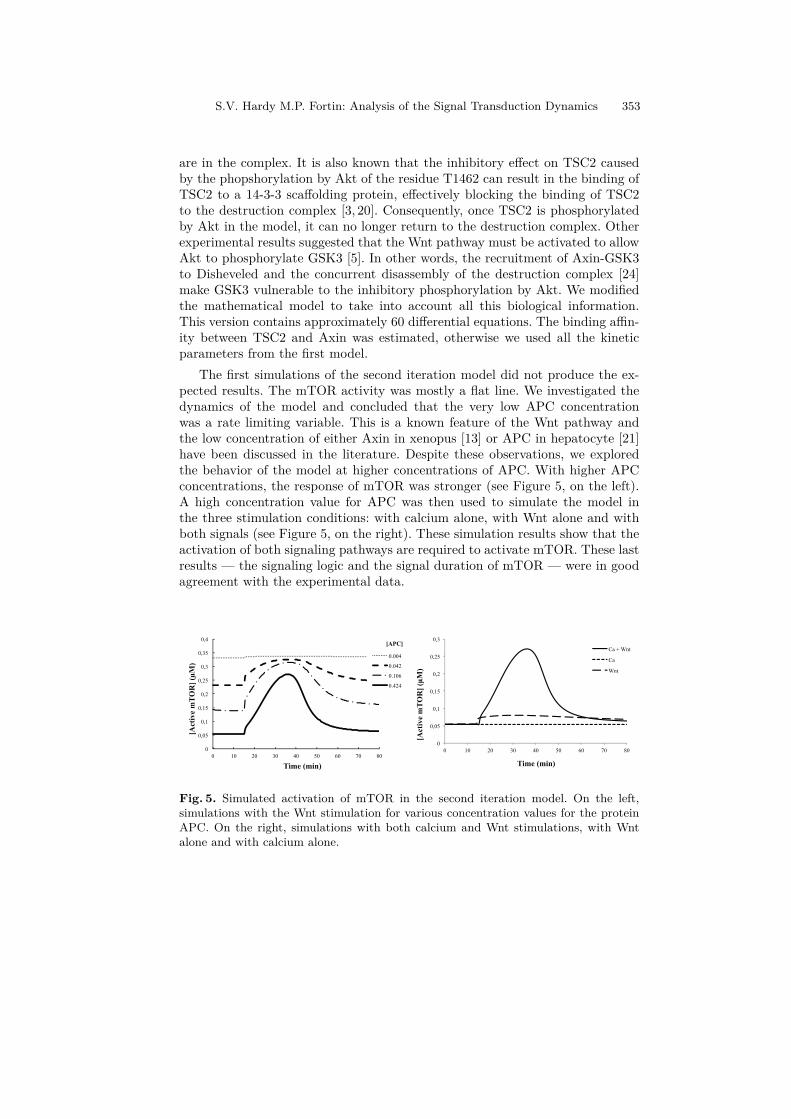
Fig. 4. Simulated activation of mTOR in the first iteration model. On the left, simu-lations with both calcium and Wnt stimulations and with calcium alone. On the right,simulations with both calcium and Wnt stimulations for various kcat values of theTSC2 phosphorylation by GSK3.
Since the kinetic parameters of the TSC2-GSK3 phosphorylation were es-timated, we explored other values from the original value 3 s−1 up to 50 s−1.Simulation results are shown in Figure 4, at the right. Increasing this kcat glob-ally lowered mTOR activity, which was expected since GSK3 becomes a moreefficient activator of TSC2 with a higher kcat. Another effect was a bigger con-tribution of the Wnt pathway to mTOR activation in comparison to the Aktpathway. This result is in better agreement with experimental data, suggestingthat TSC2 might be a better substrate for GSK3 than β-catenin. Since TSC2can also be part of the destruction complex [10], this is plausible. Nonetheless,the overall signaling logic of the model was in disagreement with experimentaldata and this suggested that the model had to be refined.
2.2 Second modeling iteration: a model of a detailed Akt-Wntcrosstalk
To model a simple interaction between the Akt pathway and the Wnt pathwaywas insufficient to reproduce the experimentally observed pattern for the activ-ity of mTOR in neurons. We further looked into the literature for moleculardetails on the crosstalk mechanism. We first considered the interaction betweenTSC2 and the destruction complex. It was reported that TSC2 was present ina pulldown of Axin or APC suggesting that TSC2 can be part of the destruc-tion complex through binding [16, 17]. We modified the model accordingly andassumed that GSK3 has access to its substrate TSC2 only when both proteins
352 BioPPN’16 – Biological Processes and Petri Nets
are in the complex. It is also known that the inhibitory effect on TSC2 causedby the phopshorylation by Akt of the residue T1462 can result in the binding ofTSC2 to a 14-3-3 scaffolding protein, effectively blocking the binding of TSC2to the destruction complex [3, 20]. Consequently, once TSC2 is phosphorylatedby Akt in the model, it can no longer return to the destruction complex. Otherexperimental results suggested that the Wnt pathway must be activated to allowAkt to phosphorylate GSK3 [5]. In other words, the recruitment of Axin-GSK3to Disheveled and the concurrent disassembly of the destruction complex [24]make GSK3 vulnerable to the inhibitory phosphorylation by Akt. We modifiedthe mathematical model to take into account all this biological information.This version contains approximately 60 differential equations. The binding affin-ity between TSC2 and Axin was estimated, otherwise we used all the kineticparameters from the first model.
The first simulations of the second iteration model did not produce the ex-pected results. The mTOR activity was mostly a flat line. We investigated thedynamics of the model and concluded that the very low APC concentrationwas a rate limiting variable. This is a known feature of the Wnt pathway andthe low concentration of either Axin in xenopus [13] or APC in hepatocyte [21]have been discussed in the literature. Despite these observations, we exploredthe behavior of the model at higher concentrations of APC. With higher APCconcentrations, the response of mTOR was stronger (see Figure 5, on the left).A high concentration value for APC was then used to simulate the model inthe three stimulation conditions: with calcium alone, with Wnt alone and withboth signals (see Figure 5, on the right). These simulation results show that theactivation of both signaling pathways are required to activate mTOR. These lastresults — the signaling logic and the signal duration of mTOR — were in goodagreement with the experimental data.
0
0,05
0,1
0,15
0,2
0,25
0,3
0,35
0,4
0 10 20 30 40 50 60 70 80
[Act
ive
mT
OR
] (µ
M)
Time (min)
0.004
0.042
0.106
0.424
[APC]
0
0,05
0,1
0,15
0,2
0,25
0,3
0 10 20 30 40 50 60 70 80
[Act
ive
mT
OR
] (µ
M)
Time (min)
Ca + Wnt
Ca
Wnt
Fig. 5. Simulated activation of mTOR in the second iteration model. On the left,simulations with the Wnt stimulation for various concentration values for the proteinAPC. On the right, simulations with both calcium and Wnt stimulations, with Wntalone and with calcium alone.
S.V. Hardy M.P. Fortin: Analysis of the Signal Transduction Dynamics 353
3 Petri nets and dynamic graphs of the signaling models
From the simulation results of the ODE models, the source of the duration ofthe mTOR activity and the signaling logic of the models are unclear. In bothcases, the crosstalk between the Akt and the Wnt pathways forms a coherentfeedforward motif. This motif can be functionally important in the regulation ofthe activity of mTOR. Akt directly inactivates TSC2, but it also has an indirecteffect by inhibiting GSK3, an activator of TSC2. Furthermore, the phosphory-lation of Akt by GSK3 blocks its reintegration in the destruction complex inthe first model. Ma et al hypothesized that this might prolong the inactivationof TSC2, thus explaining the long mTOR activity [15]. From the simulationdata, this seems unlikely. The second model even seems to suggest the oppo-site. To get a clearer picture, we created dynamic graph representations of theAkt-Wnt-mTOR model.
The outputs of the simulation of biological systems modeled with differen-tial equations are temporal, and maybe spatial, traces of the different modeledmolecular quantities. Ideal to study the dynamic of individual components, thesystem-level behavior of these models is not easily accessible whenever the mod-els reach a certain level of complexity. To provide a solution to this problemwe sought to combine graph theory and dynamical systems into a visualiza-tion method: the dynamic graph [6]. We summarize the approach in the nextparagraphs.
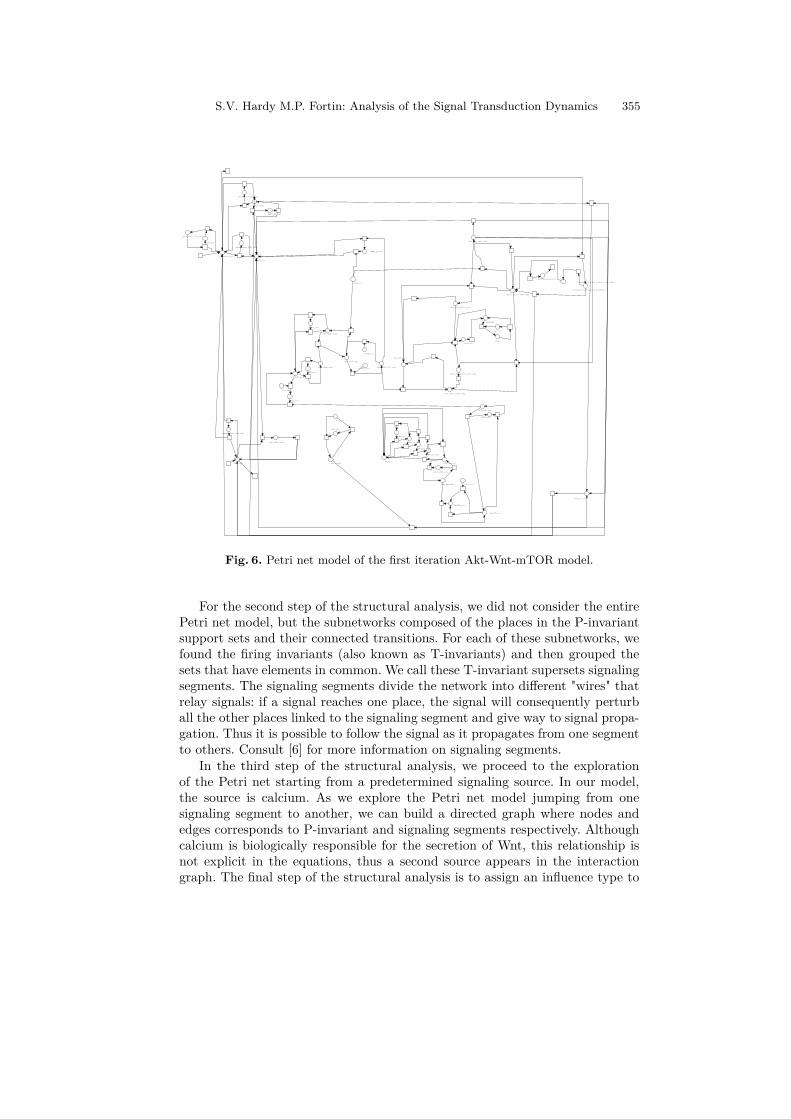
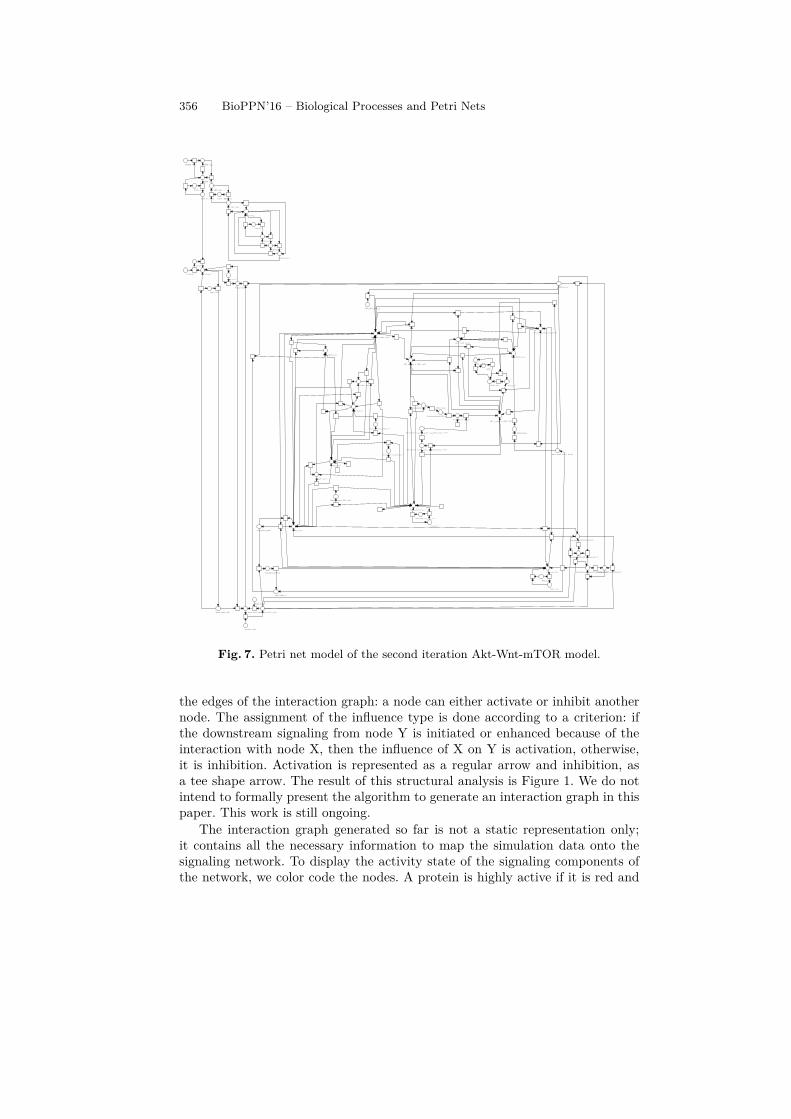
The dynamic graph uses Petri net theory to bridge two classical approaches:ODEs and graph theory. Using dynamic graphs in a previous project, we under-stood the dynamics of the signaling network activated by β-adrenergic receptorsin podocytes and correctly predicted from the model the presence of an unknownregulatory mechanism [1]. In this approach, the mathematical equations are con-verted into a Petri net model of biochemical reactions. Using the SBML importfeature of the software Snoopy [8], we created a Petri net representation of thetwo Akt-Wnt-mTOR ODE models (see Figures 6 and 7)2.
With the Petri net representation, it becomes possible to analyze the struc-tural properties of the model and extract functional relationships between thevariables of the ODEs. These relationships are then used to reconstruct the sig-naling network underlying the mathematical model. This is done in four steps.First, we identified the marking invariants (also known as P-invariants) using thesoftware Charlie [9]. In biochemical models, these sets of places are known tobe associated to mass conservation relationships. In other words, this first levelof structural analysis finds variables, which together form linear combinationsthat are always constant no matter what is the state of the system. In biologicalmodels, this is equivalent to a molecule that can change state but whose totalconcentration stays constant. For example, a P-invariant might represent a pro-tein with its different phosphorylation states or a gene with its on-off conditions.
2 The models are too large and cannot be read comfortably on paper. However, thefiles of the Petri net models are available upon request.
354 BioPPN’16 – Biological Processes and Petri Nets
TSC1_TSC2_cell
TSC1_TSC2_T1462_cell
TSC1_TSC2_S1337_cell
TSC1_TSC2_S1337_T1462_cell
Dsh_cell
Dsh_a_cell
Wnt_cell
APC_Axin_GSK3_cell
APC_Axin_cell
GSK3_cell
GSK3_p_cell
Akt_T308_S473_cell
PP2A_cell
Axin_cell
APC_cell
Betacatenin_cell
Betacatenin_APC_cell
TCF_cell
Betacatenin_TCF_cell
APC_p_Axin_p_GSK3_cell
Betacatenin_APC_p_Axin_p_GSK3_cell
Betacatenin_p_APC_p_Axin_p_GSK3_cell
Betacatenin_p_cell
RasGDP_cell
RasGTP_cell
RasGAP_cell
PI3K_cell
PI3K_act_cell
PIP2_cell
PIP3_cell
PTEN_cell
PDK1_cell
PDK1_memb_cell
Akt_cell
Akt_memb_cell
Akt_T308_cell
mTORc2_cell
PHLPP_cell
Rheb_GTP
Rheb_GDP
mTOR
mTOR_inact
CaM_Ca4_cell
CaM_Ca3_cell
Ca_cell
CaM_Ca_cell
CaM_cell
CaM_Ca2_cell
Inact_GEF_cell
CaM_GEF_cell
Betacatenin_GSK3_cell
GSK3_APC_cell
Betacatenin_Axin_cell
Axin_GSK3_cell
Fig. 6. Petri net model of the first iteration Akt-Wnt-mTOR model.
For the second step of the structural analysis, we did not consider the entirePetri net model, but the subnetworks composed of the places in the P-invariantsupport sets and their connected transitions. For each of these subnetworks, wefound the firing invariants (also known as T-invariants) and then grouped thesets that have elements in common. We call these T-invariant supersets signalingsegments. The signaling segments divide the network into different "wires" thatrelay signals: if a signal reaches one place, the signal will consequently perturball the other places linked to the signaling segment and give way to signal propa-gation. Thus it is possible to follow the signal as it propagates from one segmentto others. Consult [6] for more information on signaling segments.
In the third step of the structural analysis, we proceed to the explorationof the Petri net starting from a predetermined signaling source. In our model,the source is calcium. As we explore the Petri net model jumping from onesignaling segment to another, we can build a directed graph where nodes andedges corresponds to P-invariant and signaling segments respectively. Althoughcalcium is biologically responsible for the secretion of Wnt, this relationship isnot explicit in the equations, thus a second source appears in the interactiongraph. The final step of the structural analysis is to assign an influence type to
S.V. Hardy M.P. Fortin: Analysis of the Signal Transduction Dynamics 355
Dsh_cell
Dsh_a_cell
Wnt_cell
APC_Axin_GSK3_cell
APC_Axin_cell
Akt_T308_S473_cell
PP2A_cell
Axin_cell
APC_cell
Betacatenin_cell
Betacatenin_APC_cell
TCF_cell
Betacatenin_TCF_cell
APC_p_Axin_p_GSK3_cell
Betacatenin_APC_p_Axin_p_GSK3_cell
Betacatenin_p_APC_p_Axin_p_GSK3_cell
Betacatenin_p_cell
RasGDP_cell
RasGTP_cell
RasGAP_cell
PI3K_cell
PI3K_act_cell
PIP2_cell
PIP3_cellPTEN_cell
PDK1_cell
PDK1_memb_cell
Akt_cell
Akt_memb_cell
Akt_T308_cell
mTORc2_cell
PHLPP_cell
Rheb_GTP Rheb_GDP
mTOR
mTOR_inact
CaM_Ca4_cell
CaM_Ca3_cell
Ca_cell
CaM_Ca_cell
CaM_cell
CaM_Ca2_cell
Inact_GEF_cell
CaM_GEF_cell
Betacatenin_GSK3_cell
GSK3_APC_cell
Betacatenin_Axin_cell
Axin_GSK3_cell
GSK3_cell
TSC1_TSC2_cell
TSC1_TSC2_T1462
APC_Axin_GSK3_TSC_S1337
APC_p_Axin_p_GSK3_TSC_S1337
Dsh_Axin_GSK3_TSC_S1337
Dsh_Axin_GSK3_p_TSC_T1462_S1337
Axin_GSK3_p
TSC1_TSC2_S1337_T1462
TSC1_TSC2_S1337
APC_Axin_GSK3_p
Dsh_Axin_GSK3_p_TSC_S1337
Dsh_Axin_GSK3_TSC_T1462_S1337
Betacatenin_APC_p_Axin_p_GSK3_TSC_T1462
Betacatenin_p_APC_p_Axin_p_GSK3_TSC_T1462
Dsh_Axin_GSK3
Dsh_Axin_GSK3_p
Fig. 7. Petri net model of the second iteration Akt-Wnt-mTOR model.
the edges of the interaction graph: a node can either activate or inhibit anothernode. The assignment of the influence type is done according to a criterion: ifthe downstream signaling from node Y is initiated or enhanced because of theinteraction with node X, then the influence of X on Y is activation, otherwise,it is inhibition. Activation is represented as a regular arrow and inhibition, asa tee shape arrow. The result of this structural analysis is Figure 1. We do notintend to formally present the algorithm to generate an interaction graph in thispaper. This work is still ongoing.
The interaction graph generated so far is not a static representation only;it contains all the necessary information to map the simulation data onto thesignaling network. To display the activity state of the signaling components ofthe network, we color code the nodes. A protein is highly active if it is red and
356 BioPPN’16 – Biological Processes and Petri Nets
less active as it turns blue. To display the strength of the interactions betweensignaling components of the network, we color code and modify the thickness ofthe edges. If a regular (tee) arrow between two nodes is black and thick, thenthe rate of the activation (inhibition) reactions involving these two proteins ishigh. When the arrow fades, the reaction rate slows down. This is an indicationof the information transfer along the signaling pathway.
For the first iteration Akt-Wnt-mTORmodel, we created two dynamic graphsfrom the simulation data that included the mTOR time courses shown in Fig-ure 4 (left). However, instead of a plot representing the time course of only onevariable, the dynamic graphs show the dynamics of 54 variables (places) and 68reactions (transitions) all at once. The dynamic graph on the left in Supplemen-tary Figure 1 3 shows the activity of the signaling network when both calcium andWnt are present. This animation shows an active Akt pathway, reacting to thetwo calcium influxes, strongly inhibiting TSC2 and eventually causing mTORto be transiently active. The Wnt pathway is less effective at transmitting thesignal to mTOR. The state of GSK3 does not change. This can be explained bythe surprising small concentration of the destruction complex. This is a knownfeature of the Wnt pathway [13]. The Wnt pathway is usually studied for Wntsignals lasting a few hours and causing β-catenin to slowly increase. For briefstimulations, the low concentration of the destruction complex might act as asignaling bottleneck. The dynamic graph on the right in Supplementary Figure 1shows that the absence of Wnt does not have a significant effect on the dynamicsof the signaling network. Taken together, these graphs show that the feedforwardmotif (Akt-GSK3-TSC2) of the first iteration model acts as an ’OR’ logic gate.Akt by itself can deactivate TSC2, thus activating mTOR as a result. Wnt byitself can deactivate GSK3 although mildly, thus activating mTOR as a result.There is no significant synergy when both pathways are active and the outputsignal is not prolonged. For these reasons, this model was in disagreement withexperimental data.
For the second iteration Akt-Wnt-mTOR model, we created three dynamicgraphs from the simulation data that included the mTOR time courses shownin Figure 5 (right). These graphs show the dynamics of 65 variables and 98reactions all at once. The dynamic graph at the left in Supplementary Figure2 displays the activity of the signaling network when calcium alone is present.This animation shows an active Akt in response to calcium, but with no effecton mTOR. Both TSC2 and GSK3 are protected within the destruction complexand are still inhibiting Rheb, thus mTOR. The dynamic graph in the middleshows the simulation data when Wnt alone is present. This animation shows adeactivation of the destruction complex, but with little effect on mTOR. Finally,the dynamic graph at the right of Supplementary Figure 2 shows that whencalcium and Wnt are triggering signaling together, they strongly activate mTOR.The reason for this response is that the recruitment of Axin to Dsh followingits activation by Wnt exposes GSK3 and TSC2 to phosphorylation by Akt.
3 A version of this paper with the supplementary figures is available athttp://www2.ift.ulaval.ca/˜hardy/bioppn2016_hardy.pdf
S.V. Hardy M.P. Fortin: Analysis of the Signal Transduction Dynamics 357
This inhibits their signaling activity and as a result, mTOR is activated. Takentogether, these graphs show that the feedforward motif of the second iterationmodel acts as an ’AND’ logic gate. Akt and Wnt must be active at the sametime for the signal to propagate downstream. This is a coherent feedforwardmotif with a coincidence detection property. The dual effect of Akt, first onGSK3 and then on TSC2, amplifies also the upstream signal on the downstreamtarget.
4 Discussion and conclusion
A major goal of systems biology is to bridge molecular components and higher-level biological functions across multiple scales by understanding the complexinteractions in between. To gain the knowledge necessary to control these sys-tems, with therapeutics for example, the topological reconstruction of the un-derlying networks is insufficient. It is necessary to mechanistically determine thesystems dynamics. Regulatory motifs are significant functional modules of cellu-lar machinery that is organized into interconnected networks. The most commonones are signaling, genetic regulation, and metabolism, but include others likeepigenetic regulation. Determining the dynamics of these networks is the keyto understanding systems complex behavior. To achieve this understanding itis crucial to combine experimental methods with tools from computational cellbiology.
In this paper, we presented two dynamic models and their simulation data toanalyze the signaling dynamics of the network regulating the protein mTOR, animportant regulator of cellular protein synthesis. We showed early work on anevolving mathematical model of two pathways known to be upstream of mTOR:the Akt and Wnt pathways. An initial version of the model was assembled fromthe combination of two published models [11,21]. This model was then modifiedto include more molecular details from the literature. The dynamic behavior ofour second model relies on the fact that GSK3 and TSC2 are protected from theinhibitory phosphorylation of Akt when in the destruction complex. Simulationresults and analysis with dynamic graphs of the second model showed that thecrosstalk between the two pathways forms a regulatory motif that functionsas a coincidence detector. These results are in agreement with published data[15]. Another interesting preliminary result of this theoretical study is that theconcentration of the protein APC must not be at low levels to support thisfunction contrary to what was observed in other species and cell lines for thisprotein. Some evidence in early measures of APC in neurons already supportsthis hypothesis [2]. This is a prediction that can be tested experimentally.
We still cannot provide a satisfying answer to the initial question that mo-tivated this study: How is it possible that a strong, but very brief, synapticstimulation can trigger the prolonged activation of mTOR needed to induce L-LTP? The biological signal tends to slow down as it propagates downstream.The sudden production and realease of biomolecules like PIP3 and Wnt andtheir slow degradation contributes also to lengthen mTOR activity. Nonethe-
358 BioPPN’16 – Biological Processes and Petri Nets
less, we are still short of at least 15 minutes of activity, which represents 33%of the time mTOR is active after HFS stimulation. Our results also show thatthe Akt-GSK3-TSC2 feedforward motif cannot completely assume this function.This suggests that the network is incomplete and that other network motifs areprobably involved. In the next phase of this project, we will add other proteinsand interactions to the model. We will take a closer look at the role of ERKsince it is activated by calcium and is involved in the regulation of Akt andp70S6K, a substrate of mTOR. We will also explore the possibility that one ormore feedback loops might modulate mTOR activity. For example, ERK andWnt are part of a positive feedback loop in metastatic cells [12]. All these possi-bilities can be tested with modeling and simulation to provide valuable insightsto experimentalists and identify the most promising hypotheses.
Petri nets are an essential tool in our approach of theoretical analysis of bio-logical systems. They provide a link between dynamical formalisms and graphs.In this paper, the use of dynamic graphs was limited, but its role will becomesubstantial as the model grows in complexity and in number of interacting net-work motifs. Dynamic graphs provide a holistic view of the system behavior. Weare currently working on the algorithm that will generate dynamic graphs formodels with complex biochemical mechanisms, such as the destruction complexregulation by Wnt. We also plan to explore the use of formal methods to detectand characterize interactions in dynamic graphs to go beyond visual analysis.Potential uses for this last feature are a tool to objectively analyze complex be-haviors between different versions of a model, for example when exploring theparameter space, or an investigation tool into the dynamics of models of verylarge biological systems.
AcknowledgmentThis work was funded by NSERC discovery grant 418603 (SVH).
References1. Azeloglu, E.U., Hardy, S.V., Eungdamrong, N.J., Chen, Y., Jayaraman, G.,
Chuang, P.Y., Fang, W., Xiong, H., Neves, S.R., Jain, M.R., Li, H., Ma’ayan,A., Gordon, R.E., He, J.C., Iyengar, R.: Interconnected network motifs controlpodocyte morphology and kidney function. Science Signaling 7(311), ra12–ra12(2014)
2. Brakeman, J., Gu, S., Wang, X., Dolin, G., Baraban, J.: Neuronal localization ofthe adenomatous polyposis coli tumor suppressor protein. Neuroscience 91(2), 661– 672 (1999)
3. Cai, S.L., Tee, A.R., Short, J.D., Bergeron, J.M., Kim, J., Shen, J., Guo, R.,Johnson, C.L., Kiguchi, K., Walker, C.L.: Activity of tsc2 is inhibited by akt-mediated phosphorylation and membrane partitioning. The Journal of Cell Biology173(2), 279–289 (2006)
4. Chen, J., Park, C.S., Tang, S.J.: Activity-dependent synaptic wnt release regu-lates hippocampal long term potentiation. Journal of Biological Chemistry 281(17),11910–11916 (2006)
S.V. Hardy M.P. Fortin: Analysis of the Signal Transduction Dynamics 359
5. Fukumoto, S., Hsieh, C.M., Maemura, K., Layne, M.D., Yet, S.F., Lee, K.H., Mat-sui, T., Rosenzweig, A., Taylor, W.G., Rubin, J.S., Perrella, M.A., Lee, M.E.: Aktparticipation in the wnt signaling pathway through dishevelled. Journal of Biolog-ical Chemistry 276(20), 17479–17483 (2001)
6. Hardy, S., Iyengar, R.: Analysis of dynamical models of signaling networks withPetri nets and dynamic graphs. In: Modeling in Systems Biology, pp. 225–251.Springer London (2011)
7. Hardy, S., Robillard, P.N.: Modeling and simulation of molecular biology systemsusing Petri nets: Modeling goals of various approaches. Journal of Bioinformaticsand Computational Biology 02(04), 619–637 (2004)
8. Heiner, M., Herajy, M., Liu, F., Rohr, C., Schwarick, M.: Application and Theoryof Petri Nets: 33rd International Conference, PETRI NETS 2012, Hamburg, Ger-many, June 25-29, 2012. Proceedings, chap. Snoopy – A Unifying Petri Net Tool,pp. 398–407. Springer Berlin Heidelberg, Berlin, Heidelberg (2012)
9. Heiner, M., Schwarick, M., Wegener, J.T.: Application and Theory of Petri Netsand Concurrency: 36th International Conference, PETRI NETS 2015, Brussels,Belgium, June 21-26, 2015, Proceedings, chap. Charlie – An Extensible Petri NetAnalysis Tool, pp. 200–211. Springer International Publishing, Cham (2015)
10. Inoki, K., Ouyang, H., Zhu, T., Lindvall, C., Wang, Y., Zhang, X., Yang, Q.,Bennett, C., Harada, Y., Stankunas, K., Wang, C.y., He, X., MacDougald, O.A.,You, M., Williams, B.O., Guan, K.L.: Tsc2 integrates wnt and energy signals viaa coordinated phosphorylation by ampk and gsk3 to regulate cell growth. Cell126(5), 955–968 (2006)
11. Jain, P., Bhalla, U.S.: Signaling logic of activity-triggered dendritic protein syn-thesis: An mtor gate but not a feedback switch. PLoS Comput Biol 5(2), 1–17 (022009)
12. Kim, D., Rath, O., Kolch, W., Cho, K.H.: A hidden oncogenic positive feedbackloop caused by crosstalk between wnt and erk pathways. Oncogene 26(31), 4571–4579 (01 2007)
13. Lee, E., Salic, A., Kr¸ger, R., Heinrich, R., Kirschner, M.W.: The roles of apc andaxin derived from experimental and theoretical analysis of the wnt pathway. PLoSBiol 1(1) (10 2003)
14. Li, Y., Li, B., Wan, X., Zhang, W., Zhong, L., Tang, S.J.: Nmda receptor activationstimulates transcription-independent rapid wnt5a protein synthesis via the mapksignaling pathway. Molecular Brain 5(1), 1–9 (2012)
15. Ma, T., Tzavaras, N., Tsokas, P., Landau, E.M., Blitzer, R.D.: Synaptic stimulationof mtor is mediated by wnt signaling and regulation of glycogen synthetase kinase-3. The Journal of Neuroscience 31(48), 17537–17546 (2011)
16. Mak, B.C., Kenerson, H.L., Aicher, L.D., Barnes, E.A., Yeung, R.S.: Aberrant β-catenin signaling in tuberous sclerosis. The American Journal of Pathology 167(1),107–116 (06 2016)
17. Mak, B.C., Takemaru, K.I., Kenerson, H.L., Moon, R.T., Yeung, R.S.: The tuberin-hamartin complex negatively regulates β-catenin signaling activity. Journal of Bi-ological Chemistry 278(8), 5947–5951 (2003)
18. Moraru, I.I., Schaff, J.C., Slepchenko, B.M., Blinov, M., Morgan, F., Lakshmi-narayana, A., Gao, F., Li, Y., Loew, L.M.: The virtual cell modeling and simulationsoftware environment. IET systems biology 2(5), 352–362 (09 2008)
19. Ryan, T.J., Roy, D.S., Pignatelli, M., Arons, A., Tonegawa, S.: Engram cells retainmemory under retrograde amnesia. Science 348(6238), 1007–1013 (2015)
360 BioPPN’16 – Biological Processes and Petri Nets
20. Shumway, S.D., Li, Y., Xiong, Y.: 14-3-3 binds to and negatively regulates thetuberous sclerosis complex 2 (tsc2) tumor suppressor gene product, tuberin. Jour-nal of Biological Chemistry 278(4), 2089–2092 (2003)
21. Tan, C.W., Gardiner, B.S., Hirokawa, Y., Smith, D.W., Burgess, A.W.: Analysis ofwnt signaling β-catenin spatial dynamics in hek293t cells. BMC Systems Biology8(1), 1–18 (2014)
22. Tsokas, P., Ma, T., Iyengar, R., Landau, E.M., Blitzer, R.D.: Mitogen-activatedprotein kinase upregulates the dendritic translation machinery in long-term poten-tiation by controlling the mammalian target of rapamycin pathway. The Journalof Neuroscience 27(22), 5885–5894 (2007)
23. Tudor, J.C., Davis, E.J., Peixoto, L., Wimmer, M.E., van Tilborg, E., Park, A.J.,Poplawski, S.G., Chung, C.W., Havekes, R., Huang, J., Gatti, E., Pierre, P., Abel,T.: Sleep deprivation impairs memory by attenuating mtorc1-dependent proteinsynthesis. Science Signaling 9(425), ra41–ra41 (2016)
24. Valvezan, A.J., Zhang, F., Diehl, J.A., Klein, P.S.: Adenomatous polyposis coli(apc) regulates multiple signaling pathways by enhancing glycogen synthase kinase-3 (gsk-3) activity. Journal of Biological Chemistry 287(6), 3823–3832 (2012)
S.V. Hardy M.P. Fortin: Analysis of the Signal Transduction Dynamics 361
![[VII]. Regulation of Gene Expression Via Signal Transduction Reading List VII: Signal transduction Signal transduction in biological systems](https://img.pdfslide.us/doc/110x75/56649e385503460f94b28319/vii-regulation-of-gene-expression-via-signal-transduction-reading-list-vii.jpg)