Embed Size (px)
Citation preview
HAL Id: hal-01631444https://hal.archives-ouvertes.fr/hal-01631444
Submitted on 9 Nov 2017
HAL is a multi-disciplinary open accessarchive for the deposit and dissemination of sci-entific research documents, whether they are pub-lished or not. The documents may come fromteaching and research institutions in France orabroad, or from public or private research centers.
L’archive ouverte pluridisciplinaire HAL, estdestinée au dépôt et à la diffusion de documentsscientifiques de niveau recherche, publiés ou non,émanant des établissements d’enseignement et derecherche français ou étrangers, des laboratoirespublics ou privés.
Analysis of the exceptionally warm December 2015 inFrance using flow analogues
Aglaé Jézéquel, Pascal Yiou, Sabine Radanovics, Robert Vautard
To cite this version:Aglaé Jézéquel, Pascal Yiou, Sabine Radanovics, Robert Vautard. Analysis of the exceptionally warmDecember 2015 in France using flow analogues. Bulletin of the American Meteorological Society, Amer-ican Meteorological Society, 2017, 99 (1), pp.S76-S79. �10.1175/BAMS-D-17-0103.1�. �hal-01631444�
Analysis of the exceptionally warm December 2015 in France using flow analogues
Aglaé Jézéquel, Pascal Yiou, Sabine Radanovics, Robert Vautard
Laboratoire des Sciences du Climat et de l’Environnement, UMR8212 CEA-CNRS-UVSQ, IPSL
and U Paris Saclay, Gif-sur-Yvette, France.
Capsule December 2015 in France was an extreme of circulation and temperature. Both circulation
and climate change partly explain the 4°C anomaly. We found no link between climate change and
circulation.
The event
The December 2015 average temperature broke a record in France, with an anomaly of
+4.1°C (Fig. 1a) with respect to the 1949-2015 climatology. The linear trend of average December
temperature (in red in Fig. 1a) is not significant (p-value > 0.05), as regional temperature variability
is high in winter. Such a positive temperature anomaly has impacts on the vegetation cycle (the
French press covered this topic in the daily newspaper Le Monde1). It also affects local economies,
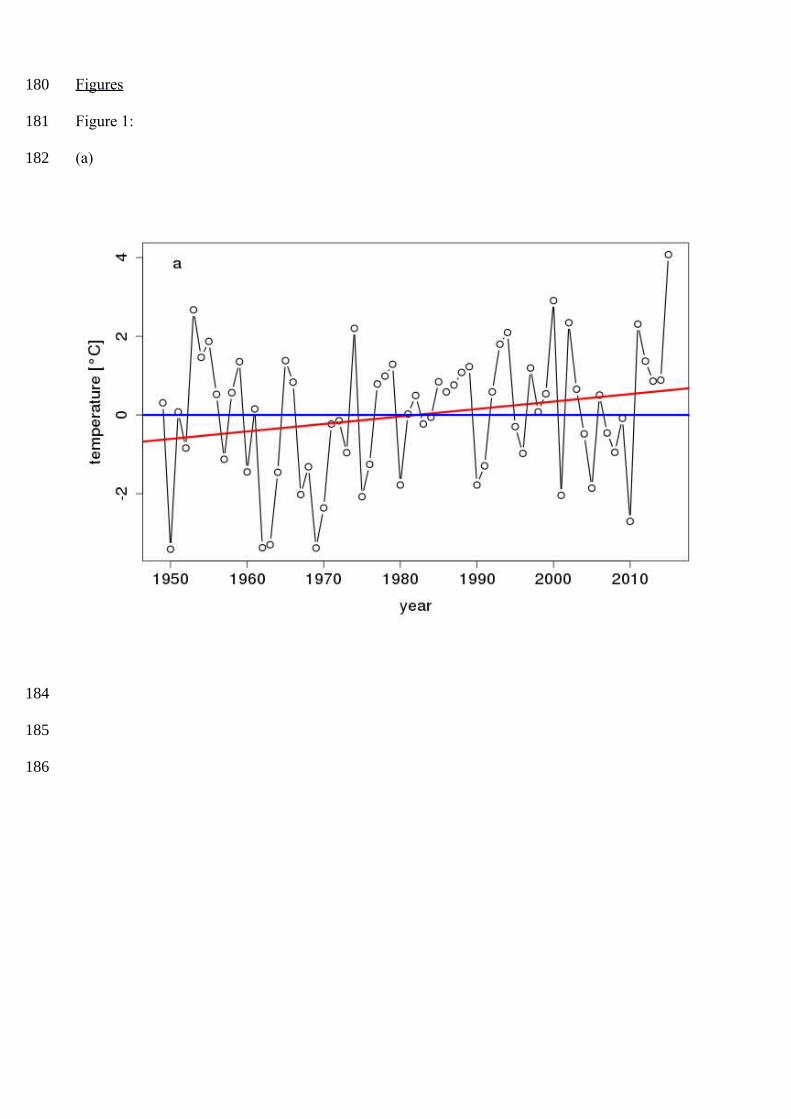
e.g. tourism in ski resorts. The temperature anomaly was concomitant with a zonal atmospheric
circulation over Western Europe (Fig. 1b), directing mild subtropical air masses towards France. We
found that the mean monthly SLP (sea level pressure) anomaly over the black box of Fig.1b is also
a record high for the NCEP reanalysis. Such a circulation type generally leads to warm temperatures
overs France (Yiou and Nogaj, 2004).
In this paper we seek to address three questions: How much does the circulation anomaly
explain the temperature anomaly during December 2015 in France? What is the influence of climate
change on the occurrence of the circulation anomaly? How does the distribution of temperature
conditional to the atmospheric circulation evolve with climate change? We hence perform a
conditional attribution exercise (NAS, 2016, p. 30), with a circulation that is fixed to the
1http://abonnes.lemonde.fr/biodiversite/article/2015/12/30/la-nature-deboussolee-par-un-hiver-tres-doux_4839801_1652692.html?xtmc=temperature&xtcr=1
1
2
3
4
5
6
7
8
9
10
11
12
13
14
15
16
17
18
19
20
21
22
23
24
25
12
observation of December 2015. This estimates the thermodynamic contribution of climate change
on the increase of temperature (Vautard et al., 2016; Yiou et al., 2017).
Flow analogues and the role of circulation
We evaluated the link between the SLP anomalies over the black box in Fig. 1b and temperature in
France using the method of flow analogues (e.g. Yiou et al. 2017). We considered the French
national temperature index supplied by Météo France (Soubeyroux et al. 2016). This daily index is
computed as the average of 30 stations distributed over France and starts in 1949. We use
temperature anomalies with respect to a daily seasonal cycle obtained by spline smoothing (cf. Yiou
et al., 2008). The circulation proxy is the SLP from the National Centers for Environmental
Predictions (NCEP) reanalysis, between 1949 and 2015. For each day of December 2015 we
identified the 30 best analogues of SLP (with a Euclidean distance) from 1949 to 2015 on the
domain delimited by the black rectangle in Fig. 1b. Jézéquel et al. (2017) showed that the results on
analogues are qualitatively insensitive to the number of analogues (between 5 and 30 analogues).
We simulate daily sequences of SLP by randomly picking one of the 30 best analogues within the
NCEP dataset for each day. The repetition of this random selection (with replacements) builds an
ensemble of uchronic months. Those uchronic months reproduce the SLP anomaly of December
2015 (see Fig. S1a-d in Supplementary Material). We then compute monthly averages for December
of the national temperature index. We hence obtain uchronic French seasonal anomalies of
temperature for December. We iterated this process 104 times in order to produce uchronic
probability distributions of monthly mean temperatures (see Jézéquel et al. 2017 for more details).
This uchronic distribution of temperatures represents the ensemble of temperatures that could have
been expected for the circulation observed in December 2015. We compared the uchronic
distribution of temperature anomalies to a distribution built from randomly picked December days.
In Fig. 1c, the Control experiment corresponds to a monthly average of the daily temperature
anomalies from the 104 random samples without conditioning on the atmospheric circulation. In
26
27
28
29
30
31
32
33
34
35
36
37
38
39
40
41
42
43
44
45
46
47
48
49
50
51
order to take into account the dependence between consecutive days in the Control distribution, we
calculated the monthly means using only every third day (Jézéquel et al. 2017).
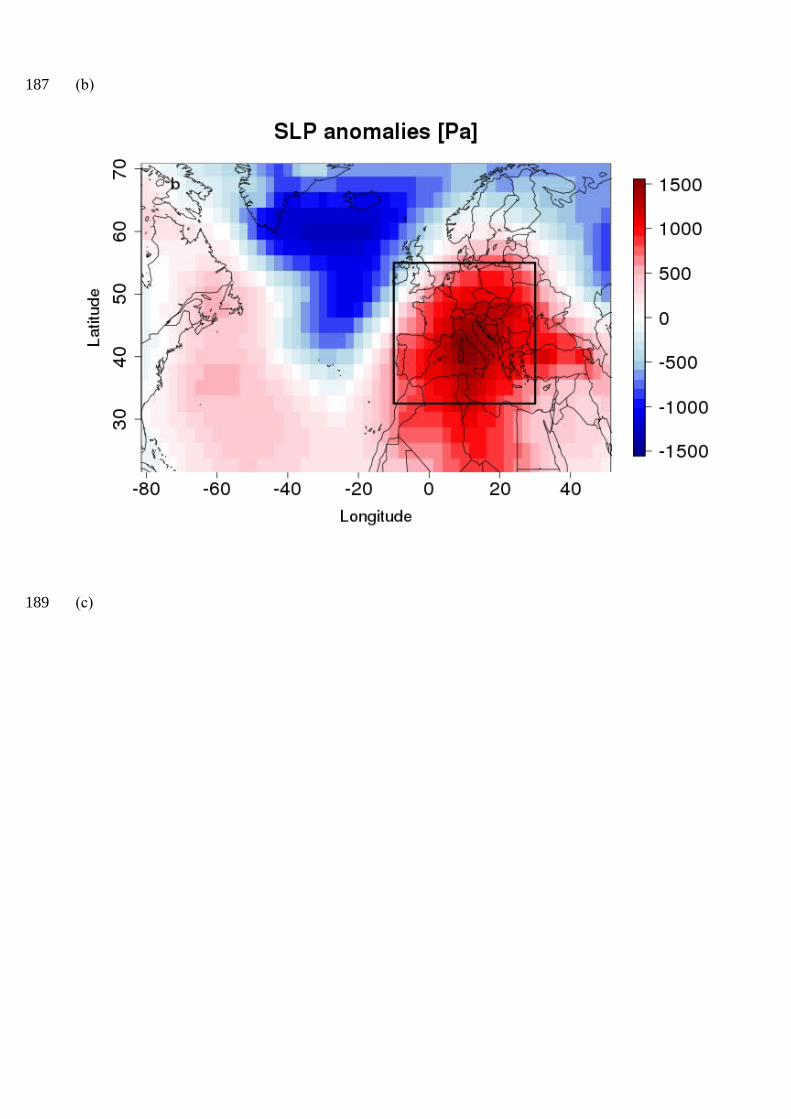
We find that the SLP partly explains the monthly temperature anomaly in France during
December 2015 (Fig. 1c). The median of the uchronic temperature anomaly distribution is 1.3°C,
i.e. ~30% of the anomaly. The other ~70% of the anomaly could be explained by other factors (e.g.
snow cover feedback). This positive anomaly demonstrates the link between the synoptic situation
and the anomaly of temperature in France, and justifies the choice of a conditional attribution
approach.
Role of climate change
In order to estimate the role of climate change we rely on the CESM1 model large ensemble,
CESM-LENS (Kay et al., 2015). We use 30 members for both surface temperature and SLP using
historical runs between 1951 and 2005 and RCP8.5 between 2006 and 2100. We reconstitute the
French national temperature index from the surface temperature using the coordinates of the 30
stations used to calculate the index. Kay et al. (2015) showed that CESM-LENS reproduces
reasonably well features of the Northern Hemisphere atmospheric circulation. An analysis of the
SLP distances between those observed during December 2015 and CESM simulations indicates that
they are not statistically different from the NCEP reanalysis (Fig.S1e in the Supplementary
material). We hence consider that this model does not yield biases that prevent its use for the
purpose of this study.
We estimate the influence of climate change on the circulation pattern leading to December
2015 by computing the probability distributions of distances between SLP anomalies among all the
December days in both NCEP and CESM and the closest day of December 2015 (Fig. 2a). We keep
only the distances below the 5th percentile of the distribution, in order to focus on the days with SLP
anomalies closest to those observed in December 2015. For each December, we count the number
of days below this threshold for each ensemble member (NCEP and CESM). If the circulation that
52
53
54
55
56
57
58
59
60
61
62
63
64
65
66
67
68
69
70
71
72
73
74
75
76
77
prevailed in December 2015 became more frequent with time, then a trend should be detected in
this number of days. We detect no such trend. Therefore it is not possible to conclude there is an
impact of climate change on the atmospheric circulation itself.
We then estimate the temperature anomaly for a similar event in terms of synoptic
circulation without climate change, and in future climate change scenarios by computing analogues
of circulation from different periods of observations and CESM simulations. We analyzed the
uchronic temperature anomalies constructed with analogues of the December 2015 flows from two
time periods of the NCEP dataset. We compared an early subset of 33 years (1949-1981) to a more
recent one (1982-2014). The two gold boxplots in Fig. 2b represent those two experiments. We
detected a difference of 0.4°C between the two distributions, in contrast with the monthly
temperature trend for 1949-2015 displayed in Fig. 1c, which is not significant. However, it is not
possible to attribute this difference of temperature to climate change, as it could also relate to
interdecadal variability, especially for very small subsets of 33 years, whose length was imposed by
the NCEP reanalysis length.
In order to study the relative influences of climate change and variability, we rely on CESM-
LENS. We study three periods of 50 years: 1951-2000, 2001-2050, and 2051-2100. Using 30
members, we have 1500 years of data for each sub-period from which we can calculate the
analogues (which correctly represent the observed SLP anomaly as displayed in the supplementary
material Fig. S1a-d). This reduces the uncertainty related to the quality of the analogues we picked.
The three pink boxplots in Fig. 2b represent the uchronic distributions for SLP analogues picked
from CESM-LENS. The three red boxplots represent the control distributions for the same sub-
periods. We observe that the December 2015 anomaly of temperature was never reached before
2000. It is still not reached for 2001-2050 under the RCP8.5 scenario. For the second half of the
21st century the temperature anomaly is expected to exceed 4°C for the same synoptic situation.
The observed anomaly is still warmer than the median of the control distribution. A caveat of this
study is that we only used one model, which could have biases especially in the future.
78
79
80
81
82
83
84
85
86
87
88
89
90
91
92
93
94
95
96
97
98
99
100
101
102
103
Conclusion
The month of December 2015 set a record temperature in France. The zonal circulation that
prevailed over Western Europe during the whole month accounts for ~30% or 1.3°C of the
temperature anomaly. No trend was found in the atmospheric circulation patterns themselves (Fig.
2a). For this given circulation, our analysis shows that the observed temperature is never reached in
the second half of the 20th century (Fig. 2b), and the model is unable to reach it even during the
first half of the 21st century. However, the December temperature observed in 2015 is projected to
be exceeded in the second half of the 21st century under the same synoptic situation. Cattiaux et al.
(2010) found with a similar analysis that the cold winter of 2009/2010 would have been colder if
not for climate change. Our analysis of December 2015 is a warm counterpart to that study. We find
a 1.4°C difference between the median of the uchronic temperatures of the second half of the 20th
century and the first half of the 21st century and an additional 1.9°C for the second half of the 21st
century. We find approximately the same differences between Control distribution medians, which
means that the trend conditional to the circulation equals the unconditional trend.
Acknowledgements
PY, AJ and SR are supported by the ERC grant No. 338965-A2C2. This work is also supported by
the Copernicus EUCLEIA project No. 607085.
References
Cattiaux, J., Vautard, R., Cassou, C., Yiou, P., Masson-Delmotte, V., & Codron, F. (2010). Winter
2010 in Europe: a cold extreme in a warming climate. Geophysical Research Letters, 37(20).
doi:10.1029/2010GL044613
Jézéquel, A., Yiou P., Radanovics S. (2017, accepted). Role of circulation in European heatwaves
using flow analogues. Climate Dynamics. doi: 10.1007/s00382-017-3667-0
104
105
106
107
108
109
110
111
112
113
114
115
116
117
118
119
120
121
122
123
124
125
126
127
128
129
Kay, J.E., Deser, C., Phillips, A., Mai, A., Hannay, C., Strand, G., Arblaster, J.M., Bates, S.C.,
Danabasoglu, G., Edwards, J. and Holland, M. (2015). The Community Earth System Model
(CESM) large ensemble project: A community resource for studying climate change in the presence
of internal climate variability. Bulletin of the American Meteorological Society, 96(8), pp.1333-
1349. doi:10.1175/BAMS-D-13-00255.1
Kalnay, E., Kanamitsu, M., Kistler, R., Collins, W., Deaven, D., Gandin, L., Iredell, M., Saha, S.,
White, G., Woollen, J. and Zhu, Y. (1996). The NCEP/NCAR 40-year reanalysis project. Bulletin of
the American meteorological Society, 77(3), pp.437-471. doi:10.1175/1520-
0477(1996)077<0437:TNYRP>2.0.CO;2
National Academies of Sciences, Engineering, and Medicine. 2016. Attribution of Extreme Weather
Events in the Context of Climate Change. Washington, DC: The National Academies Press. doi:
10.17226/21852.
Soubeyroux, J. M., Ouzeau, G., Schneider, M., Cabanes, O., & Kounkou-Arnaud, R. (2016), Les
vagues de chaleur en France: analyse de l'été 2015 et évolutions attendues en climat futur.
Rubrique: Climatologie. Doi:10.4267/2042/60704
Vautard R., P. Yiou, F. Otto, P. Stott, N. Christidis, G.J. van Oldenborgh and N. Schaller (2016).
Attribution of human-induced dynamical and thermodynamical contributions in extreme weather
events, Environ. Res. Lett. 11 114009 doi:10.1088/1748-9326/11/11/114009
Yiou, P., and M. Nogaj (2004), Extreme climatic events and weather regimes over the North
Atlantic: When and where? Geophys. Res. Lett., 31, L07202, doi:10.1029/2003GL019119.
Yiou, P., K. Goubanova, Z. X Li., and M. Nogaj (2008), Weather regime dependence of extreme
value statistics for summer temperature and precipitation, Nonlin. Proc. Geophys., 15, 365–378.
Yiou, P., Jézéquel, A., Naveau, P., Otto, F. E. L., Vautard, R., and Vrac, M. (2017) A statistical
framework for conditional extreme event attribution, Adv. Stat. Clim. Meteorol. Oceanogr., 3, 17-
31, doi:10.5194/ascmo-3-17-2017.
130
131
132
133
134
135
136
137
138
139
140
141
142
143
144
145
146
147
148
149
150
151
152
153
154
155

156
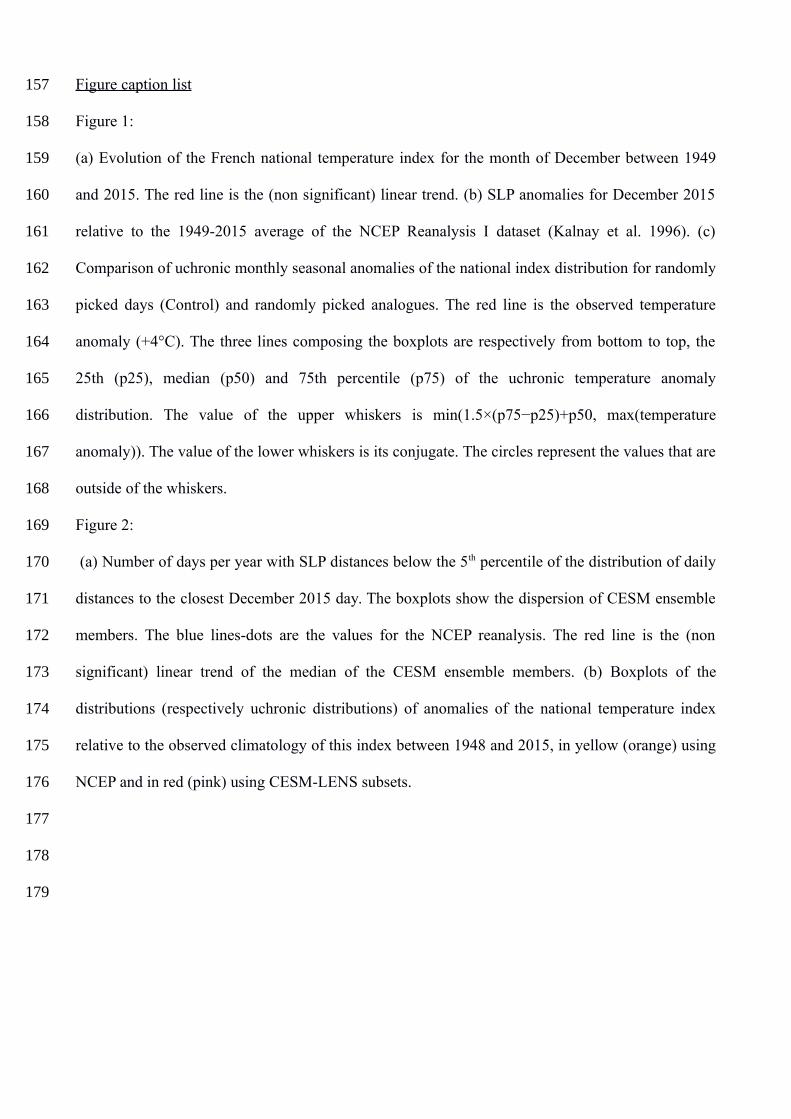
Figure caption list
Figure 1:
(a) Evolution of the French national temperature index for the month of December between 1949
and 2015. The red line is the (non significant) linear trend. (b) SLP anomalies for December 2015
relative to the 1949-2015 average of the NCEP Reanalysis I dataset (Kalnay et al. 1996). (c)
Comparison of uchronic monthly seasonal anomalies of the national index distribution for randomly
picked days (Control) and randomly picked analogues. The red line is the observed temperature
anomaly (+4°C). The three lines composing the boxplots are respectively from bottom to top, the
25th (p25), median (p50) and 75th percentile (p75) of the uchronic temperature anomaly
distribution. The value of the upper whiskers is min(1.5×(p75−p25)+p50, max(temperature
anomaly)). The value of the lower whiskers is its conjugate. The circles represent the values that are
outside of the whiskers.
Figure 2:
(a) Number of days per year with SLP distances below the 5th percentile of the distribution of daily
distances to the closest December 2015 day. The boxplots show the dispersion of CESM ensemble
members. The blue lines-dots are the values for the NCEP reanalysis. The red line is the (non
significant) linear trend of the median of the CESM ensemble members. (b) Boxplots of the
distributions (respectively uchronic distributions) of anomalies of the national temperature index
relative to the observed climatology of this index between 1948 and 2015, in yellow (orange) using
NCEP and in red (pink) using CESM-LENS subsets.
157
158
159
160
161
162
163
164
165
166
167
168
169
170
171
172
173
174
175
176
177
178
179
Figures
Figure 1:
(a)
180
181
182
184
185
186
(b)
(c)
187
189
191
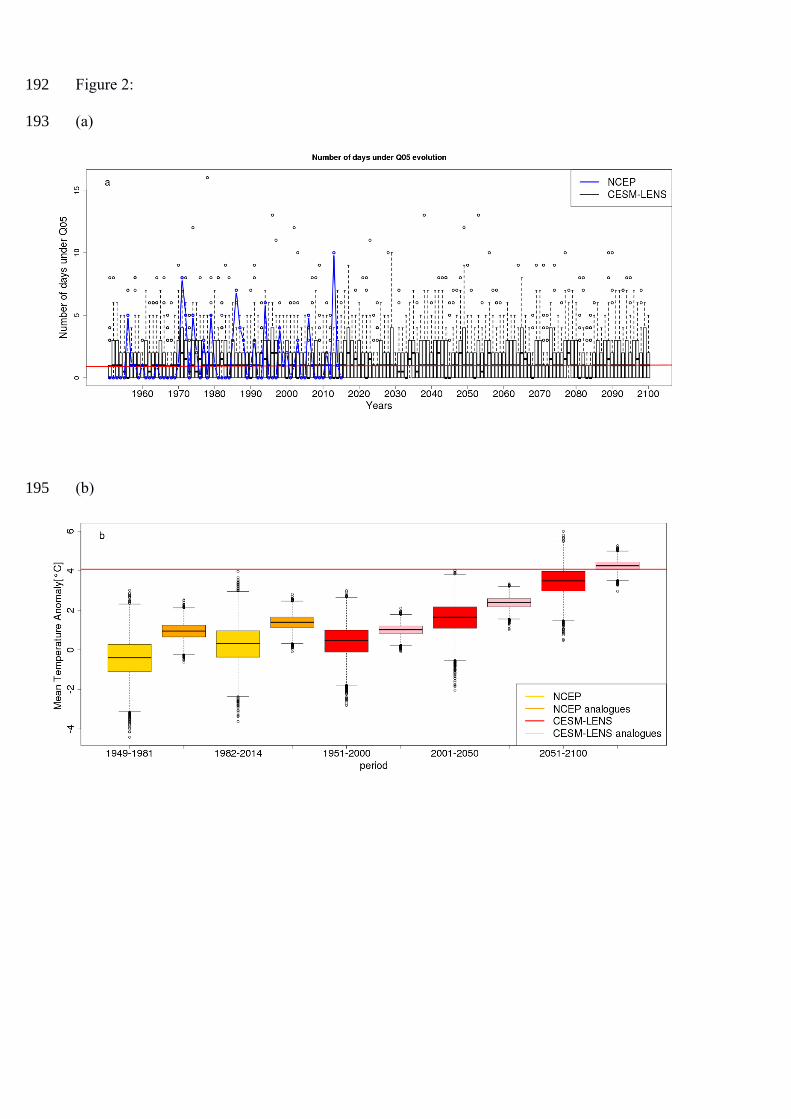
Figure 2:
(a)
(b)
192
193
195