Embed Size (px)
Citation preview
European Journal of Engineering and Technology Vol. 4 No. 3, 2016 ISSN 2056-5860
Progressive Academic Publishing, UK Page 18 www.idpublications.org
ANALYSIS OF THE EFFECT OF FLEXIBLE ALTERNATING CURRENT
TRANSMISSION SYSTEM (FACTS) ON THE NIGERIAN 330KV
TRANSMISSION NETWORK USING ERACS AND MATLAB SIMULLINK
1Rilwan Usman,
2Marvin Barivure Sigalo &
3Steve McDonald (PhD)
1Department of Electrical and Electronics Engineering Modibbo Adama University of Technology Yola
Adamawa State, NIGERIA 2Center for Electrical Power System Research, Department of Electrical Engineering, Rivers State
University of Science and Technology, Port Harcourt, NIGERIA 3Department of Physics and Electrical Engineering, Northumbria University, Newcastle Upon Tyne
UNITED KINGDOM
ABSTRACT
The increasing demand for electricity in Nigeria has consequently led to the construction
of new power stations in different location within the country. This increment results in
transmission systems being pushed closer to their stability and thermal limit. This research
takes a look at unified power flow controller (UPFC) which is a flexible alternative current
transmission system (FACTS) device as a cost effective alternative to upgrading electrical
transmission system infrastructure than the traditional form of constructing new
transmission line.
Keywords: FACTS, UPFC, Nigerian 330KV Transmission Network.
INTRODUCTION
On-going expansions and growth of electricity industry has pushed transmission system
closer to its thermal and stability limits at the same time the quality of power delivered is
greater than ever (Peserba, 2005). Nowadays power systems require careful design of new
systems due to its complexity especially for transmission systems in new deregulated
electricity market (Kalyani& Das, 2008). The demand for a more optimal and profitable
operation of power systems has made the need for advanced technologies more paramount
in-order to produce a reliable and secure operation of power systems (Peserba, 2005).
The introduction of Flexible alternating current transmission systems (FACTS) in the
1980s has produced a new approach to solving the problem of designing and power
system (Hingorani&Gyugi, 2000). This technology allows for the improvement of existing
transmission infrastructure with minimal investment, time duration and environmental
impact to the traditional mode of upgrading line. This provides a cost effective alternative
to the construction of new transmission line (Peserba, 2005).
FACTS technology is based on the use of high speed power electronics to facilitate power
control, enhance the capacity to transfer power, improve the system stability, provide
security of supply, decrease in the line losses and generation cost (Singh et el, 2008). As
such this providing a reliable and efficient means of transmitting power generated from a
pool of power plant and load centre at a lower cost (Mahdadet el, 2006).

European Journal of Engineering and Technology Vol. 4 No. 3, 2016 ISSN 2056-5860
Progressive Academic Publishing, UK Page 19 www.idpublications.org
The research then looked at the different ways of selecting optimum location of the
installing a unified power flow controller on the 330kV Nigeria transmission network. The
method adopted was the Newton Raphson algorithm which is an algorithm incorporated
on computer aided package, in order to compare the findings with a study by Nwosu
(2010) which was based on sensitivity analysis in arriving at the optimum location of
siting the UPFC. The result of the simulation shows the optimum location of siting the
FACTS controller on the transmission line in between Gombe and Jos, thus agreeing with
the findings of Nwosu (2010). With the installation of three new power plants on the
network the optimum location of siting UPFC changed to the transmission line in between
Akanga and Ikeja West.
FLEXIBLE ALTERNATING CURRENT TRANSMISSION SYSTEM (FACTS)
The IEEE defines FACTS as "Alternating Current Transmission Systems incorporating
power electronics-based and other static controllers to enhance controllability and power
transfer capability." This technology allow for improvement in transmission system
operation with minimal infrastructure impact, environment impact and the time frame
when compared with the construction of new transmission lines (Paserba, 2005). FACTS
technology is a collection of high power controllers which can be applied on individual
basis or in coordination with other controllers to control one or more of the interrelated
system parameters. The following are the effects of lack of fast reliable controllers:
1. Inability of using transmission line at its thermal limits as a result of transient
stability problems.
2. Power flow through unintended lines.
3. Abnormal voltage level and higher losses due to undesirable reactive power flow
(Putrus, 2010).
Fig 1: Transmission line compensation (Putrus, 2010)
In general, FACTS controllers can be divided into four categories
Series Controllers.
Shunt Controllers.
Combined Series-shunt controllers.
Combined Series- series controllers (Hingorani&Gyugyi, 2000).

European Journal of Engineering and Technology Vol. 4 No. 3, 2016 ISSN 2056-5860
Progressive Academic Publishing, UK Page 20 www.idpublications.org
Unified Power Flow Controller (UPFC)
This is the combination of static synchronous compensator (STATCOM) and a static
series compensator (SSSC) which is coupled via a common dc link, in order to allow
bidirectional flow of real power between the series output terminals of the SSSC. The
shunt output terminals of STATCOM are controlled to provide concurrent real and
reactive series line compensation without an external electric energy source. Using
angularly unconstrained series voltage injection, the UPFC is able to control, either
concurrently or selectively, the transmission line voltage, impedance, and angle, or
alternatively, the real and reactive power flow in the line (Hingorani&Gyugyi, 2000).
The UPFC fulfils the function of reactive shunt compensation, active and reactive series
compensation as well as phase shifting. Besides, it also provide stability control to
suppress power System oscillations, improve the transient stability of power system
(Donsion, 2007).
In principle, of the all FACTS devices the unified power flow controller (UPFC) is only
controller that can provide control to all transmission line parameter:
Voltage (|V|)
Phase angle (δ)
Impedance (X)
Operation of UPFC
The basic component of UPFC consist of two voltage source inverters (VSIs) sharing a
common dc storage capacitor (Agelidis&Xu, 2003). One of the VSI is connected to the
transmission system via a shunt transformer, while the other one is connected in series
through a series transformer (Gupta, 2010).
Fig 2: Circuit for a Unified Power Flow Controller (UPFC) (Pasera, 2005).
The series inverter is controlled to inject a symmetrical three phase voltage system (Vc),
of controllable magnitude and phase angle in series with the line in order to control active
and reactive power flow on the transmission line. As such, the series inverter is provided
with reactive power electronically and the active power is transmitted to the dc terminals.
The two VSI’s can work independently of each other by separating the dc side. The shunt
inverter which operates as a STATCOM (Static Synchronous Compensators) generates or
absorbs reactive power to regulate the voltage magnitude at the connection point. While
the series inverter operates as an SSSC (Static synchronous series compensators) generates
or absorbs reactive power to regulate the current flow and hence the power flows on the
transmission line (Gupta, 2010).
Mathematical modelling of UPFC A UPFC can be represented by two voltage sources representing fundamental components
of output voltage waveforms of the two converters and impedance being leakage reactance
of the two coupling transformers. Fig. 2 depicts two voltage source model of UPFC.

European Journal of Engineering and Technology Vol. 4 No. 3, 2016 ISSN 2056-5860
Progressive Academic Publishing, UK Page 21 www.idpublications.org
System voltage is taken as reference vector Vi = Vi0 and V1
i = Vse + Vi the voltage source
Vseand Vsh are controllable in both their magnitude and phase angles. r and θ are
respectively the pu magnitude and phase angle of series voltage source, operating within
the following specified limits given by Eq. (2).
Fig 3: Two voltage-source model of UPFC (Vural&Tümay 2007).
0 ≤ r ≤ rmaxand 0 ≤ ˠ ≤ 2π (2)
Vse should be defined as:
Vse=rViejˠ
(3)
The model is developed by replacing voltage source Vse by a current source Ise parallel
with the transmission line as shown in Fig 4, where bse = 1/Xse
Ise = -jbseVse (4)
The current source Ise can be modelled by injection powers at the two auxiliary buses i and
j.
Sis = Vi (-Ise)* (5)
Sjs = Vj(Ise)* (6)
Injected powers Sis and Sjs can be simplified according to the following operations by
substituting Eqs. (3) and (4) into Eq. (5).
Sis = Vi(jbserViejˠ)* (7)
By using Euler Identity, (ejˠ = cosˠ + jsinˠ), Eq. (7) takes the form of
Sis = Vi(e- (ˠ+90)
bserV*i) (8)
Sis = V2
ibser [cos (- ˠ - 90) + jsin (-ˠ - 90)] (9)
By using trigonometric identities, Eq. (9) reduces to
Sis = -rbseV2
iSinˠ – jrbseV2
iCosˠ (10)
Eq. (10) can be decomposed into its real and imaginary components, Sis = Pis + jQis,
where
Pis = - rbseV2
iSinˠ (11)
Qis = - rbseV2
iCosˠ (12)
Similar modifications can be applied to Eq. (6), final equation takes the form of,
Sjs = ViVjbserSin (θi – θj + ˠ) + jViVjbserCos (θi – θj + ˠ) (13)
Eq. (13) can also be decomposed into its real and imaginary parts, Sis = Pis + jQis,
Pjs = ViVjbserSin (θi – θj + ˠ) (14)
Qjs = ViVjbserCos (θi – θj + ˠ) (15)
Fig 4: Replacement of series voltage source by a current source (Vural&Tümay 2007).

European Journal of Engineering and Technology Vol. 4 No. 3, 2016 ISSN 2056-5860
Progressive Academic Publishing, UK Page 22 www.idpublications.org
Based on Eqs. 11, 12, 14, and 15, power injection model of the series-connected voltage
source can be seen as two dependent power injections at auxiliary buses i and j as shown
in Fig. 5. In UPFC, shunt branch is used mainly to provide both the real power, Pseries,
which is injectedto the system through the series branch, and the total losseswithin the
UPFC. The total switching losses of the twoconverters is estimated to be about 2% of the
power transferred for thyristor based PWM converters (Mohan, 1992). If thelosses are to
be included in the real power injection ofthe shunt-connected voltage source at bus i,
Pshuntis equalto 1.02 times the injected series real power Pseries through the series-connected
voltage source to the system.
P shunt = -1:02Pseries
The apparent power supplied by the series converter is calculated as
Sseries = VseI*ij =re
jˠVi (Vi -Vj/ jXse ) (17)
Active and reactive power supplied by the series converter can be calculated from Eq.
(17).
Sseries = jeVirejˠVi((re
jˠVi + Vi – Vj) / jXse)* (18)
Sseries = rViej(θi+ˠ)
((rVi e-(θi+ˠ)
+ Vie-jθi
– Vje-jθj
) / -jXse) (19)
Sseries = jbser2V
2i + jbserV
2ie
jˠ – jbseViVje
j(θi –θj + ˠ) (20)
Sseries = jbser2V
2i + jbserV
2i (Cos ˠ + jSin ˠ) – jbserViVjCos (θi – θj + ˠ) + jSin (θi – θj + ˠ)
(21)
Final form Eq. (21) takes the form of
Sseries = Pseries+ jQseries Where
Pseries = rbseViVjSin (θi – θj + ˠ) –rbseV2
iSin ˠ (22)
Qseries = rbseViVjCos(θi – θj + ˠ) + rbseV2
iCos ˠ + r2bseV
2i (23)
The reactive power delivered or absorbed by converter 1is not considered in this model,
but its effect can be modelled as a separate controllable shunt reactive source. In this case
main function of reactive power is to maintain the voltage level at bus i within acceptable
limits. In view of the above explanations, Qshunt can be assumed to be 0.
Consequently, UPFC mathematical model is constructed from the series-connected
voltage source model with the addition of a power injection equivalent to Pshunt + j0 to bus
i, as depicted in Fig 5. Finally, UPFC mathematical model can be constructed by
combining the series and shunt power injections at both bus i and bus j as shown in Fig.
13.
The elements of equivalent power injections in Fig. 13 are,
Pi,upfc = 0:02rbseV2iSinˠ - 1.02rbseViVjSin (θi – θj + ˠ) (24)
Pj,upfc = rbseViVj Sin(θi – θj + ˠ) (25)
Qi,upfc = rbseV2
iCos ˠ (26)
Qj,upfc = rbseViVjCos ˠ (θi – θj + ˠ) (27)
Fig 5 Equivalent power injection of shunt branch (Vural&Tümay 2007)
General nodal power flow equations and linearized power system model can be expressed
in rectangular form by the following equations:
P = f1 (V,θ,G,B) (28)
Q = f2 (V,θ,G,B) (29)

European Journal of Engineering and Technology Vol. 4 No. 3, 2016 ISSN 2056-5860
Progressive Academic Publishing, UK Page 23 www.idpublications.org
n
=
n
n (30) (Vural&Tümay 2007)
Fig 6: UPFC mathematical model (Vural&Tümay 2007).
Nigerian Grid System
Introduction
(PHCN, 2004) news bulletining shows that a greater proposition of power generated are
from thermal power station which accounts for about 67% of the total power output, out of
which Egbin thermal power station accounts for the highest power output. The other form
of power generating is the Hydro power station; these are Kainji, Jebba and Shiroro. These
power stations are located at different part of the country which has natural falls.
The increasing demand of electricity has led to the construction of various power stations
in different locations within the country. This power is hence transmitted to different load
centres in the country through the national grid. The bulk of electric energy transferred in
Nigeria is either 330kV or 132kV transmission line. (Nwohu, 2010).
The transmission grid system is predominantly characterised by radial, fragile and very
long transmission lines. It comprises of 11,000 km of 330 and 132kV, 24000 km of sub-
transmission line of 33kV and 19000km of distribution line of 11kV with 22500
substations (Sadoh, 2005). This project is limited to the 330kV. These transmission lines
were constructed to have double circuits though on separate towers for purpose of
reliability and power transmission capacity except the extension of the 330kV shiroro
substation to Abuja that has a single tower with double circuits (Nwosu, 2010). The
330kV employs 350mm2 Aluminium conductor steel re-enforced (ACSR) known as
BISON. The supporting structure are made of steel towers are spanned at an average
distance 500 metres apart., with a height of 75metres for the double circuits and 54 metres
for the single circuit (Sunday & Emmanuel, 2010).

European Journal of Engineering and Technology Vol. 4 No. 3, 2016 ISSN 2056-5860
Progressive Academic Publishing, UK Page 24 www.idpublications.org
Fig 7: Map of Nigeria showing the 330kV and 132kV Transmission line
(Hon. Minister of Power & Steel and Chairman of the NEPA Technical Committee, 2004).
Optimization of Power Flow
They are different modes of selecting the optimal location of siting FACTS device, but
this study will be limited to few of these methods such as the following:
Genetic Algorithm.
Newton-Raphson Algorithm.
Sensitivity Analysis.
Differential Evolution
Linear Programming Algorithm.
Linear Programming Algorithm
Linear programming (LP) is a technique that converts the objective function and
constraints of power system optimization have linear form, it is essentially used to
linearize the non-linear power system optimization process. In solving LP problem,
simplex method is known to be effective. Some advantages of linear programming are:
It is reliable, especially regarding convergence properties.
It identifies infeasibility quietly, so that appropriate strategies can be put into
effect.
LP accommodates a large variety of power system operating limit.
Convergence to engineering accuracy is rapid and also accepted when changes in
control are small.
But this technique provides inadequate evaluation of losses and insufficient ability to
locate an exact solution with an accurate non-linear power system model.
Large scale application of this technique has being limited to network constraint real and
reactive power dispatch calculations with the objective of comprising the sum of convex
curves which can lose the accuracy of calculation when the approximation is
oversimplified. A great deal of applications shows that the LP generally meets the
requirement for engineering precision as such used to solve power system problems such
as optimal power flow, steady state security regions, reactive power optimization and lots
more (Zhu, 2009)

European Journal of Engineering and Technology Vol. 4 No. 3, 2016 ISSN 2056-5860
Progressive Academic Publishing, UK Page 25 www.idpublications.org
DESIGN
Network Design
Fig 8: The Network of 330kV Nigerian Grid System (Nwosu, 2010).
EXPERIMENTAL METHODOLOGY
This research is based on quantitative approach of investigation. There are two main
classes of research methods: qualitative and quantitative. Quantitative research is a
systematic investigation of social phenomena via statistical, mathematical or
computational techniques, while qualitative research methods are used to study social and
cultural phenomenon (Hohmann, 2006). Several simulations were conducted with the
computer aided application ERACS and MATLAB/SIMULINK. These software were run
at a frequency of 50Hz
ERACS
Four simulations were run at this stage. At the initial stage of modelling, the network was
simulated with 31 buses and 33 branches which included seven (7) power stations
providing electric supply to different load centres. This configuration was used to simulate
the load flow analysis of the network before and after load shedding. This was done due to
greater load demand than the generating stations could handle.
With the installation of three (3) new power plants to the network, three (3) more buses
were added to the grid. The purpose of this was to investigate the significances of
installing new power plant on the network and how it affects the optimum location of
siting a unified power flow controller.
The whole simulations were run at a study base of 100MVA with all generators simulated
as slack except Egbin Power station which was assigned power. All the generators
produced power at 11kV before it was stepped up to 330kV for onward transmission. The
configuration of the some of the bus bars, load, lines, transformers and generators are
clearly illustrated in Appendix A.

European Journal of Engineering and Technology Vol. 4 No. 3, 2016 ISSN 2056-5860
Progressive Academic Publishing, UK Page 26 www.idpublications.org
MATLAB/SIMULINK
The simulation was carried out using the ode45 numerical integration routine. The UPFC
is used to control the power flow of the 330kV /132 kV transmission systems which is
connected in a loop configuration. This model consists of five bus bar (B1 – B5) which is
interconnected through transmission line (L1- L3), two 330/132kV transformer (tr1 & tr2),
and two power plants (PP1 & PP2). The two power plants supplies power to a 330kV,
15000MVA equivalent voltage source and also to a 700MW load connected close to bus 3.
The settings up of all this parameter are clearly illustrated at appendix B.
Before running the simulation the initial configuration was carried at the Phasors
powergui. The analysis tool is used to set the initial state of the model, this displays the
measurement, sources and nonlinear element result of the steady state voltage and current
of the various components as shown in Fig 9 below. In the UPFC dialog the series and
shunt converter were rated at 100MVA with the series converter having a maximum
voltage injection of 0.1 pu.
Fig 9: MATLAB/SIMULINK configuration tool bar
Fig 10: Block parameter of UPFC.
The use of Bypass breaker in the system is to connect or disconnect the UPFC block from
the power system in-order to show the effect of the controller.
European Journal of Engineering and Technology Vol. 4 No. 3, 2016 ISSN 2056-5860
Progressive Academic Publishing, UK Page 27 www.idpublications.org
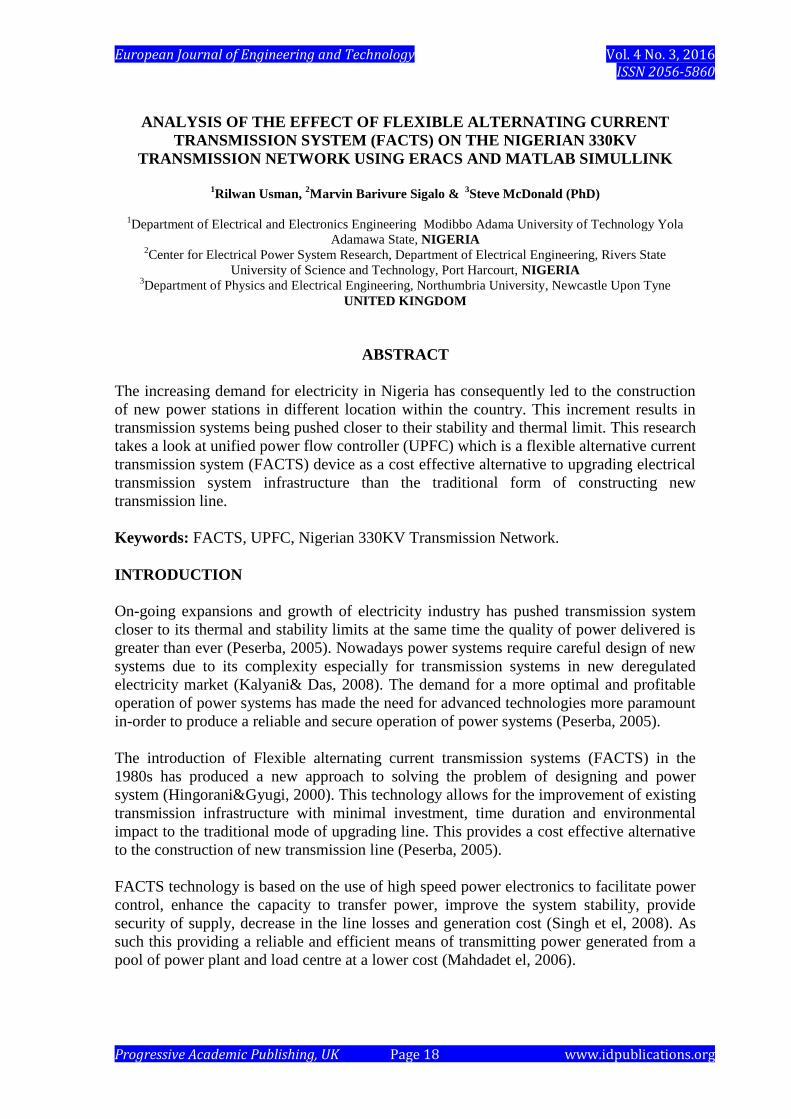
Fig 11: Reference Power flow control and Voltage Injection.
PQref and Vdqref are reference power flow control and voltage injection. Pref and Qrefare
used to set the UPFC reference of active and reactive powers respectively. The Pref block
was programmed with an initial active power of 5.87pu corresponding to natural power
flow while Qref was kept constant at -0.27pu.
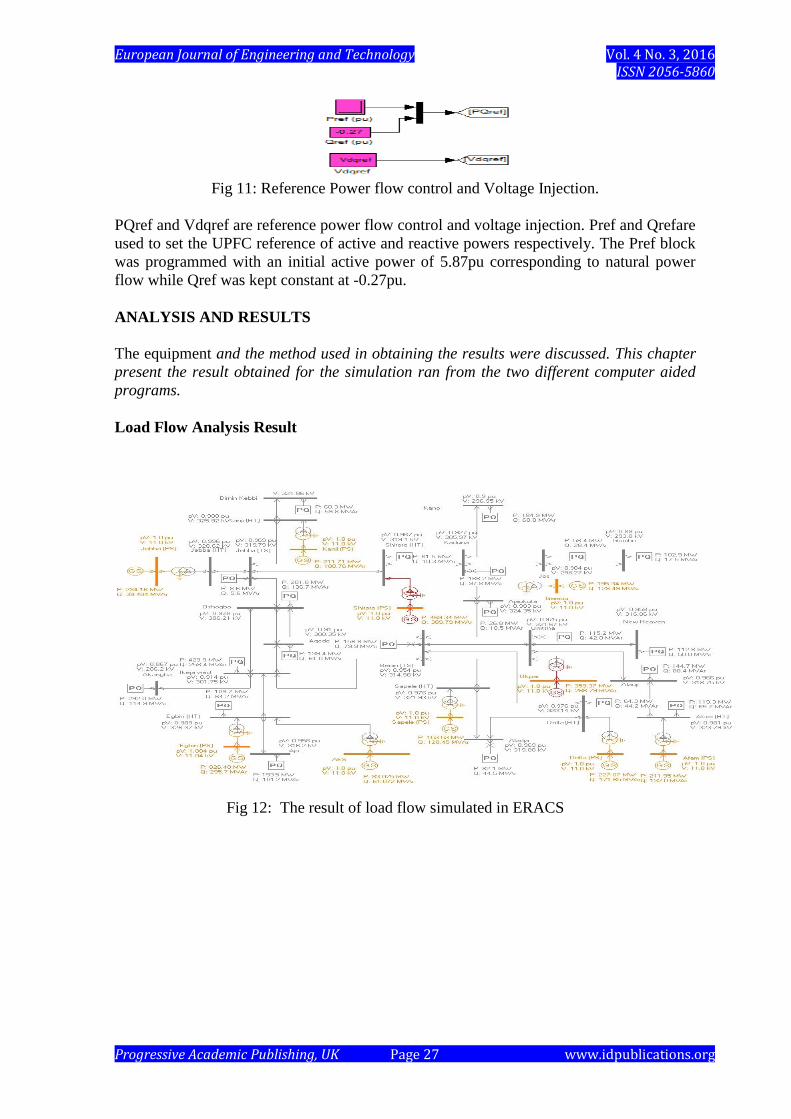
ANALYSIS AND RESULTS
The equipment and the method used in obtaining the results were discussed. This chapter
present the result obtained for the simulation ran from the two different computer aided
programs.
Load Flow Analysis Result
Fig 12: The result of load flow simulated in ERACS

European Journal of Engineering and Technology Vol. 4 No. 3, 2016 ISSN 2056-5860
Progressive Academic Publishing, UK Page 28 www.idpublications.org
Fig 13: Summary of result to the Load Flow study on the Nigerian Network.
From the above load flow results the following observation were made.
The load requirement has surpassed the power generation from the power station
at Shiroro and Okpai.
The voltage profile at the bus bar ranges from 0.876pu at Akanga to 1.004pu in
Egbin.
The current in the transformers has exceeded its rating.
As a result of the problems observed above, loading shedding was introduced at Onitsha
and Kaduna bus bar and the following result was obtained.
Fig 14: Load flow analysis after load shedding

European Journal of Engineering and Technology Vol. 4 No. 3, 2016 ISSN 2056-5860
Progressive Academic Publishing, UK Page 29 www.idpublications.org
Fig 15: Summary of Result to load flow study after shedding
The above result shows a slight increment on the overall voltage profile at the various bus
bars as a result of the introduction of loading shedding at the Onitsha and Kaduna bus
bars. It can also be observed that the power stations can now adequately handle the load
requirement.
Selection of the Optimum Location
In the selection of the optimum location of siting the unified power flow controller on the
330kV Nigerian grid system, two different simulations were carried out. This is done in
order to compare this study and a similar study carried out by Nwosu (2010) with both
studies undertaking different approaches in achieving the goal. The technique abducted in
this paper is the newton-raphson algorithm which is one of the different techniques
discussed in earlier under the optimization of power flow controller.
1) In the initial stage the load flow analysis was carried out on the 330kV before the
construction of the AES, Geregu and Okpai power station.
2) The other stage is the simulation of network with installation of AES, Geregu and
Okpai Power stations
First Simulation
Nwosu (2010) carried out a study of locating the optimum location of UPFC in Nigerian
grid system. The study was based on the sensitivity analysis technique in selecting the
optimum location of siting a UPFC. This technique which is another mode of selecting the
optimal location shows the critical point of power system during time domain voltage
collapse scenario (Wang, 1999). The result of the study shows the optimum location of
siting the controller is on the transmission line located between Jos and Gombe which has
the highest index with 2.4712. While this study uses newton raphson approach, an
optimization technique incorporated on a computer aided program. The result of
simulation in fig 16 below shows Egbin power plant will the maximum voltage of 1 pu
while Gombe having the minimum voltage at the bus bar with 0.844 pu. This clearly
shows the optimum location of siting a UPFC in between Jos and Gombe. Thus, this
illustrates at total agreement to the result of Nwosu (2010).
European Journal of Engineering and Technology Vol. 4 No. 3, 2016 ISSN 2056-5860
Progressive Academic Publishing, UK Page 30 www.idpublications.org
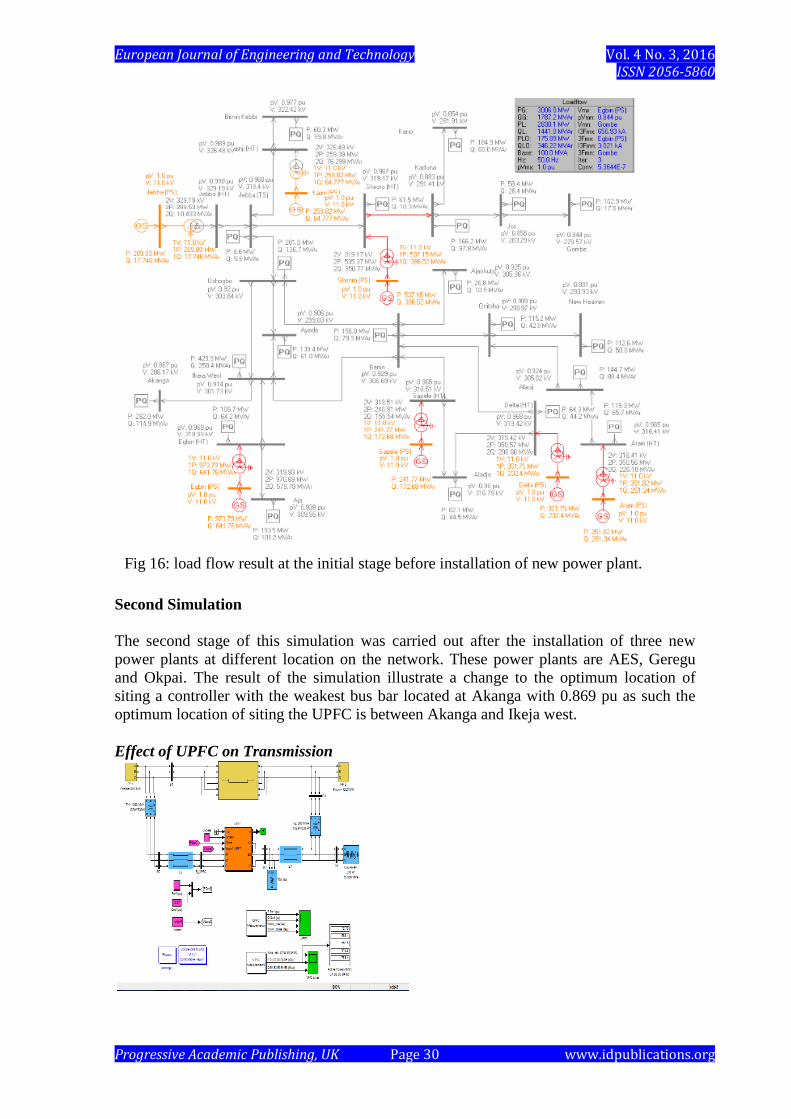
Fig 16: load flow result at the initial stage before installation of new power plant.
Second Simulation
The second stage of this simulation was carried out after the installation of three new
power plants at different location on the network. These power plants are AES, Geregu
and Okpai. The result of the simulation illustrate a change to the optimum location of
siting a controller with the weakest bus bar located at Akanga with 0.869 pu as such the
optimum location of siting the UPFC is between Akanga and Ikeja west.
Effect of UPFC on Transmission
European Journal of Engineering and Technology Vol. 4 No. 3, 2016 ISSN 2056-5860
Progressive Academic Publishing, UK Page 31 www.idpublications.org
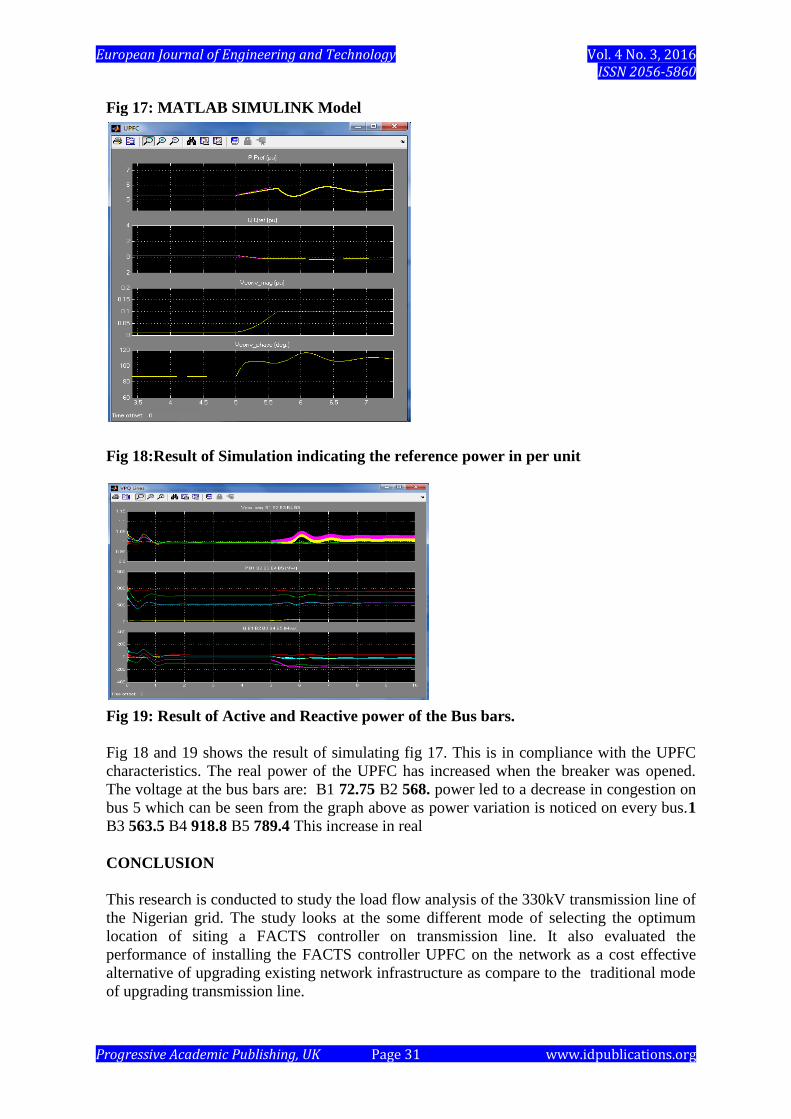
Fig 17: MATLAB SIMULINK Model
Fig 18:Result of Simulation indicating the reference power in per unit
Fig 19: Result of Active and Reactive power of the Bus bars.
Fig 18 and 19 shows the result of simulating fig 17. This is in compliance with the UPFC
characteristics. The real power of the UPFC has increased when the breaker was opened.
The voltage at the bus bars are: B1 72.75 B2 568. power led to a decrease in congestion on
bus 5 which can be seen from the graph above as power variation is noticed on every bus.1
B3 563.5 B4 918.8 B5 789.4 This increase in real
CONCLUSION
This research is conducted to study the load flow analysis of the 330kV transmission line of
the Nigerian grid. The study looks at the some different mode of selecting the optimum
location of siting a FACTS controller on transmission line. It also evaluated the
performance of installing the FACTS controller UPFC on the network as a cost effective
alternative of upgrading existing network infrastructure as compare to the traditional mode
of upgrading transmission line.

European Journal of Engineering and Technology Vol. 4 No. 3, 2016 ISSN 2056-5860
Progressive Academic Publishing, UK Page 32 www.idpublications.org
The technique used in the selection of the optimum location is based on the Newton
Raphson algorithm, which is a widely used method for solving non-linear equation (El-
Hawary, 2008) incorporated on work stations or personal computers (Pritchard &Pottle,
1982). The simulation of the load flow analysis was in two stages:
The simulation was run before the Installation of three powers: AES,
Geregu&Okpai power station.
The Second simulation was after the installation of the new power plants.
The first simulation was run in-order to compare the work ran by Nwosu (2010) which used
sensitivity analysis as a way of selecting the optimum location of siting a UPFC and also how
the of installation of new power station at different location s affect the optimum position of
installing a FACTS controller.
The result of the first simulation as shown in fig 16 indicates the transmission line in between
Jos and Gombe as the optimum location of siting the FACTS controller. The second
simulation indicate a shift in the optimum location after the installation of new powerplants
as illustrated in fig 4-3 above to new located on the transmission line in between Akanga and
Ikeja West.
In Power system transmission, it is always desirable to maintain the voltage magnitude, phase
angle and line impedance therefore power flow control is paramount. The result of simulation
from the model in fig 17 illustrates that power flow control is achieved with less congestion,
there is an improvement of transient stability, faster steady state achievement and an overall
improvement of the voltage profile.
REFERENCES
Acha, E., Fuerte-Esquivel, C. R., Ambriz-Pérez, H. and Angeles-Camacho, C. (2005)
Optimal Power Flow, in FACTS: Modelling and Simulation in Power Networks, John
Wiley & Sons, Ltd, Chichester, UK.
Basu, M. (2008). Optimal Power Flow With FACTS Devices Using Differential
Evolution. Electrical Power and Energy Systems.vol 30, p150-156.
Controlle. Proceedings of 2nd National Conference on Challenges & Opportunities in
Information Technology.P295-298.
Donsion (2007). UPFC (Unified Power Flow Controller). Available:
http://www.donsion.org/calidad/cc8/c8-13.pdf. Last accessed 08/08/2011.
El-Hawary, M.E (2008). Introduction to Electrical Power Systems. New jersey: John
Wiley & Son Ltd. p305-361.
Gupta, V. (2010).Study and Effect of UPFC and its Control System for Power Flow
Control and Voltage Injection in a Power System.International Journal of
Engineering Science and Technology.Vol. 2 (7), p2558-2566.
Gyugyi, L. (1994). Dynamic Compensation of AC Transmission lines by Solid State
Synchronous voltage Sources. IEEE Trans. Power Delivery.Vol 9, p904-991.
Gyugyi, L. (1999). Power transmission control. In: Song, H. Y. & Johns, A. T. Flexible
AC Transmission Systems. Series 30, London: The Institution of Electrical Engineers.
p1-71.
Haque, M. H. (2005). Damping improvement by FACTS devices: A comparison between
STATCOM and SSSC . Electric Power Systems Research.76 (2006), p865-872.
Hingorani, N. G &Gyugyi, L (2000) Understanding FACTS: Concepts and Technology of
Flexible AC Transmission Systems New York: IEEE Press
Hohmann, U. (2006). Quantitative Methods in Education Research.Available:

European Journal of Engineering and Technology Vol. 4 No. 3, 2016 ISSN 2056-5860
Progressive Academic Publishing, UK Page 33 www.idpublications.org
http://www.edu.plymouth.ac.uk/resined/Quantitative/quanthme.htm. Last accessed
11/9/2011.
Hon. Minister of Power & Steel and Chairman of the NEPA Technical Committee (2004).
The Power Sector “The Catalyst for Economic Growth and Development” At an
Interactive Forum with Mr. President
Kalyani, S.T. and Das, G.T. (2008).Simulation of real and reactive power flow control
with UPFC connected to a transmission line. Journal of theoretical and applied
information technology.1 (1), p16-22.
Mahdad, B., Bouktir, T., and Srairi, K..(2006). Strategy of Location and Control of
FACTS Devices for Enhancing Power Quality. IEEE MELECON. p1068-1072.
Maturu, S. and Shenoy, U.J. (2010). Performance Issues of Distance Relays for Shunt
FACTS Compensated Transmission lines. Power System Technology (POWERCON),
2010 International Conference, p1 - 6
Mohan N. (1992) Power electronics: converters, applications and design. John & Sons;
Momoh, J.A. (2009). Electric Power System Applications of Optimization. 2nd ed. london:
Taylor & Francis Group. p509-537.
Nwohu, M. N. (2010). Optimal Location of Unified Power Flow Controller (UPFC) in
Nigerian Grid System). International Journal of Electrical and Power Engineering.4
(2), p147-153.
Padiyar., K.R (2007). FACTS Controller in Power Transmission and Distribution. New
Delhi: New Age International Ltd. p105 - 150.
Paserba, J. J. (2005) How FACTS Controller Benefit AC Transmission Systems. Power
Engineering Society General Meeting, 2004. IEEEvol2 p1257 - 1262.
Pritchard, R., Pottle, C. (1982) "High-speed power flows using attched scientific
("array") processor", IEEE Trans. on Power Apparatus and Systems, Vol PAS-101,
No. 1, p254-261,
Putrus, G.A. (2010) “Power Electronics Application in Power Systems,” Modern Power
Engineering lectures series, Northumbria University Newcastle, United kingdom.
Sadoh, J. (2005). Ph.D Thesis on Power System Protection: Investigation of System
Protection Schemes on the 330kV of Nigeria Transmission Network. Unpublished
University of Benin, p27
Singh, P., Mathew, L., Chatterji, S.. (2008). MATLAB Based Simulation of TCSC
FACTS Controller. Proceedings of 2nd National Conference on Challenges &
Opportunities in Information Technology., P295-298
Sood, V. K. (2001). Flexible AC Transmission Systems (FACTS). In: Lai, L.L Power
System Restructuring and Deregulation. London: John Wiley & Son Ltd. 258 - 284.
Storn, R., Price, K.V. (1997) Differential evolution- a simple and efficient heuristic for
global optimization over continuous spaces. J Global optim.vol 11(4), p341-359.
Sunday, O.O. (2009).Power Outages in the Nigeria Transmission Grid.Research Journal
of Applied Science.4 (1), p1-9.
Sunday, O.O., Emmanuel, O. A. (2010). Empirical Modelling of Voltage Drops
Associated with Transmission Lines in the Nigerian Network as a Function of Line
Loadings and Lengths. Journal of mathematics and Technology , p30-36.
Sunday,O.O., Kingsley, O.O. (2010). Determination OF Power Stations For Upgrading In
The NIgeria Power System Using Minimum Loss Criteria.International Journal of
Academic Research. vol 2 (4), p57-65.
Vijayakumar, K., Kumudinidevi, R.P. (2005). A new method for optimal location of facts
controllersujsing genetic algorithm. Journal of theoretical and applied information
technology.p1-6.
Vural, A. M. and Tümay, M . (2007). Mathematical modeling and analysis of a unified

European Journal of Engineering and Technology Vol. 4 No. 3, 2016 ISSN 2056-5860
Progressive Academic Publishing, UK Page 34 www.idpublications.org
power flow controller: A comparison of two approaches in power flow studies and
effects of UPFC location. International Journal of Electrical Power & Energy
Systems.vol. 29 (8), p617-629.
Wang, H.F. (1999). Selection of robust installing locations and feedback signals of
FACTS-based stabilizers in multi-machine power systems.IEEE Trans, Power
systemvol 14 p569-574
Xu, L. and Agelidis, V. G. (2003). Flying Capacitor Multilevel PWM Converter Based
UPFC. IEE Proc. of Electronic Power Application. Vol. 149 (4), p304-310.
Zhu, J. (2009). Optimization of power system operation. New jersey: John Wiley & Son
Ltd.