Embed Size (px)
Citation preview

Claremont CollegesScholarship @ Claremont
CMC Senior Theses CMC Student Scholarship
2018
Analysis of the Economic Impact of Constructing aNBA Arena on the Host CityGrant Gilchrist
This Open Access Senior Thesis is brought to you by Scholarship@Claremont. It has been accepted for inclusion in this collection by an authorizedadministrator. For more information, please contact [email protected].
Recommended CitationGilchrist, Grant, "Analysis of the Economic Impact of Constructing a NBA Arena on the Host City" (2018). CMC Senior Theses. 1949.http://scholarship.claremont.edu/cmc_theses/1949

Claremont McKenna College
Analysis of the Economic Impact of Constructing a NBA Arena on the Host City
Submitted to
Professor Angela Vossmeyer
By
Grant Thomson Gilchrist
For
Senior Thesis Spring 2018
April 23, 2018


Table of Contents
Abstract ……...……………………………………………………………………………2 Acknowledgements ……………………………………………………………………….3 I. Introduction ….…………………………………………………………………..4 II. Literature Review ………...……………….…………………………………......8 III. Data ……………………………………………....………………...……………17 IV. Empirical Strategy and Results ……...………………………………………...22 V. Conclusion ……...……………………………………………………………….30 Bibliography ……………………………………………………………………………..34 Appendix ……...……………………………………………………………………........35
- 2 -
Abstract Using economic data collected from 24 different Metropolitan Statistical Areas in the US,
this thesis investigates the impact of constructing a new National Basketball Association
(NBA) arena on the host city’s economy. When a simplistic model is implemented, which
does not control for other economic factors or individual subject heterogeneity,
significantly positive economic impacts of arena construction are observed. However,
when a more appropriate model specification is implemented that controls for economic
activity and individual heterogeneity, these effects are no longer statistically significant.
This comparative analysis ultimately highlights the importance of appropriate model
specification and supports the conclusion that new NBA arenas, by themselves, are not
significant catalysts of urban economic development.

- 3 -
Acknowledgements
I would like to thank everyone who has helped me throughout the process of writing my thesis. My reader, Professor Vossmeyer, has been there for me every step of the way offering guidance and support. I could not have done this without her. I want to thank my family, particularly my parents and my sister, for their unconditional love and constant support of my academic career. Their encouragement inspires me to work harder every day. I also want to thank my dog, Maggie, whose playful face always brings a smile to my face. Finally, I would like to thank each of my professors at Claremont McKenna College for providing me with the knowledge to write a successful thesis.

- 4 -
I. Introduction
Over the course of the past century professional sports have become an increasingly
popular and appreciated component of American society. As America’s major urban
centers have grown and developed, and as the number of franchises in professional sports
leagues has increased, more and more cities have been successful in becoming a host for a
professional team. Hosting a professional franchise offers many potential benefits to a city
– national recognition as a “premiere city”, increased tourism from fans traveling to attend
games, and most importantly, increased economic activity in the metropolitan area. Less
often considered though is the enormous cost required to recruit a major sports teams to a
city. This cost arises most notably from the need to construct a major-league caliber
stadium, which is a massive project that requires years of labor and hundreds of millions
of dollars. The issue of concern is that, in recent years, more and more of these new
stadiums have been fully or at least partially funded by local municipal governments using
taxpayer money. The fact that public funds are being used to finance this construction begs
the question – is building a professional sports stadium really worth it for the surrounding
community? Do the projected economic benefits for a city generated from constructing a
new professional stadium justify the project’s enormous cost? In the hopes of answering
this essential question, this thesis undertakes an empirical analysis of the economic
conditions in twenty-four American cities which presently host an NBA franchise and have
constructed a new arena since 1990, in order to investigate the economic impact of the new
arena on the surrounding metropolitan area.
In the United States, there are four leagues which dominate the professional sports
market: Major League Baseball (MLB), the National Football League (NFL), the National

- 5 -
Hockey League (NHL), and the National Basketball Association (NBA). Economic
research focused on these “Big Four” professional sports leagues is justified by the fact
that these franchises have developed into large-scale, revenue generating, American
businesses. In 2016 the North American sports market size; comprised of ticket revenues,
media rights contracts, sponsorships and merchandising; totaled to $67.3 billion, and is
projected to increase to $78.5 billion by 2021 (PwC. (n.d.)). Currently these four major
leagues are made up of 123 teams which inhabit 42 cities across United States. This high
concentration of teams in a relatively small number of locations leaves many cities across
the US without a professional sports franchise, even though they may have suitable
economic conditions and the existing sports infrastructure to support one.
This low supply of professional franchises is, however, an intentional decision
made by the owners of the professional sports leagues. The leagues strive to have fewer
teams than the number of suitable cities, keeping the supply of professional franchises well
below the demand, in order to create competition amongst cities (Siegfried & Zimbalist,
2000). This competition sets off a bidding war between cities as to which one is willing to
provide the most financial support so as to attract a professional franchise, most commonly
in the form of subsidies to support the construction of a new stadium. In many ways, the
leagues’ control over the location of professional teams is a form of monopoly power. The
team owners hold the majority of the bargaining power during negotiations, which in turn
enables these franchises to extract a larger financial subsidy from a community than they
would have if the market was perfectly competitive (Siegfried & Zimbalist, 2000).
The practice of funding professional sports stadium constructions with public
money is relatively new. In fact, before 1953, most every professional sports stadium that

- 6 -
was constructed was paid for exclusively by private spending (Siegfried & Zimbalist,
2000). This was due in large part to the fact that stadiums back then were more modest,
and simply did not cost as much to construct. However, as the professional sports leagues
expanded in the second half of the twentieth century, spending on new stadiums
skyrocketed and so too did the proportion of public money used to fund the construction.
The most common argument made by team owners when advocating for the
construction of a new stadium for their team is that the current stadium is “inadequate”.
This inadequacy commonly does not pertain to the stadium’s seating capacity, structural
integrity, or sightlines to the action, but rather to the fact that the stadium’s luxury amenities
are outdated. These amenities include luxury boxes, club seats, and other opportunities to
generate substantial cash flow from the high-income fans. In other words, “although the
existing facilities are not physically obsolete, they are economically obsolete” (Siegfried
& Zimbalist, 2000). These same concerns were voiced by the (formerly) San Diego
Chargers owner, Dean Spanos, who had been seeking a deal with the city of San Diego to
build a new stadium for the past fifteen years. San Diego, however, was not willing to offer
public funds to aide in the construction effort. In a November 2016 referendum, 56% of
voters rejected a proposal to fund the $1.8 billion stadium by raising taxes on local hotels
(Schrotenboer, 2017). Without the financial support of the city, Spanos exercised the
NFL’s monopoly power and announced that he was moving the Chargers to play in Los
Angeles. This example illustrates how much bargaining power the owners of professional
sports franchises have in negotiations with municipalities, and the result is that franchises
are able to select their host city based on wherever they receive the most financial support.

- 7 -
For much of the twentieth century, the professional sports landscape was
dominated by two of the major leagues: the NFL and the MLB. These two leagues have
been the most popular amongst fans for many years, and for a long time the conversation
about the costs and benefits of stadium construction was centered around building baseball
and football stadiums. The issue with applying academic research on the economic impact
of baseball and football stadium constructions to the rest of the pro leagues is that the types
of venues used for the NBA and NHL are inherently different, and these arenas could
potentially have a drastically different economic impact. For one, it costs a lot more to
build an NFL or MLB stadium than it does to build an NBA or NHL arena. Since the year
2000, the average stadium construction cost in the NFL was $777.5 million, and in the
MLB the average cost was $683.6 million. Conversely, NBA arena construction costs since
2000 have been, on average, $426.6 million (Brookings Institution, (n.d.)). The design of
these arenas is flexible enough so that in many cases, NBA and NHL franchises hosted in
the same city will often share tenancy of the same arena. Additionally, due to the fact that
for the most part NFL and MLB stadiums are outdoors, these stadiums cannot be used year-
round to generate economic benefits for the city. NBA arenas are indoors, they are cheaper
to build, and can be utilized year-round by non-professional sports events such as concerts,
tradeshows, and conventions. Thus, an investigation into the economic impact of
constructing an NBA arena offers the best opportunity for observing positive economic
development in a host city.
In my analysis, I employ a fixed effects regression model in order to investigate the
impact of constructing a new NBA arena on the surrounding economy, specifically the
effect on per capita personal income. The model I employ controls for other outstanding

- 8 -
economic factors, including unemployment, new private housing units built, and the
number of construction employees. I will contrast the results of this fixed effects model
with a more naive pooled regression, which does not control for other economic variables
or individual heterogeneity.
The motivation for undertaking such a comparative analysis is that the less
sophisticated econometric model, even though it is not appropriate given the structure of
the balanced panel data set, produces statistically significant positive results – suggesting
that constructing a new stadium is significantly beneficial to the surrounding economy.
These kinds of analyses may be cherry-picked by biased researchers attempting to justify
a new stadium construction. However, my analysis demonstrates that when a more
appropriate model is employed which controls for relevant economic factors, the economic
impact of arena constructions is no longer statistically significant, and the impact trend on
personal income is in fact negative. This analysis ultimately emphasizes the importance of
utilizing the appropriate econometric specification, controlling for outstanding economic
factors and individual observation heterogeneity, so as not to arrive at misleading
conclusions about the impact of a newly constructed professional sports arena.
II. Literature Review
The 1980s and early 1990s in the United States ushered in an unprecedented boom
in professional sports stadium construction, and the ripple effect in academia was a wave
of economic research in the late 1990s that was focused exclusively on the urban economic
impact of this construction. One of the first of such studies was carried out by Robert
Baade, who compared the local economic performance of cities with and without stadiums.
Baade’s model controlled for other variables that affect local economic conditions, and his

- 9 -
results found no significant difference in personal income growth from 1958 to 1987
(Baade, 1994). In his research, Baade ultimately came to the conclusion that “The idea that
sports are a catalyst for economic development just doesn’t hold water.” (Wolla, 2017).
Other studies undertaken during this period also found that higher high school graduation
rates and more spending on police are what encouraged economic growth, while the
presence of a major league sports team actually put a drag on the local economy (Walden,
1997). Further research conducted in this area found mixed results between individual
cities, some positive while others negative, but found the net effect of new sports stadiums
to be near zero (Santo, 2005). By the early 2000s, the majority of these studies came to the
conclusion that there was no statistically significant positive correlation between sports
facility construction and economic development (Siegfried & Zimbalist, 2000).
These academic studies, however, stand in direct contrast to many of the
promotional studies carried out by consulting firms under the hire of sports leagues which
supported facility development based on the projected economic benefits. The proponents
often claim that subsidizing sports stadiums is justified because of the economic impact it
will have on the community. Firstly, the construction of a stadium is a massive project
which requires years of intensive labor. Some analysts have compared the modern sports
stadium construction to the construction of cathedrals in the Middle Ages in their attempt
to dominate the skyline and inspire civic pride. This surge of construction generates jobs
in the surrounding community, which lowers unemployment and increases personal
income. For example, the proposed stadium for the Los Angeles Rams and the Chargers in
Inglewood, California, was predicted to cost $3 billion and add 22,000 construction jobs
to the economy of Los Angeles (Wolla, 2017).

- 10 -
Even though the jobs created during a stadium’s construction are only short-term,
once the games begin, so too does the consumer spending. For example, over the course of
the 2015 baseball season, the St. Louis Cardinals attracted more than 3.5 million fans to
their games at Busch Stadium (the second-highest home game attendance in Major League
Baseball that year) (Wolla, 2017). In addition to the revenue generated from ticket sales,
fans who attended these games also paid for parking, ate in restaurants, and purchased food
and drink at the ballpark. The combination of all of that economic activity generated
increased revenue and created more jobs in the surrounding community. As each of those
restaurant and stadium workers benefited from increased income, they too spent more of
their wealth in the city as the money circulated again through the economy. Economists
refer to this concept as the multiplier effect, whereby one dollar of spending creates more
than one dollar in economic activity. Analysts have estimated the multiplied economic
impact of those millions of people who attended St. Louis Cardinals home games in 2015
was $343.9 million (Wolla, 2017).
Furthermore, a potential new stadium also comes with the promise of new
development taking root nearby, in the form of new restaurants and bars as well as
condominiums and office space. As interest in the area grows, the value of existing
commercial and residential property is likely to improve. Similarly, a new stadium can
serve as one aspect of a larger economic-development initiative by choosing to build in a
blighted or underdeveloped area in the hopes that the new economic activity and increased
foot traffic will lead to a revitalization of that area (Wolla, 2017).
Finally, the most common argument made by proponents of new stadium
construction is that professional sports and new stadiums help to inspire civic pride. A

- 11 -
flashy new stadium can serve as a beneficial marketing tool for the city’s image, as people
around the country watch games televised from the new stadium. As professional sports
continue to rise in popularity, many believe that the presence of a professional team is a
sort of status symbol that is essential in order to be considered a first-tier city.
In spite of all of these theoretical economic arguments, economists in general are
opposed to the idea of using public money to subsidize professional sports stadiums. In a
2017 poll, 83 percent of the economists surveyed agreed that “Providing state and local
subsidies to build stadiums for professional sports teams is likely to cost the relevant
taxpayers more than any local economic benefits that are generated.” (Wolla, 2017). The
consensus in academia is that the promotional studies, being prospective rather than
retrospective, have adopted a number of unrealistic assumptions which have led them to
fail to consider important components of urban economic analysis.
The first economic principle that these promotional studies fail to incorporate is
most commonly referred to as the substitution effect. Based on the assumption that the vast
majority of consumers have a relatively inflexible leisure consumption budget, in the
presence of a sports team or a team with a new stadium, the money one spends taking the
family to a game is typically money that is not spent at other local entertainment attractions
(Siegfried & Zimbalist, 2000). This substitution of consumption renders the net effect on
spending in the metropolitan area to near zero. Therefore, a new stadium may rearrange
economic activity in an urban area, but it is not likely to add much to it.
The promotional studies also are problematic in that ignore the fact that if a local
government were to provide a large-scale subsidy to a sports team, that government would
be less effective in continuing urban development as a result of its budgetary constraints

- 12 -
(Siegfried & Zimbalist, 2000). Thus, the second economic principle that the promoters of
new stadiums ultimately fail to accurately incorporate into their analyses are the
opportunity costs: the opportunities for economic development that are given up by
deciding to construct a new stadium. For example, taxpayer money that is used to fund a
new stadium could instead be spent on essential infrastructure such as roads, airports or
schools, which may in fact produce greater economic development in a city than a stadium.
When the substitution effect and opportunity costs are taken into account, as they have
been in the retrospective academic research studies, the net economic impact of a new
sports stadium has generally been found to be not significantly positive (Santo, 2005), and
in some cases even negative (Baade, 1994).
As academic research in this field progressed through the first decade of the twenty-
first century, more nuanced approaches emerged, and the results of these studies were less
consistently opposed to the prospect of constructing new sports stadiums. One such study,
undertaken by Geoffrey Propheter in 2012, extended the traditional model used by past
researchers (Baade, 1994 & Santo, 2005) to data ranging through the year 2009. The results
of Propheter’s study for the most part aligned with past research in that the broad level
effects of arena construction were found to be negative. However, Propheter’s analysis
offered a new line of insight into this discussion. His results showed that in the cities where
basketball is the only major league sports team, more of a positive economic impact was
experienced. In multi-sport cities, however, the trend was more negative (Propheter, 2012).
The implication of these findings is that the citizens living in a single-sport city derive a
greater benefit from new arena construction, and thus may attend more events at the arena
and generate more revenue for the city than would citizens living in multi-sport cities.
- 13 -
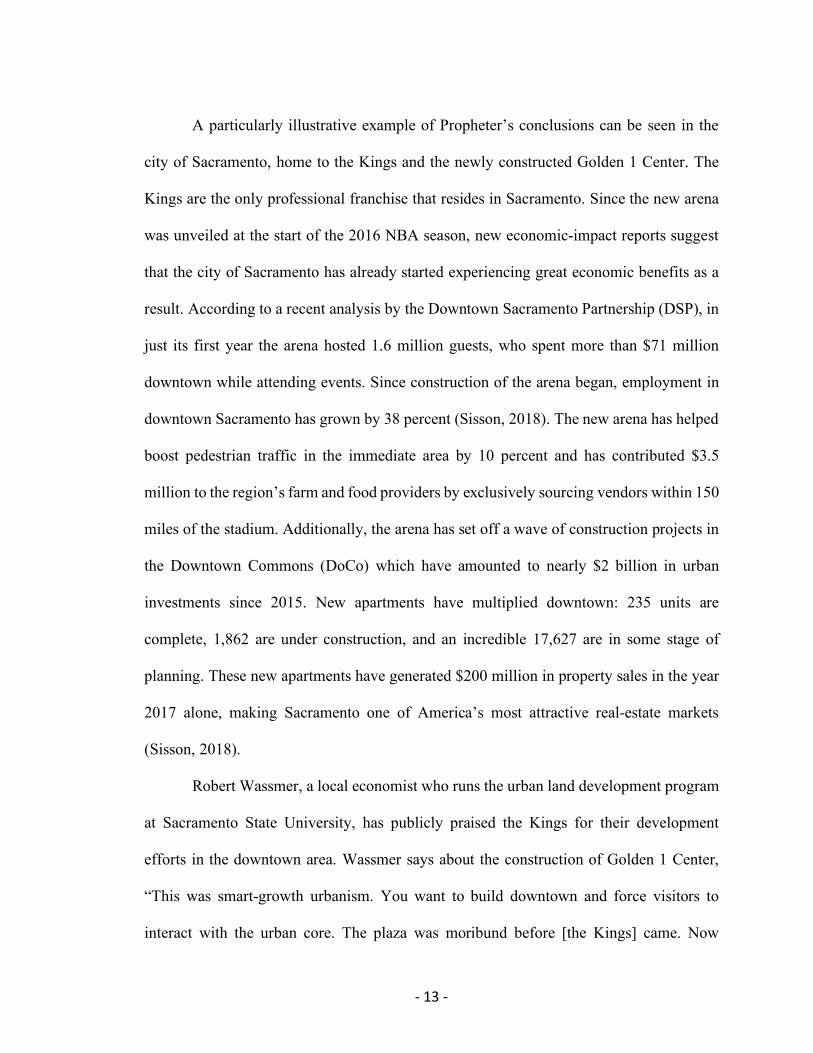
A particularly illustrative example of Propheter’s conclusions can be seen in the
city of Sacramento, home to the Kings and the newly constructed Golden 1 Center. The
Kings are the only professional franchise that resides in Sacramento. Since the new arena
was unveiled at the start of the 2016 NBA season, new economic-impact reports suggest
that the city of Sacramento has already started experiencing great economic benefits as a
result. According to a recent analysis by the Downtown Sacramento Partnership (DSP), in
just its first year the arena hosted 1.6 million guests, who spent more than $71 million
downtown while attending events. Since construction of the arena began, employment in
downtown Sacramento has grown by 38 percent (Sisson, 2018). The new arena has helped
boost pedestrian traffic in the immediate area by 10 percent and has contributed $3.5
million to the region’s farm and food providers by exclusively sourcing vendors within 150
miles of the stadium. Additionally, the arena has set off a wave of construction projects in
the Downtown Commons (DoCo) which have amounted to nearly $2 billion in urban
investments since 2015. New apartments have multiplied downtown: 235 units are
complete, 1,862 are under construction, and an incredible 17,627 are in some stage of
planning. These new apartments have generated $200 million in property sales in the year
2017 alone, making Sacramento one of America’s most attractive real-estate markets
(Sisson, 2018).
Robert Wassmer, a local economist who runs the urban land development program
at Sacramento State University, has publicly praised the Kings for their development
efforts in the downtown area. Wassmer says about the construction of Golden 1 Center,
“This was smart-growth urbanism. You want to build downtown and force visitors to
interact with the urban core. The plaza was moribund before [the Kings] came. Now

- 14 -
visitors are stopping at restaurants and bringing their dollars into the community.” (Sisson,
2018). However, it is important to realize that Sacramento’s economic success in recent
years was not solely the result of building a new basketball arena. Golden 1 Center was
just one part of a broader plan for Sacramento’s urban redevelopment. Investment in the
city’s medical industry, from key players such as Kaiser Permanente, brought in the jobs
that became early catalysts in driving more interest downtown (Sisson, 2018).
Additionally, more and more residents are flocking to the Sacramento area in search of
lower costs of living, relative to other California cities like San Francisco. So even though
the Golden 1 Center may have acted as a catalyst for city growth, it was far from the only
catalyst.
A particularly influential academic study undertaken by Arthur Nelson supports
this notion that overall downtown redevelopment in combination with a new professional
sports stadium plays an important role in realizing positive economic returns. Nelson
hypothesized that new stadiums constructed as a part of the city’s central business district
(CBD) would have a more positive economic impact because fans attending the game
would have greater access to patronize other businesses also located in the CBD.
Conversely, stadiums located farther away from the CBD are less accessible to pedestrians,
and have less accessible shopping and restaurant opportunities, and therefore are less
integrated with their surrounding area, theoretically leading to lower levels of economic
impact. The results of this study revealed that the stadiums located within a city’s CBD
demonstrated a positive (though insignificant) correlation with the city’s share of regional
income, whereas stadiums located farther away from the CBD were significantly
negatively correlated (Nelson, 2001). The ultimate takeaway from Nelson’s research is that

- 15 -
the location of a newly constructed sports stadium is essential in determining its economic
impact, and that stadiums that are well integrated within a city’s central district are more
likely to generate positive returns. In the case of Sacramento, the Golden 1 Center was
constructed directly in the city center and is just one aspect of the city’s broad
redevelopment effort, which may be one of the reasons why its positive impact is already
so apparent.
While much of the academic research conducted around the topic of the economic
impact of professional sports stadiums has focused on the arrival of franchises and new
stadium construction, important lessons can also be learned when a franchise departs their
host city. In 2017, economists Humphreys and Nowak undertook an analysis of the trends
in nearby residential property values in two cities, Seattle and Charlotte, in the years
directly following the departure of their respective NBA franchises. Both arenas continued
to operate after the teams left, so these departures represented a natural experiment to
identify the net effects of a sports team separately from the effect of a facility and other
events that take place in the facility. Results from the researchers’ repeat sales regression
model and hedonic price model indicated that the departure of the teams was associated
with excess appreciation of condo prices near Key Arena (Seattle) and single-family home
prices near Charlotte Arena (Humphreys & Nowak, 2017). These results show that the
presence of a professional team actually generated disamenity effects in these local
economies, perhaps reflecting the negative impact of traffic, trash, crime, crowds, or other
negative aspects associated with professional sports events (Humphreys & Nowak, 2017).
The conclusions put forth in Humphreys and Nowak’s analysis suggest that much
can be learned about a metropolitan area’s economic development by attending to changes

- 16 -
in the private housing market. While Humphreys and Nowak specifically focused on
changes in the price of existing housing units, I also think it is imperative to pay attention
to changes in the supply of housing – or the number of new private housing units being
constructed. Economists typically quantify the impact of new housing in terms of jobs,
spending, and tax revenue created. For new houses, these effects are typically experienced
in two phases: when the housing is constructed, and during occupancy (Adams & Barber,
2011). During construction, new housing units produce increased employment among the
local construction companies and firms affiliated with the project. Similar to the multiplier
effect discussed earlier, as more construction workers earn wages and raise their level of
personal income, they are able to spend more money buying groceries and other consumer
goods in the surrounding community. Once the housing unit is constructed, families are
able to move in and bring their additional consumption spending to the metropolitan area
(Adams & Barber, 2011). Therefore, new house construction in a city has the potential to
be a significant driver of economic growth.
In reviewing the existing relevant literature, it is clear that the general consensus in
academia is that the economic impact on a city of a major league sports stadium
construction is generally negative, or at least not significantly positive. Even if a new
stadium does generate a positive impact in the surrounding area, when the opportunity costs
and substitution effects are taken into account, the net economic impact is near zero.
However, much of the analysis centered around this question is outdated, as it has mostly
been focused on construction projects that occurred during the 20th century (Baade, 1994).
The analyses that have been conducted in the last fifteen years have produced much less
conclusively negative results (Propheter, 2012; Nelson, 2001) For stadiums located within
- 17 -
a city’s central business district, or in cities that only have one professional sports team,
the impact of constructing a new arena has been shown to be more positive. Additionally,
not enough attention has been paid to specifically NBA arenas, which are less expensive
to build and can be utilized to generate economic benefits for a greater portion of the
calendar year.
In light of this apparent gap in the academic research, my thesis specifically
investigates the economic trends associated with NBA stadium constructions using the
most up to date available data (through the year 2017). Inspired by the work of Geoffrey
Propheter, I apply a fixed effects econometric model to the most current economic data in
order to investigate whether or not the most recent wave of NBA arena constructions have
produced a significant economic impact. Like Propheter, my model will also control for
relevant economic measures. Further, in a subsequent specification, I will also extend this
model to investigate how the NBA franchise’s performance could drive the results.
III. Data
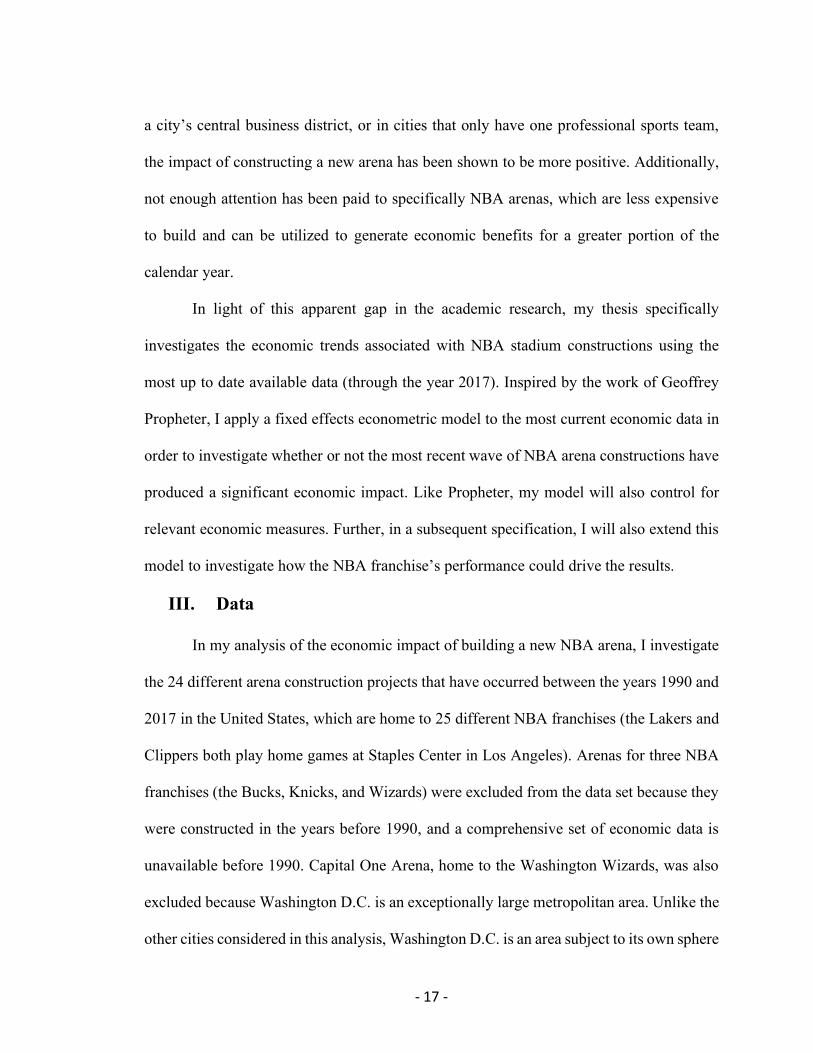
In my analysis of the economic impact of building a new NBA arena, I investigate
the 24 different arena construction projects that have occurred between the years 1990 and
2017 in the United States, which are home to 25 different NBA franchises (the Lakers and
Clippers both play home games at Staples Center in Los Angeles). Arenas for three NBA
franchises (the Bucks, Knicks, and Wizards) were excluded from the data set because they
were constructed in the years before 1990, and a comprehensive set of economic data is
unavailable before 1990. Capital One Arena, home to the Washington Wizards, was also
excluded because Washington D.C. is an exceptionally large metropolitan area. Unlike the
other cities considered in this analysis, Washington D.C. is an area subject to its own sphere
- 18 -
of economic factors, in large part due to the Federal government’s presence there. Past
research in this field has set the precedent of excluding this area from their analysis for this
reason (Propheter, 2012). Finally, the Air Canada Centre, home to the Toronto Raptors,
was also excluded from the analysis because it is located outside of the United States. See
Table A.1 (Appendix) for a comprehensive list of the professional arenas used in this
analysis, and their associated NBA team and cost of construction.
Each stadium included in the analysis is located in a major American city. They are
each a part of a Metropolitan Statistical Area (MSA), which is defined by the US Census
Bureau as a geographic area of high population density, with significant overlap of
economic activity between cities and, in some cases, counties. Metropolitan Statistical
Areas provide the best geographic base for analyzing the economic impact of a new arena
for multiple reasons. First and foremost, fans of the franchise do not only reside within the
city limits. Rather they inhabit a wide-ranging area around the city center, and many fans
travel long distances to attend games. This suggests that a new stadium construction would
impact much of the area surrounding the city. However, the further away from the stadium,
the less likely there is to be an economic impact. Investigating data at the MSA level offers
a balance between capturing a professional franchise’s far reaching fan base support and
measuring realistic economic impacts. MSA’s are also attractive because they allow the
analysis to capture not only the direct, but also the indirect expenditures that result from
the presence of a new stadium. Lastly, individuals who gain employment as a result of a
new stadium come not only from the city hosting the stadium, but from the surrounding
communities as well. This fact makes MSA’s the appropriate level at which to investigate
measures of employment and personal income.

- 19 -
In my research, I have collected a balanced panel data set of the relevant economic
data for the years 1990-2017 for the 24 MSAs included in my analysis. Such data measures
for each year include: per capita personal income (PCPI), the unemployment rate, new
private housing units authorized for construction, an economic conditions index, and the
number of employees working in the construction industry. The economic data for each
MSA was collected from the FRED (Federal Reserve Bank of St. Louis) online database.
In order to code for when a franchise constructed a new arena, I implement a dummy
variable that equals 0 in all years before the new stadium opened and equals 1 for the year
of construction and all years thereafter. If an arena has been renovated since its initial
construction, I also include two other dummy variables (renovation and update) to record
the subsequent renovations event taking place. A dummy variable is also included to
signify if the NBA franchise shares tenancy of the arena with another professional sports
franchise. The data set also includes measures of the NBA team’s performance as measured
by their regular season win percentage, and two binary variables signifying a playoff berth
and a championship. Additionally, I have included a binary time variable to control for the
effects of the 2008 recession. The effects of this financial crisis were so influential and
widespread that it would be impossible to ignore its impact in any economic analysis of
the early twenty-first century.
In addition, the same economic measures of PCPI, unemployment, new houses and
construction workers were collected for the state in which the NBA arena resides. The
rationale for collecting economic data at the state level is that each state has a distinct set
of laws, taxes, and regulations which may drastically shape the impact that a new arena
may have on the surrounding MSA. State level data is incorporated into the analysis in

- 20 -
order to control for these individual differences between states. This controlling process is
facilitated by the use of ratios (as in Propheter, 2012). In my analysis, each economic
variable is expressed as the ratio of the MSA to State level data. Thus, when the ratio is
greater than 1 in the case of PCPI, it suggests that the citizens living within the MSA
generally have a relatively higher personal income than the state average. In the case of
unemployment, a ratio of less than 1 suggests that rates of unemployment in the MSA are
less than in the rest of the state.
In my regressions, the main dependent variable of interest is the ratio of the MSA’s
level of per capita personal income divided by the state’s. In past research where this
variable has been employed, it is commonly referred to as the MSA’s regional share of
PCPI (Propheter, 2012).
Unfortunately, as is the problem in most research in this field, variables that
measure economic development are usually subject to simultaneity bias. In other words,
the rate of unemployment likely affects per capita income and vice versa. In order to resolve
this potential simultaneity issue, I lag the economic control variables (unemployment,
construction workers, and new housing units) by 1 index year. These lagged economic ratio
measures will be used as control variables in my analysis.
Table 1 below displays average measures of the major economic variables – per
capita personal income, unemployment, and new houses built – collected for each of the
24 MSAs included in this analysis. In addition to the average over the total period (1990-
2017), the table presents measures for the periods before and after each city’s respective
arena construction was completed.

- 21 -
In broadly examining this raw data, it is clear that over the course of the examined
period per capita personal incomes generally increased. The average PCPI in the years after
construction for all MSAs is nearly fifteen thousand dollars larger than it was for the period
before construction. Also evident from the data is that the average number of new homes
built in the MSA generally increased for the period after arena constructions. While this is
Table 1. Average Economic Variable Measures for each MSA: Before Construction (BC), After Construction (AC), and for the Total Period 1990-2017
City
Average Personal Income per Capita ($)
Average Unemployment (%)
Average New Houses Built (thousands)
BC AC Total Period
BC AC Total Period
BC AC Total Period
*Detroit, MI 34,320 n/a 34,320 7.40 n/a 7.30 1,048 n/a 1,040 Sacramento, CA 36,079 51,370 34,438 6.81 4.90 6.67 888 688 874 Brooklyn, NY 40,370 62,351 44,440 6.38 6.27 6.35 3,169 3,969 3,341 Orlando, FL 26,329 36,459 28,956 5.03 6.99 5.59 1,738 1,213 1,588
Charlotte, NC 25,951 42,162 33,156 4.48 7.22 5.75 1,410 1,290 1,354 Memphis, TN 25,264 38,185 31,485 4.96 7.06 6.01 678 424 551 Houston, TX 26,660 45,595 36,478 5.61 5.89 5.76 2,342 4,075 3,271
San Antonio, TX 21,472 36,018 29,553 4.81 5.28 5.08 642 921 802 Oklahoma City, OK 21,679 38,273 30,898 3.98 4.52 4.29 375 517 456
Dallas, TX 25,859 41,845 35,332 4.75 5.62 5.28 2,908 3,614 3,337 New Orleans, LA 21,020 38,138 32,432 7.52 5.93 6.44 284 323 310
Miami, FL 25,634 41,841 36,439 7.22 5.89 6.32 1,788 1,687 1,719 Los Angeles, CA 24,647 42,884 36,805 7.30 6.92 7.04 1,775 2,112 2,004 Indianapolis, IN 24,055 39,411 34,292 3.77 5.37 4.85 967 870 901
Denver, CO 26,379 45,121 38,874 4.08 5.16 4.81 1,173 1,376 1,311 Atlanta, GA 24,562 39,186 34,311 4.67 6.01 5.58 3,314 3,409 3,378
Philadelphia, PA 24,355 43,554 39,288 6.40 5.66 5.82 1,355 1,228 1,255 Portland, OR 21,765 37,089 34,251 5.34 6.19 6.04 1,119 1,099 1,103 Boston, MA 26,491 50,350 45,932 6.74 4.70 5.06 664 848 815
Cleveland, OH 22,282 36,200 34,138 6.33 5.26 5.41 545 424 441 Chicago, IL 23,771 40,645 38,145 7.38 6.43 6.56 2,566 2,503 2,512 Phoenix, AZ 18,883 31,538 30,600 4.80 5.15 5.12 1,170 2,769 2,655
Salt Lake City, UT 16,312 30,602 30,072 3.90 4.19 4.18 308 625 614 **Minneapolis, MN n/a 39,016 39,016 n/a 4.16 4.16 n/a 1,339 1,339
Total Averages 25,397 41,210 35,152 5.64 5.68 5.64 1,401 1,623 1540 Note: BC= Avg. in years before arena construction, AC = Avg. in years after construction Note: See table A.1 (Appendix) for the name of the MSA that corresponds with each City *Little Caesar’s Arena (Detroit) opened in 2017, thus Avg. measures AC are not applicable **Target Center (Minneapolis) opened in 1990, thus Avg. measures BC are not applicable

- 22 -
not true for every MSA included in the analysis, the average value for all 24 MSAs
combined does increase. However, it is difficult to say whether or not these increased
measures of personal income and new houses are the direct result of the NBA arena
constructions, or whether they have more to do with the general trend of economic growth
that occurs over time. In order to determine whether the impact of a new arena construction
does have a significant impact on the surrounding economy, an econometric model needs
to be employed which controls for other outstanding economic conditions over time.
IV. Empirical Strategy and Results
The overarching empirical strategy of this analysis will be to compare the results
from a series of three regressions. The first regression is an intentionally unsophisticated
model, whose purpose is to demonstrate the misleading conclusions one can come to if
they do not apply the appropriate model specifications. Even though this naive model
produces significant results, it fails to control for other essential economic factors, as well
as individual heterogeneity between observations.
The second and third regressions employed are fixed-effects models, which more
appropriately fit the requirements of the balanced panel data set. The second regression
controls for outstanding economic factors, and the third regression additionally controls for
the NBA franchise’s performance. This analysis contrasts the results of the naive regression
with the other two models, ultimately emphasizing the importance of econometric controls
and model specification when drawing conclusions about the catalysts of urban
development.
The first regression used in the analysis will be a simple pooled regression,
estimated by Ordinary Least Squares (OLS):

- 23 -
𝒀𝒊𝒕 = 𝒂 + 𝑿′𝒊𝒕𝜷 + 𝝐𝒊𝒕.
In this model the dependent variable, 𝒀𝒊𝒕, is the MSA’s regional share of per capita
personal income. The independent variables, represented as 𝑿𝒊𝒕- in the above model, include
a series of dummy variables used to signify the time at which a new NBA arena was
constructed, renovated, and updated (a second renovation). The only control variable
included in this analysis is a binary indicator of the 2008 recession. The 𝜷 term represents
the parameters for each of these dummy variables. Finally, the 𝝐 term in this model
represents the residual error term.
The results of this simplistic, pooled regression are displayed in Table 2. The most
important implication of these results is the significantly positive coefficient associated
with the “New Arena” variable. This result suggests that when a new arena is constructed
in a major city, the surrounding MSA benefits from a 3% increase in per capita personal
income, relative to the state average level. This positive impact suggests that the
construction of a new arena generates significantly greater levels of economic activity in
the metropolitan area.
Table 2. OLS Pooled Regression on Per Capita Personal Income ratio (MSA/State)
Variables Coefficient (Standard Error) New Arena .030478 (.006176)*** Renovation .020853 (.008878)***
Update -.022024 (.014966) Recession -.035654 (.007035)*** Constant 1.072592 (.004345)
R-square = 0.0618
Additionally, stadium renovations had a significantly positive impact on the MSA’s
economy, suggesting that improvements made to stadiums also generate increased
economic activity. As expected, the coefficient associated with the recession indicator

- 24 -
variable was significantly negative. Considering just these results, an individual could
ultimately conclude that NBA arenas constructed since 1990, overall, have had a
significantly positive impact on their respective metropolitan economies. This sort of
analysis could be handpicked by consulting agencies tasked with promoting new stadium
construction in the future.
Drawing these sorts of economic conclusions, however, is inappropriate given the
constraints of the above model. One major flaw of this pooled regression is that is fails to
consider other economic control variables into its analysis. Surely measures of personal
income are impacted by other economic factors. Failing to incorporate measures such as
the metropolitan area’s rate of unemployment and number of new houses constructed
leaves this model subject to omitted variable bias. The other major flaw of the model is its
failure to control for individual heterogeneity of the 24 observations followed from 1990-
2017. Therefore, in order to come to more realistic conclusions about the impact of new
NBA arena constructions, a more statistically appropriate methodology is necessary.
To construct a more appropriate model, I employ the fixed effects methodology.
This methodology is more appropriate for this data set because its structure controls for
individual observation heterogeneity. Additionally, this model specification adopts the
assumption of heteroscedasticity and allows for clustered standard errors, in order to
control for potential issues of within MSA autocorrelation. The model is displayed as:
𝒀𝒊𝒕 = 𝑿𝒊,𝒕/𝟏- 𝜷𝟏 +𝑾𝒊𝒕- 𝜷𝟐 + 𝜶𝒊 + 𝝐𝒊𝒕.
In this model, the main variable of interest, 𝒀𝒊𝒕, remains the MSA’s regional share
of PCPI. The first vector of independent variables,𝑿𝒊,𝒕/𝟏- , represents a series of lagged,
economic control variables for each MSA. These economic control variables include ratio

- 25 -
measures (MSA/State) of unemployment, construction employees, an economic index
measure, new private housing units authorized for construction, and a recession indicator.
The parameter for each of these terms is represented as 𝜷𝟏. Further, in this model 𝑾𝒊𝒕-
represents a series of time indicator variables, which represent the years when a new arena
was constructed, renovated, or updated. Also included in this vector are variables indicating
whether or not the arena has another professional team acting as a cotenant. Additionally,
indicator variables representing the novelty of the new stadium (0 for all years, except for
when stadium is constructed), and the short-term impact (0 for all years, except for the 5
years after construction) are included. The variable 𝜶𝒊 represents the fixed effects in the
model, and 𝝐𝒊𝒕 is the error term. The model is estimated by OLS, and the results are
presented in Table 3.
The results of this more sophisticated fixed-effects model have a number of
important implications. First and foremost, when a model which controls for lagged
economic factors is employed, the significance of the impact of a new arena disappears.
Where before in the simple regression the results displayed a significantly positive impact
of new stadium construction, this more sophisticated model tells a much different story. In
fact, the trend direction of the new arena variable coefficient is negative, suggesting that
stadiums generally have a negative impact on the surrounding economy. The variable
signifying an arena renovation also loses its statistical significance in this second
specification. The only arena variable that does carry statistical significance in this model
is the indicator representing an arena update – when a stadium is renovated for a second
time. The trend of this variable though is negative, suggesting that subsequent
improvements to an arena generate negative effects for the surrounding MSA economy.

- 26 -
Overall, these results align with past academic research in that they find the net economic
impact of building a new arena to be near zero.
Table 3. Fixed Effects Regression on Per Capita Personal Income ratio (MSA/State)
Variables Coefficient (Clustered Robust Standard Error)
New Arena -.003728 (.005432) Renovation .002409 (.005823)
Update -.015579 (.00884)* Unemployment -.047355 (.025212)*
New Private Houses .078196 (.026458)*** Construction Employees .0053703 (.003906)
Economic Conditions Index -.0004602 (.000499) Recession Indicator -.014255 (.004733)***
Arena Cotenant .00894 (.005351) Novelty Effect -.004671 (.004082)
5 Years after Construction .0000952 (.006733) Constant 1.095845 (.023079)***
R-square overall = 0.1247
Important implications can also be drawn from this model in reference to the vector
of economic control variables implemented. The trends of the lagged control variables, for
the most part, align with expectations, but these results ultimately shed light on what really
drives urban economic development. For one, the results show that the lagged
unemployment rate has a statistically significant negative relationship with per capita
personal income. This relationship suggests that when unemployment rates decrease within
a metropolitan area, and more citizens are earning wages, in time the overall level of
personal income increases. Secondly, the number of new private housing units authorized
for construction has a statistically significant relationship with personal income, suggesting
that when more houses are built within a city, incomes generally increase. These results
align with economist’s general understanding of how new private housing units can serve
as a driver of urban development (Adams & Barber, 2011). The recession indicator variable
- 27 -
also had a significantly negative relationship with personal income, as expected. The trend
of the ratio of construction employees in the MSA relative to the state did not carry
statistical significance, however it was positive.
Other important implications of this model include the fact that the indicator
variable signifying the years when the NBA franchise shared tenancy of the arena with
another professional sports franchise was positively related, though insignificantly, with
MSA personal income. Even though the trend is statistically insignificant, the result aligns
with the expectation that an arena that is utilized more often by professional teams will
generate more of a positive impact on the local economy. Also of note is the negative
coefficient associated with the novelty indicator variable, which equaled 0 in all years
except for the year the NBA arena was constructed. This coefficient is not statistically
significant, but the negative trend suggests that any positive economic impact of the
construction was not experienced in the first year that the arena was built. However, when
considering the short term (5 year) impact of the construction, the trend of the coefficient
does become slightly positive. This 5-year impact variable suggests that arena
constructions are positively related with levels of personal income, but it does take a few
years for the positive impacts to manifest.
In order to further extend this analysis, I also constructed a third model specification
in the hopes of investigating the relationship between economic outcomes and the
performance of the NBA franchise. This third specification employs the same fixed effects
methodology used in the previous analysis, controlling for individual heterogeneity. The
model is estimated by OLS, and is presented as:
𝒀𝒊𝒕 = 𝑿𝒊,𝒕/𝟏- 𝜷𝟏 +𝑾𝒊𝒕- 𝜷𝟐 + 𝑷′𝒊𝒕𝜷𝟑 + 𝜶𝒊 + 𝝐𝒊𝒕.

- 28 -
This model builds off of the previous analysis employing the same dependent
variable, 𝒀𝒊𝒕, defined as the MSA’s regional share of per capita personal income. The
model also implements the same independent variable vectors for 𝑿𝒊,𝒕/𝟏- and 𝑾𝒊𝒕- that were
used in the second model specification. The novel aspect of this specification is the vector
of performance variables included, represented as 𝑷𝒊𝒕- . This vector includes a team
performance variable, defined by the franchise’s regular season win percentage for each
year. Also included in the vector are indicator variables signifying the years in which the
franchise achieved a playoff berth, and if that franchise won the NBA championship.
Table 4. Fixed Effects Regression on Per-Capita Personal Income – Team Performance Specification
Variables Coefficient (Standard Errors) New Arena -.003596 (.00436) Renovation .002108 (.003186)
Update -.016814 (.005132)*** Unemployment -.048214 (.011078)***
New Private Houses .078297 (.013483)*** Construction Employees .005406 (.003432)
Recession Indicator -.013608 (.002654)*** Arena Cotenant .008722 (.003873)**
Novelty -.003773 (.005085) 5 Year Impact .00599 (.003013)
Season Win Percentage .001744 (.008464) Playoff Berth .000286 (.002775)
NBA Championship -.009875 (.004852)** Constant 1.09496 (.012814)***
R-square overall = 0.1213
The results of this third specification, displayed in Table 4 above, for the most part
align with the conclusions drawn in the previous analysis. When metrics of team
performance are incorporated into the regression, the economic impact of constructing an
NBA arena is not statistically significant. In fact, as was the case in the second model
specification, the direction of the insignificant coefficient is negative. The negative impact

- 29 -
of subsequent stadium renovations, defined as the “update variable”, also takes on a greater
level of statistical significance at the one-percent level. The indicator variables signifying
co-tenancy and the short-term impact of the arena also align with the conclusions drawn in
the previous analysis.
The vector of NBA franchise performance variables included in this third
specification carries little statistical significance. The team’s regular season win percentage
was not significantly correlated with the host city’s personal income, however the trend of
the associated coefficient is positive. This trend suggests that when a franchise is more
successful and wins more games, a larger portion of fans are drawn to attend games and
spend more of their money downtown, thereby generating economic benefits for the
surrounding economy. The variable that codes for the years when the franchise makes the
playoffs has a similar positive impact. When a team makes the playoffs, the result is extra
opportunities to attend professional basketball games, which marginally increases the
potential benefit the stadium can have on the surrounding economy, though not at a
statistically significant level. Surprisingly, the relationship between the years when a NBA
franchise wins a championship and the city’s per capita personal income is significant, and
the trend of the associated coefficient is negative. This result is surprising because
achieving an NBA championship only occurs after the franchise has played the entirety of
the postseason, which offers the host venue the maximum number of games played in a
season. Logic implies that more games should generate a greater economic benefit to the
surrounding community. However, this result likely arose due to the fact that only 11 teams
have won an NBA championship since 1990. Since such a small number of franchises have
won a championship during this period, and since this analysis estimates the data for 25

- 30 -
separate franchises, the true impact of winning a championship may have been watered
down. Further analysis into this question should isolate only the cities that have won a
championship in order to estimate the true impact.
The lagged economic control variables also interact with the metropolitan area’s
share of personal income as expected. The MSA’s relative level of unemployment and the
recession indicator both have a statistically significant negative impact on per capita
personal income, as was the case in the second model specification. The distinct aspect of
the results from this third specification has to do with the measure of new private houses
constructed. In this model, the positive coefficient associated with the new houses variable
carries statistical significance at the one percent level. These results support the notion that
new private housing construction is an essential driver of economic development.
V. Conclusion
In this analysis, I extend the work of previous researchers in order to answer the
essential question: what is the urban economic impact of constructing a new professional
sports arena? Prior work in this field, which was for the most part targeted specifically at
investigating the impact of constructing new stadiums for teams in the NFL and MLB, has
come to the conclusion that the net economic impact is near zero and insignificant.
However, less often considered in past research is the economic impact created by
constructing a sports arena for teams in the NBA and NHL. These arenas are cheaper to
construct than NFL and MLB stadiums, and since they are indoors, can be utilized year-
round to generate economic benefits for the surrounding community. Thus, an investigation
into the economic impact of constructing specifically NBA arenas offers the best chance
of finding a positive effect.

- 31 -
In my analysis, I compare the results of three different econometric specifications.
In the first model, I implement a pooled regression to investigate what effect NBA arena
construction had on the Metropolitan area’s regional share of per capita personal income.
The results of this regression suggest that constructing a new arena has a significantly
positive effect on the surrounding metropolitan area, in that it produced a 3% increase in
the MSA’s share of personal income, relative to the state. However, this simplistic model
is inherently flawed. Its structure does not control for other outstanding economic
variables, nor does its econometric method control for individual heterogeneity between
observations. These failures in the model leave its results subject to both omitted variable
bias and heterogeneity bias.
I attempt to address these concerns in the second model specification, incorporating
the fixed effects methodology and also adding a vector of economic control variables into
my analysis. When these aspects of the model are included, the impact of constructing a
new NBA arena is no longer statistically significant. In fact, the associated trend of the
coefficient suggests that the new arena construction actually has a negative impact on the
surrounding economy. In the third model specification I extend this same model to
incorporate measures of the NBA franchise’s success, in the hopes of discovering a
relationship between the team’s success and economic variables. However, the results of
this third specification also proved to be statistically insignificant.
The major implication of this comparative analysis is that any research conducted
in this field must be sure to use the appropriate econometric specification and to control
for other economic factors. Failing to do so, as illustrated by the first model specification,
will produce misleading results. City officials who are charged with deciding whether or

- 32 -
not to pay for the construction a new stadium with taxpayer money must be weary of
economic analyses that claim a statistically significant positive impact. Unless these
economists employed the appropriate econometric specification and incorporated the most
relevant economic control variables, the results of these prospective studies should not be
considered to be valid.
Even though the results of this analysis did not reveal a statistically significant
relationship between new NBA arena construction and the economic well-being of a
metropolitan area, it does carry a number of implications of how a city can best position
itself for economic improvement. These implications can be drawn from the relationship
between the economic control variables and the dependent variable of interest. The results
of the second and third model specification show that these lagged economic control
variables are significantly related to measures of per capita income. Therefore, the best
way for a city to raise its overall standard of living would be to construct policies which
are aimed at improving these other economic factors. As an example, in both the second
and third model specifications, the lagged measure of the city’s new private housing units
constructed was significant and positively related to the current year’s per capita income.
Thus, one way a city could hope to improve their economy would be to construct more
homes in the downtown area, generating increased employment in the construction sector
and bringing more consumption into the region. Even if constructing a new professional
stadium is not, in itself, a major catalyst of economic development, if the stadium is built
as one aspect of a greater metropolitan area redevelopment effort, there is a much larger
opportunity for that city to experience economic growth.

- 33 -
The most recent example of this sort of “smart growth” urbanism can be found in
the case of Sacramento. Since the Kings new Golden 1 Center opened in 2016, the city of
Sacramento has experienced great economic benefits as a result. However, the implication
is not that Sacramento’s improved economy resulted directly from the arena being built.
Rather, the urban redevelopment in the past two years was the result of a massive
transformation in the downtown area as a whole. City officials had a vision for how they
could improve their urban center, and Golden 1 Center was just one small part of this
broader redevelopment effort. Therefore, the ultimate conclusion of this analysis is that in
order for a new professional sports stadium to generate positive economic returns for a city,
that stadium must be accompanied by a plan for how to most effectively integrate that
stadium within a newly transformed urban space.
In relation to this topic, future research could be conducted which investigates the
relationship between professional team performance and urban economic impact. The
results of the third specification included in this analysis did not find significant
relationships between team success and economic outcomes, however, the trends of the
coefficients did suggest more successful teams have a marginally positive economic
impact. Future research could conceive of a method which is more specifically targeted
towards team performance measures, in the hopes of finding significant relationships.

- 34 -
Bibliography
Adams, Robert J., Barber, Neal. (2011). “The Effects of Housing on the Local Economy.” Housing Virginia. Retrieved April 10, 2018, from http://www.housingvirginia.org/wp-content/uploads/2016/02/WhitePaperFinal.pdf .
Baade, Robert. (1994). “Stadiums, Professional Sports, and Economic Development: Assessing the Reality.” Heartland Institute Policy Study, 62. Retrieved March 12, 2018, from https://www.heartland.org/_template-assets/documents/publications/8828.pdf .
Brookings Institution. (n.d.). “Average construction costs of professional sports arenas/stadiums built since 2000 (in million U.S. dollars), by league.” In Statista - The Statistics Portal. Retrieved February 13, 2018, from https://www.statista.com/statistics/790964/average-construction-costs-of-sports-stadiums-arenas-by-league/ .
Humphreys, B., Nowak, A. (2017). “Professional sports facilities, teams and property values: Evidence from NBA team departures.” Regional Science and Urban Economics, 66, 39-51.
Nelson, Arthur. (2001). “Prosperity or Blight? A Question of Major League Stadia Locations.” Economic Development Quarterly, 15, 3, 255-265.
Propheter, Geoffrey. (2012). “Are Basketball Arenas Catalysts of Economic Development?” Journal of Urban Affairs, 34, 4, 441-459.
PwC. (n.d.). “North America sports market size from 2009 to 2021 (in billion U.S. dollars).” In Statista - The Statistics Portal. Retrieved February 13, 2018, from https://www.statista.com/statistics/214960/revenue-of-the-north-american-sports-market/.
Santo, Charles. (2005). “The Economic Impact of Sports Stadiums: Recasting the Analysis in Context.” Journal of Urban Affairs, 27, 2, 177-191.
Schrotenboer, B. (2017). “What we know about Chargers’ move to Los Angeles.” Retrieved March 27, 2018, from https://www.usatoday.com/story/sports/nfl/chargers/2017/01/12/chargers-los-angeles-move-san-diego-relocation/96505836/ .
Siegfried, J., Zimbalist, A., (2000). “The Economics of Sports Facilities and Their Communities.” The Journal of Economic Perspectives, 14, 3, 95-114.
Sisson, P. (2018). “Can stadiums save downtowns-and be good deals for cities?” Retrieved March 27, 2018, from https://www.curbed.com/2018/1/30/16948360/stadium-public-funding-sacramento-kings .
U.S. Bureau of Economic Analysis. Personal Income per Capita, retrieved from FRED, Federal Reserve Bank of St. Louis; https://fred.stlouisfed.org .
Walden, Michael. (1997). “Don’t Play Ball.” Carolina Journal. October/ November, p. 23.
Wolla, Scott A. (2017). "The Economics of Subsidizing Sports Stadiums," Page One Economics.

- 35 -
Appendix Table A.1. Arenas and Corresponding Metropolitan Statistical Area Used in Analysis
NBA Franchise
Arena Metropolitan Statistical Area Opening Year
Construction Cost
(Millions of 2017 USD)
Timberwolves Target Center Minneapolis-St. Paul-Bloomington, MN-WI
1990 195
Jazz Vivint Smart Home Arena
Salt Lake City, UT 1991 167
Suns Talking Stick Resort Arena
Phoenix-Mesa-Scottsdale, AZ 1992 157
Bulls United Center Chicago-Naperville-Elgin, IL-IN-WI 1994 289 Cavaliers Quicken
Loans Arena Cleveland-Elyria-Mentor, OH 1994 165
Celtics TD Garden Boston-Cambridge-Newton, MA-NH 1995 257 Trailblazers Moda Center Portland-Vancouver-Hillsboro, OR-
WA 1995 421
76ers Wells Fargo Center
Philadelphia-Camden-Wilmington, PA-NJ-DE-MD
1996 328
Hawks Phillips Arena Atlanta-Sandy Springs-Roswell, GA 1999 314 Nuggets Pepsi Center Denver-Aurora-Lakewood, CO 1999 275 Pacers Bankers Life
Fieldhouse Indianapolis-Carmel-Anderson, IN 1999 269
Lakers & Clippers
Staples Center Los Angeles-Long Beach-Anaheim, CA
1999 551
Heat American Airlines Arena
Miami-Fort Lauderdale-West Palm Beach, FL
1999 313
Pelicans Smoothie King Center
New Orleans-Metairie, LA 1999 167
Mavericks American Airlines Center
Dallas-Fort Worth-Arlington, TX 2001 580
Thunder Chesapeake Energy Arena
Oklahoma City, OK 2002 154
Spurs AT&T Center San Antonio-New Braunfels, TX 2002 253 Rockets Toyota Center Houston-Sugar Land-Baytown, TX 2003 313 Grizzlies FedEx Forum Memphis, TN-MS-AR 2003 324 Hornets Spectrum
Center Charlotte-Concord-Gastonia, NC-SC 2005 326
Magic Amway Center
Orlando-Kissimmee-Sanford, FL 2010 546
Nets Barclay’s Center
New York-Newark-Jersey City, NY-NJ-PA
2012 1,000
Kings Golden 1 Center
Sacramento–Roseville–Arden-Arcade, CA
2016 558
Pistons Little Caesar’s Arena
Detroit-Warren-Dearborn, MI 2017 863
Average NBA Arena Construction Cost (1990-2017) = 366 million (2017 USD)


![[Data Visualization] NBA Players Hometown and NBA Championships](https://img.pdfslide.us/doc/110x75/546d89a0af7959e2148b4c73/data-visualization-nba-players-hometown-and-nba-championships.jpg)