Embed Size (px)
Citation preview

CALIFORNIA LEGISLATURE
ANALYSIS OF THE BUDGET BILL of the
STATE OF CALIFORNIA
for the
Fiscal Year July 1, 1980, to June 30, 1981
Report of the Legislative Analyst to the
Joint Legislative Budget Committee
MEMBERS OF THE COMMITTEE
SENATORS Wolter W. Stiern, Chairman William Campbell Marz Garcia Robert Nimmo Nicholas C. Petris Albert S. Rodda Bill Greene
HON. MIKE CURB lieutenant Goyemor
President of the Senate
ASSEMBLYMEN Richard Robinson, Vice Chairman Daniel Boatwright Eugene A. Chappie Gordon Duffy S. Floyd Mori Dave Stirling John Vasconcellos
WILLIAM G. HAMM legislbtiye. Analyst
HON. JAMES R. MILLS President pro Tempore
of the Senate
HON. LEO T. McCARTHY Speaker of the Assembly
\

PROFESSIONAL STAFF
William G. Hamm-Legislative Analyst John L. Vickerman-Chief Deputy
Thomas J. Dooley-Deputy Kenneth A. Carter-Deputy
William E. Behnk Donald W. Benedict Craig Brown Ted Clement Peter Schaafsma
Principal Program Analysts
Gerald Concklin James Cooney Harold E. Geiogue Elizabeth G. Hill
Gerald Beavers-Principal Capital Outlay Analyst
Nancy Rose Anton . Nicholas Bartsch Arthur Bernstein Carol Bingham Nancy Borow Winston Brooks Neil Burraston Phyllis Cadei Ann Carberry Bill Chavez Dale Claypoole Lesley Cummings Chi-Ming Dana Curry William Davies Robert A. Del Agostino Ed Derman John M. Eells Anne Sutherland Frentz B. Timothy Gage Hadley Johnson, Jr. Todd Kaufman Wayne Keithley Richard Keller Richard A. Lee, Jr. Charles Lieberman Mary Jo McCullough
Analysts
iii
Leslie A. McFadden Deanna J. Marquart Rudolph Marshall Betty Masuoka Steven Olsen Harry Osborne Thomas Putnam Daniel Rabovsky Raymond M. Reinhard Teresa Rocha William Rogers Jeffrey Rudolph LaMar Sayer Donald Saylor Steven Schnaidt Jeffrey P. Shellito Dale Shimasaki Charles Shulock Cheryl Stewart Thomas Tanner Mac Taylor Jon David Vasche David Walrath Samuel E. Walton Thomas Wiesendanger Brad Williams

LETTER OF TRANSMITTAL
925 L Street, Suite 650 Sacramento, California 95814 February 27, 1980
THE HONORABLE WALTER W. STIERN, Chairman and Members of the Joint Legislative Budget Committee State Capitol, Sacramento
Gentlemen:
In accordance with the provisions of Government Code, Sections 9140-9143, and Joint Rule No. 37 of the Senate and Assembly, I submit for your consideration an analysis of the Budget Bill of the State of California for the fiscal year July 1, 1980, to June 30, 1981.
The purpose of this analysis is to assist the committee in performing its duties which are set forth in Joint Rule No .. 37 as follows:
"It shall be the duty of the committee to ascertain facts and make recommendations to the Legislature and to the houses thereof concerning the state budget, the revenues and exPenditures of the state, and of the organization and functions of the state, its departments, subdivisions and agencies, with a view of reducing the cost of the state government, and securing greater efficiency and economy."
I am grateful to the staff of the Department of Finance and to the other agencies of state government for their generous assistance in furnishing information necessary for this report.
v
Respectfully submitted,
WILLIAM G. HAMM Legislative Analyst
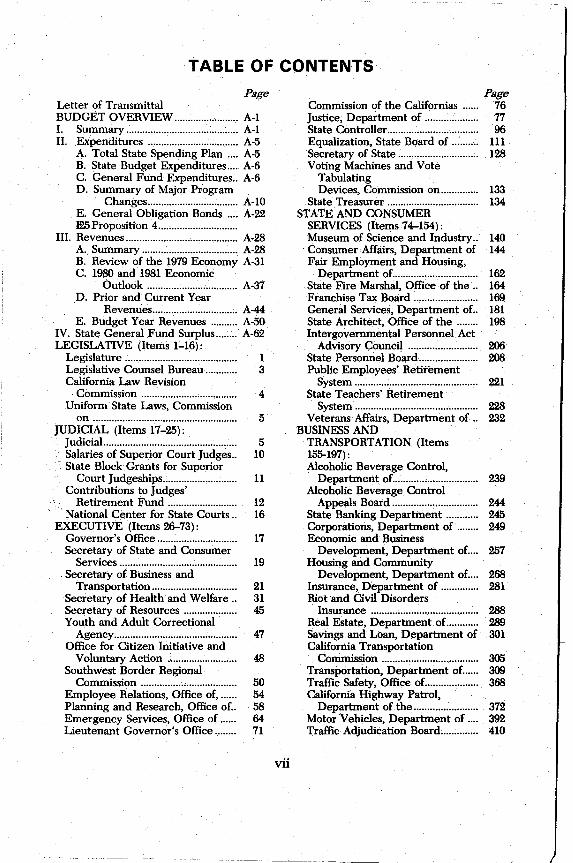
TABLE OF CONTENTS
Page Letter of Transmittal BUDGET OVERVIEW ........................ A-I I. Summary .......................................... A-I II. Expenditures .. , ............................... A-5
A. Total State Spending Plan .... A-5 B. State Budget Expenditures .... A-6 C. General Fund Expenditures .. A-6 D. Summary of Major Program
Changes ................................. , A-I0 E. General Obligation Bonds .... A-22 I25Proposition 4 ............................. .
III. Revenues .......................................... A-28 A. Summary .................................... A-28 B. Review of the 1979 Economy A-31 C. 1980 and 1981 Economic
Outlook .................................. A-37 D. Prior and Current Year
Revenues .............................. ;. A-44 E. Budget Year Revenues .......... A-50
IV. State General Fund Surplus ........ A-62 LEGISLATIVE (Items 1:"'16):
Legislature .......................................... 1 Legislative Counsel Bureau ............ 3 California Law Revision
Commission .................................... 4 Uniform State Laws, Commission
on ...................................................... 5 JUDICIAL (Items 17-25):
Judicial.................................................. 5 Salaries of Superior Court Judges.. 10 State Block Grants for Superior
Court Judgeships............................ 11 Contributions to Judges'
Retirement Fund .......................... 12 National Center for State Courts.. 16
EXECUTIVE (Items 26-73): Governor's Office .............................. 17 Secretary of State and Consumer
Services ............................................ 19 . Secretary of Business and
Transportation ................................ 21 Secretary of Health and Welfare .. 31 Secretary of Resources .................... 45 Youth and Adult Correctional
Agency.............................................. 47 Office for Citizen Initiative and
Voluntary Action .•........................ 48 Southwest Border Regional
Commission .................................... 50 Employee Relations, Office of, ...... 54 Planning and Research, Office of.. 58 Emergency Services, Office of ...... 64 Lieutenant Governor's Office ........ 71
vii
Page Commission of the Californias ...... 76 Justice, Department of .................... 77 State Controller.................................. 96 Equalization. State Board of .......... III Secretary of State .............................. 128 Voting Machines and Vote
Tabulating Devices, Commission on.............. 133
State Treasurer .................................. 134 STATE AND CONSUMER
SERVICES (Items 74-154): Museum of Science and Industry.. 140 Consumer Affairs, Department of 144 Fair Employment and Housing,
Department of................................ 162 State Fire Marshal, Office of the.. 164 Franchise Tax Board ........................ 169 General Services, Department of.. 181 State Architect, Office of the ........ 198 Intergovernmental Personnel Act
Advisory Council .......................... 206 State Personnel Board ........... ;.......... 208 Public Employees' Retirement
System .............................................. 221 State Teachers' Retirement
System .............................................. 228 Veterans Affairs, Department of.. 232
BUSINESS AND TRANSPORTATION (Items 155-197): Alcoholic Beverage Control,
Department of................................ 239 Alcoholic Beverage Control
Appeals Board ................................ 244 State Banking Department ............ 245 Corporations, Department of ........ 249 Economic and Business
Development, Department of.... 257 Housing and Community
Development, Department of.... 268 Insurance, Department of .............. 281 Riot and Civil Disorders
Insurance ..................... ,.................. 288 Real Estate, Department of............ 289 Savings and Loan, Department of 301 California Transportation
Commission .................................... 305 Transportation, Department of...... 309 Traffic Safety, Office of.................... 368 California Highway Patrol,
Department of the ........................ 372 Motor 'vehicles, Department of .... 392 Traffic Adjudication Board.............. 410

TABLE OF CONTENTS-Continued Page Page
Stephen P. Teale Consolidated Data Center .................................... 414
RESOURCES (Items 198-272): Waterways Management
Planning ................................... ....... 419 Sea Grant Program .......................... 424 California Tahoe Regional
Planning Agency............................ 425 California Conservation Corps ...... 428 Energy Resources Conservation
and Development Commission.. 443 State Solid Waste Management
Board ................................................ 461 Air Resources Board ........................ 475 Colorado River Board of
California ........................................ 487 Conservation, Department of ........ 488 Forestry, Department of ................ 500 State Lands Commission.................. 520 Seismic Safety Commission ............ 530 Fish and Game, Department of .... 533 Wildlife Conservation Board .......... 544 Boating and Waterways,
Department of................................ 545 California Coastal Commission ...... 552 Parks and Recreation,
Department of ...... :......................... 558 California Exposition and State
Fair.................................................... 592 Santa Monica Mountains
Conservancy.................................... 596 San Francisco Bay Conservation
and Development Commission.. 599 Water Resources, Department of.. 602 State Water Resources Control
Board ................................................ 613 HEALTH AND WELFARE (Items
273-315): State Council on Developmental
Disabilities and Area Boards on Developmental Disabilities ....... .
Health and Welfare Agency Data Center ............................................. .
Statewide Health Planning and Development, Office of ............. .
Aging, Department of ..................... . Alcohol and Drug Programs,
Department of ............................... . Governor's Advisory Committee
on Child Development Programs ......................................... .
Health Services, Department of.. .. Public Health Programs ............. . Medi-Cal ........................ : ................ . Administrative Services and
Technical Budget Issues ......... .
628
634
640 648
669
683 685 691 717
754
viii
Developmental Services, Department of................................ 758
Mental Health, Department of...... 784 Employment Development
Department .................................... 813 Rehabilitation, Department of ...... 827 Social Services, Department of...... 833
Summary.......................................... 833 Department Support .................... 834 AFDC Cash Grants ...................... 875 State Supplementary Program
for Aged, Blind and Disabled 887 Special Adult Programs................ 900 Social Services Programs ............ 905 County Administration ................ 938
California Health Facilities Commission .................................... 950
K-12 EDUCATION (Items 316-358): Education, Department of .............. 956 California Advisory Council on
Vocational Education .................... 1088 Teachers' Retirement Fund............ 1090 Teacher Preparation and
Licensing, Commission for .......... 1092
POSTSECONDARY EDUCATION (Items 359-392): Summary .............................................. 1097 California Postsecondary
Education Commission ................ 1105 University of California .................... 110B Hastings College of·Law ................ ;. 1174 California State University and
Colleges ............................................ 1181 California Maritime Academy........ 1242 California Community Colleges,
Board of Governors of the .......... 1243 Student Aid Commission ................ 1257
YOUTH AND ADULT CORRECTIONAL (Items 393--410): Corrections, Department of............ 1266 Board of Prison Terms .................... 1280 Youthful Offender Parole Board .. 1282 Youth Authority, Department of
the .................................................... 1283 Institutional Review Board ............ 1294
GENERAL GOVERNMENT (Items 411-475): Political Reform Act of 1974 .......... 1295 Agricultural Labor Relations
Board ................................................ 1299 Public Employment Relations
Board .......... ;..................................... 1303 Finance, Department of .................. 1305

TABLE OF CONTENTS-Contimied Page
CFIS-California Fiscal Information System .................. 1317
Food and Agriculture, Department of................................ 1323
Unemployment Insurance and Benefits for Fairs .......................... 1335
Industrial Relations, Department of ........................................................ 1336
Workers' Compensation Benefits for Subsequent Injuries ................ 1352
Workers' Compensation Benefits for Disaster Service Workers ...... 1357
California State Government Organization and Economy, Commission on .............................. 1358
Interstate Cooperation, Commission on .............................. 1359
Administrative Law, Office of ........ 1360 California Arts Council.................... 1363 California Public Broadcasting
Commission .................................... 1375 Economic Development,
Commission for .............................. 1383 State Finance, Commission on ...... 1383 Military Department ........................ 1385 Military Retirement .......................... 1389 California Cadet Corps .................... 1390 Public Utilities Commission ............ 1391 Status of Women, Commission on
the .................................................... 1403 Native American Heritage
Commission .................................... 1405 Motion Picture CounciL ................. 1407 California Horse Racing Board ...... 1409 .Osteopathic Examiners, Board of .. 1412 Chiropractic Examiners, Board of 1414 Pilot Commissioners for the Bays
of San Francisco, San Pablo and Suisun, Board of ............................ 1416
California Information Systems Implementation Committee ...... 1417
Peace Officers Standards and Training, Commission on ............ 1418
Criminal Justice Planning, Office of ........................................................ 1422
ix
Page State Public Defender ...................... 1429 Assistance to Counties for
Defense of Indigents .................... 1435 Subvention for
Guardianship I Conservatorship Proceedings .................................... 1436
Payments to Counties for Costs of Homicide Trials .............................. 1437
Tort Liability Claims ........................ 1438 Board of ControL ............................. 1442 Indemnification of Private
Citizens ............................................ 1447 State Bar of California ...................... 1452
TAX RELIEF (Items 476-484): Summary .............................................. 1453 Senior Citizens:
Property Tax Assistance .............. 1455 Property Tax Postponement ...... 1457 Renters Tax Assistance ................ 1460
Personal Property.............................. 1462 Homeowners ...................................... 1465 Open-Space Payments to Local
Governments .................................. 1467 Payments to Local Government
for Sales and Property Tax Revenue Loss .................................. 1470
Renters ................................................ 1475 Substandard Housing ........................ 1477
MISCELLANEOUS (Items 485-496): Federal Revenue Sharing ................ 1479 Health Benefits for Annuitants ...... 1480 Miscellaneous Legislative
Mandates .......................................... 1482 Provision for Employee
Compensation ................................ 1488 Reserve for Contingencies or
Emergencies .................................. 1506 Augmentations for Price
Increases .......................................... 1508 CAPITAL OUTLAY (Items
497-594): Summary .............................................. 1510
CONTROL SECTIONS (Sections 4-37): .................................................... 1718

Expenditures
BUDGET OVERVIEW
I. SUMMARY
The 1980-81 budget proposed by the Governor includes expenditures of $24.0 billion from all state funds. Of this amount:
• $20.7 billion is from the General Fund. These expenditures are composed of $4.1 billion for state operations, $0.3 billion for capital outlay and $16.3 billion for local assistance (as defined in the budget).
• $3.1 billion is from special funds. • $0.2 billion is from selected bond funds. In addition, the budget provides for $9.3 billion in spending from federal
funds, and $6.4 billion in spending from nongovernmental cost funds including various public service enterprise, working capital and revolving and retirement funds. Adding these components together, the total state spending program amounts to $39.7 billion, including $33.3 billion of spending from governmental funds.
Using this last measure-spending from all governmental funds-the 1980-81 budget is about 9 percent higher than estimated expenditures in the current year. In total, the Governor proposes to spend about $1,431 for every man, woman and child in California, or about $91 million per day.
Revenues
The budget is supported from a variety of different sources including . taxes, fees, bond proceeds, service charges and intergovernmental transfers. The most important 1980-81 sources will provide:
• $19,362 million to the General Fund (including proposed transfers of tidelands oil and other funds)
• $2,985 million to some 118 different special funds. • $9,257 million to the state from the federal government. The state will
subvene most of these funds (55 percent) to local government. Income from state sources-General Fund and special funds-is es
timated to be $22,346 million. This is an increase of $1,777 million, or 8.6 percent, over 1979-80 and 26 percent above 1978-79 revenues.
The Department of Finance's estimate of General Fund revenues$19,362 million for 1980-81-is $1,581 million, or 8.9 percent, higher than estimated revenues in 1979-80. The percentage increase is well below the growth rates achieved during the recent past, if adjustments are made for changes in tax laws. This reflects the softer economy that the Department of Finance anticipates in calendar year 1980.
A detailed discussion of the revenue estimates and the economic assumptions on which the budget is based begins on page A-28 of this overview.
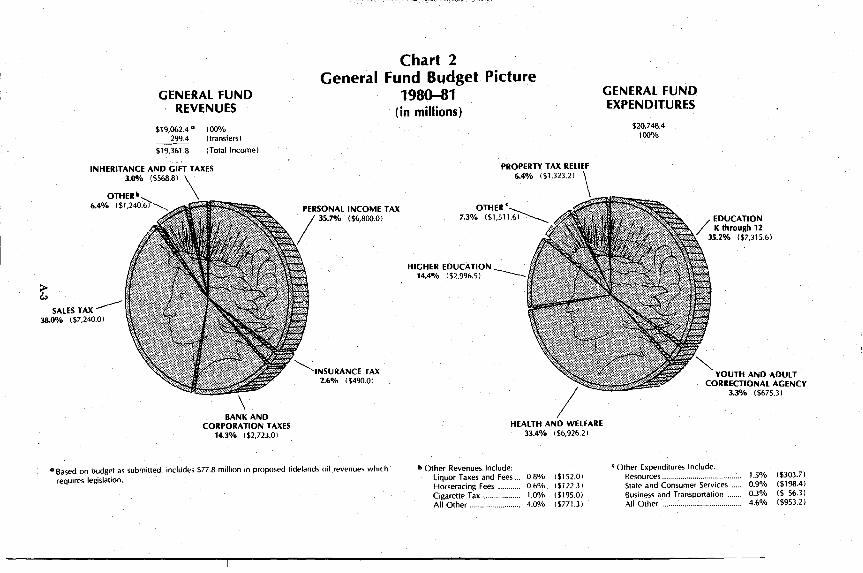
Charts 1 and 2 show the relative importance of the state's major revenue sources and the primary expenditure programs through which these revenues are spent.
A-I
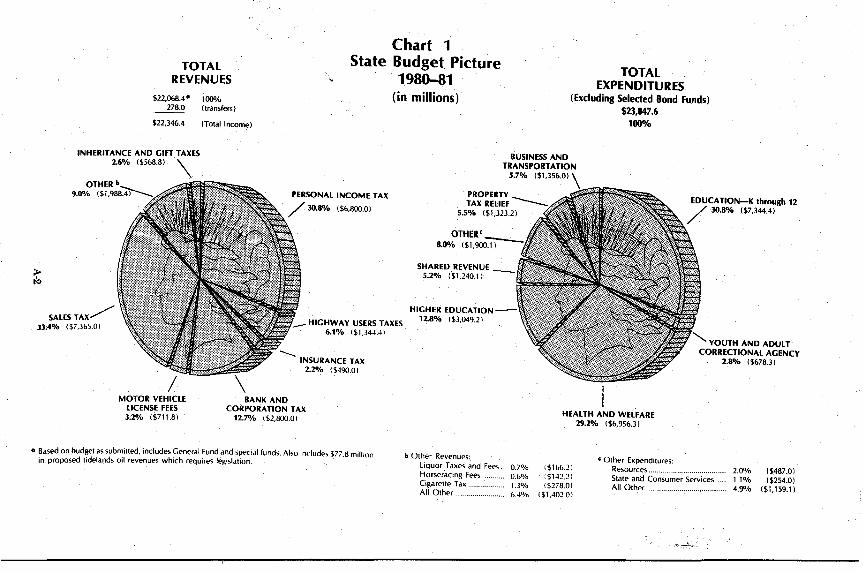
Chart 1 TOTAL
REVENUES ~
State Budget Picture 1980-81 TOTAL
EXPENDITURES (Excluding Selected Bond Funds)
$23,847.6 $22,068.4· 100% (in millions)
278.0 (transfers)
$22,346.4 (Total Income)
INHERITANCE AND GIFT TAXES 2.6% ($568.8) \
~
SALES TAX/ 33.4% ($7,365.01
MOTOR VEHICLE LICENSE FEES 3.2% ($711.8)
PERSONAL INCOME TAX
HIGHWAY USERS TAXES 6.1% 1$1.344.41
.......... INSURANCE TAX 2.2% 1$490.01
BANK AND CORPORATION TAX
12.7% 1 $2,800.0 1
o Based on budget as submitted, includes General Fund and speci.tI funds. AI~o "indude:-. $77.8 million in proposed tidelands oil revenues which requires legislation.
BUSINESS AND TRANSPORTATION
5.7% ($1,356.0)
PROPERTY TAX RELIEF ___
5.5% ($1,323.2]
OTHER' 8.0% ($1,900J)--
SHARED REVENUE _ 5.2% ($1,240.11
HIGHER EDUCATlON--12.8% ($3,049.21
100%
EDUCATION-K through 12 / 30.8% ($7,344.4)
YOUTH AND ADULT CORRECTIONAL AGENCY
2.8% ($678.3)
HEALTH AND WELFARE 29.2% ($6,956.3)
b Other Revenues: liquor Taxes and Fees.. 0.70/0 Horseracing fees. O.bO/o Cigarette Tax 1.30/0 All Other ..... 6.4%
1$166.21 :$142.21 1$278.01
1$1.402.01
C Other Expenditures: Resvurces....... 2.0% ($487.0) State and Consumer Services .... 1.1% ($254.0) All Other 4.9% ($1,159.11
2:
GENERAL FUND REVENUES
$19,062.4· 100% 299.4 (transfers)
$19,361.8 (Total Income)
INHERITANCE AND GIfT TAXES 3.0% ($568.8) \
OTHERb 6.4% ($1,240~
SALESTAX--38.0% ($7,240.0)
\ BANK AND
CORPORATION TAXES 14.3% ($2,723.0 I
Chart 2 General Fund Budget Picture
1980-81 (in millions)
PERSONAL INCOME TAX 35.7% ($6.800.0)
~INSURANCE TAX 2.6% ($490.0)
PROPERTY TAX RELIEF 6.4% ($1,323.2)
HIGHER EDUCATION 14.4% 1$2.996.5) -------
GENERAL FUND EXPENDITURES
$20,748.4 100"10
EDUCATION / K through 12
35.2% ($7,315.6)
YOUTH AND ADULT CORRECTIONAL AGENCY
3.3% ($675.3)
HEALTH AND WELFARE 33.4% 1 $6,926.2 I
a Based on budget as submitted, includes $77.8 million in propost>d tidt'ldnd~ oil rt>VE;'nut'", whit'h
requires legislation.
b Other Revenues Include: liquor Taxes and Fees ... 0.8% ($152.0) Horseracing Fees ........... 0.6% ($122.3 )
C ()ther Expenditures Include: Resources ............................ . State and Consumer Services Business and Transportation
1.5"10 ($303.7) 0.9"10 ($198.4) 0.3"10 ($ 56.3) 4.6"10 ($953.2)
Cigarette Tax.. 1.0% 1$195.0) All Other ......................... 4.0% 1$771.3) All Other

Revenue Shortfall
Comparing revenues and expenditures from state sources (General Fund and special funds), it is obvious that the state would spend $1.5 billion more than it will receive in 1980-81 if the Governor's Budget is approved. Looking only at General Fund revenues and expenditures, the shortfall, or annual deficit, is estimated to be $1,322 million in 1980-81. This would be the highest annual deficit in the state's history. It is possible to incur such a deficit only because a surplus of $1,835 million is available from prior fiscal years. After financing the proposed annual deficit in 1980-81, the year-end surplus on June 30, 1981 is estimated to be $513 million.
Prediction or Plan? It should be noted that the budget estimates of both expenditures and
revenues are not predictions of what ultimately will happen, although these estimates reflect countless predictions about expenditure rates, tax payments, and other factors that are in part outside of the state's control. Rather, these estimates reflect the Governors fiscal plan-that is, what he thinks revenues and expenditures ought to be, given all of those factors that the state cannot control. It is certain that, between now and June 30, 1981, expenditures and revenues will be revised by the Governor, the Legislature, changing economic conditions, changes in the behavior of individuals and firms, and many other factors. Thus, actual revenues and expenditures are likely to be different from the estimates contained in the Governor's Budget.
Proposition 4
Proposition 4, which was approved by the voters on November 6, 1979, becomes effective on the first day of fiscal year 1980-81. The proposition places constitutional limits on the appropriation authority of both the state and local governments.
The Governor's Budget estimates the state's 1980-81 appropriations limit to be $16,760 million, which is $789 million higher than projected appropriations subject to limitation ($15,971 million).
In arriving at this conclusion, the budget makes several key assumptions about how various terms and provisions of the proposition will be interpreted. Our analysis of the 1980-81 Governor's Budget employs different assumptions in estimating the impact of Proposition 4 on the state. We have calculated the state's 1980-81 limit at $10,156 million, and 1980-81 appropriations subject to limitation at $9,697 million. Under these assumptions, the state's appropriations limit would be $459 million higher than projected appropriations subject to limitation.
The difference between the two estimates of the state's limit results primarily from different assumptions regarding how state subventions to local governments will be treated. This difference is discussed further in Section II, Part F (see page A-25).
A-4
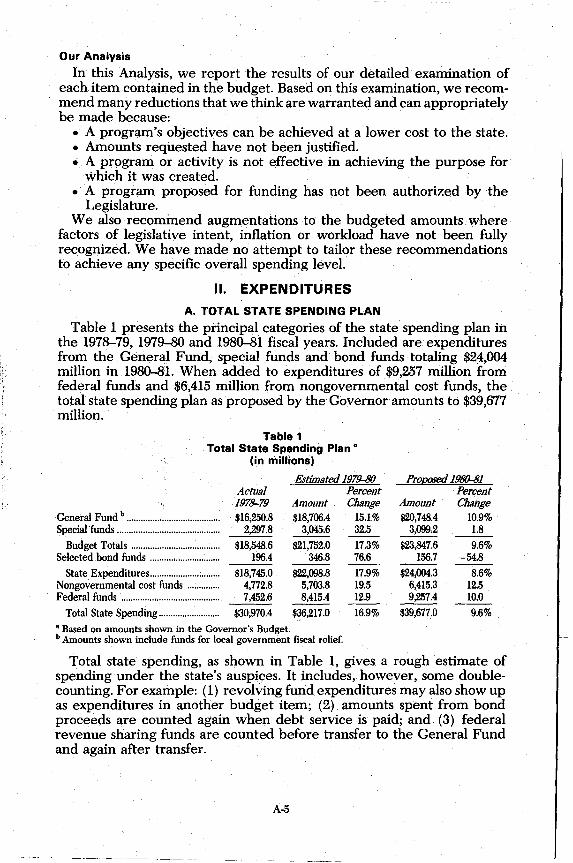
Our Analysis
In this Analysis, we report the results of our detailed examination of each item contained in the budget. Based on this examination, we recommend many reductions that we think are warranted and can appropriately be made because:
• A program's objectives can be achieved at a lower cost to the state. • Amounts requested have not been justified. • A program or activity is not effective in achieving the purpose for
which it was created. • A program proposed for funding has not been authorized by the
Legislature. We also recommend augmentations to the budgeted amounts where
factors of legislative intent, inflation or workload have not been fully recognized. We have made no attempt to tailor these recommendations to achieve any specific overall spending level.
II. EXPENDITURES
A. TOTAL STATE SPENDING PLAN
Table 1 presents the principal categories of the state spending plan in the 1978-79, 1979-80 and 1980-81 fiscal years. Included are expenditures from the General Fund, special funds and bond funds totaling $24,004 million in 1980-81. When added to expenditures of $9,257 million from federal funds and $6,415 million from nongovernmental cost funds, the total state spending plan as proposed by the Governor amounts to $39,677 million.
Table 1 Total State Spending Plan·
(in millions)
Estimated 1979-80
General Fund b ....................................... .
Special funds ........................................... .
Budget Totals ...................................... . Selected bond funds ............................. .
State Expenditures ............................. . Nongovernmental cost funds ............. . Federal funds ......................................... .
Total State Spending ......................... .
Actual 1978-79 $16,250.8
2,2~7.8
$18,548.6 196.4
$18,745.0 4,772.8 7,452.6
$30,970.4
Amount $18,706.4
3,045.6
$21,752.0 346.8
$22,098.8 5,703.8 8,415.4
~6,217.0
• Based on amounts shown in the Governor's Budget. b Amounts shown include funds for local government fiscal relief.
Percent Change
15.1% 32.5 17.3% 76.6 17.9% 19.5 12.9
16.9%
Proposed 1980-81
Amount $20,748.4
3,099.2
$23,847.6 156.7
$24,004.3 6,415.3 9,257.4
$39,677.0
Percent Change
10.9% 1.8 9.6%
-54.8 8.6%
12.5 10:0 9.6%
Total state spending, as shown in Table 1, gives a rough estimate of spending under the state's auspices. It includes, however, some doublecounting. For example: (1) revolving fund expenditures may also show up as expenditures in an()ther budget item; (2) amounts spent from bond proceeds are counted again when debt service is paid; and (3) federal revenue sharing funds are counted before transfer to the General Fund and again after transfer.
A-5
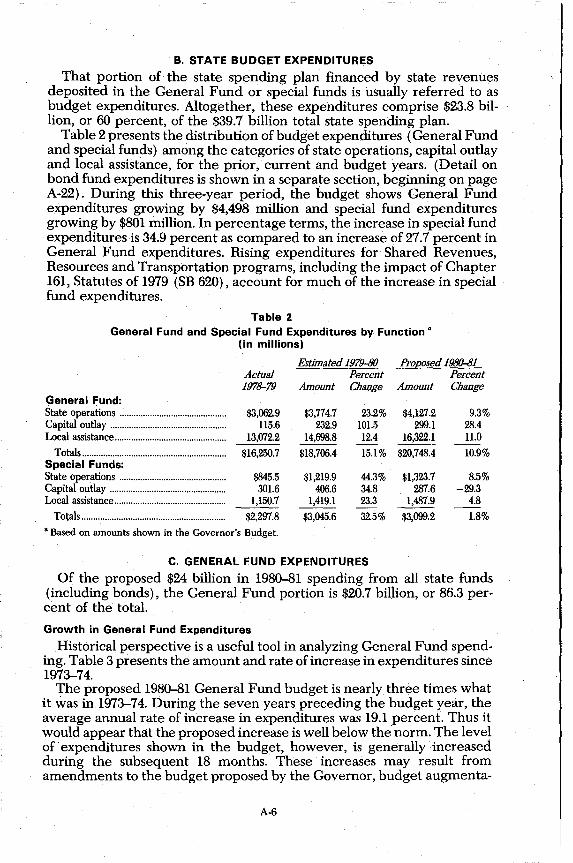
B. STATE BUDGET EXPENDITURES
That portion of the state spending plan financed by state revenues deposited in the General Fund or special funds is usually referred to as budget expenditures. Altogether, these expenditures comprise $23.8 billion, or 60 percent, of the $39.7 billion total state spending plan.
Table 2 presents the distribution of budget expenditures (General Fund and special funds) among the categories of state operations, capital outlay and local assistance, for the prior, current and budget years. (Detail on bond fund expenditures is shown in a separate section, beginning on page A-22). During this three-year period, the budget shows General Fund expenditures growing by $4,498 million and special fund expenditures growing by $801 million. In percentage terms, the increase in special fund expenditures is 34.9 percent as compared to an increase of 27.7 percent in General Fund expenditures. Rising expenditures for Shared Revenues, Resources and Transportation programs, including the impact of Chapter 161, Statutes of 1979 (SB 620), account for much of the increase in special fund expenditures.
Table 2 General Fund and Special Fund Expenditures by Function a
(in millions)
General Fund: State operations ............................................. . Capital outlay ................................................. . Local assistance .............................................. ..
Totals ............................................................ .. Special Funds: State operations ............................................ .. Capital outlay ................................................. . Local assistance ............................................... .
Totals ............................................................. .
Actual 197~79
$3,062.9 115.6
13,072.2
$16,250.7
$845.5 301.6
1,150.7
$2,297.8
a Based on amounts shown in the Governor's Budget.
Estimated 1979-80
Amount
$3,774.7 232.9
14,698.8
$18,706.4
$1,219.9 406.6
1,419.1
$3,045.6
Percent Change
23.2% 101.5 12.4
15.1%
44.3% 34.8 23.3
32.5%
C. GENERAL FUND EXPENDITURES
Proposed 1980-81 Percent
Amount Change
$4,127.2 9.3% 299.1 28.4
16,322.1 11.0
$20,748.4 10.9%
$1,323.7 8.5% 287.6 -29.3
1,487.9 4.8
$3,099.2 1.8%
Of the proposed $24 billion in 1980-81 spending from all state funds (including bonds), the General Fund portion is $20.7 billion, or 86.3 percent of the total.
Growth in General Fund Expenditures
Historical perspective is a useful tool in analyzing General Fund spending. Table 3 presents the amount and rate of increase in expenditures since 1973-74.
The proposed 1980-81 General Fund budget is nearly three times what it was in 1973-74. During the seven years preceding the budget year, the average annual rate of increase in expenditures was 19.1 percent. Thus it would appear that the proposed increase is well below the norm. The level of expenditures shown in the budget, however, is generally increased during the subsequent 18 months. These increases may result from amendments to the budget proposed by the Governor, budget augmenta-
A-6
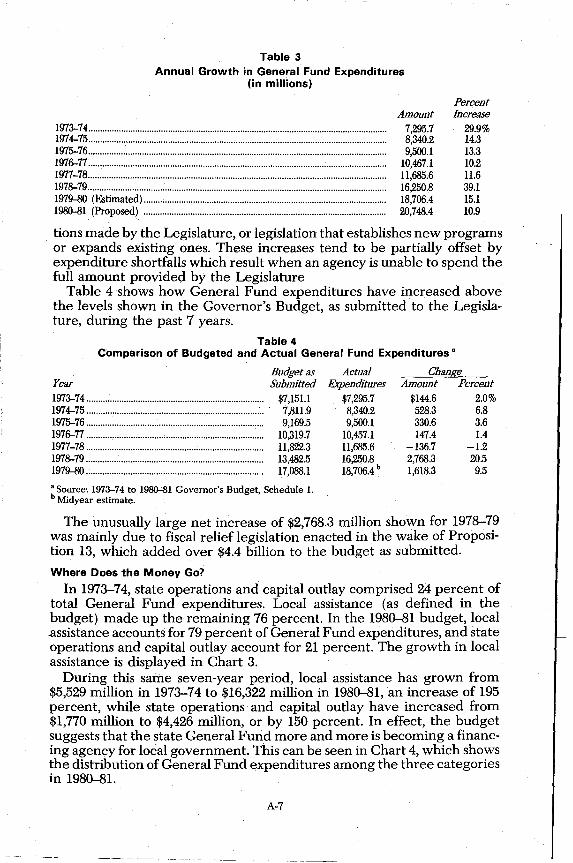
Table 3 Annual Growth in General Fund Expenditures
(in millions)
1973-74 ............................................................................................................................... . 1974-75 .............................................................................................................................. .. 1975-76 .............................................................................................................................. .. 1976-77 .............................................................................................................................. .. 1977-78 ..... ~ ........................................................................................................................ .. 1978-79 .............................................................................................................................. .. 1979-80 (Estimated) ...................................................................................................... .. 1980-81 (Proposed) ...................................................................................................... ..
Percent Amount Increase
7,295.7 8,340.2 9,500.1
10,467.1 11,685.6 16,250.8 18,706.4 20,748.4
29.9% 14.3 13.3 10.2 11.6 39.1 15.1 10.9
tions made by the Legislature, or legislation that establishes new programs . or expands existing ones. These increases tend to be partially offset by
expenditure shortfalls which result when an agency is unable to spend the full amount provided by the Legislature
Table 4 shows how General Fund expenditures have increased above the levels shown in the Governor's Budget, as submitted to the Legislature, during the past 7 years.
Table 4 Comparison of Budgeted and Actual General Fund Expenditures a
Year 1973-74 .......................................................................... .. 1974-75 ............................................................................ . 1975-76 ........................................................................... . 1976-77 ........................................................................... . 1977-78 ........................................................................... . 1978-79 .......................................................................... .. 1979-80 .......................................................................... ..
Budget as Submitted
$7,151.1 7,811.9 9,169.5
10,319.7 11,822.3 13,482.5 17,088.1
a Source: 1973-74 to 1980-81 Governor's Budget, Schedule 1. b Midyear estimate.
Actual Expenditures
$7,295.7 8,340.2 9,500.1
10,457.1 11,685.6 16,250.8 b
18,706.4
Change Amount Percent
$144.6 2.0% 528.3 6.8 330.6 3.6 147.4 1.4
-136.7 -1.2 2,768.3 20.5 1,618.3 9.5
The unusually large net increase of $2,768.3 million shown for 1978-79 was mainly due to fiscal relief legislation enacted in the wake of Proposition 13, which added over $4.4 billion to the budget as submitted.
Where Does the Money Go?
In 1973-74, state operations and capital outlay comprised 24 percent of total General Fund expenditures. Local assistance (as defined in the budget) made up the remaining 76 percent. In the 1980-81 budget, local assistance accounts for 79 percent of General Fund expenditures, and state operations and capital outlay account for 21 percent. The growth in local assistance is displayed in Chart 3.
During this same seven-year period, local assistance has grown from $5,529 million in 1973-74 to $16,322 million in 1980-81, an increase of 195 percent, while state operations and capital outlay have increased from $1,770 million to $4,426 million, or by 150 percent. In effect, the budget suggests that the state General Fund more and more is becoming a financing agency for local government, This can be seen in Chart 4, which shows the distribution of General Fund expenditures among the three categories in 1980-81.
A-7

~ ~
Billions of
Dollars
$21
20
19
18
17
16
lS
14
13
12
11
10
9
8
7
6
S
4
3
2
1
Chart 3 General Fund Budget Structure
1973-74 to 1980-81 (in billions)
Local Assistance
Capital Outlay
1973-74 1974-75 1975-76 1976-77 1977-78 1978-79 1979-80 1980-81 (&tinuled) (ProP,osed)
. A-8

Chart 4 1980":'81 General Fund Budget Structure
(Based on Budget as Submitted)
State Operations $4,127.2
19.9%
Capital Outlay $299.1 1.4%
(in millions)
Total Expenditures $20,748.4
100%
Local Assistance Versus Aid to Local Governments
Local Assistance $16,322.1
78.7%
The categorization of expenditures in the budget, however, is somewhat misleading. This is because local assistance, as defined in the budget, encompasses programs more appropriately categorized as state operations. These programs, such as the Medical Assistance (Medi-Cal) program, do not provide assistance to local government agencies. Rather, they provide assistance to individuals, either directly or through various intermediaries. Table 5 lists the major programs that our analysis indicates are usually categorized as local assistance that do not provide aid to local governments, and the amounts to be expended for each in 1980-81.
By adjusting the distribution of expenditures among categories to reflect the true nature of these programs, it is possible to more accurately compare the growth in state assistance to local governments with the growth in state operated programs. On this basis, assistance to local governments has actually increased 185 percent since 1973-74, rather than 195 percent as the budget implies. State operated programs have increased 182 percent since 1973-74, as opposed to the 150 percent arrived at using the traditional budget categories. In other words, the proportion of the General Fund budget expended for assistance to local governments has actually remained quite stable over this seven-year period, increasing from 54.2 percent in 1973-74 to 54.5 percent in 1980-81.
A-9

Table 5 Programs Categorized as Local Assistance
That do not Provide Aid to Local Governments (in millions)
Salaries of Superior Court Judges ....................................................................................................... . Contributions to Judges Retirement Fund ...................................................................................... .. Medical Assistance Program .............................................................................................................. .. Developmental Services ...................................................................................................................... .. Mental Health (state hospital portion) ............................................................................................ .. SSI/SSP .................................................................................................................................................... .. Contribution to State Teacher's Retirement Fund ...................................................................... .. Senior Citizens Tax Assistance .......................................................................................................... .. Senior Citizens Renter's Tax Relief .................................................................................................. .. Renter's Tax Relief.. .............................................................................................................................. ..
Total ...................................................................................................................................................... ..
Controlling Expenditures Through the Budget Process
1980-81 $28.0 10.9
2,341.5 471.2 184.5
1,310.3 171.6 27.0 48.0
418.0
$5,011.0
A large portion of the budget is not easily controllable through the budget process because funding for many programs is provided by statute, rather than by the Budget Bill. As Table 6 shows, expenditures of only $8.5 billion, or 41 percent, of the $20.7 billion in total General Fund expenditures are authorized in the Budget Bill. A larger amount of expenditures$9.6 billion (or 46 percent), although included in the Budget Bill, is really authorized by statute. Finally, $2.6 billion, or 12.6 percent of total General Fund expenditures, does not even appear in the Budget Bill.
Table 6 1980-81 General Fund Expenditures in Budget Bill
(in millions)
Percent Amount of Total
Expenditures in the 1980-81 Budget Bill: Statutory authorizations also included in the Budget Bill:
Education, K-12 .................................................................................................... .. $6,949.8 33.5% Department of Social Services .......................................................................... .. 1,415.6 6.8 Board of Govemor's-Community Colleges .................................................. .. 0.8 Tax Relief.. .............................................................................................................. .. 1,242.7 6.0 Legislature .............................................................................................................. .. 3.5
Total, Statutory Authorizations .................................................................... .. $9,612.4 46.3% Expenditures authorized in the Budget Bill .................................................... .. 8,523.2 41.1
Total, Expenditures in the Budget Bill ...................................................... .. $18,135.6 87.4 Expenditures Not in the Budget Bill .................................................................. .. 2,612.8 12.6
Total, Expenditures ........................................................................ , .................. . $20,748.4 100.0%
D. SUMMARY OF MAJOR PROGRAM CHANGES
The State Budget has become increasingly dominated by programs in the areas of health, welfare, and education. Approximately 83 percent of proposed General Fund expenditures in the 1980-81 budget are for these so-called "people programs." Chart 5 illustrates the growth in General Fund expenditures in these categories since 1973-74.
Not surprisingly, major program increases in the budget year are proposed in the health, welfare and education categories. In part, this is because existing law requires that spending for some 16 programs in these
A-lO
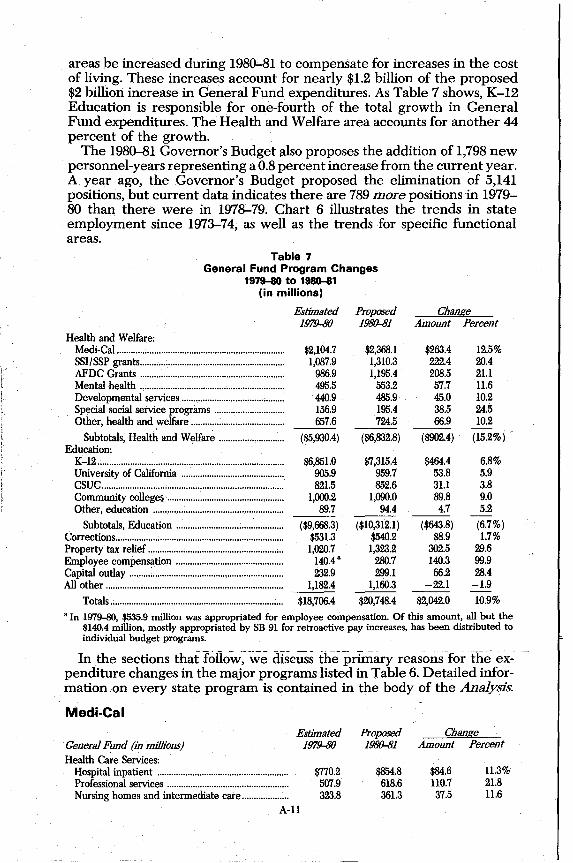
areas be increased during 1980-81 to compensate for increases in the cost of living. These increases account for nearly $1.2 billion of the proposed $2 billion increase in General Fund expenditures. As Table 7 shows, K-12 Education is responsible for one-fourth of the total growth in General Fund expenditures. The Health and Welfare area accounts for another 44 percent of the growth.
The 1980-81 Governor's Budget /llso proposes the addition of 1,798 new personnel-years representing a 0.8 percent increase from the current year. A year ago, the Governor's Budget proposed the elimination of 5,141 positions, but current data indicates there are 789 more positions in 1979-80 than there were in 1978-79. Chart 6 illustrates the trends in state employment since 1973-74, as well as the trends for specific functional areas.
Table 7 General Fund Program Changes
1979-80 to 1980-81 (in millions)
Health and Welfare: Medi-Cal ....................................................................... . SSI/SSP grants ....... , ..................................................... . AFDC Grants ............................................................. . Mental health ............................................................. . Developmental services ........................................... . Special social service programs ....................... ~ .... .. Other, health and welfare ...................................... ..
Subtotals, Health and Welfare .......................... .. Education:
K-12 .............................................................................. .. University of California .......................................... .. CSUC ............................................................................ .. Community colleges ................................................. .. Other, education ....................................................... .
Subtotals, Education ............................................ .. Corrections ....................................................................... . Property' tax relief ........................................................ .. Employee compensation ............................................. . Capital outlay ......... : ...................................................... .. All other .......................................................................... ..
Totals ........................................................................ ..
Estimated 1979-80
$2,104.7 1,087.9
986.9 495.5 440.9 156.9 657.6
($5,930.4)
$6,851.0 905.9 821.5
1,000.2 89.7
($9,668.3) $531.3 1,020.7
. 140.4" 232.9
1,182.4
$18,706.4
Proposed 1980-81
$2,368.1 1,310.3 1,195.4
553.2 485.9 195.4 724.5
($6,832.8)
$7,315.4 959.7 852.6
1,090.0 94.4
($10,312.1) $540.2 1,323.2
280.7 299.1
1,160.3
$20,748.4
Change Amount Percent
$263.4 12.5% 222.4 20.4 208.5 21.1 57.7 11.6 45.0 10.2 38.5 24.5 66.9 10.2 ---
($902.4) (15.2%)
$464.4 6.8% 53.8 5.9 31.1 3.8 89.8 9.0 4.7 5.2 --- -
($643.8) (6.7%) $8.9 1.7%
302.5 29.6 140.3 99.9 66.2 28.4
-22.1 -1.9 ---$2,042.0 10.9%
"In 1979-80, $535.9 million was appropriated for employee compensation. Of this amount, all but the $140.4 million, mostly appropriated by SB 91 for retroactive pay increases, has been distributed to individual budget programs.
In the sections thatfoI1ow~we dIscUSs the prImary reasond'or-fheex':--penditure changes in the major programs listed in Table 6. Detailed information on every state program is contained in the body of the Analysis.
Medi-Cal
General Fund (in millions) Health Cru-e Services:
Hospital inpatient ...................................................... .. Professional services .................................................. .. Nursing homes and intermediate care .................. ..
Estimated 1979-80
$770.2 507.9 323.8
A-ll
Proposed 1980-81
$854.8 618.6 361.3
Change Amount Percent
$84.6 11.3% 110.7 21.8 37.5 11.6

Billions of
Dollars
$8
7
6
5
4
3
2
1973-74 1974-75
Chart 5 General Fund Expenditures
By Major Program Categories 1973-74 to 1980-81
(in billions)
All Other
1975-76 1976-77 1977-78
",-? ", /
?/ / /
// / / //
// // /
)I
__ e
"",.---,,-
,,-"
1978-79 1979-80 1980-81 (Estimated) (proposed)
arotals for Health and Welfare include the Youth and Adult Correctional Agency which is being proposed as a separate entity for 1980-81.
A-12

State Employees
220,000
210,000
200,000
190,000
100,000
90,000
80,000
70,000
60,000
50,000
40,000
30,000
20,000
10,000
Chart 6 State Employees (Personnel-Years)
1973-74 to 1980-81
Total ...... ---~ ..... ---- ... ------..
Education .• __ -----_ .... ____ ..... ____ -e
Health and Welfare h __ ---......... ----1 ... -- --....e----- ...
-~ ..... ---.• ------- . Business and Transportation
e---""':" ......... ----4.~"""':'--.e--:-::_--e.----... .a... _____ .-- - - - ... State and Consumer Services, and Resources
:=~=~;::.===~.~:..:.:.=::.: •. ;.:::...~:.:.:~j • .:.:..---... - - - - ..... - - - - ..... • • ... __ - ......... ---......... ---... ~---•• ----... ____ ..... ____ -e
General Government'
1973-74 1974-75 1975-76 1976-77 1977--78 1978-79 1979-80 1980-81 (Estimated) (Proposed)
Fiscal Year
a. Approximately 97 percent of these personnel-years involve University of California or California State University and Colleges positions.
h. Totals for Health and Welfare include the Youth and Adult Correctional Agency which is currently being established.
C The Department of Industrial Relations, State Board of Control, Compensation Insurance Fund and the Department of Food and Agriculture have been included in General Government for all years, even though they were under what is now State and Consumer Services prior to the 1978-79 fiscal year.
A-13

Prescription drugs ....................................................... . Dental services ............................................................. . Other health care services ......................................... .
Subtotal, Health Care Services ............................. . Other Medi-Cal costs ..................................................... . Provider rate increase ................................................... .
Totals ........................................................................... .
94.7 67.7
194.2
($1,958.5) 146.2
$2,104.7
104.2 77.9
124.5
($2,141.3) 146.4 80.4
$2,368.1
9.5 10.2
-69.7
$182.8 0.2
80.4
$263.4
10.0 15.1
-35.9
9.3 0.1
N/A 12.5%
The state's share of costs under the California Medical Assistance program, commonly referred to as Medi-Cal, is estimated at $2,368.1 million in 1980-81, which is a $263.4 million, or 12.5 percent, increase over the current year. The total cost of the program, including the federal government's share, is estimated at $4.2 billion, an increase of $528.5 million, or 14.2 percent, over 1979-80. This rise is primarily due to the higher cost of health care services. Inpatient hospital care, the single largest Medi-Cal component of health care services, is slated to increase 11 percent in 1980-81, and other medical care providers are scheduled to receive an increase for cost of living averaging 9 percent.
Average Monthly Medi-Cal Caseload
Estimated Proposed Change 1979,-80 1980-81 Number Percent
Public assistance .......................................................... 2,167,500 2,178,400 10,900 0.5% Medically needy .......................................................... 349,850 374,700 24,850 7.1 Medically indigent ...................................................... 378,700 401,300 22,600 6.0
Totals .......................................................................... 2,896.050 2,954,400 58,350 2.0%
A projected increase in case load accounts for approximately $49 million of the $263.4 million increase in Medi-Cal General Fund expenditures. The public assistance category is expected to increase 0.5 percent, while the medically needy and medically indigent categories will rise 7.1 percent and 6.0 percent, respectively. The health costs of most recipients in the medically indigent category are fully funded by the state.
Department of Social Services
General Fund (in millions) SSI/SSP grants ................................................................. . AFDC grants ................................................................... . Special social service programs ................................... . County administration ..................................... : ............. . All other (including support) ..................................... .
Totals ............................................................................. .
Estimated 1979-80 $1,087.9
986.9 156.9 95.4 51.6
$2,378.7
Proposed 1980-81 $1,310.3 1,195.4
195.4 101.1 56.1
$2,858.3
Change Amount Percent
$222.4 20.4% 208.5 21.1 38.5 24.5 5.7 6.0 4.5 8.7
$479.6 20.2%
Total 1980-81 General Fund expenditures for the Department of Social Services are proposed at $2,858.3 million, a $479.6 million, or 20.2 percent, increase. Cash payments under SSIISSP and AFDC, the state's major welfare programs, are estimated at $1,310.3 million and $1,195.4 million, respectively. Total costs from all funds in 1980-81 are proposed at $5,164 million, an increase of $875 million, or 20.4 percent.
Cost-of-living increases provided to AFDC and SSIISSP recipients will total $511.3 million from General Fund. Of this amount, $172.1 million is for AFDC and $338.9 million is for SSIISSP. Total expenditures under the
A-14
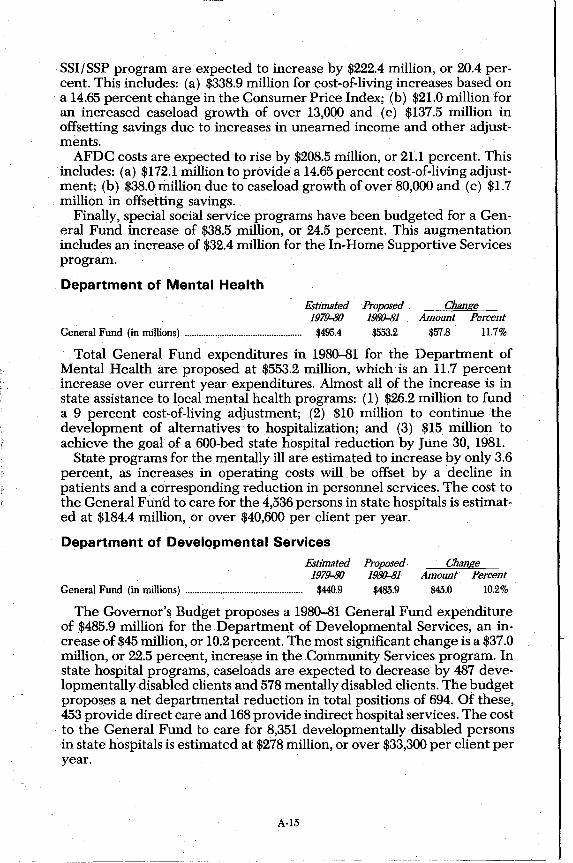
SSI/ SSP program are expected to increase by $222.4 million, or 20.4 percent. This includes: (a) $338.9 million for cost-of-living increases based on a 14.65 percent change in the Consumer Price Index; (b) $21.0 million for an increased caseload growth of over 13,000 and (c) $137.5 million in offsetting savings due to increases in unearned income and other adjustments.
AFDC costs are expected to rise by $208.5 million, or 21.1 percent. This includes: (a) $172.1 million to provide a 14.65 percent cost-of-living adjustment; (b) $38.0 million due to caseload growth of over 80,000 and (c) $1.7 million in offsetting savings.
Finally, special social service programs have been budgeted for a General Fund increase of $38.5 million, or 24.5 percent. This augmentation includes an increase of $32.4 million for the In-Home Supportive Services program.
Department of Mental Health Estimated Proposed Change
1979-80 1980-81 Amount Percent General Fund (in millions) .................................................. $495.4 $553.2 $57.8 11.7%
Total General Fund expenditures in 1980-81 for the Department of Mental Health are proposed at $553.2 million, which is an 11.7 percent increase over current year expenditures. Almost all of the increase is in state assistance to local mental health programs: (1) $26.2 million to fund a 9 percent cost-of-living adjustment; (2) $10 million to continue the development of alternatives to hospitalization; and (3) $15 million to achieve the goal of a 600-bed state hospital reduction by June 30, 1981.
State programs for the mentally ill are estimated to increase by only 3.6 percent, as increases in operating costs will be offset by a decline in patients and a c(jrresponding reduction in personnel services. The cost to the General Fund to care for the 4,536 persons in state hospitals is estimated at $184.4 million, or over $40,600 per client per year.
Department of Developmental Services Estimated
1979-80 General Fund (in millions) .................................................. $440.9
Proposed· 1980-81
$485.9
Change Amount Percent
$45.0 10.2%
The Governor's Budget proposes a 1980-81 General Fund expenditure of $485.9 million for the Department of Developmental Services, an increase of $45 million, or 10.2 percent. The most significant change is a $37.0 million, or 22.5 percent, increase in the Community Services program. In state hospital programs, caseloads are expected to decrease by 487 developmentally disabled clients and 578 mentally disabled clients. The budget proposes a net departmental reduction in total positions of 694. Of these, 453 provide direct care and 168 provide indirect hospital services. The cost to the General Fund to care for 8,351 developmentally disabled persons in state hospitals is estimated at $278 million, or over $33,300 per client per year.
A-15
K-12 Education
Estimated General Fund (in millions): 1979-80 Apportionments ............................................................ $5,772.4 All Other ........................................................................ 1,078.7
Totals .......................................................................... $6,851.0
Proposed 1980-81 $6,110.4 1,205.1
$7,315.4
Change Amount Percent
$338.0 5.9% 126.4 11.7
$464.4 6.8%
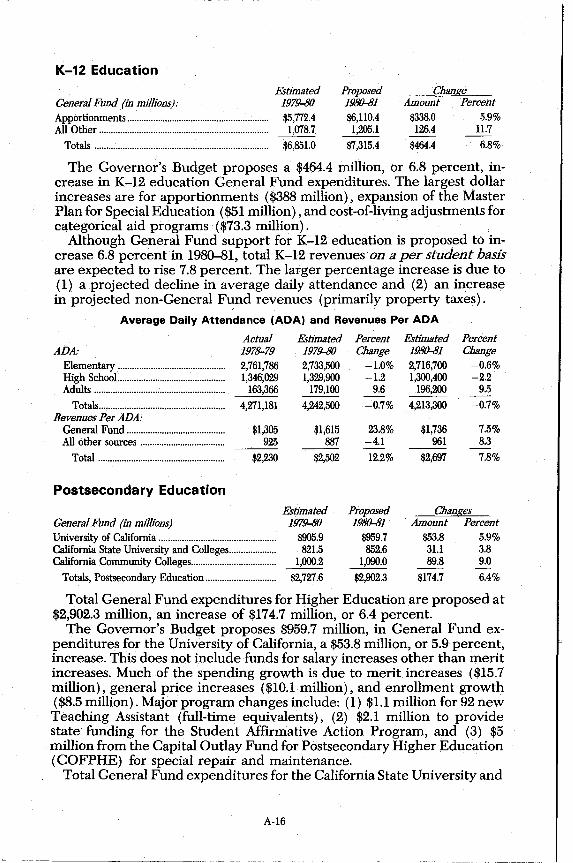
The Governor's Budget proposes a $464.4 million, or 6.8 percent, increase in K-12 education General Fund expenditures. The largest dollar increases are for apportionments ($388 million), expansion of the Master Plan for Special Education ($51 million), and cost-of-living adjustments for categorical aid programs ($73.3 million).
Although General Fund support for K-12 education is proposed to increase 6.8 percent in 1980-81, total K-12 revenues on a per student basis are expected to rise 7.8 percent. The larger percentage increase is due to (1) a projected decline in average daily attendance and (2) an increase in projected non-General Fund revenues (primarily property taxes).
Average Daily Attendance (ADA) and Revenues Per ADA
Actual ADA: 1978-79
Elementary .............................................. 2,761,786 High School .............................................. 1,346,029 Adults ........................................................ 163,366
Totals ...................................................... 4,271,181 Revenues Per ADA:
General Fund .......................................... $1,305 All other sources .................................... 925
Total ...................................................... $2,230
Postsecondary Education
General Fund (in millions) University of California ................................................. . California State University and Colleges ................... . California Community Colleges ................................... .
Totals, Postsecondary Education ............................. .
Estimated 1979-80 2,733,500 1,329,900
179,100
4,242,500
$1,615 887
$2,502
Estimated 1979-80
$905.9 821.5
1,000.2
$2,727.6
Percent Change
-1.0% -1.2
9.6 -0.7%
23.8% -4.1
12.2%
Pioposed 1980-81
$959.7 852.6
1,090.0
$2,902.3
Estimated Percent 1980-81 Change 2,716,700 -0.6% 1,300,400 -2.2
196,200 9.5
4,213,300 -0.7%
$1,736 7.5% 961 8.3
$2,697 7.8%
Changes Amount Percent
$53.8 5.9% 31.1 3.8 89.8 9.0
$174.7 6.4%
Total General Fund expenditures for Higher Education are proposed at $2,902.3 million, an increase of $174.7 million, or 6.4 percent.
The Governor's Budget proposes $959.7 million, in General Fund expenditures for the University of California, a $53.8 million, or 5.9 percent, increase. This does not include funds for salary increases other than merit increases. Much of the spending growth is due to merit increases ($15.7 million), general price increases ($10.1 million), and enrollment growth ($8.5 million). Major program changes include: (1) $l.1 million for 92 new Teaching Assistant (full-time equivalents), (2) $2.1 million to provide state funding for the Student Affirmative Action Program, and (3) $5 million from the Capital Outlay Fund for Postsecondary Higher Education (COFPHE) for special repair and maintenance.
Total General Fund expenditures for the California State University and
A-16

Colleges (CSUC) are proposed at $852.6 million, a $31.1 million, or 3.8 percent, increase over 1979--80, not including salary increase funding. Major augmentations include: (1) $3.6 million to enrich the student-faculty ratio and accommodate changes in student demand, (2) $2.4 million for enrollment growth of 1,400 student full-time equivalents, and (3) a $1.0 million increase in the Student Affirmative Action Program.
The Governor's Budget proposed General Fund expenditures for the California Community Colleges of $1,090.0 million, an increase of $89.8 million, or 9.0 percent. The increase in apportionments of $86.8 million is required by the formula contained in AB 8 (Chapter 282/1979). An increase of $2.7 million is proposed to increase Extended Opportunity Programs and Services (EOPS) aid to disadvantaged students.
Enrollment (Full-time Equivalents)
Eshmated 1979-80 Actual 1978-79
University of California: General campuses .............................. 107,710 Health sciences .................................... 11,918
Totals .................................................. 119,628 CSUC ..................... ; ............ : ...................... 229,371 California Community Colleges (ex-
pressed in ADA) ............................ 634,895
Department of Corrections
Number
107,136 12,405
119,541 229,350
697,000
Estimated 1979-80
General Fund (in millions) .......................................... $302.5
Percent Change
-0.53% 4.09
-0.07 -0.01
9.78
Proposed 1980-81
$328.3
Estimated 1980-81 Percent
Number Change
108,773 1.5% 12,716 2.4
121,489 1.6 230,750 0.6
715,000 2.6
Change Amount Percent
$25.88.5
The Governor's budget proposes a General Fund expenditure increase of $25.8 million, or 8.5 percent, for the Department of Corrections. Over $14.4 million of the growth in expenditures is intended to increase the bed capacity. The average number of persons in the state's prisons is expected to rise from 23,760 in the current year to 25,040 in 1980--81, a 5.4 per~ent increase. The budget also proposes $5.6 million for increased workers' compensation cost, and $1.4 million for increased security. The average incarceration costs to the General Fund per prisoner is estimated at $11,178 per year.
Tax Relief
General Fund (in millions) Senior citizens' property tax assistance ................ .. Senior citizens' property tax deferral .................. .. Senior citizens' renters' tax relief.. ........................ .. Personal property tax relief .................................... .. Homeowners' property tax relief .......................... .. Open space .................................................................. .. Subventions for tax losses ........................................ .. Renters' tax relief ...................................................... .. Substandard Housing ................................................ ..
Totals ......................................................................... .
Estimated 1979-80
$24.5 4.2
44.0 210.6 338.0
14.0 2.3
383.0 0.1
$1,020.7
A-17
Proposed 1980-81
$27.0 4.5
48.0 466.8 344.0
14.0 0.8
418.0 0.1
$1,323.2
Change Amount Percent
$2.5 10.2% 0.3 7.1 4.0 9.1
256.2 121.7 6.0 1.8
-1.5 -65.2 35.0 9.1
$302.5 29.6%

The passage of Proposition 13 cut state tax relief expenditures almost in half, from $1.5 billion in 1977-78 to $778 million in 1978-79. In 1978, legislative changes in the senior citizens' assistance programs increased tax relief cost. In 1979, further increases were enacted. The renters' credit was increased from $37 per qualified renter to $60 for single renters and $137 for married couples. The change in the renters' credit will increase tax relief costs for both the current and budget years. Also in 1979, legislation was adopted which increased the business inventory exemption from 50 percent to 100 percent. .
Proposed expenditures for tax relief programs for 1980-81 total $1,323.2 million, an increase of $302.5 million, or 29.6 percent, over 1979-80. The complete exemption of business inventories results in an increase of $256.2 million, or 121.7 percent, in personal property tax relief. This represents 85 percent of the growth in total tax relief expenditures from 1979-80 to 1980-81.
Employee Compensation
(in miUions) General Fund ........................................ .. Special funds .......................................... .. Nongovernmental cost funds ............ ..
Totals .................................................. ..
Actual 197~79
$45.1 8.6 1.7
$55.4
Estimated 1979-80
$535.9 130.8 167.9
$834.6 8
a. Includes $207.6 million for SB 91 retroactive salary increases.
Proposed 1980-81
$280.7 70.8 75.7
$427.2
Change Amount Percent $-255.2 '--47.6%
-60.0 -45.9 -92.2 -54.9
$-407.4 -48.8%
In 1978-79, no cost-of-living salary increase was provided for most state employees. The increase in compensation in 197~79, $55.4 million, represents the cost of increased health benefits ($30 million), judicial salary increases ($1.6 million) and increased employer retirement contributions.
The Governor's Budget for 1979-80 did not include funds for compensation increases for any state employees other than $1.7 million for judges. The Legislature augmented the budget by $625.3 million to provide for: (1) an average salary increase of 15 percent for most state employees, (2) a 20.6 percent salary increase for highway patrolmen, and (3) maintenance of the present state contribution ratio whereby the state pays 100 percent of the health insurance premium cost for its employees and 90 percent of the premium cost for the employees' dependents. The Governor reduced the augmentation by $227.7 million but his veto was overridden by the Legislature.
SB 91 (Chapter 192, Statutes of 1979) provided a lump-sum payment to all state employees as of July 2, 1979, equal to the compensation the employee would have received had a 7 percent increase been approved effective October 1, 1978. The act appropriated $207.6 million ($134.5 million General fund, $30.8 million special funds, and $42.3 million in nongovernmental cost funds) to finance the lump sum payments. These payments are the subject of litigation. The $207.6 million is part of the $834.6 million cost of employee compensation increases shown for 1979-80.
A-I8

The 1980-81 Governor's Budget contains $427.2 million for state em-] ployees compensation increases, including $280.7 million from the General Fund. This amount is sufficient to provide an average increase of 9 percent. The distribution of these· funds has not been specified.
Capital Outlay
Change (in miUions)
Estimated 1979-80
$232.9 406.6
Proposed 1980-81
$299.1 287.6
Amount Percent General Fund ........................................................... . $66.2 $28.4 % Special fUnds ............................................................. . -119.0 -29.3
Totals ....................................................................... . $639.5 $586.7 $-52.8 -8.3%
Major Capital Outlay Programs: 1980-81
General Fund Special Funds Department of Corrections ..................... . Department of Developmental Services Department of General Services ........... . Department of Mental Health ............... . All other ....................................................... .
Total ........................................................... .
$133.1 70.4 47.8 21.9 25.9
$299.1
Department of Transportation ........... . Department of Water Resources ....... . Higher Education ................................. . Legislature ............................................... . All other ................................................... .
Total ..................................................... .
$155.0 28.3 42.4 21.0 40.9
$287.6
General Fund capital outlay expenditures of $299.1 million are proposed fer 1980-81, a $66.2 million, or 28.4 percent, increase. Of the total, 45 percent, or $133.1 million, is designated for new prison facilities, while $70.4 million and $47.8 million are proposed for state hospital projects and state office buildings, respectively. Over one-half of the special fund capital outlay expenditures ($155 million) is for the Highway Transportation program.
The 8.3 percent decline in total capital outlay expenditures that the budget projects in 1980-81 is unlikely to occur. The 1979-80 estimates of special fund capitw. outlay expenditures are probably too high because the budget assumes th~t projects will proceed at a faster rate than is realistic.
State-Mandated Local Programs Actual Estimated Proposed Change 1978-79 1979-80 1980-81 Amount Percent
General Fund (in millions) ........................................ $54.3 $101.2 $226.3 $125.1 123.6%
In 1972, the Legislature enacted Chapter 1406 (SB 90) which required the state to reimburse local government for the cost of any state-mandated programs. Since that time, disclaimers have been included in certain bills exempting them from the provisions of SB 90. However, Article XIII B of the Constitution, as approved by the voters in November 1979, elevated the reimbursement of state mandates from a statutory to a constitutional requirement. It also limits the validity of disclaimers.
The cost of state-mandated local programs has risen significantly in recent years. In 1973-74, reimbursements totalled $3 million. These reimbursements are expected to reach $226.3 million in 1980-81, an increase of $125.1 million, or 123.6 percent, over the current year level. Board of Control awards on SB 90 claims relating to recent statutes account for most of this increase, as shown below.
A-19
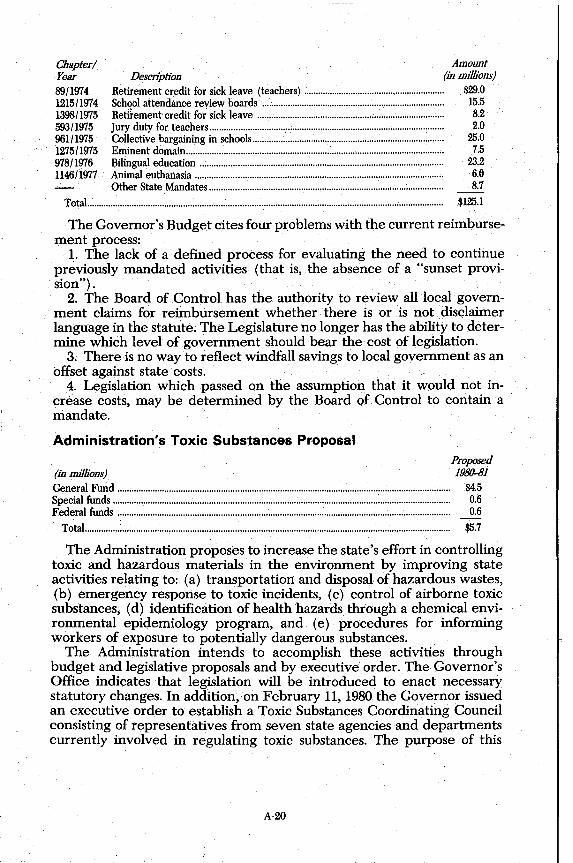
Chapter! Year 89/1974 1215/1974 1398/1975 593/1975 961/1975 1275/1975 978/1976 1146/1977
Amount Description (in millions)
Retirement credit for sick leave (teachers) ............................................................ $29.0 School attendance review boards .............................................................................. 15.5 Retirement credit for sick leave ................................................................................ 8.2 Jury duty for teachers .................................................................................................... 2.0 Collective bargaining in schools... ...................................................... ................ ......... 25.0 Eminent domain.............................................................................................................. 7.5 Bilingual education ........................................................................................................ 23.2 Animal euthanasia .......................................................................................................... 6.0 Other State Mandates .................................................................................................... 8.7
Total........................................................................................................................................................ $125.1
The Governor's Budget cites four problems with the current reimbursement process:
1. The lack of a defined process for evaluating the need to continue previously mandated activities (that is, the absence of a "sunset provision") .
2. The Board of Control has the authority to review all local government claims for reimbursement whether there is or is not disclaimer language in the statute. The Legislature no longer has the ability to determine which level of government should bear the cost of legislation.
3; There is no way to reflect windfall savings to local government as an offset against state costs.
4. Legislation which passed on the assumption that it would not increase costs, may be determined by the Board of Control to contain a mandate.
Administration's Toxic Substances Proposal
(in milUons) General Fund ............................................................................................................................................. . Special funds .............................................................................................................................................. .. Federal funds ............................................................................................................................................ ..
Total .......................................................................................................................................................... ..
Proposed 1980-81
$4.5 0.6 0.6
$5.7
The Administration proposes toincrease the state's effort in controlling toxic and hazardous materials in the environment by improving state activities relating to: (a) transportation and disposal of hazardous wastes, (b) emergency response to toxic incidents, (c) control of airborne toxic substances, (d) identification of health hazards through a chemical environmental epidemiology program, and (e) procedures for informing workers of exposure to potentially dangerous substances.
The Administration intends to accomplish these activities through budget and legislative proposals and by executive order. The Governor's Office indicates that legislation will be introduced to enact necessary statutory changes. In addition, on February 11, 1980 the Governor issued an executive order to establish a Toxic Substances Coordinating Council consisting of representatives from seven state agencies and departments currently involved in regulating toxic substances. The purpose of this
A-20
J
council would be to coordinate enforcement strategies and eliminate duplication.
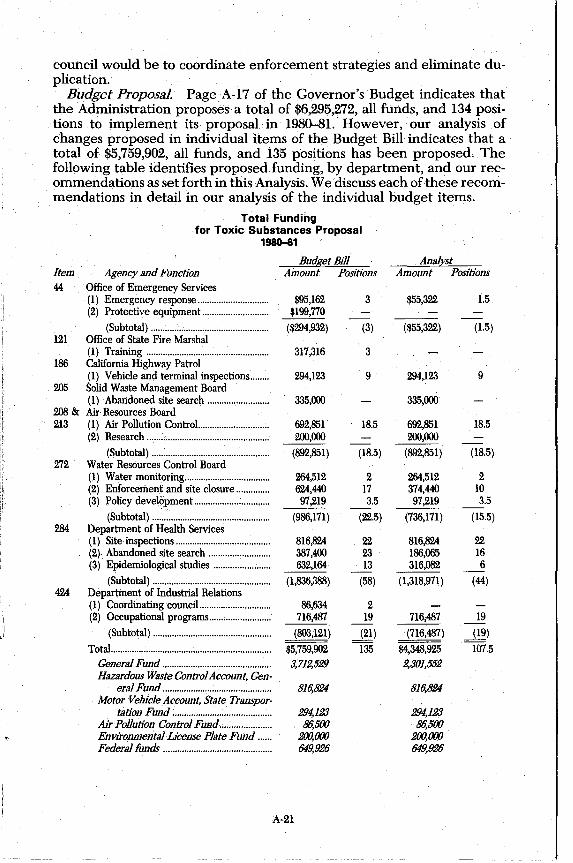
Budget Proposal. Page A-17 of the Governor's Budget indicates that the Administration proposes a total of $6,295,272, all funds, and 134 positions to implement its proposal in 1980-81. However, our analysis of changes proposed in individual items of the Budget Bill indicates that a total of $5,759,902, all funds, and 135 positions has been proposed. The following table identifies proposed funding, by department, and our recommendations as set forth in this Analysis. We discuss each of these recommendations in detail in our analysis of the individual budget items.
Total Funding for Toxic Substances Proposal
1980-81
Budget Bill Item Agency and Function Amount Positions 44 Office of Emergency Services
(1) Emergency response ............................. . $95,162 3 (2) Protective equipment ........................... . $199,770
(Subtotal) ................................................. . ($294,932) (3) 121 Office of State Fire Marshal
(1) Training ................................................... . 317,316 3 186 California Highway Patrol
(1) Vehicle and terminal inspections ........ 294,123 9 205 Solid Waste Management Board
(1) Abandoned site search ........................ .. 335,000 208 & Air Resources Board 213 (1) Air Pollution ControL .......................... . 692,851 18.5
(2) Research ....... ; ........................................... . 200,000
(Subtotal) ................................................ .. (892,851) (18.5) 272 Water Resources Control Board
(1) Water monitoring .................................. .. 264,512 2 (2) Enforcement and site closure ............ .. 624,440 17 (3) Policy development .............................. .. 97,219 3.5
-(Subtotal) ................................................. .
284 Department of Health Services (986,171) (22.5)
(1) Site inspections ...................................... .. 816,824 22 (2) Abandoned site search ........................ .. 387,400 23 (3) Epidemiological studies ...................... .. 632,164 13 -
(Subtotal) ................................................. . (1,836,388) (58) 424 Department of Industrial Relations
(1) Coordinating council ............................ .. 86,634 2 (2) Occupational programs ........................ .. 716,487 19
-(Subtotal) ................................................ .. (803,121) (21)
Total .................................................................. .. $5,759,902 135 General Fund ............................................ .. 3,712,529 Hazardous WasteControlAccount, Gen·
eralFund ............................................ .. 816,824 Motor VehicleAccount, State Transpor·
tation Fund ........................................ .. 294,123 Air PoUution Control Fund.; .................. .. 86,500 Environmental License Plate Fund .... .. 200,000 Federal funds ............................................ .. 649,926
A-21
Anai[st Amount Positions
$55,322 1.5
($55,322) (1.5)
294,123 9
335,000
692,851 18.5 200,000
(892,851) (18.5)
264,512 2 374,440 10 97,219 3.5 --
(736,171) (15.5)
816,824 22 186,065 16 316,082 6 --
(1,318,971 ) (44)
716,487 19 --(716,487) (19)
$4,348,925 107.5 2,301,552
816,824
294,123 86,500
200,000 649,926

As the table indicates, we are recommending a total reduction of $1,410,977 and 27.5 positions. This will leave a total of $4,348,925 and 107.5 positions to carry out the Governor's proposal. In addition, we are recommending that legislation be enacted to authodze the Solid Waste Management Board to study alternatives to land disposal of hazardous waste. The budget proposes that the Office of Appropriate Technology undertake this study.
In general, the Administration's proposal emphasizes the control of hazardous wastes from their point of origin to their disposition at waste disposal sites. It appears, however, that increasing the difficulty of disposing of such wastes through legal procedures may result in more illegal disposal. We believe that, along with the regulatory features of the budgeted programs, the Legislature should consider alternatives for providing disposal sites in a sufficient number of suitable locations in order to facilitate proper disposal of wastes.
E. GENERAL OBLIGATION BONDS
Bond Categories
General obligation bonds are debt instruments which are backed with the full faith and credit of the state. California's general obligation bonds are grouped into three categories, depending on the extent to which debt service is assumed by the state:
(1) General Fund Bonds. The debt service on these bonds is fully paid by the General Fund.
(2) Partially Self-Liquidating Bonds. The only program falling into this category is school building aid. Prior to 1978-79, debt service on these bonds was paid in part by the state and in part-depending on local assessed valuations-by local school districts. Assessed valuations have now reached such a level that the state has been relieved of any debt service payments.
(3) Self-Liquidating Bonds. Redemption and interest costs are paid entirely from project revenues. However, should such revenues ever fail to cover the required debt service, the state would have to make up the difference.
Agencies of the state also issue revenue bonds. These are not, however, general obligation issues, as only the revenue generated from the financed project is pledged as security. This type of debt instrument has been used by the state to finance the construction of bridges, fair facilities, dormito-ries and parking lots. Revenue bond totals are not included in this summary.
Table 8 provides detail on the three categories of general obligation bonds. As of December 31, 1979, the state had over $1.3 billion in unsold bonds, or $610 million, or 31.6 percent, less than the total on December 31,1978. Of the authorized bonds already sold ($9.36 billion), the state has retired $3.26 billion, leaving $6.1 billion outstanding. During the 1979 I
calendar year no new general obligation bond measures were passed by the Legislature.
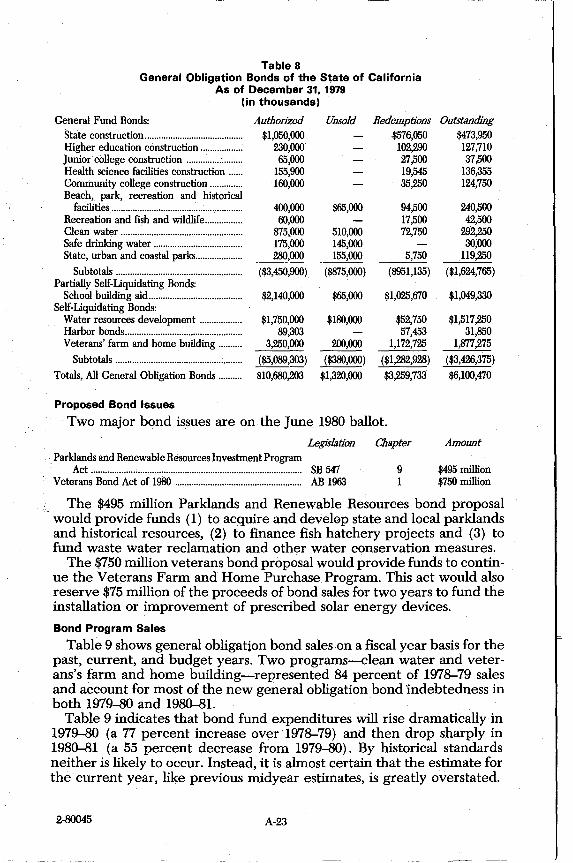
Table 8 General Obligation Bonds of the State of California
As of December 31, 1979 (in thousands)
General Fund Bonds: State construction ......................................... . Higher education construction ................. . Junior college construction ..................... ... Health science facilities construction ..... . Community college construction ............. . Beach, park, recreation and historical
facilities ....................................................... . Recreation and fish and wildlife ............... . Clean water ................................ ; .................. . Safe drinking water ..................................... . State, urban and coastal parks ................... .
Subtotals ..................................................... . Partially Self-Liquidating Bonds:
School building aid ....................................... . Self-Liquidating Bonds:
Water resources development ................. . Harbor bonds ................................................. . Veterans' farm and home building ......... .
Subtotals ..................................................... .
Totals, All General Obligation Bonds ......... .
Proposed Bond Issues
Authorized $1,050,000
230,000 65,000
155,900 160,000
400,000 60,000
875,000 175,000 280,000
($3,450,900)
$2,140,000
$1,750,000 89,303
3,250,000
($5,089,303)
$10,680,203
Unsold
$65,000
510,000 145,000 155,000
($875,000)
$65,000
$180,000
200,000
($380,000)
$1,320,000
Redemptions $576,050 102,290 27,500 19,545 35,250
94,500 17,500 72,750
5,750 ($951,135)
$1,025,670
$52,750 57,453
1,172,725
($1,282,928)
$3,259,733
Two major bond issues are on the June 1980 ballot.
Legislation Chapter . Parklands and Renewable Resources Investment Program
Act .......................................................................................... SB 547 9 Veterans Bond Act of 1980 ...................................................... AB 1963 1
Outstanding $473,950 127,710 37,500
136,355 124,750
240,500 42,500
292,250 30;000
119,250
($1,624,765)
$1,049,330
$1,517,250 31,850
1,877;1.75
($3,426,375)
$6,100,470
Amount
$495 million $750 million
The $495 million Parklands and Renewable Resources bond proposal would provide funds (1) to acquire and develop state and local parklands and historical resources, (2) to finance fish hatchery projects and (3) to fund waste water reclamation and other water conservation measures.
The $750 million veterans bond proposal would provide funds to continue the Veterans Farm and Home Purchase Program. This act would also reserve $75 million of the proceeds of bond sales for two years to fund the installation or improvement of prescribed solar energy devices.
Bond Program' Sales
Table 9 shows general obligation bond sales on a fiscal year basis for the past, current, and budget years. Two programs-clean water and veterans's farm and home building-represented 84 percent of 1978-79 sales and account for most of the new general obligation bond Indebtedness in both 1979-80 and 1980-81.
Table 9 indicates that bond fund expenditures will rise dramatically in 1979-80 (a 77 percent increase over 1978-79) and then drop sharply in 1980-81 (a 55 percent decrease from 1979-80). By historical standards neither is likely to occur. Instead, it is almost certain that the estimate for the current year, like previous midyear estimates, is greatly overstated.
2-80045 A-23

Table 9 General Obligation Bond Sales
1978-79 to 1980-81 (in millions)
Beach, park, recreational and historical facilities ....................... . Clean water ........................................................................................... . Safe drinking water ............................................................................. . State, urban, and coastal parks ......................................................... .
Subtotals, General Fund Bonds ................................................... . School building aid • ........................................................................... . Water resources development b ••••••••..•.••••••••••..•••••••.•.•••••••••••••.••••••..
Veterans' farm and home building b •••••••..•••••••••.•••••••••••..••••••••...•••••
Totals ................................................................................................... .
• Debt service presently paid entirely by school districts. b Debt service paid from program or project revenues.
Actual 1978-79
$45 75
40 ($160)
375
$535
Estimated Proposed 1979-80 1980-81
$25 $40 105 160
25 25 80 -- --
($155) ($305) 65
10 400 75
$620 $390 c
c Department of Finance projections of $720 million include another $330 million in sales from bonds not yet approved by the voters: $250 million for veterans' farm and home building and $80 million for Parklands and Renewable Resources Investment Program Act.
Each of the last· five midyear estimates of bond fund expenditures has turned out to be too high. On the average, the midyear estimates have been twice the level of the actual expenditures. For example, the 1977-78 and 1978-79 midyear estimates were $436 million and $406 million, respectively, while actual expenditures in those years were $157 million and $196 million, respectively.
The failure of the budget to give a realistic picture of bond expenditures· makes inter-year bond program comparisons invalid and distorts total expenditure comparisons. More realistic scheduling of new projects and those already authorized, particularly in the parks and recreation area, would result in more accurate midyear estimates and, consequently, improved interyear comparisons.
General Fund Debt Service
Table 10 projects the amount of debt service to be paid on bonds fully supported by the General Fund through 1982-83. Debt service for the budget year will increase $23.9 million, or 12.1 percent, over the current year. All of the debt service estimates in Table 10 are based on specific estimates of anticipated future bond sales. If additional sales occur, the amounts needed to retire General Fund debt will increase accordingly.
Table 10 General Fund Debt Service·
1978-79 to 1982-83· (in millions)
Percent Change Anticipatedc
from Future Debt Service b Previous Year SaJes
1978-79........................................................................................ $185.8 11.9% 1979-80........................................................................................ 198.3 6.7 $155 1980-81........................................................................................ 222.2 12.1 305 1981-82........................................................................................ 260.8 17.4 200 1982-83........................................................................................ 286.3 9.8 200 • All figures are estimates except for 1978-79. b Includes estimated debt service only on bond issues already authorized by the electorate. C An average interest rate of 7.0 percent is assumed on future sales.
A-24

Also interest rates paid on bond sales will tend to rise slightly because one rating service recently reduced the rating of state general obligation bonds from AAA to AA.
Selected Bond Fund Expenditures
Even after General Fund bonds are sold, the Legislature must still appropriate the proceeds from an issue for specific projects. These appropriations, referred to as selected bond fund expenditures, are identified in Schedule 3 of the Governor's Budget. Table 11 groups them according to the source of funding.
Table 11 Selected Bond Fund Expenditures
1978-79 to 1980-81 (in thousands)
State Construction ......................................................................... . Higher Education Construction ................................................. . Health Science Facilities Construction ................................... . Community College Construction ............................................. . Beach, Park, Recreational, and Historical Facilities ............. . Recreation and Fish and Wildlife ............................................. . Clean Water ................................................................................... . Safe Dri.nking Water ..................................................................... . State, Urban, and Coastal Parks ................................................. . Coastal Conservancy ..................................................................... .
Totals ............................................................................................. .
Actual 1978-79
$29 11,866 17,093 1,183
27,013 2,556
72,838 13,087 50,~
$196,357
Estimated Propdsed 1979-80 1fJ80...81
$399 5,022 $1,295 2,960
59,842 8,282 4,829
94,800 95,469 36,659 36,753
142,279 1 14,902
$346,790 1 $15,6,701
1 Includes $14,750 thousand which represents a federal reimbursement to the State, Urban, and Coastal Park Fund.
F. PROPOSITION 4
On November 6, 1979, California voters overwhelmingly approved Proposition 4, the "Spirit of 13" Initiative. Proposition 4, which placed Article XIII B in the California Constitution, has three main provisions:
• It places a limit on the year-to-year growth in tax-supported approJriations of the state and individual local governments.
. C:. IJ precludes the state and local governments from retaining surplus '----.. ---1unds.
• It requires the state to reimburse local governments for the cost of certain state mandates.
Spending Limit
Proposition 4 seeks to limit the spending of government entities by establishing a limit on the level of tax-supported appropriations in each fiscal year. The initiative establishes a base-year limit for 1978-79, and adjusts this limit in subsequent years for changes in inflation and population. Once established, the limit increases (or decreases) independently of actual government spending.
Not all appropriations are covered by the initiative's provisions. Proposition 4 limits only appropriations from tax revenues, such as revenues from
A-25
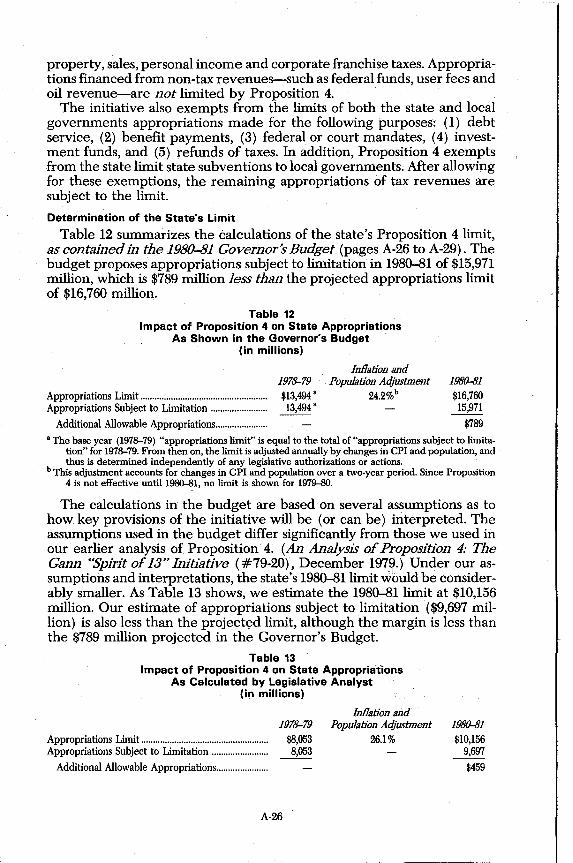
property, sales, personal income and corporate franchise taxes. Appropriations financed from non-tax revenues-such as federal funds, user fees and oil revenue-are not limited by Proposition 4.
The initiative also exempts from the limits of both the state and local governments appropriations made for the following purposes: (1) debt service, (2) benefit payments, (3) federal or court mandates, (4) investment funds, and (5) refunds of taxes. In addition, Proposition 4 exempts from the state limit state subventions to local governments. After allowing for these exemptions, the remaining appropriations of tax revenues are subject to the limit.
Determination of the State's Limit
Table 12 summarizes the calculations of the state's Proposition 4 limit, as contained in the 1980-81 Governor's Budget (pages A-26 to A-29). The budget proposes appropriations subject to limitation in 1980-81 of $15,971 million, which is $789 million less than the projected appropriations limit of $16,760 million.
Table 12 Impact of Proposition 4 on State Appropriations
As Shown in the Governor's Budget (in millions)
1978-79 Appropriations Limit ...................................................... $13,494 a
Appropriations Subject to Limitation ........................ 13,494 a
Additional Allowable Appropriations ..................... .
InOation and Population Adjustment
24.2%b 1980-81 $16,760
15,971
$789
a The base year (1978-79) "appropriations limit" is equal to the total of "appropriations subject to limitation" for 1978-79. From then on, the limit is adjusted annually by changes in CPI and population, and thus is determined independently of any legislative authorizations or actions.
b This adjustment accounts for changes in CPI and population over a two-year period. Since Proposition 4 is not effective until 1980-81, no limit is shown for 1979-80.
The calculations in the budget are based on several assumptions as to how key provisions of the initiative will be (or can be) interpreted. The assumptions used in the budget differ significantly from those we used in our earlier analysis of Proposition 4. (An Analysis of Proposition 4: The Gann "Spirit of 13" Initiative (#79-20), December 1979.) Under our assumptions and interpretations, the state's 1980-81 limit would be considerably smaller. As Table 13 shows, we estimate the 1980-81 limit at $10,156 million. Our estimate of appropriations subject to limitation ($9,697 million) is also less than the project~d limit, although the margin is less than the $789 million projected in the Governor's Budget.
Table 13 Impact of Proposition 4 on State Appropriations
As Calculated by Legislative Analyst (in millions)
Appropriations Limit .................................................... .. Appropriations Subject to Limitation ....................... .
Additional Allowable Appropriations ..................... .
1978-79 $8,053 8,053
A-26
InOation and Population Adjustment
26.1% 1980-81 $10,156
9,697
$459

The major differences between the Governor's assumptions and ours are summarized below.
Subventions. The initiative states that state subventions for the use and operation of local government are counted in the local base. Based on Legislative Counsel opinions, we have assumed that the term will be interpreted broadly to include all direct state payments to local governments. The budget, on the other hand, assumes that subventions will be interpreted more narrowly to include only general purpose state assistance to localities (for example, tax relief, a portion of K-12 educational apportionments and shared revenues).
As Table 14 illustrates, the assumptions reflected in the budget result in a higher state base and a lower overall local base. The impact of including a larger proportion of state aid to localities in the state base depends on whether this aid is expected to grow faster or slower than the appropriations limit. For instance, including a fast-growing program such as Aid to Families with Dependent Children (AFDC) , in the state base might in the future force the state to restrict the growth in other expenditures in order to accommodate higher AFDC expenditures within its limit. Conversely, if such payments are included within the local base, other local expenditures may have to be restrained in order to stay within the local limits.
Table 14 Reconciliation of 1980-81 State Appropriations
Subject to Limitation (in millions)
1980-81 Appropriations
Subject to Limitation Legislative. Analyst Estimate ...................................................................................................... $9,697 Additions to the State Base:
Subventions ............................................................................................................................... . K-14 (categorical and Serrano spending) ..................................................................... . Department of Social Services (primarily AFDC payments) ................................. . Other ........................................................................................................................................ .
Non-tax proceeds .................................................................................................................... .. PERS debt ............................................................................................................................... ... Other ........................................................................................................................................... .
Governor's Budget Estimate ..................................................................................................... .
(+5,110) +2,909 +1,504
+697 +822 +175 +167
$15,971
Non-tax Proceeds. The initiative provides that appropriations from user fees and other non-tax revenues are not subject to limitation. The budget proposes, however, to include appropriations from non-tax revenue sources (except for Federal Revenue Sharing and Capital Outlay Fund for Public Higher Education) in the state base, in order to eliminate the need for new accounting procedures. These appropriations would increase the state base by $822 million.
Other. The remaining difference ($342 million) between the two estimates consists of: (1) $175 million in Public Employees Retirement System (PERS) debt which the initiative allows to be excluded from the state base, and (2) $167 million due to all other differences.
The large difference between the two estimates suggests the need for some legislative clarification of the proposition's language. The budget
A-27
makes a limited number of recommendations along these lines. We believe, however, that there are other issues which the Legislature may wish to resolve, rather than leave tojudicial resolution. Consequently, we have made more extensive recommendations in our report on Proposition 4 to aid the Legislature in its task of interpreting and clarifying the initiative, in order that the state and local governments can have the means to fulfill and enforce the provisions of Proposition 4.
Under either set of assumptions, however, it does not appear as if the state will be constrained by Proposition 4's limits in the near future.
III. REVENUES A. SUMMARY
Table 15 summarizes the growth of General Fund revenues in recent years, and presents the estimates in the Governor's Budget for General Fund revenues in the current and budget years. The table shows that:
• Prior year (1978-79) General Fund revenues totaled $15.2 billion, or 11.1 percent ($1.6 billion) above the level of receipts in 1977-78.
• Current year (1979-80) General Fund revenues are estimated to reach $17.8 billion, 16.8 percent ($2.6 billion) over collections in the prior year.
• Budget year (1980-81) General Fund revenues are projected to total $19.3 billion, an increase of 8.5 percent ($1.5 billion) over the current year level.
Revenue Growth Trend Slowing
On the surface, these estimates imply a very uneven pattern of revenue growth during the period 1977-78 through 1980-81. However, as Table 15 also shows, these figures distort the underlying growth trend of General Fund revenues because they include the effects of the $700 million onetime personal income tax credit provided by AB 3802 (Chapter 569, Statutes of 1978). Excluding this one-time credit, the table indicates that General Fund revenue growth would have gradually tapered downward from the record 20.3 percent gain in 1977-78 to 16.2 percent in 1978-79, 11.9 percent in 1979-80 and 8.4 percent in 1980-81. As further shown in the table, a slightly less pronounced but steady downward growth trend would still exist even in the absence of the income tax indexing provisions provided for by AB 3802 (Chapter 569, Statutes of 1978) and AB 276 (Chapter 1198, Statutes of 1979).
Thus, California's underlying General Fund revenue growth trend clearly appears to be slowing after having peaked in the 1976-77 through 1978-79 period. This was a time when California enjoyed a "boom" economy as revenue-related economic indicators like employment, taxable sales and corporate profits all registered record gains. In contrast, the expected slowing in 1979-80 and 1980-81 revenue growth reflects both the slowing of economic activity experienced in 1979 and the widely anticipated 1980 recession.
A-28

1974-75 ...................... . 1975-76 ...................... .. 1976-77 ...................... .. 1977-78 ...................... .. 1978-79 ...................... .. 1979-80 ...................... .. 1980-81 c .................... ..
Table 15 General Fund Revenue Growth Trends for
Selected Years
DoUar Receipts
$8,617 9,613
11,381 13,695 15,219 17,781 19,284
(in millions)
Under Existing Law
DoUar· Percent Amount Change
$890 lL5% 996 11.6
1,768 18.4 2,314 20.3 1,524 ILl 2,562 16.8 1,503 8.5
Growth Over Prior Year Excluding
One-Time 1978 Tax Credits b
DoUar Percent Amount Change
$2,214 16.2% 1,887 11.9 1,488 8.4
Excluding Indexing and One-Time
1978 Tax Credits b
DoUar Percent Amount Change
$2,484 18.l % 2,282 14.l 2,263 12.3
• In computing 1974-75 revenue growth, the 1973-74 revenue base has been adjusted to exclude the effects of the one-time six-month reduction in the sales and use tax, and the one-time 20 percent cut in the personal income tax. Without these one-ti11le tax reductions, 1973-74 receipts would have been over $700 million more than the level actually realized.
b Table 32 shows the estimated dollar impacts of the one-time 1978 tax credits and indexing on personal income tax revenues in 1978-79, 197~ and 1980-81. AB 3802 (Chapter 569, Statutes of 1978) provided that income tax brackets be indexed by the amount of inflation above 3 percent beginning in 1978, and also that the standard deduction, personal credits and dependent credit be fuUyindexed beginning in 1979. AB 276 (Chapter 1198, Statutes of 1979) provided that income tax brackets be fully indexed by the inflation rate, but only for the 1980 and 1981 income years.
c Excludes $77.8 million in General Fund tidelands oil revenues which the 1980-81 Governor's Budget proposes for transfer to the General Fund.
Economic Assumptions Pivotal
As always,economic conditions in California are the major determinates of the state's revenue outlook. The Department of Finance's revenue projections are generally consistent with its economic forecast, although the latter is subject to considerable error because of the especially clouded outlook for 1980.
The Department of Finance economic forecast calls for a continued high rate of inflation in 1980, accompanied by a mild national recession lasting through mid-year followed by a reasonably strong recovery. California is expected to share in this downturn; however, the impact of the recession in California is projected to be less than what it is projected to be nationally. The expected 1980 slowing in the state's economy and its implications for state revenues are best seen in the forecasts for those key variables which most strongly affect state revenues:
• California personal income growth is projected to drop from a record 13.8 percent in 1979 to only 10.9 percent in 1980. This would be the lowest personal income growth since 1972.
• Taxable sales are predicted to rise only 11.7 percent in 1980, the smallest gain since 1975 and well below the 15.5 percent increase in 1979.
• Corporate profits are forecast to exhibit no growth in 1980, compared to increases of 13.7 percent in 1979 and over 23 percent in 1978.
• Employment growth for wage and salary workers is expected to fall from 4.9 percent in 1979 to only 1.4 percent in 1980.
A-29

Alternative Forecasts Offered
In addition to the Department of Finance's basic economic forecast and related revenue projections, the Governor's Budget includes both a "more optimistic" and a "more pessimistic" scenario for economic performance and state revenue collections. This is particularly helpful to the Legislature because the Department of Finance, along with all other forecasters, has had considerable difficulty accurately predicting economic activity in recent years.
Table 16 shows that, based on these alternative economic assumptions, the Department of Finance estimates that:
• Current year General Fund revenues could range from $345 million above to $445 million below the projected level; and
• Budget year General Fund revenues could range from $607 million above to $678 million below the projected level.
Table 16 General Fund Revenue Estimates
Based Upon Alternative Economic Outlooks· (in millions)
IJilference From Budget Forecast Current Year Budget Year
(1979-JO) 0fJ8().81) High Low High Low
Revenue Source Estimate Estimate Estimate Estimate Sales and use tax ........................................................... . $+330 $-330 $+510 $-500 Personal income tax ..................................................... . +15 -115 +45 -130 Bank and corporation ................................................. . +52 -58 Other sources ................................................................. .
Total Revenues and Transfers ............................. ... $+345 $-445 $+607 $-678
• Source: 1980-S1 Governor's Budget.
Revenue Ranges Could be Broader
The ranges shown in Table 16 provide a useful perspective on the revenue forecast. However, we believe that they probably understate the range in which actual revenues could fall. Consequently, the Legislature should not place too much emphasis on them when making budget decisions. There are several reasons for this:
• First, Finance's estimates for some of the major sources of General Fund income show little or no margin of error. For example, bank and corporation tax receipts in the current year are the same for all three sets of economic assumptions, as are revenues from sources other than the three major taxes in both the current and budget years. Likewise, the "high alternative" for personal income tax collections exceeds the Governor's Budget estimate by only $15 million for 1979--80 and $45 million for 1980--81. These margins are extremely small relative to the amount of income tax revenue and the historical errors made in estimating it.
• Second, the total revenue range for the budget year is significantly less than the margin of error for revenue estimates in recent years. Budget year revenues were underpredicted by over $1.3 billion in 1977-78 and by over $970 million in 1978-79. For 1979:..80, which is only one-half completed, the current revenue projeCtion already exceeds the initial prediction made in January 1979 by $500 million, and preliminary reports indicate that both personal income and sales and use
A-30
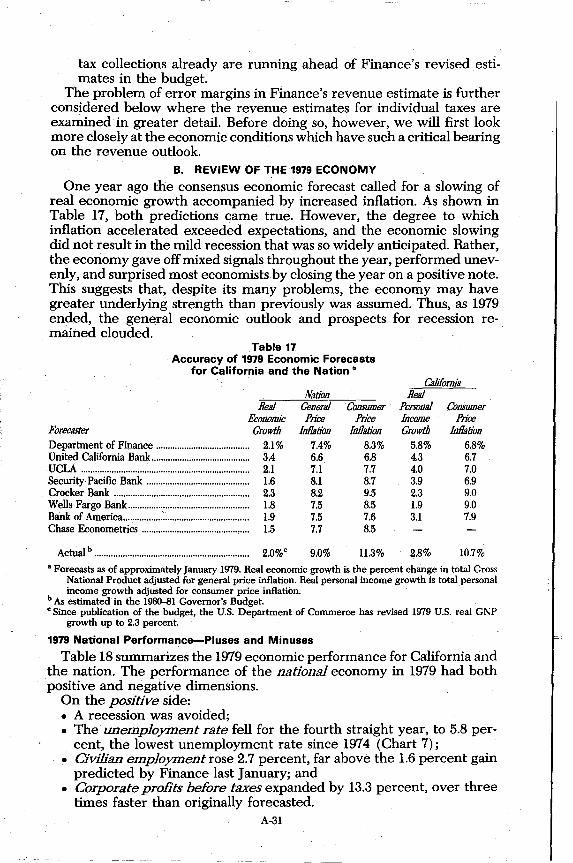
tax collections already are running ahead of Finance's revised estimates in the budget.
The problem of error margins in Finance's revenue estimate is further considered below where the revenue estimates for individual taxes are examined in greater detail. Before doing so, however, we will first look more closely at the economic conditions which have such a critical bearing on the revenue outlook.
B. REVIEW OF THE 1979 ECONOMY
One year ago the consensus economic forecast called for a slowing of real economic growth accompanied by increased inflation. As shown in Table 17, both predictions came true. However, the degree to which inflation accelerated exceeded expectations, and the economic slowing did not result in the mild recession that was so widely anticipated. Rather, the economy gave off mixed signals throughout the year, performed unevenly, and surprised most economists by closing the year on a positive note. This suggests that, despite its many problems, the economy may have greater underlying strength than previously was assumed. Thus, as 1979 ended, the general economic outlook and prospects for recession remained clouded.
Table 17 Accuracy of 1979 Economic Forecasts
for California and the Nation'
Real &anomie
Forecaster Growth Department of Finance ........................................ 2.1 % United California Bank .......................................... 3.4 UCLA ........................................................................ 2.1 Security Pacific Bank ............................................ 1.6 Crocker Bank .......................................................... 2.3 Wells Fargo Bank.................................................... 1.8 Bank of America...................................................... 1.9 Chase Econometrics .............................................. 1.5
Actual b ••.•••.•.•..•.•..•..••.•......•..••..•.•....•..••.••........•.•.•. 2.0% c
Nation General Price
InBation 7.4% 6.6 7.1 8.1 8.2 7.5 7.5 7.7
9.0%
Consumer Price
InDation 8.3% 6.8 7.7 8.7 9.5 8.5 7.6 8.5
11.3%
California Real
Personal Consumer Income Price Growth InBation
5.8% 6.8% 4.3 6.7 4.0 7.0 3.9 6.9 2.3 9.0 1.9 9.0 3.1 7.9
2.8% 10.7%
• Forecasts as of approximately January 1979. Real economic growth is the percent change in total Gross National Product adjusted for general price inflation. Real personal income growth is total personal income growth adjusted for consumer price inflation.
b As estimated in the 1980-81 Governor's Budget. C Since publication of the budget, the U.S. Department of Commerce has revised 1979 U.S. real Gt\p
growth up to 2.3 percent.
1979 National Performance-Pluses and Minuses
Table 18 summarizes the 1979 economic performance for California and the nation. The performance of the national economy in 1979 had both positive and negative dimensions.
On the positive side: • A recession was avoided; • The unemployment rate fell for the fourth straight year, to 5.8 per
cent, the lowest unemployment rate since 1974 (Chart 7); • Civilian employment rose 2.7 percent, far above the 1.6 percent gain
predicted by Finance last January; and • Corporate profits before taxes expanded by 13.3 percent, over three
times faster than originally forecasted. A-31
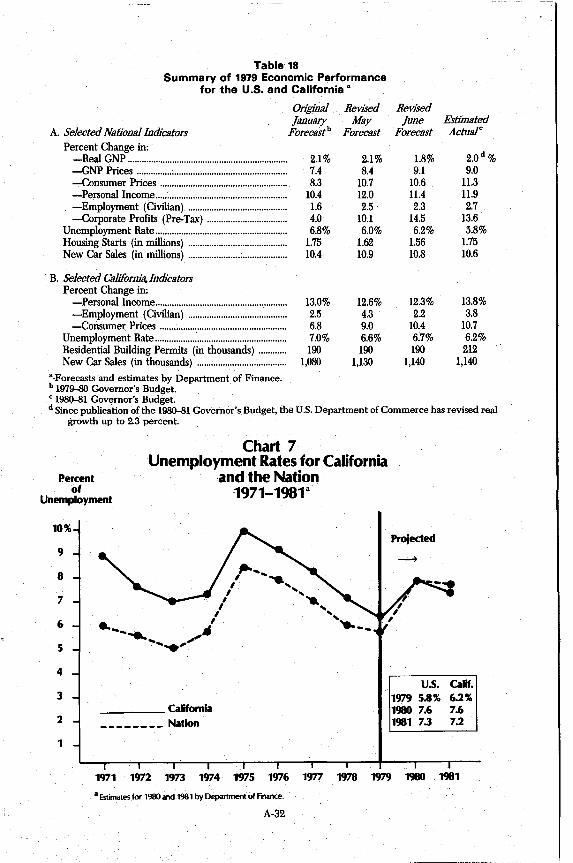
Table 18 Summary of 1979 Economic Performance
for the U.S. and California Q
A. Selected National Indicators Percent Change in:
-Real GNP .................................................................... -GNP Prices ................................................................ -Consumer Prices ...................................................... -Personal Income ........................................................ -Employment (Civilian) .......................................... -Corporate Profits (Pre-Tax) ..................................
Unemployment Rate ........................................................ Housing Starts (in millions) .......................................... New Car Sales (in millions) ..........................................
B. Selected California. Indicators Percent Change in:
-Personal Income ........................................................ -Employment (Civilian) .......................................... -Consumer Prices ......................................................
Unemployment Rate ........................................................ Residential Building Permits (in thousands) ............ New Car Sales (in thousands) ......................................
a-Forecasts and estimates by Department of Finance. b 1979-80 Governor's Budget.
Original Revised January May
Forecastb Forecast
2.1% 2.1% 7.4 8.4 8.3 10.7
10.4 12.0 1.6 2.5 4.0 10.1 6.8% 6.0%
1.75 1.62 10.4 10.9
13.0% 12.6% 2.5 4.3 6.8 9.0 7.0% 6.6% 190 190
1,080 1,130
Revised June Estimated
Forecast Actualc
1.8% 2.0d% 9.1 9.0
10.6 11.3 11.4 11.9 2.3 2.7
14.5 13.6 6.2% 5.8%
1.56 1.75 10.8 10.6
12.3% 13.8% 2.2 3.8
10.4 10.7 6.7% 6.2% 190 212
1,140 1,140
c 1980-81 Governor's Budget. d Since publication of the 1980-81 Governor'sBudget, the U.S. Department of Commerce has revised real
growth up to 2.3 percent.
Percent of
Unemployment
Chart 7 Unemployment Rates for California
and the Nation 1971-1981"
10%
9
8
7
6
5
4
3
2
1
~ .... " ...... , ...... , ..... , ... I ...... .... i ..... _-.......... ,," ..... "
__ ~ __ California ________ Nation
Projected
~
U.s. Calif. 1979 5.8% 6.2% 1980 7.6 7.6 1981 73 7.2
1971 1972 1973 1974· 1975 1976 1977 1978 1979 1980 1981
• Estimates for 1980 and 1981 by Department of Fmance.
A-32
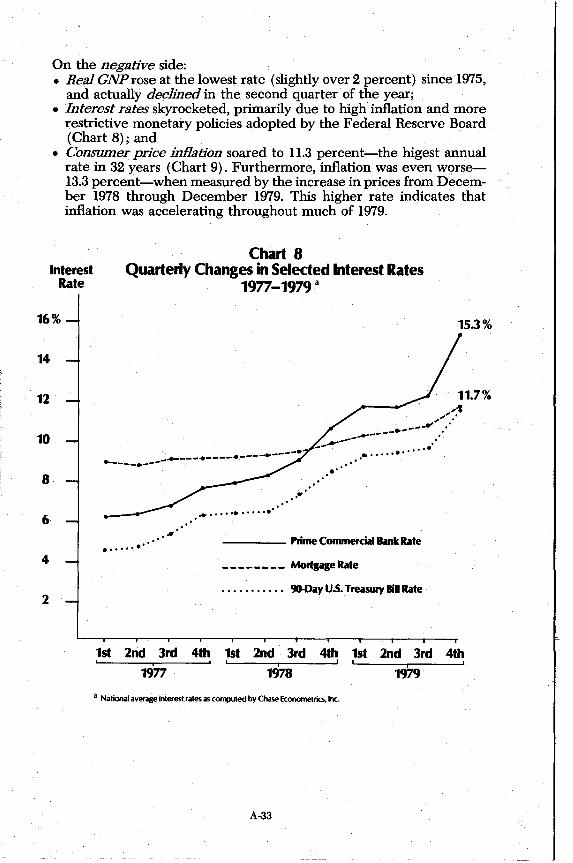
On the negative side: • Real GNP rose at the lowest rate (slightly over 2 percent) since1975,
and actually declined in the second quarter of the year; • Interest rates skyrocketed, primarily due to high inflation and more
restrictive monetary policies adopted by the Federal Reserve Board (Chart 8); and
• Consumer price inflation soared to 11.3 percent-the higest annual rate in 32 years (Chart 9). Furthermore, inflation was even worse-13.3 percent-when measured by the increase in prices from December 1978 through December 1979. This higher rate indicates that inflation was accelerating throughout much of 1979.
Interest Rate
Chart 8 Quarterly Changes in Selected Interest Rates
1977-1979 a
16% 15.3%
14
12
10
8
6
4
2
........ 1 ",; ..
~~ ....... ......... -~--.- ..
.... -..,..--..... ---.----.----.. ----. . •.....•.....• .. ----.---- ..•.
.. ...............
•..... .. ... ." ---- Prime Commercial Bank Rate
________ Mortgage Rate
• • • • • • • • • •• CJO.Day U.s. Treasury BiD Rate
1st 2nd 3rd 4th 1st 2nd 3rd 4th 1st 2nd 3rd 4th , i ' , I I !
1977 1978 1979
a National average interest rates as COfT1lUled by Chase Econometrics, Inc.
A-33
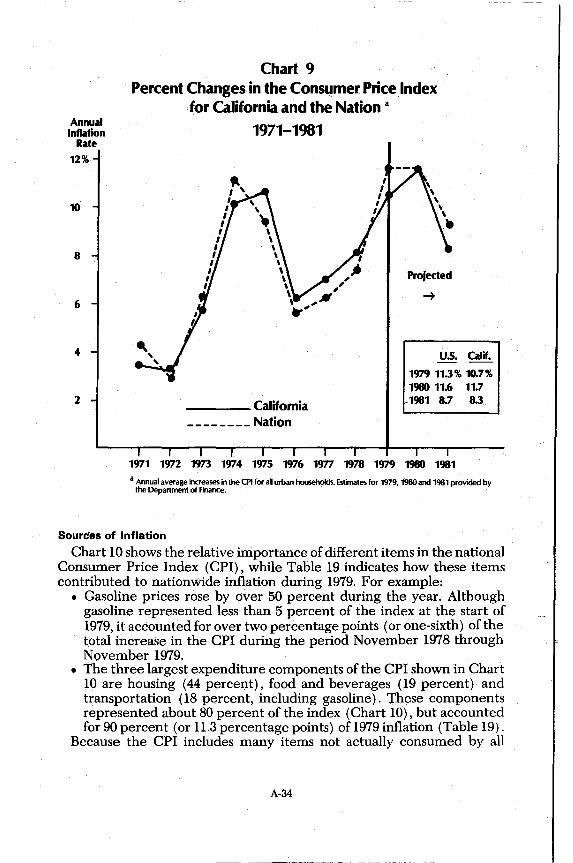
Annual Inflation
Rate
12%
10
8
6
4
2
Chart 9 Percent Changes in the Consumer Price Index
for California and the Nation a
", I , , I
I I I I I I , ,
I
1971-1981
____ California ________ Nation
Projected
-+
u.s. Calif. - --1979 11.3% 10.7% 1980 11.6 11.7
-1981 8.7 8.3
1971 1972 1973 1974 1975 1976 1977 1978 1979 1980 1981
a Annual average increases in the CPI for all urban households. Estimates for 1979. 1980 and 1961 provided by the Department of Finance.
Sourdes of Inflation
Chart 10 shows the relative importance of different items in the national Consumer Price Index (CPI), while Table 19 indicates how these items contributed to nationwide inflation during 1979. For example:
• Gasoline prices rose by over 50 percent during the year. Although gasoline represented less than 5 percent of the index at the start of 1979, it accounted for over two percentage points (or one-sixth) of the total increase in the CPI during the period November 1978 through November 1979.
• The three largest expenditure components of the CPI shown in Chart 10 are housing (44 percent), food and beverages (19 percent) and transportation (18 percent, including gasoline). These components represented about 80 percent of the index (Chart 10), but accounted for 90 percent (or 11.3 percentage points) of1979 inflation (Table 19).
Because the CPI includes many items not actually consumed by all
A-34

households, it can give a distorted view of inflation, particularly when certain components of the index dominate its behavior. For instance, at the beginning of 1979 about 25 percent of the index reflected homeownership costs. These costs accounted for about one third of 1979 inflation as measured by the cpr, but did not reflect the actual inflation experience of households not owning or buying homes. The cpr is also limited because it generally does not allow for its basic composition of items to change from year-to-year, even though during periods of rapid inflation consumers do change the composition of their purchases.
Chart 10
Importance of Different Items in the. Consumer Price Index ~ (Per Dollar of Consumer Spending)
-New Car Purchases (3.9¢) ---Gasoline (4.2¢)
Other Goods and Services
-All Other (9.7 ¢)
Entertainment (4.0¢)
Medical Care _ (5.0¢)
Apparel and ./ Upkeep
(5.5¢)
a As of December 1978
Housing (44.3¢)
A-35
-Rent (6.3¢) -Home Purchase (10.2¢) -financing, Insurance
and Taxes (9.7¢) -fuels and Utilities (6.3¢) -All Other (11.8¢)
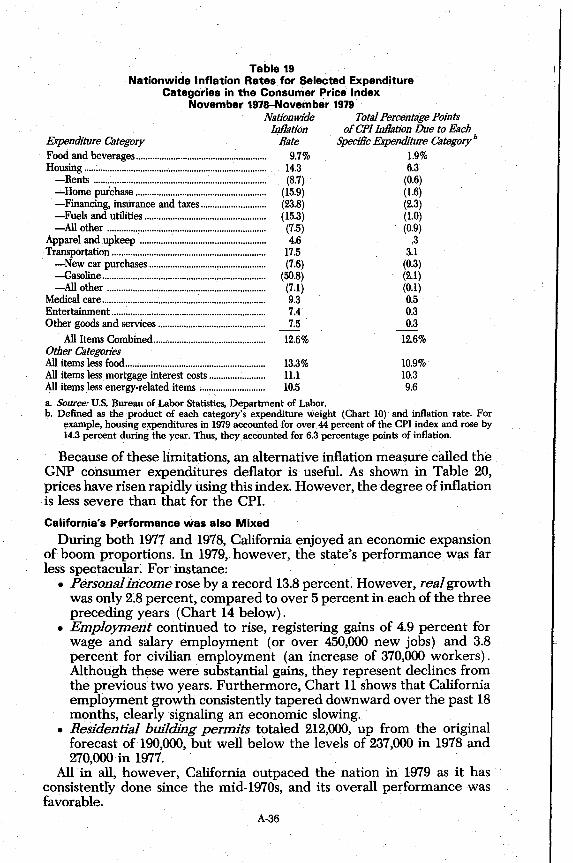
Table 19 Nationwide Inflation Rates for Selected Expenditure'
Categories in the Consumer Price Index November 1978-November 1979
Nationwide Total Percentage Points
Expenditure Category Food and beverages ...................................................... .. Housing ............................................................................ ..
-Rents ........................................................................ .. -Home purchase ...................................................... .. -Financing, insurance and taxes .......................... .. -Fuels and utilities .................................................. .. -All other .................................................................. ..
Apparel and upkeep .................................................... .. Transportation ................................................................ ..
-New car purchases ................................................ .. -Gasoline .................................................................... .. -All other .................................................................. ..
Medical care .................................................................... .. Entertainment ................................................................ .. Other goods and services ............................................ ..
All Items Combined .............................................. .. Other Categon'es All items less food .......................................................... .. All items less mortgage interest costs ...................... .. All items less energy.related items .......................... ..
Inflation of CPllnflation Due to Each Rate Specific Expenditure Category b
9.7% 1.9% 14.3 6.3 (8.7) (0.6)
(15.9) (1.6) (23.8) (2.3) (15.3) (1.0) (7.5) (0.9) 4.6 .3
17.5 3.1 (7.6) (0.3)
(SO.8) (2.1) (7.1) (0.1) 9.3 0.5 7.4 0.3 7.5 0.3
12.6%
13.3% 11.1 10.5
12.6%
10.9% 10.3 9.6
a. Solirce: u.s. Bureau of Labor Statistics, Department of Labor. b. Defined as the product of each category's expenditure weight (Chart 10) and inflation rate. For
example, housing expenditures in 1979 accounted for over 44 percent of the CPI index and rose by 14.3 percent during the year. Thus, they accounted for 6.3 percentage points of inflation.
Because of these limitations, an alternative inflation measure called the GNP consumer expenditures deflator is useful. As shown in Table 20, prices have risen rapidly using this index. However, the degree of inflation is less severe than that for the CPl.
California's Performance was also Mixed
During both 1977 and 1978, California enjoyed an economic expansion of boom proportions. In 1979, however, the state's performance was far less spectacular. For instance:
• Personal income rose by a record 13.8 percent. However, real growth was only 2.8 percent, compared to over 5 percent in each of the three preceding years (Chart 14 below).
• Employment continued to rise, registering gains of 4.9 percent for wage and salary employment (or over 450,000 new jobs) and :).8 percent for civilian employment (an increase of 370,000 workers). Although these were substantial gains, they represent declines from the previous two years. Furthermore, Chart 11 shows that California employment growth consistently tapered downward over the past 18 months, clearly signaling an economic slowing.
• Residential building permits totaled 212,000, up from the original forecast of 190,000, but well below the levels of 237,000 in 1978 and 270,000 in 1977.
All in all, however, California outpaced the nation in 1979 as it has consistently done since the mid-1970s, and its overall performance was favorable.
A·36

Table 20 Alternative Measurements of Inflation Faced by Consumers·
1978 Average
1 Consumer Price Index.......................... 7.7% 11.1% GNP Deflator for Consumer Expend-
itures.................................................. 6.8 10.7
• Deparhnent of Finance and Chase Econometrics.
Chart 11
Percent Increase Quarterly Rates
During 1979 2 3
13.6% 12.9%
9.3 9.8
4 13.0%
11.5
1979 Average
11.3%
9.0
Percent ClYnge b
California Wage and Salary Employment Growth Over the Preceding 12 Months, by Month
June 1978 to November 1979 a
6
4
Monlh ofYeu
10 11 12 6 8 9 10 11
~ SOURCE: Employment Development Department. Figures fOf April through November are the preliminary interim date series.
Percent change over same month one year earlier.
C. THE 1980 AND 1981 ECONOMIC OUTLOOK
Economic activity in calendar 1980 will account for about one-third of current year (1979-80) General Fund revenues and about two-thirds of budget year (1980-81) revenues. The remaining one-third of budget year revenues will be determined by 1981 economic conditions. Although the Department of Finance has prepared calendar year forecasts for both 1980 and 1981, our discussion focuses primarily on the 1980 outlook because of its significance for current and budget year revenues. A second reason for emphasizing 1980 over 1981 is that economic projections beyond a year in advance have become increasingly unreliable. In fact, a majority of fO]"8-casters have not yet even prepared their forecasts for 1981, and thus tht:<e is not a good basis for assessing the department's 1981 forecast.
A-37

Critical Assumptions
Table 21 summarizes the economic outlook in 1980 and 1981 for California and the nation. In preparing the forecast, Finance has assumed that:
• The Federal Reserve Board will maintain a tight monetary policy in the first part of 1980;
• Critical energy shortages will not exist; • The Iranian situation will be resolved without a general conflict in the
Middle East; • Wage-price controls will not be imposed; • A federal tax cut will be enacted in mid-1980; and • The social security rate increase scheduled for January 1981 will be
reduced.
Table 21 Department of Finance Economic Outlook for California
and the Nation (dollars in billions) •
1979 Estimated 1980 Forecast 1981 Forecast Percent Percent Percent
Level Change Level Change Level Change A. The Nation
GNP in 1972 DoJlars ...................... GNP Price Deflator
$1,426.7 2.0% $1,401.4 -1.8% $1,464.0 4.5%
(1972 = 100) .......... 165.7 9.0 182.7 10.3 196.1 7.3 Consumer Price Index
(1967 = 100) ............................. 217.4 11.3 242.6 11.6 263.8 8.7 Personal Income ............................ $1,922.6 11.9 $2,122.2 10.4 $2,369.2 11.6 Savings Rate .................................... 4.8% 5.2% 5.2% Corporate Profits (Pre-Tax) ........ $233.5 13.6 $214.2 -B.3 $254.3 1B.7 Employment (in thousands) ...... 96,901.3 2.7 97,077.4 0.2 99,784.3 2.8 Unemployment Rate .................... 5.B% 7.6% 7.3% Housing Starts (millions of units) 1.75 -13.0 1.32 -24.2 1.76 32.8 New Car Sales (millions of units) 10.6 -6.4 9.7 -8.6 10.5 8.7
B. California Personal Income ............................ $226.5 13.8 $251.2 10.9 $281.8 ·12.2 Consumer Price Index .................. 215.6 10.7 240.8 11.7 260.8 8.3 Employment (in thousands) ...... 10,248 3.8 10,443 1.9 10,893 4.3 Unemployment Rate .................... 6.2% 7.6% 7.2% Residential Building Permits (in
thousands) ................................ 212 -13.1 165 -22.2 230 39.4 a Source: Department of Finance and 1980-81 Governor's Budget.
To prepare an economic forecast in these unsettled times, it is necessary to make assumptions regarding matters such as these which involve political as much as economic considerations. At the same time, however, these assumptions clearly make the forecast more vulnerable than ever to error.
National Recession Predicted
The department predicts that the national economy will experience a moderate recession and continued high inflation in 1980. As shown in Table 21:
• Real GNP is projected to drop 1.8 percent below its 1979 level; • Consumer prices are expected to increase at 11.6 percent, and general
prices are assumed to rise at 10.3 percent; and
A-3S
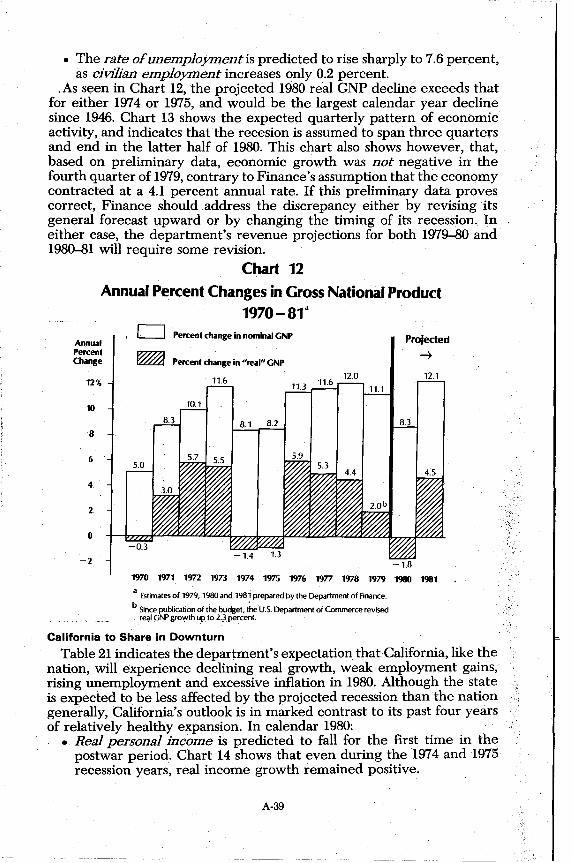
• The rate of unemployment is predicted to rise sharply to 7.6 percent, as civilian employment increases only 0.2 percent.
: As seen in Chart 12, the projected 1980 real GNP d-ecline exceeds that for either 1974 or 1975, and would be the largest calendar year decline since 1946. Chart 13 shows the expected quarterly pattern of economic activity, and indicates that the recesion is assumed to span three quarters and end in the latter half of 1980. This chart also shows however, that, based on preliminary data, economic growth was not negative in the fourth quarter of 1979, contrary to Finance's assumption that the economy contracted at a 4.1 percent annual rate. If this preliminary data proves correct, Finance should address the discrepancy either by revising its general forecast upward or by changing the timing of its recession .. In either case, the department's revenue projections for both 1979-80 and 1980-81 will require some revision.
Chart 12 Annual Percent Changes in Gross National Product
1970-81a
Annual Percent Change
12%
10
8
6
4
2
o
-2
Percent change in nominal GNP
Percent change in "real" GNP
11.6
Projected
~
12.1
1970 1971 1972 1973 1974 1975 1976 19n 1978 1979 1980 1981
a Estimates of 1979, 1980 and 1981 prepared by the Department of Finance.
b Since publication of the budget, the U.s. Department of Commerce revised real GNP growth up to 2.3 percent.
California to Share in Downturn
Table 21 indicates the department's expectation that California, like the nation, will experience declining real growth, weak employment gains, rising unemployment and excessive inflation in 1980. Although the state is expected to be less affected by the projected recession than the nation generally, California's outlook is in marked contrast to its past four years of relatively healthy expansion. In calendar 1980:
• Real personal income is predicted to fall for the first time in the postwar period. Chart 14 shows that even during the 1974 and 1975 recession years, real income growth remained positive.
A-39
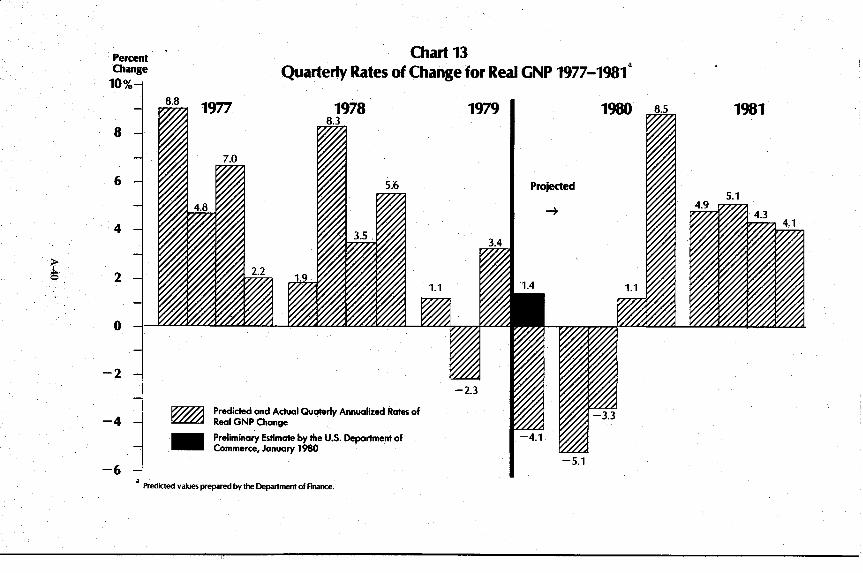
~
Percent Chqe
10
8
6
4
2
0
-2
-4
-6
Chart 13 Quarterly Rates of Change for Real GNP 1977-1981·
1977
~ .. Predicted and Actual Quaterly Annualized Rates of Real GNP Change
Preliminary Estimate by the U.S. Department of Commerce. January 1980
1979 1980
Projected
~
-5.1
• Predicted values prepared by the Department of Fmance.
1981

• Expected employment gains for wage and salary workers are only 1.4 percent, lowest since 1975. Chart 15 shows that the predicted number of new jobs-only 131,OOO-is less than one-third that of 1979. As a result, the unemployment rate is expected to rise to 7.6 percent (Chart 7 above).
• Consumer price inDaHon is expected to soar to 11.7 percent, slightly above the national rate (Chart 9 above).
• Building permits are projected to fall by over 20 percent from 1979 levels, to only 165,000 units.
Annual Percent Change
14%
12
10
8
6
4
2
0
-2
Chart 14 Annual Percent Change in California Personal Income
1970-80
c=J Percent change in total personal income Projected
~ Percent change in "real" personal incolJlea 13.8
-+ 13.6
12.5 12.2 11.7 11.7
11.0 10.9
9.6
8.8
7.0 6.4
5.3 5.2
-0.7 1970 1971 1972 1973 1974 1975 1976 1977 1978 1979 1980 1981
a Real personal income is defined as total personal income deflated by the California Consumer Price Index for all -urban households. Estimates for 1979, 1980 and 1981 prepared by the Department of Finance
Table 22 details how the projected employment growth slowdown in California is distributed among different industry sectors, and how these changes compare to prior years. The employment increase in 1980 is 300,000 less than in 1979. Employment reductions are expected iii both the manufacturing and construction sectors. These sectors, which are quite sensitive to economic con.ditions, are predicted to have 40,000 fewer em-
. ployees in 1980 than 1979. They would have even less were it not for strength in the aerospace industries. The trade and service sectors actually are expected to contribute the most to the employment slowdown-over 100,000 fewer new jobs than in 1979.
A-41

Chart 15 Annual Growth in California Wage and Salary Employment
Ch.tngein Employment (thousands)
Year 1970 1971
1970-1981" Annual Percent Ch.tnge
0.2% -0.5
1972 4.3 Projected 1973 5.7
700
-100
1974 2.8 ~ 1975 0.2 1976 3.9 1977 5.5 1978 7.4 1979 4.9 1980b 1.4 1981 b 4.0
1970 1971 1972 1973 1974 1975 1976 19" 1978 1979 1980 1981
a Source: Department of Finance. bProjected
Table 22 California Employment Gains by Major Industry Sector a
197~1981 (in thousands)
Sector 1974 1975 1976 1977 1978 1979 1980 Manufacturing ............................................ 40 -107 64 77 144 125 -15 Construction ................................................ -10 -31 14 49 51 41 -25 Trade ............................................................ 49 34 90 106 156 80 29 Services ........................................................ 54 44 85 11B 186 143 88 Government: .............................................. 61 83 24 43 16 3 42
Federal .................................................... B 3 -7 -1 B 3 1 Other government ................................ 52 80 30 45 B 0 41
All Other Nonagricultural Wage and Salary Employment b ........................ 19 -10 28 51 79 60 14
Total Nonagricultural Wage and Sal-ary Employment ................................ 212 14 305 444 632 452 131
Total Civilian Employment C .............. 320 -65 359 492 572 371 195 Percent Change in Employment:
Total Nonagricultural Wage and Sal-ary Employment ................................ 2.B% 0.2% 3.9% 5.5% 7.4% 4.9% 1.4%
Total Civilian Employment ................ 3.9 -O.B 4.3 5.6 6J 3.B 1.9
1981 49 29 93
143 1B 1
17
54
389 450
4.0% 4.3
a Data from California Department of Finance. Detail may not total due to rounding. b Includes mining, transportation, communications, utilities, finance, insurance and real estate. c.Includes nonagricultural wage and salary employment, plus agricultural employment and nonagricultur-
al employment which is not wage and salary employment (such as self-proprietors).
A-42
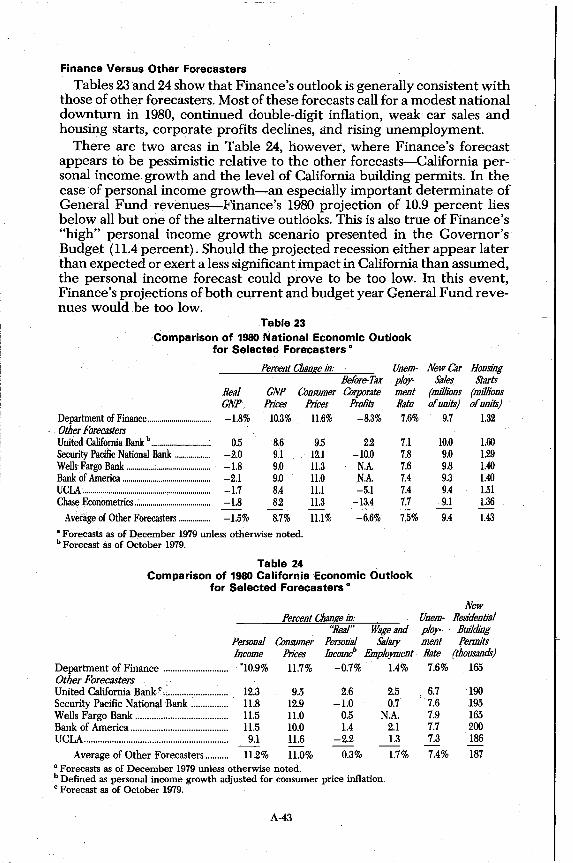
Finance Versus Other Forecasters
Tables 23 and 24 show that Finance's outlook is generally consistent with those of other forecasters. Most of these forecasts call for a modest national downturn in 1980, continued double-digit inflation, weak car sales and housing starts, corporate profits declines, and rising unemployment.
There are two areas in Table 24, however, where Finance's forecast appears to be pessimistic relative to the other forecasts-California personal income growth and the level of California building permits. In the case of personal income growth-an especially important determinate of General Fund revenues-Finance's 1980 projection of 10.9 percent lies below all but one of the alternative outlooks. This is also true of Finance's "high" personal income growth scenario presented in the Governor's Budget (11.4 percent). Should the projected recession either appear later than expected or exert a less significant impact in California than assumed, the personal income forecast could prove to be too low. In this event, Finance's projections of both current and budget year General Fund revenues would be too low.
Table 23 Comparison of 1980 National Economic Outlook
for Selected Forecasters a
Percent Change in:
Real GNP Consumer GNP PnCes Prices
Department of Finance ................................ -1.8% 10.3% 11.6% Other Forecasters United California Bank b .............................. 0.5 8.6 9.5 Security Pacific National Bank .................. -2.0 9.1 12.1 Wells Fargo Bank .......................................... -1.8 9.0 11.3 Bank of America ............................................ -2.1 9.0 11.0 UClA ................................................................ -1.7 8.4 ILl Chase Econometrics ...................................... -1.8 8.2 11.3
Average of Other Forecasters ................ -1.5% 8.7% lLl%
• Forecasts as of December 1979 unless otherwise noted. b Forecast as of October 1979.
Table 24
Unem· Before-Tax ploy-Corporate ment
ProRts Rate -8.3% 7.6%
2.2 7.l -10.0 7.8
N.A. 7.6 N.A. 7.4 -5.1 7.4
-13.4 7.7
-6.6% 7.5%
Comparison of 1980 California Economic Outlook for Selected Forecasters a
Percent Change in:
Personal Income
Department of Finance ............................ ·10.9% Other Forecasters United California Bank c.;.......................... 12.3 Security Pacific National Bank ................ 11.8 Wells Fargo Bank ........................................ 11.5 Bank of America .......................................... 11.5 UCLA.............................................................. 9.1
Average of Other Forecasters .......... 11.2%
Consumer Prices 11.7%
9.5 12.9 11.0 10.0 11.6
11.0% • Forecasts as of December 1979 unless otherwise noted.
"Real" Wage and Personal Salary Incorm/' Employment
-0.7% 1.4%
2.6 2.5 -1.0 0.7
0.5 N.A. 1.4 2.1
-2.2 1.3 0.3% 1.7%
b Defined as personal income growth adjusted for consumer price inflation. C Forecast as of October 1979.
A-43
New Car Housing Sales Starts
(millions (millions of units) of units)
9.7 1.32
10.0 1.60 9.0 1.29 9.8 1.40 9.3 1.40 9.4 1.51 9.1 1.36
9.4 1.43
New Unem- Residential ploy- Building ment Pennits Rate (thousands) 7.6% 165
6.7 190 7.6 195 7.9 165 7.7 200 7.3 186 7.4% 187

D. PRIOR AND CURRENT YEAR REVENUES Prior Year Revenues Far Exceeded Expectations
Table 25 summarizes prior year (1978-79) and current year (1979-80) General Fund revenue collections. Prior year receipts totaled $15.2 billion, an increase of only 11.1 percent ($1.5 billion) over those for 1977-78. As noted earlier in Table 15, however, growth would have been 18.1 percent ($2.5 billion) if AB 3802 had not been enacted in 1978. This growth rate would have far exceeded the rate originally predicted by the Department of Finance for 1978-79 revenues in January 1978-13.4 percent (an increase of $1.8 billion).
As detailed in Table 25, 80 percent of the 1978-79 revenue gain came from three sources:
• The sales and use tax increased by 14.9 percent ($750 million) and provided for one-half of the total increase;
• The bank and corporation tax contributed an additional $300 million, reflecting a 14.4 percent increase; and
• Interest income rose by nearly 60 percent ($164 million) above its 1977-78 level, to $447 million.
In contrast, personal income taxes rose only $94 million (2 percent). However, in the absence of the special one-time tax credit and indexing· provisions of AB 3802, income tax collections would have risen by more than 22 percent ($1.1 billion)
Table 25 Growth of Prior Year and Current Year
General Fund Revenues by Type
(in millions,"
Actual Actual Change Emmated Change 1977-78 1978-79 Amount Percent 1fl/!J..8{) Amount Percent
Three Major Taxes: -Sales and use ............................................................ $5,030 $5,779 $749 14.9% $6,460 $681 11.8% -Personal income b .................................................... 4,668 4,762 94 2.0 6,275 1,513 31.8 -Bank and corporation .............................................. 2,082 2,381 299 14.4 2,566 185 7.8
Other Major Taxes and Licenses ................................ 1,170 1,266 96 8.2 1,377 III 8.8 Interest Income ................................................................ 283 447 164 58.0 500 53 11.8 Other Revenues and Transfers c .................................. 462 584 122 26.4 603 19 3.3 -- -- --
Total General Fund Revenues and Transfers d $13,695 $15,219 $1,524 11.1% $17,781 $2,562 16.8%
a Detail may not total due to rounding. b Includes revenue reduction in 197~79 of approximately $960 million, $690 million of which is from a
one-time increase in personal tax credits for the 1978 income year. The remaining $270 million is the revenue loss due to partial income tax indexing. Without the one-time credit, personal income tax revenue growth would have been 16.8 percent in 197~79 (an increase of $784 million over 1977-78) and 15.4 percent in 1979-80 (an increase of $838 million over 197~79).
C Includes transfers from Federal Revenue Sharing Fund of $215 million in 1977-78 and $276.2 million in 197~79 and 1979-80.
d Total revenue growth in the absence of the one-time 1978 personal income tax credit wotildhave been 16.2 percent in 197~79 (a gain over 1977-78 of $2,214 million) and 11.9 percent in 1979-80 (a gain
• of $1,887 million over 197~79).
A-44
Robust Economy Caused Strong Prior Year Revenue>Gains
The reason for the strong 1978-79 revenue trends is that the California economy in 1978-the prime determinate of prior year receipts~was extremely robust, plagued by inflation (which increases the revenue base) and saddled with high interest rates (which increase interest income revenues). For example:
• Personal income-a major determinate of both personal income tax and sales and use tax revenues-rose 13.6 percent (Chart 14). This was the largest gain in 27 years.
• Gains in both taxable sales (14.1 percent) and corporate profits (23.2 percent) were the second highest in recent years, as shown later in Charts 17 and 18, respectively.
Because the Department of Finance significantly underestimated the strength of the 1978 economy, extremely large upward revisions in the 1978-79 revenue estimates were required over the past 24 months. Table 26 shows that:
• Actual revenues exceeded the original estimate presented in the 1978 -79 Governor's Budget (January 1978) by over $970 million, or 6.4 percent. This included $300 million for the sales and use tax, $220 million for the personal income tax, $180 million for the bank and corporation tax, and nearly $260 million for interest income. These amounts exclude the impacts of Proposition 13 and 1978 legislation which affected tax collections.
A-45
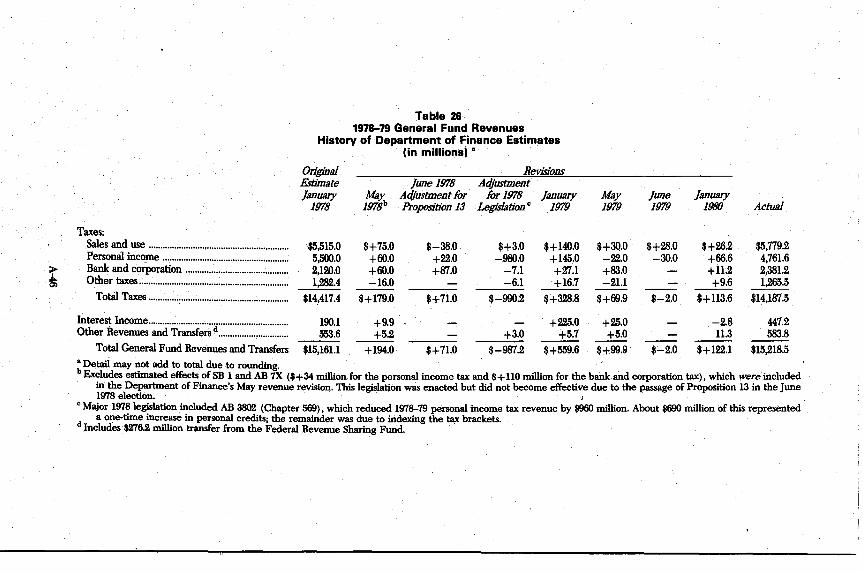
~
Table 26 1978-79 General Fund Revenues
History of Department of Finance Estimates (in millions) •
Taxes: Sales and use ........................................................... . Personal income ..................................................... . Bank and corPoration ......................................... ... Other taxes ~ .............................................................. .
Original Estimate January
1978
$5,515.0 5,500;0 2,120.0 1,282.4
total Taxes ............................................................ $14,417.4
Interest Income............................................................ 190.1 Other Revenues and Transfers d •.••••.••.••.••. ,............. 553.6
Total General Fund Revenues and Transfers $15,161.1
June 1978 May' Adjustment for
1978b Proposition 13
$+75.0 +60.0 +60.0 -16.0
$+179.0
+9.9 +5.2
+194.0
$-38.0 +22.0 +87.0
$+71.0
$+71.0
Revisions Adjustment
for 1978 January Legislation c 1979
$+3.0 $+140.0 -980.0 +145.0
-7.1 +27.1 -6.1 +16.7
$-990.2 $+328.8
+225.0 +3.0 +5.7
$-987.2 $+559.6
May 1979
$+30.0 -22.0 +83.0 -21.1
$+69.9
+25.0 +5.0
$+99.9
June 1979
ft28.0 -30.0
$...,.2.0
$-2.0
January 1980
$+26.2 +66.6 +11.2 +9.6
$+113.6
-2.8 11.3 --
$+122.1
Actual
$5,779.2 4,761.6 2,381.2 1,265.5
$14,187.5
447.2 583.8 --
$15,218.5 • Detail may not add to total due to rounding. . b Excludes estimated effects of SB 1 and AB 7X ($+34 million for the personal income tax and $+110 million for the bank and corporation tax), which were included
in the Department of Finance's May revenue revision. This legislation was enacted but did not become effective due to the passage of Proposition 13 in the June 1978 election. ,
c Major 1978 legislation included AB 3802 (Chapter 569), which reduced 1978-79 personal income tax revenue by $960 million. About $690 million of this represented a one-time increase in personal credits; the remainder was due to indexing the tax brackets.
d Includes $276.2 million transfer from the Federal Revenue Sharing Fund.
• Actual revenues exceeded the estimate made in June 1978 (the latest estimate available to the Legislature before it made budget decisions for 1978-79) by nearly $780 million, or 5.4 percent. As shown in Table 27 this estimating error, although second only to that of 1977-78 in dollar terms, was the lowest as a percent of total revenues since 1974-75.
Table 27 General Fund Revenue
Estimating Errors a
Dollar Amount (in miUions)
1973-74 ............................................................................ $184 1974-75............................................................................ 322 1975-76............................................................................ 621 1976-77 ............................................................................ 726 1977-78............................................................................ 966 1978-79 ............................................................................ 780
Percent Error
2.7% 3.9 6.9 6.8 7.6 5.4
• Difference between actual receipts and receipts estimated in May prior to the start of the specified fiscal year.
• Actual revenues exceeded the estimate presented in the 1979-80 Governor's Budget (January 1979) by $220 million (1.5 percent).
Given the magnitude of these adjustments, revenue estimating errors continue to be a significant problem. Unfortunately, however, because these errors appear to result primarily from errors in predicting economic variables, the outlook for eliminating them is not very encouraging.
Current Year Revenues Also Revised Upward
Table 28 presents the history of 1979-80 General Fund revenue estimates. As indicated earlier in Table 25, General Fund revenues currently are anticipated to reach nearly $17.8 billion in 1979-80, a gain of almost $2.6 billion (16.8 percent) over the prior year. This increase exceeds the $2.4 billion (15.8 percent) rise originally projected last January. Unlike the experience in 1978-79, this upward revision was not primarily due to a stronger-than-expected economic performance during the fiscal year. Rather it reflects:
• An increase in the prior years (197~79) estimated tax base of approximately $200 million (Table 26), caused by unexpectedly strong economic activity in 1978 and early 1979; and
• An upward revision in current year interest income of over $175 million, due both to unexpectedly high interest rates and the size of the state's Pooled Money Investment Account.
The sum of these two amounts (about $375 million) and the effects of fiscal legislation account for all but about $120 million of the observed $413 million rise in the 1979-80 General Fund revenue estimate since last January. Thus, as shown in Table 29, when interest income is excluded the estimated 1979-80 General Fund revenue gain over 1978-79 is almost identical to that originally predicted 12 months ago. So are the gains for the individual major revenue sources (although, of course, the levels of the individual taxes have changed because of revisions in the level of the prior
" year tax base) .
.. ,
A-47
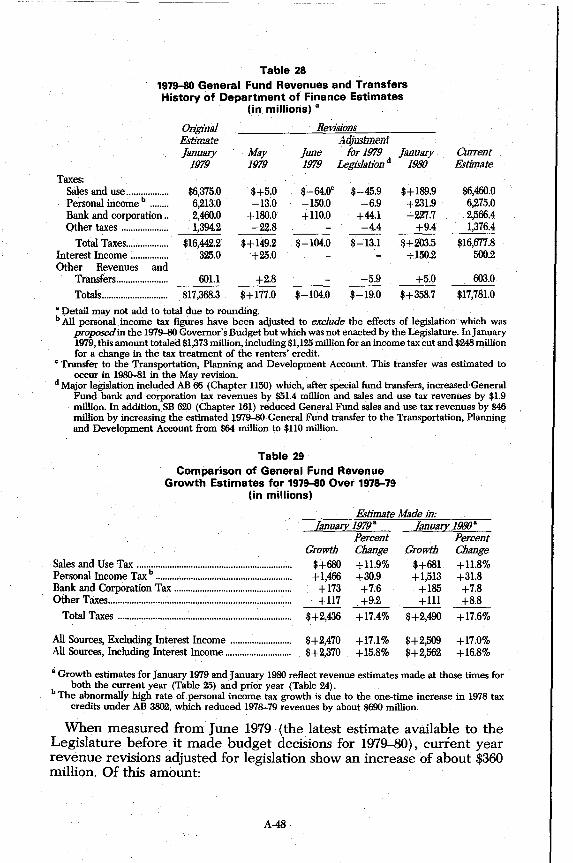
Table 28 1979-80 General Fund Revenues and Transfers History of Department of Finance Estimates
(in millions) a
Original Revisions Estimate Adjustment January May June for 1979 January Current
1979 1979 1979 Legislation d 1980 Estimate Taxes:
Sales and use .................. $6,375.0 $+5.0 $_64.0c $-45.9 $+189.9 $6,460.0 Personal income b •••••••• 6,213.0 -13.0 -150.0 -6.9 +231.9 6,275.0 Bank and corporation .. 2,460.0 +180.0 +110.0 +44.1 -227.7 2,566.4 Other taxes .................... 1,394.2 -22.8 -4.4 +9.4 1,376.4 ---
Total Taxes .................. $16,442.2 $+149.2 $-104.0 $-13.1 $+203.5 $16,677.8 Interest Income ................ 325.0 +25.0 +150.2 500.2 Other Revenues and
Transfers ...................... 601.1 +2.8 -5.9 +5.0 603.0 ---Totals ............................ $17,368.3 $+177.0 $-104.0 $-19.0 $+358.7 $17,78l.0
" Detail may not add to total due to rounding. b All personal income tax figures have been adjusted to exclude the effects of legislation which was
proposed in the 1979-80 Governor's Budget but which was not enacted by the Legislature. In January 1979, this amount totaled $1,373 million, including $1,125 million for an income tax cut and $248 million for a change in the tax treatment of the renters' credit.
C Transfer to the Transportation, Planning and Development Account. This transfer was estimated to occur in 1980-81 in the May revision.
d Major legislation included AB 66 (Chapter 1150) which, after special fund transfers, increased General Fund bank and corporation tax revenues by $51.4 million and sales and use tax revenues by $1.9 million. In addition, SB 620 (Chapter 161) reduced General Fund sales and use tax revenues by $46 million by increasing the estimated .1.979-80 General Fund transfer to the Transportation, Planning and Development Account from $64 million to $110 million.
Table 29 Comparison of General Fund Revenue
Growth Estimates for 1979-80 Over 1978-79 (in millions)
Estimate Made in:
. Sales and Use Tax ................................................................. . Personal Income Tax b ••••••••••••••••••.•••••••••••••••....•••••••••••••...••••
Bank and Corporation Tax ................................................. . Other Taxes .............................................................................. .
Total Taxes ......................................................................... .
All Sources, Excluding Interest Income ......................... . All Sources, Including Interest Income ........................... .
January 1979"
Growth $+680 +1,466
+173 +117
$+2,436
$+2,470 $+2,370
Percent Change +11.9% +30.9 +7.6 +9.2
+17.4%
+17.1% +15.8%
[anuary 1980"
Growth $+681 +1,513
+185 +lll
$+2,490
$+2,509 $+2,562
Percent Change +11.8% +31.8 +7.8 +8.8
+17.6%
+17.0% +16.8%
,; Growth estimates for January 1979 and January 1980 reflect revenue estimates made at those times for both the current year (Table 25) and prior year (Table 24).
b The abnormally high rate of personal income tax growth is due to the one-time increase in 1978 tax credits under AB 3802, which reduced 1978-79 revenues by about $690 million.
When measured from June 1979 (the latest estimate available to the Legislature before it made budget decisions for 1979-80), current year revenue revisions adjusted for legislation show an increase of about $360 million. Of this amount:
A-48

• $150 million represents higher interest income; • Approximately $115 million can be associated with increases in the
prior year's tax base; and • The remainder-about $95 million-results from the combination of
higher-than-expected personal income and sales and use taxes, and lower-than-expected bank and corporation taxes.
Trends in Collections Reflect a Slowing Economy
The slowing of current year General Fund revenue growth from the prior year shown in Tables 15 and 25 is consistent with the slowing of California economic activity from 1978 into early 1980. Specifically:
• When personal income taxes are adjusted for the one-time effects of AB 3802 shown in Table 29, the underlying trend in personal income tax growth has slowed slightly from about 16.6 percent in 1978-79 to 15.6 percent in 1979--80. This reflects the effects of indexing and the projected slowing in California personal income growth in 1980 to only 10.9 percent, as shown in Chart 14. It also reflects the fact that, although personal income growth for the entire 1979 calendar year (13.8 percent) actually exceeded that in 1978 (13.6 percent), the economy's strength weakened as 1979 progressed. As shown earlier in Chart 11, California employment growth weakened throughout 1979.
• Sales and use tax growth is projected to decline from 14.9 percent in 1978-79 to 11.8 percent in the current year. As shown in Chart 17 below, this is consistent with the anticipated drop in taxable sales growth to only 11.7 percent in 1980 and the slowing in employment growth in the latter half of 1979.
• Bank and corporation taxes are expected to rise in 1979--80 by only 7.8 percent, well below the 14.4 percent gain of 1978-79. This is due to the sharp slowiJ:lg in taxable corporate profits shown in Chart 18 below, from 23.2 percent in 1979 to 13.7 percent in 1979 and no gain in 1980.
Table 30 shows that reduced profits growth was widespread among different California industries in 1979. Although oil-related profits rose by nearly 60 percent ($785 million), this sector accounts for only about 8 percent of the state's corporate profits base and its strength was not enough to offset the softening elsewhere, including a 26 percent ($425 million) fall in profits in the utility sector caused by increasing energy prices. Increased energy costs also undoubtedly contributed to the reduced rates of profit growth experienced.by other industry sectors as well.
1979-80 Revenue Picture Still Uncertain
Because the current year is only a little more than half completed, the potential for errors in the current year revenue estimate remains significant. This is especially true this year for two reasons:
• First, about one-third of current year revenues will depend on economic activity in 1980, the outlook for which is very cloudy; and
• Second, when the current revenue estimates were prepared, Finance assumed that the fourth quarter of 1979 would be weaker than preliminary data now suggests. This could result in stronger revenue growth' than predicted.
Recognizing the uncertainties, the Governor's Budget suggests that the 1979--80 revenues could be $345 million higher to $445 million lower than
A-49

the official estimate (Table 16 earlier). Finance, however, attributes almost all of this range exclusively to uncertainties about sales and use tax receipts, even though historically both the personal income and bank and corporation tax forecasts have also exhibited large errors. For this reason, the estimating range for General Fund revenues in 1979-80 is much broader than Finance indicates.
Table 30 California Taxable Corporate Profits a
(in millions)
Preliminary 1978 Estimated 1979
Industry Manufacturing ....................................... . Trade ....................................................... . Banks b
................................................... .
Services ................................................... . Mining and Oil Production ............... . Real Estate and Other Financials ... . Utilities ................................................... . Construction ......................................... . Agriculture ............................................. .
Totals ................................................... .
1977 Actual
$6,651 4,018 1,9913 1,464 1,157 1,312 1,191
758 251
$18,800
Amount $7,997 4,909 2,476 1,964 1,358 1,560 1,643
904 352
$23,163
Percent Change Amount
20.2% $9,045 22.2 23.9 34.2 17.4 18.9 37.9 19.3 40.2 23.2%
5,545 3,011 2,279 2,143 1,766 1,219
953 379 .
$26,340
Share of Percent Total Change
34.3% 13.1% 21.1 13.0 11.4 21.6 8.7 16.0 8.1 57.8 6.7 13.2 4.6 -25.8 3.6 5.4 1.4 7.7
lOo.o% 13.7%
• Income of corporations with accounting periods ending from August of the year shown through July of the following year. Data from Department of Finance.
b Includes all financial institutions subject to the bank tax.
Preliminary data on December revenue collections shows that aggregate collections for the state's three major taxes are already over $100 million above the pace assumed in the Governor's Budget. Whether this trend will continue in the months to come is unknown, and will be largely determined by the behavior of the California economy. If a recession or significant economic slowing, as assumed by Finance, does not appear in the first half of calendar 1980, further upward revenue revisions are likely.
E. BUDGET YEAR REVENUES
Total state revenues from all sources for the budget year (1980-81) are projected by the Department of Finance at $22.3 billion. This is an increase of 8.6 percent ($1.8 billion) over the current year estimate. Table 31 compares the current year and budget year revenue estimates by source. For the budget year: .
• General Fund revenues are projected to reach $19.3 billion under existing law. This amount represents 86 percent of total state revenues, and is a gain of 8.5 percent ($1.5 billion) over the current year estimate.
• Special fund revenues will account for the remaining 14 percent of total revenues, and are expected to reach $3.1 billion. This is an increase over the current year estimate of 9.8 percent (about $275 million).
Revenue Growth Trend Reduced
General Fund revenue growth in the budget year (8.5 percent) is expected to fall significantly from that of the current year (16.8 percent). As shown in Table 15, however, this overstates the slowing in the actual
A-50
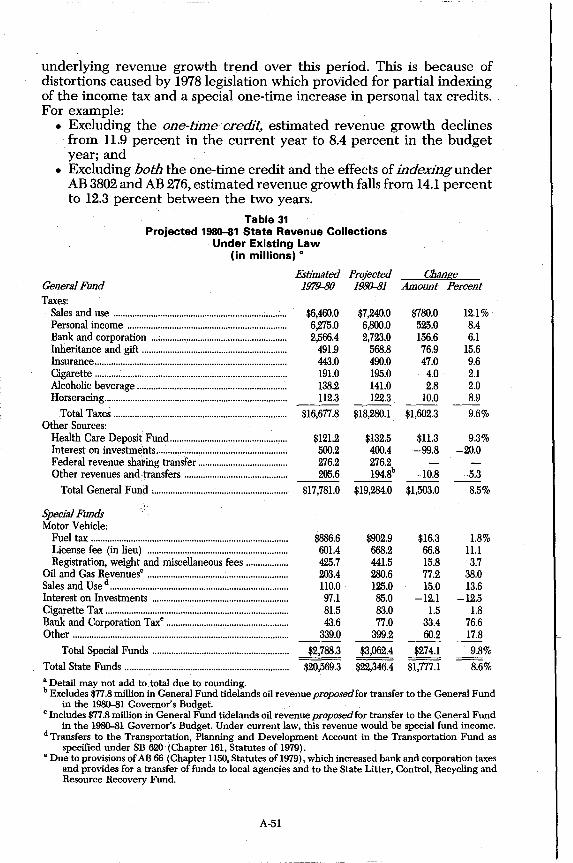
underlying revenue growth trend over this period. This is because of distortions caused by 1978 legislation which provided for partial indexing of the income tax and a special one-time increase in personal tax credits. For example:
• Excluding the one-time credit, estimated revenue growth declines from 11.9 percent in the current year to 8.4 percent in the budget year; and
• Excluding both the one-time credit and the effects of indexing under AB 3802 and AB 276, estimated revenue growth falls from 14.1 percent to 12.3 percent between the two years.
Table 31 Projected 1980-81 State Revenue Collections
Under Existing Law (in millions) a
General Fund
Taxes: Sales and use ...................................................................... : .. . Personal income .................................................................. .. Bank and corporation ........................................................ .. Inheritance and gift ............................................................ .. Insurance ................................................................................. . Cigarette ................................................................................ .. Alcoholic beverage .............................................................. .. Horseracing ............................................................................ ..
Total Taxes ......................................................................... . Other Sources:
Health Care Deposit Fund ................................................ .. Interest on investments ....................................................... . Federal revenue sharing transfer .................................... .. Other revenues and·transfers .......................................... ..
Total General Fund ......................................................... .
Special Funds Motor Vehicle:
Fuel tax ................................................................................... . License fee (in lieu) ........................................................... . Registration, weight and miscellaneous fees ................ ..
Oil and Gas Revenuesc ........................................................... .
Sales and Used .......................................................................... .. Interest on Investments ......................................................... . Cigarette Tax ............................................................................ .. Bank and Corporation Taxe
.................................................. ..
Other ........................................................................................... .
Total Special Funds ........................................................ ..
Total State Funds ..................................................................... .
Estimated 1979-80
$6,460.0 6,275.0 2,566.4
491.9 443.0 191.0 138.2 112.3
$16,677.8
$121.2 500.2 276.2 205.6
$17,781.0
$886.6 601.4 425.7 203.4 110.0 97.1 81.5 43.6
339.0
$2,788.3
$20,569.3
Projected 1980-81
$7,240.0 6,800.0 2,723.0
568.8 490.0 195.0 141.0 122.3
$18,280.1
$132.5 400.4 276.2 194.8b
$19,284.0
$902.9 668.2 441.5 280.6 125.0 85.0 83.0 77.0
399.2
$3,062.4
$22,346.4
Change Amount Percent
$780.0 12.1% 525.0 8.4 156.6 6.1 76.9 15.6 47.0 9.6
4.0 2.1 2.8 2.0
10.0 8.9
$1,602.3 9.6%
$11.3 9.3% -99.8 -20.0
-10.8 -5.3 --$1,503.0 8.5%
$16.3 1.8% 66.8 ILl 15.8 3.7 77.2 38.0 15.0 13.6
-12.1 -12.5 1.5 1.8
33.4 76.6 60.2 17.8
$274.1 9.8%
$1,777.1 8.6% a Detail may not add to total due to rounding. b Excludes $77.8 million in General Fund tidelands oil revenue proposed for transfer to the General Fund
in the 1980-81 Governor's Budget. C Includes $77.8 million in General Fund tidelands oil revenue proposed for transfer to the General Fund
in the 1980-81 Governor's Budget. Under current law, this revenue would be special fund income. d Transfers to the Transportation, Planning and Development Account in the Transportation Fund as
specified under SB 620 (Chapter 161, Statutes of 1979). e Due to provisions of AB 66 (Chapter 1150, Statutes of 1979), which increased bank and corporation taxes
and provides for a transfer of funds to local agencies and to the State Litter, Control, Recycling and Resource Recovery Fund.
A-51

However, because income tax indexing is now an ongoing feature of California's tax system, it is not really appropriate to exclude its effects when speaking of the underlying trend of General Fund revenues. Indexing has in fact permanently reduced the underlying growth trend of state revenues. Furthermore, in years· of high inflation such as we are experiencing currently, the impact of indexing on the rate of revenue growth is especially large. The fiscal implications of indexing are further discussed below.
Economic Downturn is Critical Assumption
Apart from the effects of indexing, the expected slowdown in General Fund revenue growth is due to the economic downturn projected for 1980. Economic activity in calendar year 1980 will account for about two-thirds of 1980-81 revenue collections. This projected economic downturn is reflected in the revenue estimates for each of the three major taxes:
• Personal income taxes in 1980-81 are forecast to increase only 8.4 percent, because personal income is expected to rise only 10.9 percent (Chart 14) and double-digit inflation will cause a $775 million revenue loss due to indexing.
• Sales and use taxgrowth (estimated at 12.1 percent) will be restrained by the 11.7 percent projected rise in calendar 1980 taxable sales, lowest in five years (Chart 17).
• Bank and corporation taxes are expected to increase only 6.1 percent in the budget year, even less than the modest 7.8 percent gain expected in the current year. As shown in Chart 18, this is largely because taxable corporate profits are predicted to experience no growth in the 1980 income year, although a fairly strong rebound is expected in 1981.
All in all, then, 1980-81 General Fund revenue growth is projected to .reflect weaker 1980 economic conditions and be substantially below the rates of increase realized in recent years. In fact, the predicted 1980-81 revenue growth of 8.5 percent would be the lowest in the past decade. Of course, if the projected economic downturn does not occur in California or is postponed, revenue growth could be far stronger.
Revenue Range Too Narrow
Based upon its alternative economic forecasts, the 1980-81 Governor's Budget suggests that General Fund revenues could differ from projected amounts by about $600 million on the high side and $700 million on the downside, Again, we believe that the Department of Finance's range is too narrow to adequately reflect the range of revenues which could realistical-lyoccur. .
On the upside, for example, Table 16 shows that the range is only about $50 million for both the personal income tax and the bank and corporation tax. Similarly, the downside range is only $60 million for the bank and corporation tax and $130 million for the personal income tax. Such small ranges for these taxes are unrealistic when compared to the magnitudes of revenue estimating errors in past years, the inability of forecasters to accurately predict corporate profits, the lack of experience in projecting the impact of indexing, and the degree of uncertainty currently confronting forecasters about both 1980 and 1981 economic conditions.
A-52
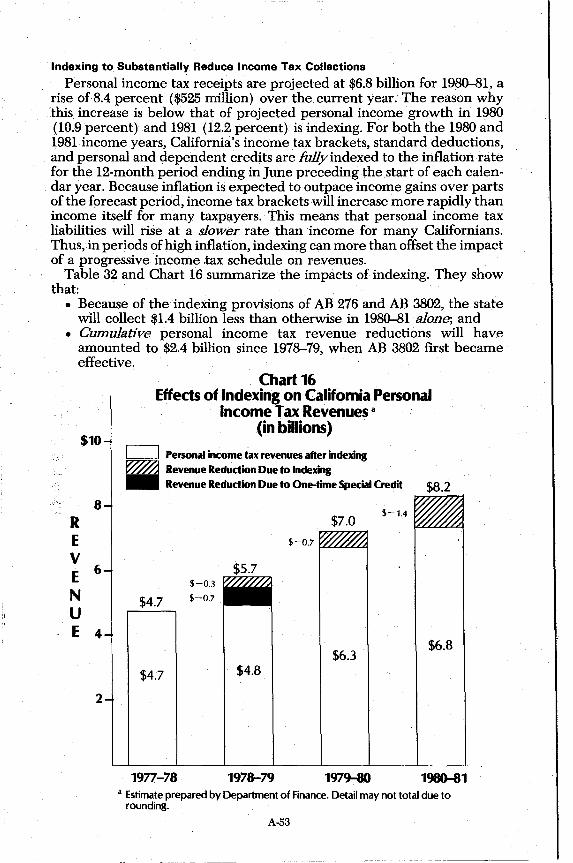
Indexing to Substantially Reduce Income Tax Collections
Personal income tax receipts are projected at $6.8 billion for 1980-81, a rise of8.4 percent ($525 million) over the. current year. The reason why this increase is below that of projected personal income growth in 1980 (10.9 percent) and 1981 (12.2 percent) is indexing. For both the 1980 and 1981 income years, California's income tax brackets, standard deductions, and personal and dependent credits are fullyindexed to the inflation rate for the 12-month period ending in June preceding the start of each calendar year. Because inflation is expected to outpace income gains over parts of the forecast period, income tax brackets will increase more rapidly than income itself for many taxpayers. This means that personal income tax liabilities will rise at a slower rate than income for many Californians. Thus,in periods of high inflation, indexing can more than offset the impact of a progressive income .tax schedule on revenues.
Table 32 and Chart 16 summarize the impacts of indexing. They show that:
• Because of the indexing provisions of AB 276 and AB 3802, the state will collect $1.4 billion less than otherwise in 1980-81 alone; and
• Cumulative personal income tax revenue reductions will have amounted to $2.4 billion since 1978-79, when AB 3802 first became effective.
$10
8 R E V E 6
N U E 4
2
Chart 16 Effects of Indexing on California Personal
Income Tax Revenues a
(in billions)
c=:J Personal income tax revenues after indexing ~ Revenue Reduction Due to Indexing _ Revenue Reduction Due to One-time Special Credit
$7.0 $-1.4
$ - 0.7 FLL£.LLLoUj
$-0.3
$4.7 $-0.7
$6.3
$4.7 $4.8
1977-78 1978-79 1979-80
$6.8
1980-81 a Estimate prepared by Department of Finance. Detail may not total due to
rounding.
A-53
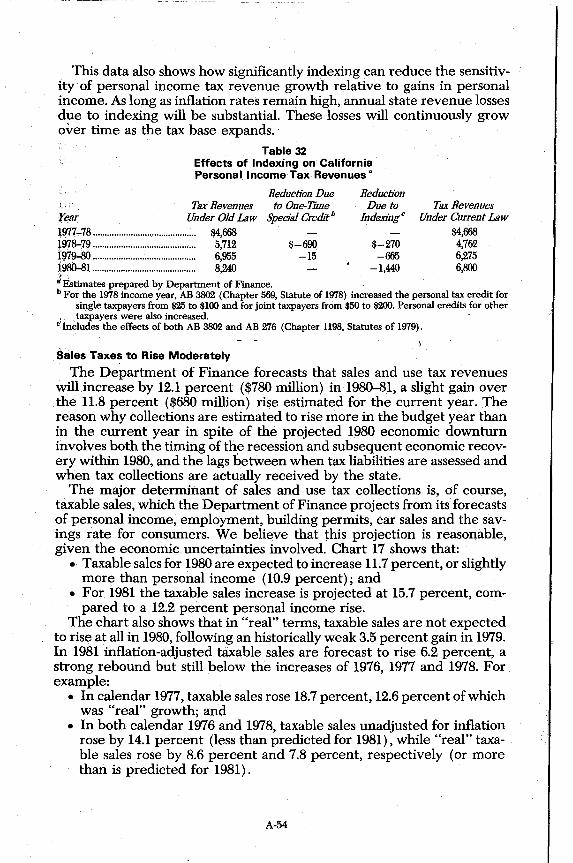
This data also shows how significantly indexing can reduce the sensitivity of personal income tax revenue growth relative to gains in personal income. As long as inflation rates remain high, annual state revenue losses due to indexing will be substantial. These losses will continuously grow over time as the tax base expands.
i: Table 32
Effects of Indexing on California Personal Income Tax Revenues·
Tax Revenues fear Under Old Law
Reduction Due to One-Time
Special Credit b
Reduction Due to
Indexing C
Tax Revenues Under Current Law
1977.,.78............................................. $4,668 1979.,.79............................................ 5,712
~r~:::::::::::::::::::::::::::::::::::::::::::: ~:: $-690
-15 $-270 -665
-1,440
$4,668 4,762 6,275 6,800
·'Estimates prepared by Department of Finance .. b For the 1978 income year, AB 3802 (Chapter 569, Statute of 1978) increased the personal tax credit for
single taxpayers from $25 to $100 and for joint taxpayers from $50 to $200. Personal credits for other , taxpayers were also increased.
c'InCiudes the effects of both AB 3802 and AB 276 (Chapter U98, Statutes of 1979).
Sales Taxes to Rise Moderately
The Department of Finance forecasts that sales and use tax revenues will increase by 12_1 percent ($780 million) in 1980-81, a slight gain over the 11.8 percent ($680 million) rise estimated for the current year. The reason why collections are estimated to rise more in the budget year than in the current year in spite of the projected 1980 economic downturn involves both the timing of the recession and subsequent economic recovery within 1980, and the lags between when tax liabilities are assessed and when tax collections are actually received by the state.
The major determinant of sales and use tax collections is, of course, taxable sales, which the Department of Finance projects from its forecasts of personal income, employment, building permits, car sales and the savings rate for consumers. We believe that this projection is reasonable, given the economic uncertainties involved. Chart 17 shows that:
• Taxable sales for 1980 are expected to increase 11.7 percent, or slightly more than personal income (10.9 percent); and
• For 1981 the taxable sales increase is projected at 15.7 percent, compared to a 12.2 percent personal income rise.
The chart also shows that in "real" terms, taxable sales are not expected to rise at all in 1980, following an historically weak 3.5 percent gain in 1979. In 1981 inflation-adjusted taxable sales are forecast to rise 6.2 percent, a strong rebound but still below the increases of 1976, 1977 and 1978. For example:
• In calendar 1977, taxable sales rose 18.7 percent, 12.6 percent of which was "real" growth; and
• In both calendar 1976 and 1978, taxable sales unadjusted for inflation rose by 14.1 percent (less than predicted for 1981), while "real" taxable sales rose by 8.6 percent and 7.8 percent, respectively (or more than is predicted for 1981).
A-54

AnnUllI Percent Change
20%
18
16
14
12
10
8
6
4
2
o
-2
Chart 17 Annual Percentage Change in California Taxable Sales
1970-81 a
r---, Percent change in total L--J taxable sales
~ Percent change in "real" ~ taxable salesb
-1.8
18.7
15.5
Projected
~
15.7
1970 1971 1972 1973 1974 1975 1976 1977 1978 1979 1980 1981 . ~ . Source: Department of Finance
Real taxable sales are equal to total taxable sales deflated by the national Consumer Price Index . for all items less food. Percent change for 1980 is zero ..
V\fHIConsumers Increase. Savings?
Because purchases by consumers generate about 70 percent of sales taxes (the remaining 30 percent is generated by business spending), the choice by individuals of how much income to spend or save is a critical determinant of sales and use tax revenues~ From 1970 through 1975, consumers nationally saved an average of almost 7.4 percent of their income. Since 1975, however, the economic expansion has been supported by strong consumer spending and record levels of borrowing and credit expansion. Thus, the percent of income saved by consumers has steadily fallen. In the fourth quarter of 1979, the share of income saved was only 3.3 percent, the lowest level in 29 years.
Whether or not consumers as a group will begin to increase the portion of income they save is a subject of great debate among forecasters, and will strongly affect the state's sales and use tax collections. Many economists argue that savings will remain low because of inflation-induced buying, and the low cost of borrowing when interest rates are adjusted for inflation. They buttress these arguments by noting that the government's measure of "savings" is highly suspect. Yet, there are many economists
3-80045 A-55
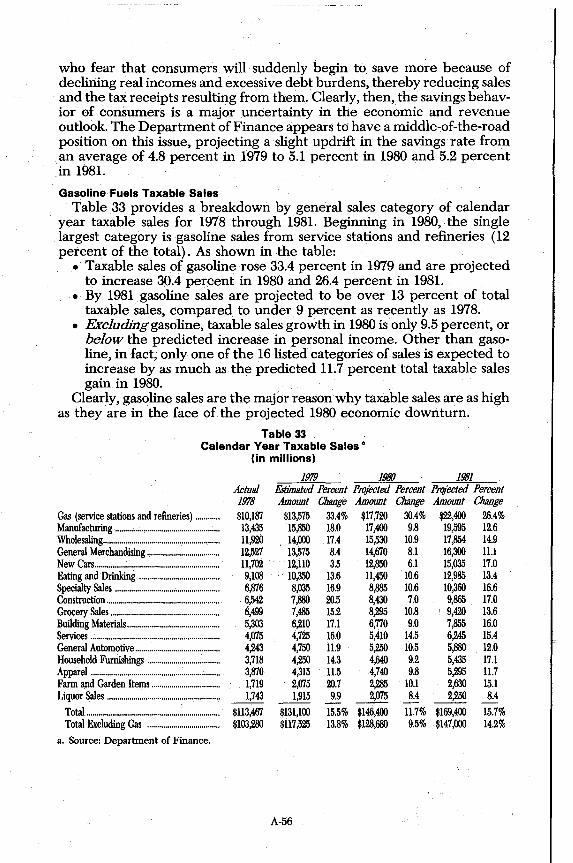
who fear that consumers will suddenly begin to save more because of declining real incomes and excessive debt burdens, thereby reducing sales and the tax receipts resulting from them. Clearly, then, the savings behavior of consumers is a major uncertainty in the economic and revenue outlook. The Department of Finance appears td have a middle~of-the-road position on this issue, projecting a slight up drift in the savings rate from an average of 4.8 percent in 1979 to 5.1 percent in 1980 and 5.2 percent in 1981.
Gasoline Fuels Taxable Sales Table 33 provides a breakdown by general sales category of calendar
year taxable sales for 1978 through 1981. Beginning in 1980, the single largest category is gasoline sales from service stations and refineries (12 percent of the total). As shown in the table:
• Taxable sales of gasoline rose 33.4 percent in 1979 and are projected to increase 30.4 percent in 1980 and 26.4 percent in 1981.
• By 1981 gasoline sales are projected to be over 13 percent of total taxable sales, compared to under. 9 percent as recently as 1978.
• ExcJudinggasoline, taxable sales growth in 1980 is only 9.5 percent, or below the predicted increase in personal income. Other than gasoline, in fact, only one of the 16 listed categories of sales is expected to increase by as much as the predicted 11.7 percent total taxable sales gain in 1980.
Clearly, gasoline sales are the majdr reason why taxable sales are as high as they are in the face of the projected 1980 economic downturn.
Table 33 Calendar Year Taxable Sales'
(in millions)
Gas (service stations and refineries) .......... .. Manufacturing .. : ................................................ . Wholesaling ........................................................ .. General Merchandising .................................. .. New Cars ............................................................. . Eating and Drinking ...................................... .. Specialty Sales ................................................... . Construction ....................................................... . Grocery Sales ..................................................... . Building Materials ............................................ .. Services .............................................................. .. General Automotive ......................................... . Household Furnishings .................................. .. Apparei ....................................................... ; ....... . Farm and Garden Items ................................ .. Liquor Sales ....................................................... .
Total ................................................................ .. Total Excluding Gas .................................. ..
a. Source: Department of Finance.
Actual 1978 $10,187
13,435 11,920 12,527 11,702 9,108 6,876 6,542 6,499 5,303 4,075 4,243 3,718 3,870 1,719 1,743
$113,467 $103,280
1979 1980 1981 Estimated Percent Projected Percent Pro/ected Percent Amount Change Amount Change Amount Change
$13,575 33.4% $17,720 30.4% $22,400 26.4% 15,850 18.0 17,400 9.8 19,595 12.6 14,000 17.4 15,530 10.9 17,854 14.9
. 13,575 8.4 14,670 8.1 16,300 ILl 12,110 3.5 12,850 6.1 15,035 17.0 10,350 13.6 11,450 10.6 12,985 13.4 8,035 16.9 8,885 10.6 10,360 16.6 7,880 20.5 8,430 7.0 9,865 17.0 7,485 15.2 8,295 10.8 i 9,420 13.6 6,210 17.1 6,770 9.0 7,855 16.0 4,725 16.0 5,410 14.5 6,245 15.4 4,750 11.9 5,250 10.5 5,880 12.0 4,250 14.3 4,640 9.2 5,435 17.1 4,315 11.5 4,740 9.8 5,295 11.7 2,075 20.7 2,285 10.1 2,630 15.1 ~ 9.9 2,075 8.4 2,250 8.4
$131,100 15.5% $146,400 11.7% $169,400 15.7% $117,525 13.8% $128,680 9.5% $147,000 14.2%
A-56

Consumers to Pay $3.3 Billion More for Gasoline in 1980
The anticipated gains in taxable gasoline sales-the majority of which represent retail sales to consumers-reflect a combination of rapid price increases and relatively stable physical consumption. As indicated in Table 34 below:
• California retail gasoline prices per gallon are predicted by the Department of Finance to rise from an average of $0.86 in 1979 to $1.15 in 1980 (a gain of 33.7 percent), and to $1.43 in 1981 (a gain of 24.3 percent), while gasoline consumption in gallons is predicted to hold steady in 1980, and then rise by slightly over 2 percent in 1981 as the economy strengthens.
As a result: • Expenditures on gasoline by consumers are predicted by the Depart
ment of Finance to rise by $3.3 billion (33.8 percent) in 1980 and $3.5 billion (27 percent) in 1981. Thus, almost one out of every seven new dollars of California's personal income is expected to go for gasoline purchases in 1980. This will come at the expense of consumption in other goods and services categories.
Table 34 Department of Finance Assumptions
Regarding Gasoline Prices and Consumption Levels
GaDonsof Calendar Year Gasoline Sold
(miUions) 1978........................................................................................ 11,387 1979........................................................................................ 11,220 1980 ........................................................................................ 1l/lf)5 1981........................................................................................ 11,468 a Before sales tax.
A verage Price Per Ga/lon of Gasoline a
$0.64 0.86 1.15 1.43
Dollar Amount of Retail
Gasoline $ales a
(hiUions) $7.3 9.6
12.9 16.4
Obviously, the department's assumptions about gasoline prices and consumption must be highly qualified because of uncertainty regarding the impacts of domestic oil price decontrol and "excess profits" taxation, future OPEC decisions, the Iranian situation, and the possibility of a recession. It is quite possible, for example, that the department's projections of gasoline price increases could prove conservative.
Transportation Planning and Development Account Transfers Jump
The impact of rapidly increasing gasoline sales on General Fund sales and use tax collections has been partially offset by increased transfers of funds from the General Fund to the Transportation Planning and Development (TP and D) Account. As a result ofSB 620 (Chapter 161, Statutes of 1979), these transfers are now computed using a formula which consid-
A-57

ers (a) the amount of sales tax revenues raised by a Y4 percent tax rate applied to alltaxable sales (including gasoline) and (b) the amount of sales tax revenues raised on gasoline sales alone using a 5 percent tax rate. If the amount computed under (b) exceeds that under (a), the excess is transferred to the TP and D Account from the General Fund.
Last January, this transfer was estimated to be zero for 1979-80. However, as a result of both higher gasoline prices and SB 620, the transfer is now projected at $110 million for the current year and $125 million for the budget year. Both amounts are the maximum allowed under the law.
Bank and Corporation Taxes-Mild Gain
The Department of Finance predicts that bank and corporation tax revenues will reach $2.7 billion in 19B0-81, a mild gain of 6.1 percent (about $160 million) over the current year. However, revenues from this source are notoriously difficult to project accurately. This is especially true for 19B0-81, for two reasons:
• First, corporate profits can be highly volatile during economic downturns, such as Finance forecasts. One cause of this is that businesses satisfy demand partly from unwanted inventories as well as from new production. As the former are liquidated, large profits can emerge depending on past and present price levels and inflation rates, and on the exact inventory tax accounting methods used. In 1974, for example, inventory profits rose to over $40 billion nationally compared to less than $20 billion in 1973 and $12 billion in 1976. Unfortunately, there is no reliable way of accurately predicting inventory profits .
• Second, federal government policies regarding decontrol of energy prices and "excess profits" taxation are not entirely resolved, nor are their prebable impacts on the costs and availability of energy to consumers and businesses agreed upon.
Corporate Profits Growth to Deteriorate in 1980
As shown earlier in Table 21, Finance assumes that 19BO national corporate profits before taxes will fall by B.3 percent because of the projected recession. This contrasts with a 13.6 percent gain in 1979, and a projected 1B.7 percent rebound in 19B1.
Based upon this national forecast, Chart 1B shows that 19BO California taxable profits are predicted to be unchanged from 1979 at $26.3 billion, and then rise by 1B.5 percent in 19B1 to $31.2 billion. These figures include a special allowance for increased profits resulting from federal decontrol of oil prices equal to $170 million in 19BO and $230 million in 19B1. The department anticipates revising the latter figures as more data becomes available regarding both the impacts of decontrol on energy costs and availability, and federal government decisions about excess oil profits taxation. It should be remembered that while decontrol will raise profits in certain industry sectors (e.g., those selling energy), it may reduce profits in others (e.g., those consuming energy).
A-58

:r,
Annual Percent Change
30%
25
20
15
10
5
Chart 18 Annual Percent Growth In California
Taxable Corporate Profits 1971-19810
1971 1972 1'173 1974 1975 1976 1977 1978 1979 1980 1981
o Source: Department of Flllance. b Includes $335 mil60n reduction We to change in depletion ollowance. c Preliminary estimate. Includes $967 million increase We to Proposition 13. d Preliminary estimate.
Major Bank and Corporation Tax Legislation
Three major pieces of legislation were enacted in 1979 dealing with the bank and corporation tax:
• First, AB 66 (Chapter 1150) increased the general corporation tax rate ,i from 9 percent to 9.6 percent for fiscal years ending in 1980 and
.' thereafter. This was done in order to offset the increased state costs of reimbursing local governments for property taxes lost due to the complete exemption of business inventories from, property taxation under the bill. It also made banks subject to the $200 minimum franchise tax and several 'other taxes, increased the bank tax rate and changed the tax treatment of nonbank financial institutions. Lastly, it repealed the "litter tax" and replaced the lost revenue with a transfer from the General Fund to the litter fund.
• Second, AB 93 (Chapter 1168) conformed various state bank and corporation tax provisions to federal law.
• Third, SB 93 (Chapter 1182) provided a tax credit.to employers of persons eligible for certain welfare programs.
Table 35 summarizes the net impact of these bills on bank and corporation tax revenues for the current and budget years. Collectively, they will raise 1980-81 General Fund revenues by nearly $104 million, including $115 million due to AB 66.
A-59
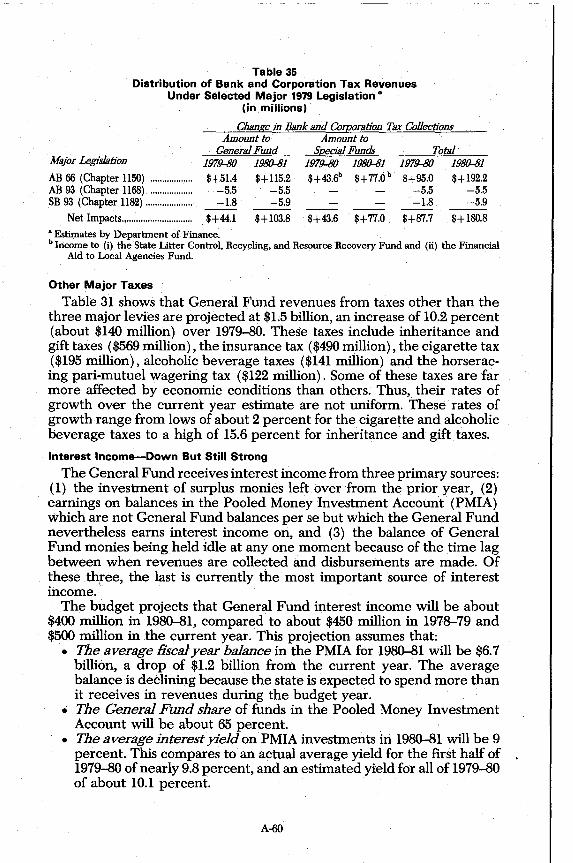
Table 35 Distribution of Bank and Corporation Tax Revenues
Under Selected Major 1979 Legislation· (in millions)
Change in Bank and Corporation Tax CoUections
Major Legislation
AB 66 (Chapter 1150) ................. . AB 93 (Chapter 1168) ................. . SB 93 (Chapter 1182) ................... .
Net Impacts ............................. .
Amount to General Fund
1979-80 1980-81 $+51.4 $+ 115.2
-5.5 -5.5 -1.8 -5.9
$+44.1 $+ 103.8
Amount to Special Funds
1979-80 1980-81 $+43.6b $+77.0 b
$+43.6 $+ 77.0
Total 1979-80 1980-81 $+95.0 $+192.2
-5.5 -5.5 -1.8 -5.9
$+87.7 $+ 1BO.8
• Estimates by Department of Finance. b Income to (i) the State Litter Control, Recycling, and Resource Recovery Fund and (il) the Financial
Aid to Local Agencies Fund.
Other Major Taxes
Table 31 shows that General Fund revenues from taxes other than the three major levies are projected at $1.5 billion, an increase of 10.2 percent (about $140 million) over 1979-80. These taxes include inheritance and gift taxes ($569 million) , the insurance tax ($490 million), the cigarette tax ($195 million), alcoholic beverage taxes ($141 million) and the horseracing pari-mutuel wagering tax ($122 million). Some of these taxes are far more affected by economic conditions than others. Thus, their rates of growth over the current year estimate are not uniform. These rates of growth range from lows of about 2 percent for the cigarette and alcoholic beverage taxes to a high of 15.6 percent for inheritance and gift taxes.
Interest Income-Down But Still Strong
The General Fund receives interest income from three primary sources: (1) the investment of surplus monies left over from the prior year, (2) earnings on balances in the Pooled Money Investment Account (PMIA) which are not General Fund balances per se but which the General Fund nevertheless earns interest income on, and (3) the balance of General Fund monies being held idle at anyone moment because of the time lag between when revenues are collected and disbursements are made. Of these three, the last is currently the most important source of interest income. C
The budget projects that General Fund interest income will be about $400 million in 1980-81, compared to about $450 million in 1978--79 and $500 million in the current year. This projection assumes that:
• The average fiscal year balance in the PMIA for 1980-81 will be $6.7 billion, a drop of $1.2 billion from the current year. The average balance is declining because the state is expected to spend more than it receives in revenues during the budget year.
• The General Fund share of funds in the Pooled Money Investment Account will be about 65 percent. .
• The average interest yield on PMIA investments in 1980-81 will be 9 percent. This compares to an actual average yield for the first half of 1979-80 of nearly 9.8 percent, and an estimated yield for all of 1979-80 of about 10.1 percent.
A-60

Interest income forecasts have required large revisions in recent years, partly because of the unpredictability of interest rates. Last January, for example, the average PMIA yield for 1979-80 was predicted to be only 7% percent, far below the 10.1 percent now estimated. For this reason alone, current year interest income was underestimated by over $100 million. Because the outlook for inflation is so uncertain and inflation rates directly impact interest rates, the 1980-81 interest income estimate will undoubtedly require future revisions.
Final Full Year for Federal Revenue Sharing
In 1980-81, the General Fund will receive a $276.2 million transfer fromthe Federal Revenue Sharing Fund. However, the Federal Revenue Sharing program for states is scheduled to terminate in September 1980. Thus, unless Congress decides to extend the program for states, California's Federal Revenue Sharing Fund will show a balance of only $160.9 million on June 30, 1981, and the General Fund will receive only this amount in 1981-82. Thereafter, the General Fund will receive no further revenue sharing monies.
Special Fund Revenues
Combined revenues from all state special funds are projected to reach nearly $3.1 billion in 1980-81, or 9.8 percent ($275 million) above the current year estimate (see Table 31).
About two-thirds of the revenues from these special funds come from motor vehicle-related levies, including gasoline taxes, license fees and registration fees. These vehicle-related levies are expected to rise by about $100 million (4.9 percent) in the budget year, to a level of about $2 billion. Ot . this total, over $900 million represents fuel taxes imposed on a per gMlon basis.
,:As shown in Table 31, 1980-81 fuel tax revenue growth is projected to b~ only 1.8 percent. Although up from the 1.1 percent decline estimated for the current year, this rate is well below the 5.5 percent gain registered in the prior year. This low growth reflects the drop off in gasoline consumption discussed earlier which is due to the combination of changes in the automobile mix, increasing fuel economies, reduced demand due to the slowing in economic growth, and the impacts of higher gasoline prices on consumption. Thus, higher gasoline prices reduce the growth in fuel tax revenues, even though they tend to stimulate sales and use tax revenues. The fuel tax estimate assumes that average gasoline consumption per vehicle will drop from 622 gallons in 1978-79 to 605 gallons in 1979-80 and 598 gallons in 1980-81. Vehicle registration and license fees are projected at almost $1.2 billion in the budget year, up 8 percent from 1979-80. This projection assumes a 2.3 percent average annual increase in vehicle registrations from 1979 to 1981, and a total stock of 19.7 million registered vehicles in California by the end of 1981.
Three other sources of special fund income deserve mention: • As discussed earlier, the Transportation Planning and Development
Account will receive $125 million in 1980-81 from sales and use tax collections because of both higher gasoline prices and the provisions of SB 620 (Chapter 161, Statutes of 1979), up from $110 million in the
A-61
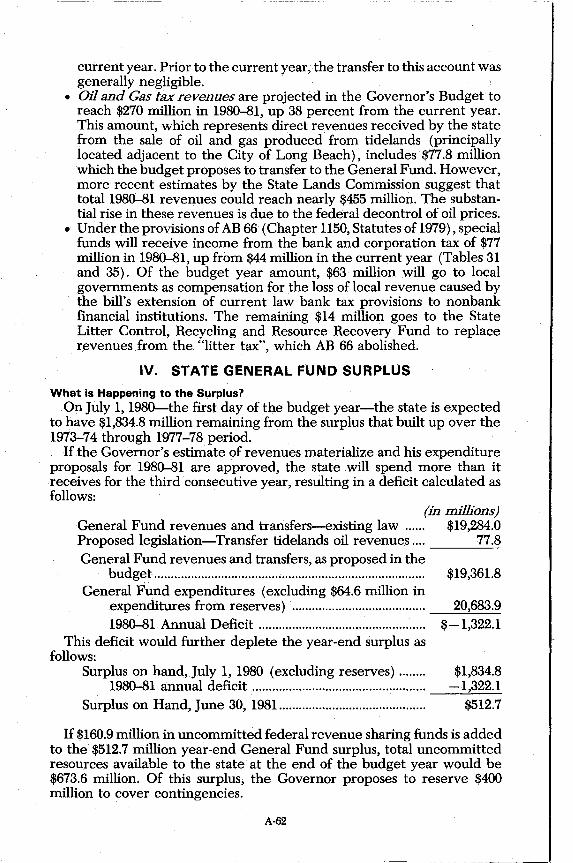
current year. Prior to the current year, the transfer to this account was generally negligible .
• Oil and Gas tax revenues are projected in the Governor's Budget to reach $270 million in 1980-81, up 38 percent from the current year. This amount, which represents direct revenues received by the state from the sale of oil and gas produced from tidelands (principally located adjacent to the City of Long Beach), includes $77.8 million which the budget proposes to transfer to the General Fund. However, more recent estimates by the State Lands Commission suggest that total 1980-81 revenues could reach nearly $455 million. The substantial rise in these revenues is due to the federal decontrol of oil prices .
• Under the provisions of AB 66 (Chapter 1150, Statutes of 1979), special funds will receive income from the bank and corporation tax of $77 million in 1980-81, up from $44 million in the current year (Tables 31 and 35). Of the budget year amount, $63 million will go to local governments as compensation for the loss of local revenue caused by the bill's extension of current law bank tax provisions to nonbank financial institutions. The remaining $14 million goes to the State Litter Control, Recycling and Resource Recovery Fund to replace revenues from the "litter tax", which AB 66 abolished.
IV. STATE GENERAL FUND SURPLUS
What is Happening to the Surplus? On July 1, 1980-the first day of the budget year-the state is expected
to have $1,834.8 million remaining from the surplus that built up over the 1973-74 through 1977-78 period. .
If the Governor's estimate of revenues materialize and his expenditure proposals for 1980-81 are approved, the state will spend more than it receives for the third consecutive year, resulting in a deficit calculated as follows:
(in millions) General Fund revenues and transfers-existing law...... $19,284.0 Proposed legislation-Transfer tidelands oil revenues .... 77.8 General Fund revenues and transfers, as proposed in the
budget ................................................................................. $19,361.8 General Fund expenditures (excluding $64.6 million in
e~penditures from reserves) ........................................ 20,683.9 1980-81 Annual Deficit .................................................. $-1,322.1
This deficit would further deplete the year-end surplus as follows:
Surplus on hand, July 1, 1980 (excluding reserves) ...... .. 1980-81 annual deficit .................................................. ..
Surplus on Hand, June 30, 1981 .......................................... ..
$1,834.8 -1,322.1
$512.7
If $160.9 million in uncommitted federal revenue sharing funds is added to the $512.7 million year-end General Fund surplus, total uncommitted resources available to the state at the end of the budget year would be $673.6 million. Of this surplus, the Governor proposes to reserve $400 million to cover contingencies.
A-62

The surplus projected in the budget depends on a number of critical assumptions involving:
• Legislation to authorize $77.8 million in transfers to the General Fund from. tidelands oil revenues.
• The accuracy of the revenue estimates (including tidelands oil estimates).
• The performance of the California economy. • The willingness of California consumers to continue increasing their
spending at a higher rate than their income is increasing. • The amount of federal revenue sharing funds provided to the state
during the budget year. • Increases in the cap on federal Title XX funds for social services. • Whether the $200 million of unidentified expenditure savings in the
Governors Budget will be realized. • New fiscal legislation that might be passed in addition to the Budget
Bill. • Proposition 9 on the June 1980 ballot-the new Jarvis Income Tax
Initiative.
Trends in the Surplus Since Fiscal Year 1973-74
In order to provide perspective on the financial condition of the General Fund in 1980-81, it is useful to see how and why the surplus grew, and how this trend has been reversed. Table 36 and Chart 19 show the year-toyear changes in the year-end surplus since 1973-74. The 1973-74 fiscal year is chosen as the beginning year because it marks the start of the period during which the General Fund surplus accumulated . ..•.. The year-end surplus at the end of 1973-74 was $180 million. It grew continuously through 1977-78, reaching a high of $3,686 million on June 30, 1978. Following the passage of Proposition 13, however, the state began s'pending more than it was receiving on an annual basis and as a result, the upward trend was reversed .
.. Changes in the year-end surplus reflect the annual General Fund surplus or deficit for each fiscal year. The annual surplus or deficit is the difference between resources received and funds expended during any one fiscal year. After incurring an annual deficit of $444 million in 1973-74, the state began realizing large and growing annual surpluses. The annual surplus was $350 million in 1974-75 and reached $1,914 million in 1977:....78. This was the largest annual surplus in the state's history.
In response to the passage of Proposition 13, state General Fund expenditures increased sharply, and a pattern of annual deficits began, as shown in Chart 20. The annual deficit was $1,057 million in 1978-79. It is projected to be $845 million in 1979-80 and $1,322 million in 1980-81. The annual deficit proposed by the Governor for the budget year would be the largest in the state's history.
A-63

Millions of
Dollars
$5,000
4,000
3,000
2,000
1,000
Chart 19 General Fund Unrestricted Surplus
1973;..74 to 1980-81 (Excluding Federal Revenue Sharing Fund)
(in millions)
$3,682.1
, '" , ,
", $1,834.8
,\ , \ , , , , , ,
\
\ , $512.7 '.
O~----~----------~----------------~-------------------
Annual Surplus (Deficit)/ -$845.4
-1,000
_,A, ,. ... ' " ....
-$1,056.8 ""' ...
-$1,322.1
-2,000
1973-74 1974-75 1975-76 1976-77 1977-78 1978-79 1979-80 1980-81 (Estimated) (Proposed)
Fiscal Year
A-64
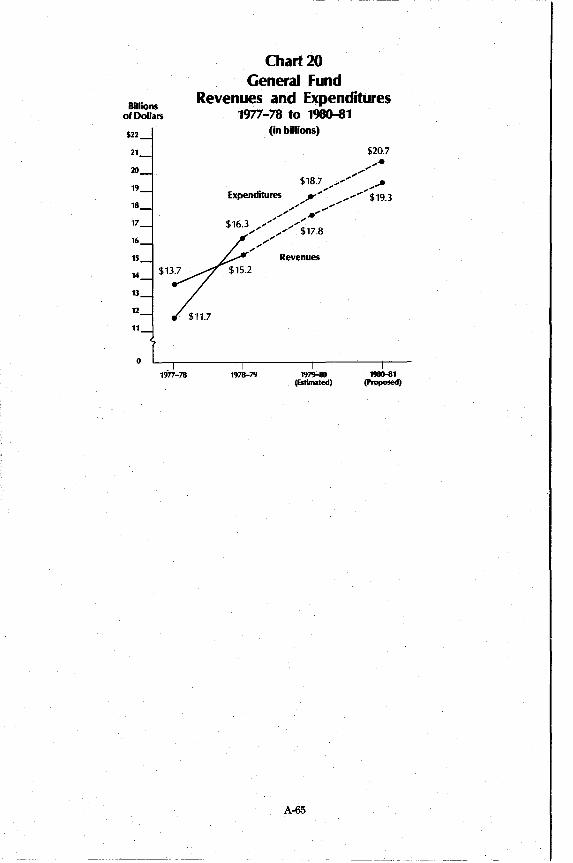
Billions of Dollars
$22
21
20
19
18
17
16
lS
14
13
12
11
o
Chart 20 General Fund
Revenues and Expenditures 1977';"78 to 1980-81
1978-79
(in billions)
197'.HIO (Estirmted)
A-65
1980-81 (Proposed)
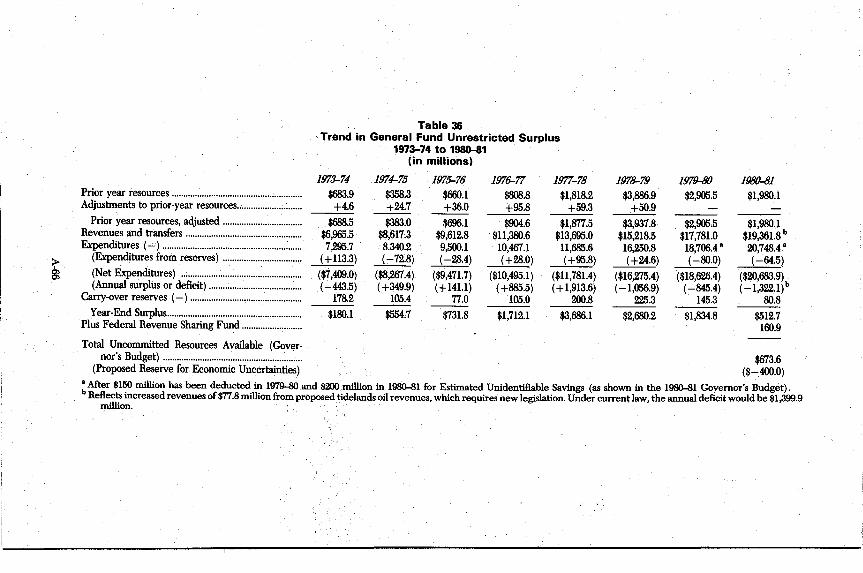
~
Prior year resources ........................................... : ........... . Adjustments to prior-year resources .......................... ..
Prior year resources, adjusted ................................ .. Revenues and transfers ................................................ .. Expenditures (-) .......................................................... ..
(Expenditures from reserves) ................................ ..
(Net Expenditures) .................................................. .. (Annual surplus or deficit) ...................................... ..
Carry-over reserves (-) .............................................. ..
Year-End Surplus ........................................................ .. Plus Federal Revenue Sharing Fund ........................ ..
Total Uncommitted Resources Available (Gover-nor's Budget) .......................................................... ..
(Proposed Reserve for Economic Uncertainties)
Table 36 Trend in General Fund Unrestricted Surplus
1973-74 to 1980--81
1973-74
$683.9 +4.6
$688.5 $6,965.5 7;lNJ.7
(+113.3) ($7,409.0) (-443.5)
178.2
$1SO.1
(in millions)
1974-75
$358.3 +24.7
$383.0 $8,617.3 8.340.2 (-72.8)
($8,267.4) (+349.9)
105.4
$554.7
197~76
$660.1 +36.0
$696.1 $9,612.8 9,500.1 (-28.4)
($9,471.7) ( +141.1)
77.0
$731.8
1976-77
$808.8 +95.8
$904.6 $11,380.6 10,467.1 (+28.0)
($10,495.1) (+885.5)
105.0
$1,712.1
1977-78 $1,818.2
+59.3 $1,877.5
$13,695.0 11,685.6 (+95.8)
($11,781.4) (+1,913.6)
200.8
$3,686.1
1978-79
$3,886.9 +50.9
$3,937.8 $15,218.5 16,250.8 (+24.6)
($16,275.4) (-1,056.9)
225.3
$2,680.2
1!J79.../J{)
$2,905.5
$2,905.5 $17,781.0 18,706.4 • (-SO.O)
($18,626.4) ( -845.4)
145.3
$1,834.8
1980-81 $1,980.1
$1,9SO.1 $19,361.8 b
20,748.4 • (-64.5)
($20,683.9) ( -1,322.1) b
SO.8
$512.7 160.9
$673.6 ($-400.0)
• After $150 million has been deducted in 1979-80.and $200 million in 1980-81 for Estimated Unidentifiable Savings (as shown in the 1980-81 Governor's Budget). b Reflects increased revenues of $77.8 million from proposed tidelands oil revenues, which requires new legislation. Under current law, the annual deficit would be $1,399.9
million.