Embed Size (px)
Citation preview
Available online at www.sciencedirect.com
www.elsevier.com/locate/asr
ScienceDirect
Advances in Space Research xxx (2015) xxx–xxx
Analysis of systematic differences from GPS-measured andGRACE-modeled deformation in Central Valley, California
Weijie Tan a,c,⇑, Danan Dong b, Junping Chen a, Bin Wu a
aShanghai Astronomical Observatory, Chinese Academy of Sciences, Shanghai 200030, PR ChinabSchool of Information Science & Technology, East China Normal University, Shanghai 200242, PR China
cUniversity of Chinese Academy of Sciences, Beijing 100049, PR China
Received 5 May 2015; received in revised form 28 August 2015; accepted 29 August 2015
Abstract
Crustal seasonal displacement signals, which are commonly attributed to surface mass redistributions, can be measured by continuousGPS, modeled by GRACE and loading models. Previous studies have shown that the three methods generally agree with one another.However, the discrepancy among them in some regions has not yet been investigated comprehensively. In this paper, we compare thevertical annual displacement signals in the Central Valley, California derived from GPS, GRACE and loading models. The results showa general agreement from these three methods for most sites, which reach the maximum during the dry late summer and autumn. Irreg-ular annual terms with peaks during the wet winter and spring are detected from GPS solutions for the sites located in places with exten-sive groundwater depletion. However, annual vertical variations for these same sites derived from GRACE and loading models reach themaximum in August and minimum in February. To explain such apparent discrepancy, we find that the vertical components of abnormalsites show a strong correlation with in situ groundwater data, which display peaks during cold months. In addition, with the assistance ofwater table depth data, we perform hydrological simulations based on Terzaghi’s Principle, Mogi’s Model and Green’s function method.The results suggest that the discrepancy from GPS-measured and GRACE-modeled deformation is induced by the seasonal variations ofgroundwater.� 2015 COSPAR. Published by Elsevier Ltd. All rights reserved.
Keywords: Crustal seasonal displacement; Discrepancy; GPS; GRACE
1. Introduction
With the rapid development of space geodesy techniquesand surface mass loading models, the seasonal surface massredistribution signals have been detected by surface dis-placement observations and gravity observations, and areconfirmed by mass loading simulation models. Using glo-bal continuous GPS (Global Positioning System) time ser-ies and loading models, Dong et al. (2002) confirmed that
http://dx.doi.org/10.1016/j.asr.2015.08.034
0273-1177/� 2015 COSPAR. Published by Elsevier Ltd. All rights reserved.
⇑ Corresponding author at: Shanghai Astronomical Observatory,Chinese Academy of Sciences, Shanghai 200030, PR China. Tel.: +8602134775218.
E-mail address: [email protected] (W. Tan).
Please cite this article in press as: Tan, W., et al. Analysis of systematic dCentral Valley, California. Adv. Space Res. (2015), http://dx.doi.org/10.1
�40% of annual vertical variations for site positions arerelated to surface mass redistributions. Later, Davis et al.(2004) suggested that annual displacement over the Ama-zon River Basin measured by GPS and modeled byGRACE (Gravity Recovery and Climate Experiment) datashow a high agreement that proved the feasibility of deriv-ing crustal seasonal variations from GRACE. Recent stud-ies have focused on the combination of GPS, GRACE andloading models to infer earth’s annual deformation (Donget al., 2006; King et al., 2006; van Dam et al., 2007;Tregoning and Watson, 2009; Tesmer et al., 2011; Fuet al., 2012; Fu and Freymueller, 2012; Nahmani et al.,2012; Demir and Dogan, 2014).
ifferences from GPS-measured and GRACE-modeled deformation in016/j.asr.2015.08.034
2 W. Tan et al. / Advances in Space Research xxx (2015) xxx–xxx
Results from studies using GPS, GRACE, and loadingmodels have concluded that the main contributors to sea-sonal surface displacement are changes in atmospheric sur-face pressure, non-tidal oceanic mass loading, andterrestrial water storage (soil moisture, snow, and ground-water). In addition, the magnitude of annual and inter-annual variations from the three methods shows a goodagreement at the global scale (Tregoning and Watson,2009; Tesmer et al., 2011). However, systematic differences(magnitude and phase differences in annual and subannualterms) in the results of the three methods still exist in someregions, which could be caused by geophysical processesand technique errors. For example, the discrepancybetween GPS and GRACE results is related to the localhydrological loading effects in West Africa (Nahmaniet al., 2012). The low spatial resolution of GRACE mea-surement is also a significant source contributor to this dis-crepancy (Khan et al., 2010).
More accurate results and interpretations of seasonalvariations could be obtained through observation integra-tion and global inversion of multiple techniques and mod-els (Fu et al., 2013; Jin et al., 2013; Amos et al., 2014). Toensure the precision and accuracy from the multiple tech-nique integration, however, the systematic differencesbetween techniques and models must be carefullyinvestigated.
The aim of this study is to explain the differencesbetween GPS-measured and GRACE-modeled seasonalvertical variations in site positions. The study also usesloading models to provide additional information aboutthe surface displacement caused by atmosphere, non-tidalocean, snow and soil mass loading. We chose the CentralValley, California, as an example to examine the discrep-ancy between GPS and GRACE observations. The datasetting and the comparison for earth’s annual variationsare presented in Section 2. Potential sources responsibleto the discrepancy between GPS and GRACE derived dis-placement and potential deformation are explored in Sec-tion 3. In order to give a theoretical explanation for thediscrepancy, hydrological surface displacement are simu-lated with Terzaghi’s Principle, Mogi’s Model and Green’sfunction method. Finally, the groundwater mass redistribu-tion effects in systematic differences in GPS and GRACEobservations are summarized in Section 4.
2. Seasonal deformation in Central Valley, California
2.1. GPS, GRACE, and loading models
In this study, we used 60 daily GPS time series in Cen-tral Valley, California from 1996 to 2014 provided by theScripps Orbital and Permanent Array Center (http://so-pac.ucsd.edu/) to get the GPS vertical annual displacementsignals.
We used the gravity components from GRACE Level-2RL-05 solutions provided by CSR (Center for SpaceResearch) from 2003 to 2014 (ftp://podaac.jpl.nasa.gov/
Please cite this article in press as: Tan, W., et al. Analysis of systematic dCentral Valley, California. Adv. Space Res. (2015), http://dx.doi.org/10.1
allData/grace/L2/CSR). As we focus on the ground dis-placement, we need to transform GRACE gravity observa-tions into surface mass variations (Wahr et al., 1998) andthen we compute site position variations of each GPS sta-tions following the procedure of Farrell (1972) with theload love numbers from the Preliminary Reference EarthModel (PREM) (Dziewonski and Anderson, 1981). Dueto the uncertainties of GRACE stokes coefficients at highdegrees (Wahr et al., 2004), we perform Gaussian smooth-ing with 350 km averaging radius to reduce the error. Inorder to compare the deformation from GPS and loadingresults, we include the GAC solutions (the atmosphereand ocean mass effects) to estimate the whole deformationinduced by atmosphere, ocean, snow and soil. SinceGRACE is unable to provide degree one terms (Daviset al., 2004), we replace those spherical harmonic coeffi-cients with the results from Swenson et al. (2008). We alsoreplace the C20 terms using with SLR results (Cheng andTapley, 2004) because of the unreliability of C20 fromGRACE. Lastly we compute the vertical deformationsinduced by mass redistributions derived from GRACE.
In addition, loading models of atmosphere, ocean, snowand soil are used to help to measure the well-known sea-sonal contributors’ influences in this study. For the atmo-spheric pressure displacement, we use NCEP’s (http://www.ersl.noaa.gov) 6-h sample, 2.5� � 2.5� spatial resolu-tions. The 12-h sampling model, ECCO (Estimating theCirculation & Climate of the Ocean), is used to computethe surface displacement driven by non-tidal ocean effectsand its spatial resolution is 1� � 0.3–1.0�. The widely usedNoah land model (Ek et al., 2003) from GLDAS (GlobalLand Data Assimilation System) (Rodell et al., 2004), ischosen to calculate the surface displacement caused by soiland snow mass in this paper. The Noah model has a 1.0� �1.0� spatial resolution and 3-h sample interval. We useGreen’s functions (Farrell, 1972) based on the PREMEarth model (Dziewonski and Anderson, 1981) to calculatethe displacement induced by mass loading changes. Sincewe concentrate on seasonal site variations, we smoothedmodeled deformations with a 30-day moving average.
2.2. Seasonal deformations of permanent GPS stations
Seasonal displacement for permanent GPS stations fromthose three approaches are processed with QOCA (Quasi-observation Combination Analysis) software (Donget al., 1998; Dong et al., 2002; Dong et al., 2006). As wemainly focus on annual variations in site positions, theword ‘‘seasonal” represents annual period only in thispaper.
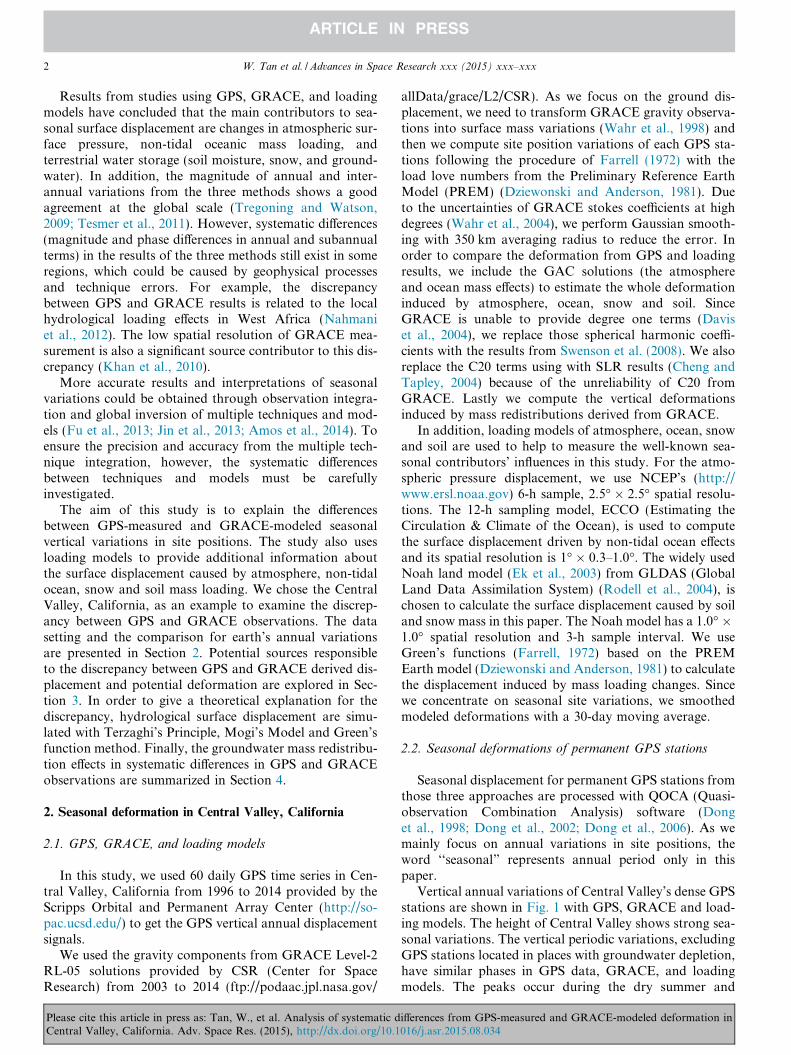
Vertical annual variations of Central Valley’s dense GPSstations are shown in Fig. 1 with GPS, GRACE and load-ing models. The height of Central Valley shows strong sea-sonal variations. The vertical periodic variations, excludingGPS stations located in places with groundwater depletion,have similar phases in GPS data, GRACE, and loadingmodels. The peaks occur during the dry summer and
ifferences from GPS-measured and GRACE-modeled deformation in016/j.asr.2015.08.034
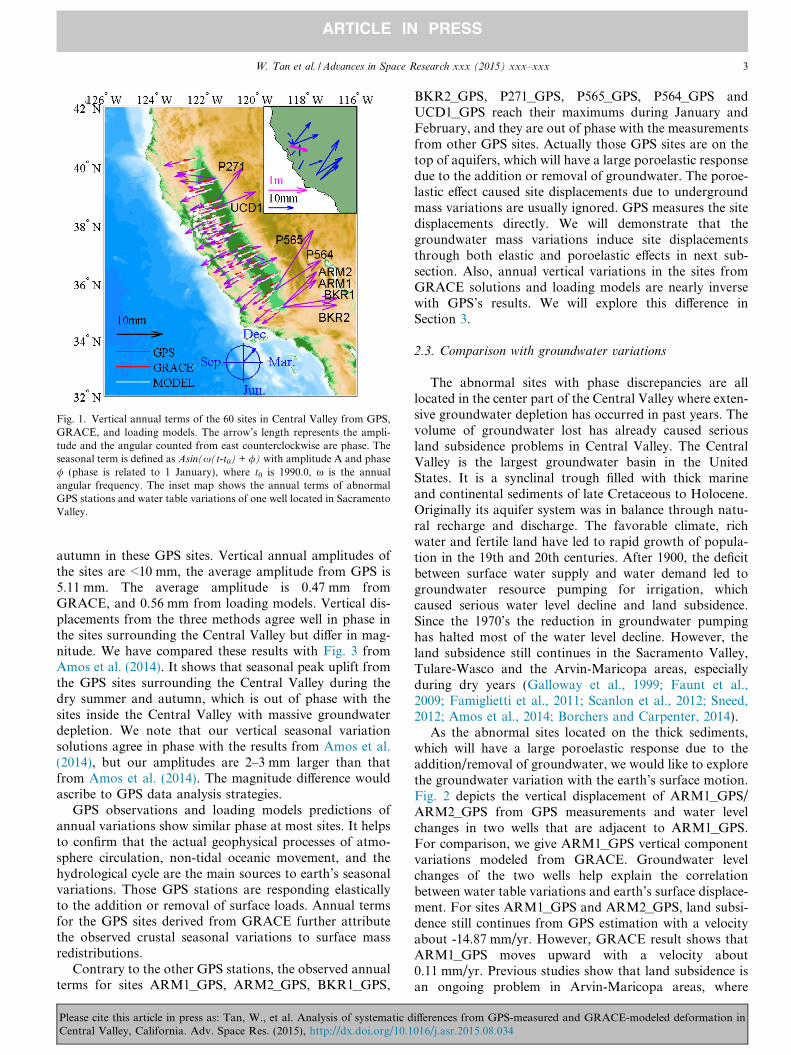
Fig. 1. Vertical annual terms of the 60 sites in Central Valley from GPS,GRACE, and loading models. The arrow’s length represents the ampli-tude and the angular counted from east counterclockwise are phase. Theseasonal term is defined as Asin(x(t-t0) + /) with amplitude A and phase/ (phase is related to 1 January), where t0 is 1990.0, x is the annualangular frequency. The inset map shows the annual terms of abnormalGPS stations and water table variations of one well located in SacramentoValley.
W. Tan et al. / Advances in Space Research xxx (2015) xxx–xxx 3
autumn in these GPS sites. Vertical annual amplitudes ofthe sites are <10 mm, the average amplitude from GPS is5.11 mm. The average amplitude is 0.47 mm fromGRACE, and 0.56 mm from loading models. Vertical dis-placements from the three methods agree well in phase inthe sites surrounding the Central Valley but differ in mag-nitude. We have compared these results with Fig. 3 fromAmos et al. (2014). It shows that seasonal peak uplift fromthe GPS sites surrounding the Central Valley during thedry summer and autumn, which is out of phase with thesites inside the Central Valley with massive groundwaterdepletion. We note that our vertical seasonal variationsolutions agree in phase with the results from Amos et al.(2014), but our amplitudes are 2–3 mm larger than thatfrom Amos et al. (2014). The magnitude difference wouldascribe to GPS data analysis strategies.
GPS observations and loading models predictions ofannual variations show similar phase at most sites. It helpsto confirm that the actual geophysical processes of atmo-sphere circulation, non-tidal oceanic movement, and thehydrological cycle are the main sources to earth’s seasonalvariations. Those GPS stations are responding elasticallyto the addition or removal of surface loads. Annual termsfor the GPS sites derived from GRACE further attributethe observed crustal seasonal variations to surface massredistributions.
Contrary to the other GPS stations, the observed annualterms for sites ARM1_GPS, ARM2_GPS, BKR1_GPS,
Please cite this article in press as: Tan, W., et al. Analysis of systematic dCentral Valley, California. Adv. Space Res. (2015), http://dx.doi.org/10.1
BKR2_GPS, P271_GPS, P565_GPS, P564_GPS andUCD1_GPS reach their maximums during January andFebruary, and they are out of phase with the measurementsfrom other GPS sites. Actually those GPS sites are on thetop of aquifers, which will have a large poroelastic responsedue to the addition or removal of groundwater. The poroe-lastic effect caused site displacements due to undergroundmass variations are usually ignored. GPS measures the sitedisplacements directly. We will demonstrate that thegroundwater mass variations induce site displacementsthrough both elastic and poroelastic effects in next sub-section. Also, annual vertical variations in the sites fromGRACE solutions and loading models are nearly inversewith GPS’s results. We will explore this difference inSection 3.
2.3. Comparison with groundwater variations
The abnormal sites with phase discrepancies are alllocated in the center part of the Central Valley where exten-sive groundwater depletion has occurred in past years. Thevolume of groundwater lost has already caused seriousland subsidence problems in Central Valley. The CentralValley is the largest groundwater basin in the UnitedStates. It is a synclinal trough filled with thick marineand continental sediments of late Cretaceous to Holocene.Originally its aquifer system was in balance through natu-ral recharge and discharge. The favorable climate, richwater and fertile land have led to rapid growth of popula-tion in the 19th and 20th centuries. After 1900, the deficitbetween surface water supply and water demand led togroundwater resource pumping for irrigation, whichcaused serious water level decline and land subsidence.Since the 1970’s the reduction in groundwater pumpinghas halted most of the water level decline. However, theland subsidence still continues in the Sacramento Valley,Tulare-Wasco and the Arvin-Maricopa areas, especiallyduring dry years (Galloway et al., 1999; Faunt et al.,2009; Famiglietti et al., 2011; Scanlon et al., 2012; Sneed,2012; Amos et al., 2014; Borchers and Carpenter, 2014).
As the abnormal sites located on the thick sediments,which will have a large poroelastic response due to theaddition/removal of groundwater, we would like to explorethe groundwater variation with the earth’s surface motion.Fig. 2 depicts the vertical displacement of ARM1_GPS/ARM2_GPS from GPS measurements and water levelchanges in two wells that are adjacent to ARM1_GPS.For comparison, we give ARM1_GPS vertical componentvariations modeled from GRACE. Groundwater levelchanges of the two wells help explain the correlationbetween water table variations and earth’s surface displace-ment. For sites ARM1_GPS and ARM2_GPS, land subsi-dence still continues from GPS estimation with a velocityabout -14.87 mm/yr. However, GRACE result shows thatARM1_GPS moves upward with a velocity about0.11 mm/yr. Previous studies show that land subsidence isan ongoing problem in Arvin-Maricopa areas, where
ifferences from GPS-measured and GRACE-modeled deformation in016/j.asr.2015.08.034
2002 2004 2006 2008 2010 2012 2014−150
−100
−50
0
50
100
150
200
250
GPS
−U
p (m
m)
Year
ARM1_GPSARM2_GPS
50
55
60
65
70
75
80
85
90
95
100
Dep
th b
elow
land
sur
face
(m
eter
)
351952N1189182W001−ARM1
353328N1189409W001−ARM1
−4
−2
0
2
4
6
Gra
ce−
Up
(mm
)
2002 2004 2006 2008 2010 2012 2014
ARM1_Grace
Grace_Fit.
Fig. 2. Black and gray lines are GPS estimated vertical displacements of ARM1_GPS/ARM2_GPS. GRACE inverted vertical deformation forARM1_GPS is the red line. Blue lines are groundwater level changes of two wells that are adjacent to ARM1_GPS. (For interpretation of the references tocolor in this figure legend, the reader is referred to the web version of this article.)
4 W. Tan et al. / Advances in Space Research xxx (2015) xxx–xxx
ARM1_GPS and ARM2_GPS are located (Borchers andCarpenter, 2014). Thus, we would like to confirm thatGRACE modeled displacement has large modeling errorin the two sites.
Besides, groundwater level changes from DWR (Califor-nia Department of Water Resources) data base show astrong coincidence with GPS observed surface deformation(Fig. 2, blue lines). 351952N1189182W001 water well islocated about 1 km away from ARM1_GPS, while well353328N1189409W001 is about 10 km away. Both thetwo wells decline in recent years, corresponding with thesubsidence recorded by ARM1_GPS from GPS solutions.
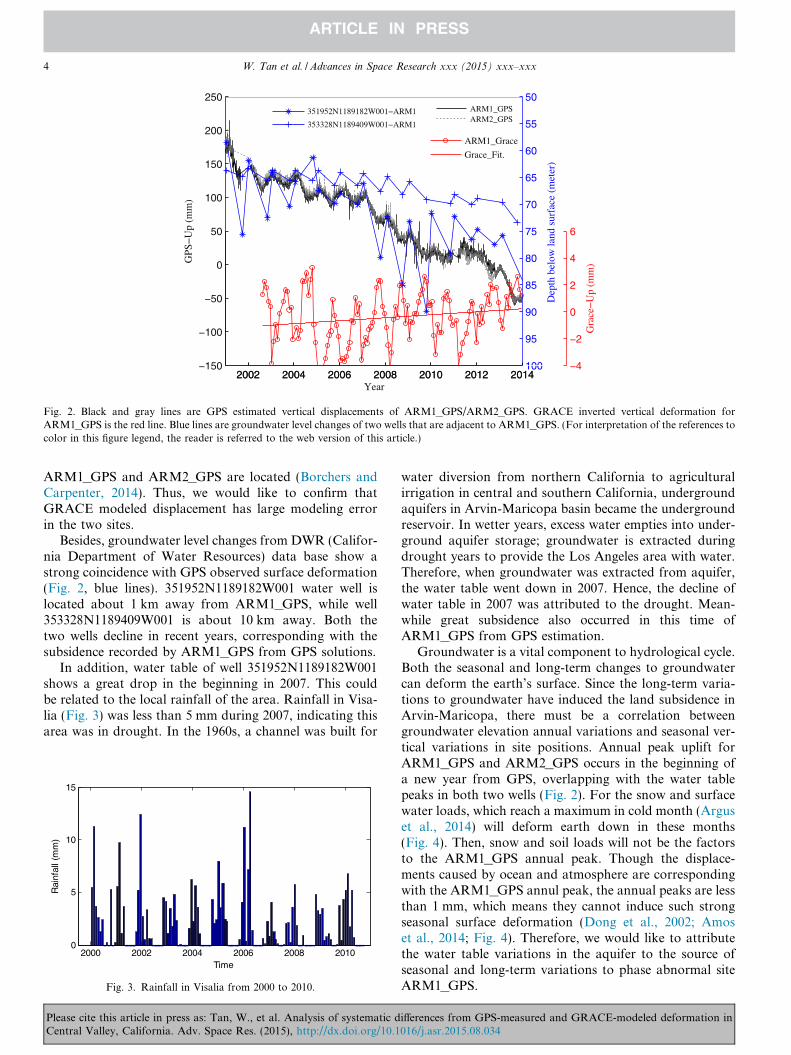
In addition, water table of well 351952N1189182W001shows a great drop in the beginning in 2007. This couldbe related to the local rainfall of the area. Rainfall in Visa-lia (Fig. 3) was less than 5 mm during 2007, indicating thisarea was in drought. In the 1960s, a channel was built for
2000 2002 2004 2006 2008 20100
5
10
15
Time
Rai
nfal
l (m
m)
Fig. 3. Rainfall in Visalia from 2000 to 2010.
Please cite this article in press as: Tan, W., et al. Analysis of systematic dCentral Valley, California. Adv. Space Res. (2015), http://dx.doi.org/10.1
water diversion from northern California to agriculturalirrigation in central and southern California, undergroundaquifers in Arvin-Maricopa basin became the undergroundreservoir. In wetter years, excess water empties into under-ground aquifer storage; groundwater is extracted duringdrought years to provide the Los Angeles area with water.Therefore, when groundwater was extracted from aquifer,the water table went down in 2007. Hence, the decline ofwater table in 2007 was attributed to the drought. Mean-while great subsidence also occurred in this time ofARM1_GPS from GPS estimation.
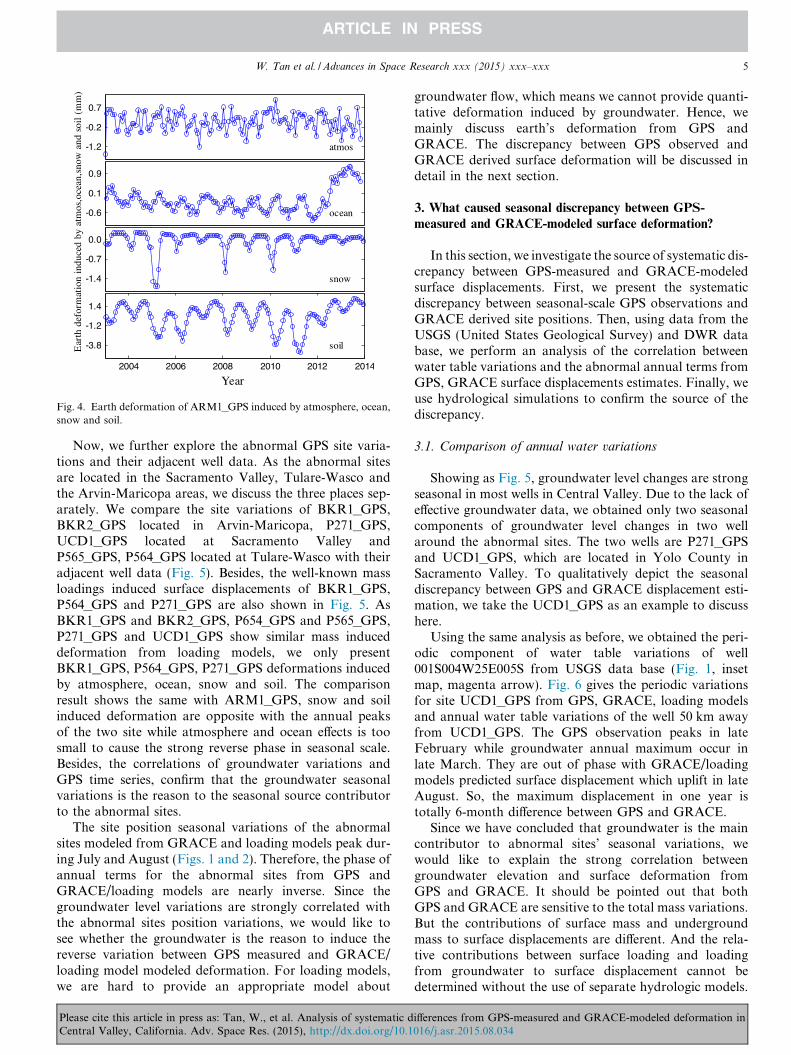
Groundwater is a vital component to hydrological cycle.Both the seasonal and long-term changes to groundwatercan deform the earth’s surface. Since the long-term varia-tions to groundwater have induced the land subsidence inArvin-Maricopa, there must be a correlation betweengroundwater elevation annual variations and seasonal ver-tical variations in site positions. Annual peak uplift forARM1_GPS and ARM2_GPS occurs in the beginning ofa new year from GPS, overlapping with the water tablepeaks in both two wells (Fig. 2). For the snow and surfacewater loads, which reach a maximum in cold month (Arguset al., 2014) will deform earth down in these months(Fig. 4). Then, snow and soil loads will not be the factorsto the ARM1_GPS annual peak. Though the displace-ments caused by ocean and atmosphere are correspondingwith the ARM1_GPS annul peak, the annual peaks are lessthan 1 mm, which means they cannot induce such strongseasonal surface deformation (Dong et al., 2002; Amoset al., 2014; Fig. 4). Therefore, we would like to attributethe water table variations in the aquifer to the source ofseasonal and long-term variations to phase abnormal siteARM1_GPS.
ifferences from GPS-measured and GRACE-modeled deformation in016/j.asr.2015.08.034
-1.2
-0.2
0.7
atmos
-0.6
0.1
0.9
ocean
-1.4
-0.7
0.0
snow
2004 2006 2008 2010 2012 2014
-3.8
-1.2
1.4
soil
Year
Ear
th d
efor
mat
ion
indu
ced
by a
tmos
,oce
an,s
now
and
soi
l (m
m)
Fig. 4. Earth deformation of ARM1_GPS induced by atmosphere, ocean,snow and soil.
W. Tan et al. / Advances in Space Research xxx (2015) xxx–xxx 5
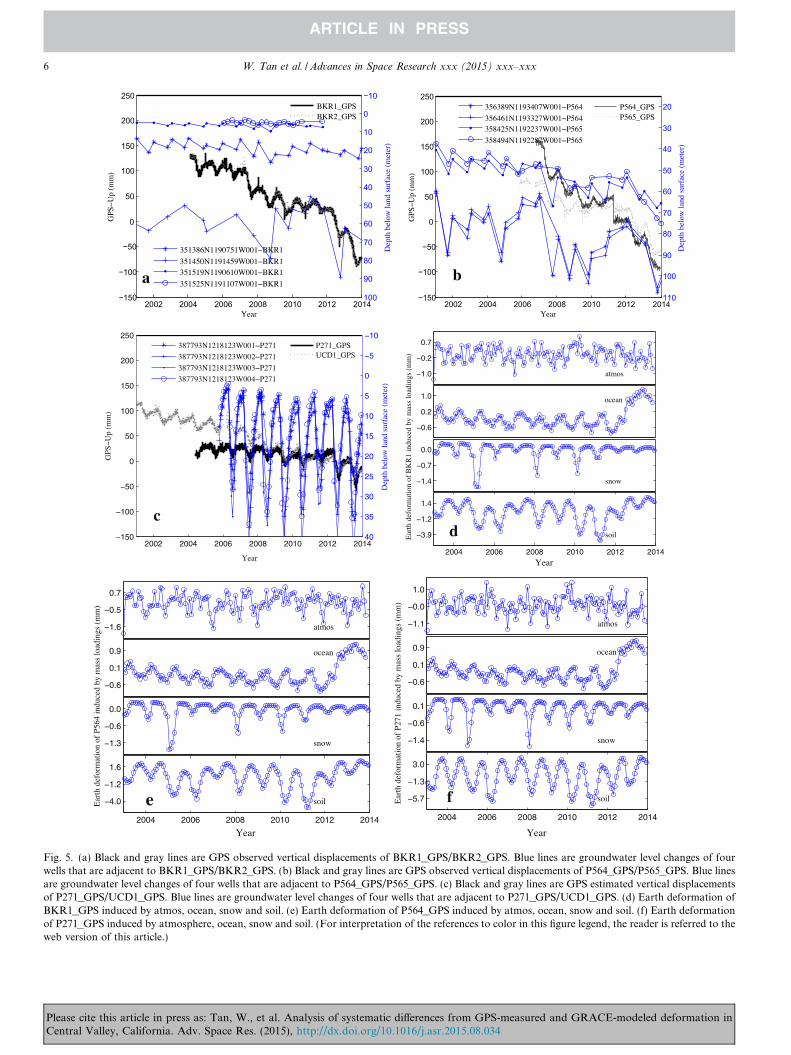
Now, we further explore the abnormal GPS site varia-tions and their adjacent well data. As the abnormal sitesare located in the Sacramento Valley, Tulare-Wasco andthe Arvin-Maricopa areas, we discuss the three places sep-arately. We compare the site variations of BKR1_GPS,BKR2_GPS located in Arvin-Maricopa, P271_GPS,UCD1_GPS located at Sacramento Valley andP565_GPS, P564_GPS located at Tulare-Wasco with theiradjacent well data (Fig. 5). Besides, the well-known massloadings induced surface displacements of BKR1_GPS,P564_GPS and P271_GPS are also shown in Fig. 5. AsBKR1_GPS and BKR2_GPS, P654_GPS and P565_GPS,P271_GPS and UCD1_GPS show similar mass induceddeformation from loading models, we only presentBKR1_GPS, P564_GPS, P271_GPS deformations inducedby atmosphere, ocean, snow and soil. The comparisonresult shows the same with ARM1_GPS, snow and soilinduced deformation are opposite with the annual peaksof the two site while atmosphere and ocean effects is toosmall to cause the strong reverse phase in seasonal scale.Besides, the correlations of groundwater variations andGPS time series, confirm that the groundwater seasonalvariations is the reason to the seasonal source contributorto the abnormal sites.
The site position seasonal variations of the abnormalsites modeled from GRACE and loading models peak dur-ing July and August (Figs. 1 and 2). Therefore, the phase ofannual terms for the abnormal sites from GPS andGRACE/loading models are nearly inverse. Since thegroundwater level variations are strongly correlated withthe abnormal sites position variations, we would like tosee whether the groundwater is the reason to induce thereverse variation between GPS measured and GRACE/loading model modeled deformation. For loading models,we are hard to provide an appropriate model about
Please cite this article in press as: Tan, W., et al. Analysis of systematic dCentral Valley, California. Adv. Space Res. (2015), http://dx.doi.org/10.1
groundwater flow, which means we cannot provide quanti-tative deformation induced by groundwater. Hence, wemainly discuss earth’s deformation from GPS andGRACE. The discrepancy between GPS observed andGRACE derived surface deformation will be discussed indetail in the next section.
3. What caused seasonal discrepancy between GPS-
measured and GRACE-modeled surface deformation?
In this section, we investigate the source of systematic dis-crepancy between GPS-measured and GRACE-modeledsurface displacements. First, we present the systematicdiscrepancy between seasonal-scale GPS observations andGRACE derived site positions. Then, using data from theUSGS (United States Geological Survey) and DWR database, we perform an analysis of the correlation betweenwater table variations and the abnormal annual terms fromGPS, GRACE surface displacements estimates. Finally, weuse hydrological simulations to confirm the source of thediscrepancy.
3.1. Comparison of annual water variations
Showing as Fig. 5, groundwater level changes are strongseasonal in most wells in Central Valley. Due to the lack ofeffective groundwater data, we obtained only two seasonalcomponents of groundwater level changes in two wellaround the abnormal sites. The two wells are P271_GPSand UCD1_GPS, which are located in Yolo County inSacramento Valley. To qualitatively depict the seasonaldiscrepancy between GPS and GRACE displacement esti-mation, we take the UCD1_GPS as an example to discusshere.
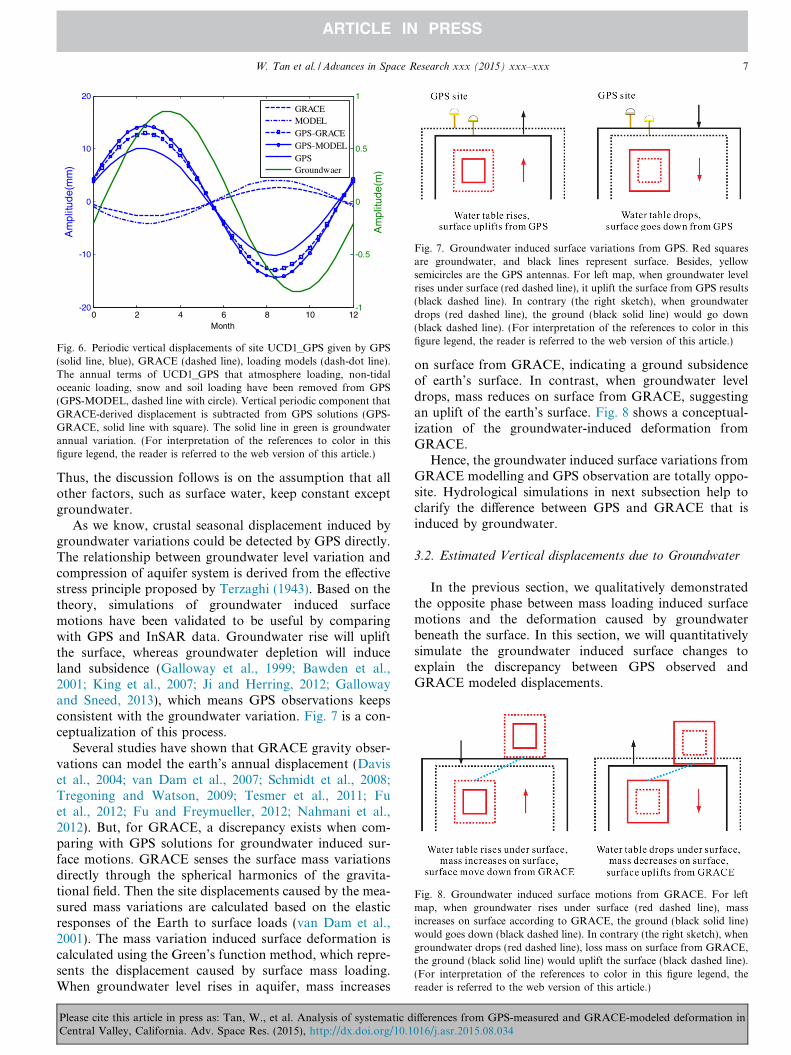
Using the same analysis as before, we obtained the peri-odic component of water table variations of well001S004W25E005S from USGS data base (Fig. 1, insetmap, magenta arrow). Fig. 6 gives the periodic variationsfor site UCD1_GPS from GPS, GRACE, loading modelsand annual water table variations of the well 50 km awayfrom UCD1_GPS. The GPS observation peaks in lateFebruary while groundwater annual maximum occur inlate March. They are out of phase with GRACE/loadingmodels predicted surface displacement which uplift in lateAugust. So, the maximum displacement in one year istotally 6-month difference between GPS and GRACE.
Since we have concluded that groundwater is the maincontributor to abnormal sites’ seasonal variations, wewould like to explain the strong correlation betweengroundwater elevation and surface deformation fromGPS and GRACE. It should be pointed out that bothGPS and GRACE are sensitive to the total mass variations.But the contributions of surface mass and undergroundmass to surface displacements are different. And the rela-tive contributions between surface loading and loadingfrom groundwater to surface displacement cannot bedetermined without the use of separate hydrologic models.
ifferences from GPS-measured and GRACE-modeled deformation in016/j.asr.2015.08.034
2002 2004 2006 2008 2010 2012 2014−150
−100
−50
0
50
100
150
200
250
GPS
−U
p (m
m)
Year
P271_GPSUCD1_GPS
−10
−5
0
5
10
15
20
25
30
35
40
Dep
th b
elow
land
sur
face
(m
eter
)
c
387793N1218123W001−P271
387793N1218123W002−P271
387793N1218123W003−P271
387793N1218123W004−P271−1.0
−0.2
0.7
atmos
−0.6
0.2
1.0 ocean
−1.4
−0.7
0.0
snow
2004 2006 2008 2010 2012 2014
−3.9
−1.2
1.4
soil
Year
dEar
th d
efor
mat
ion
of B
KR
1 in
duce
d by
mas
s lo
adin
gs (
mm
)
−1.6
−0.5
0.7
atmos
−0.6
0.1
0.9 ocean
−1.3
−0.6
0.0
snow
2004 2006 2008 2010 2012 2014
−4.0
−1.2
1.6
soil
Year
Ear
th d
efor
mat
ion
of P
564
indu
ced
by m
ass
load
ings
(m
m)
e
−1.1
−0.0
1.0
atmos
−0.6
0.1
0.9 ocean
−1.4
−0.6
0.1
snow
2004 2006 2008 2010 2012 2014
−5.7
−1.3
3.0
soil
Year
Ear
th d
efor
mat
ion
of P
271
indu
ced
by m
ass
load
ings
(m
m)
f
2002 2004 2006 2008 2010 2012 2014−150
−100
−50
0
50
100
150
200
250G
PS−
Up
(mm
)
Year
BKR1_GPSBKR2_GPS
−10
0
10
20
30
40
50
60
70
80
90
100
Dep
th b
elow
land
sur
face
(m
eter
)
a
351386N1190751W001−BKR1
351450N1191459W001−BKR1351519N1190610W001−BKR1
351525N1191107W001−BKR1
2002 2004 2006 2008 2010 2012 2014−150
−100
−50
0
50
100
150
200
250
GPS
−U
p (m
m)
Year
P564_GPSP565_GPS
20
30
40
50
60
70
80
90
100
110
Dep
th b
elow
land
sur
face
(m
eter
)
b
356389N1193407W001−P564
356461N1193327W001−P564358425N1192237W001−P565
358494N1192287W001−P565
Fig. 5. (a) Black and gray lines are GPS observed vertical displacements of BKR1_GPS/BKR2_GPS. Blue lines are groundwater level changes of fourwells that are adjacent to BKR1_GPS/BKR2_GPS. (b) Black and gray lines are GPS observed vertical displacements of P564_GPS/P565_GPS. Blue linesare groundwater level changes of four wells that are adjacent to P564_GPS/P565_GPS. (c) Black and gray lines are GPS estimated vertical displacementsof P271_GPS/UCD1_GPS. Blue lines are groundwater level changes of four wells that are adjacent to P271_GPS/UCD1_GPS. (d) Earth deformation ofBKR1_GPS induced by atmos, ocean, snow and soil. (e) Earth deformation of P564_GPS induced by atmos, ocean, snow and soil. (f) Earth deformationof P271_GPS induced by atmosphere, ocean, snow and soil. (For interpretation of the references to color in this figure legend, the reader is referred to theweb version of this article.)
6 W. Tan et al. / Advances in Space Research xxx (2015) xxx–xxx
Please cite this article in press as: Tan, W., et al. Analysis of systematic differences from GPS-measured and GRACE-modeled deformation inCentral Valley, California. Adv. Space Res. (2015), http://dx.doi.org/10.1016/j.asr.2015.08.034
-20
-10
0
10
20
Am
plitu
de(m
m)
Month0 2 4 6 8 10 12
-1
-0.5
0
0.5
1
GRACEMODELGPS-GRACEGPS-MODELGPSGroundwaer
Am
plitu
de(m
)
Fig. 6. Periodic vertical displacements of site UCD1_GPS given by GPS(solid line, blue), GRACE (dashed line), loading models (dash-dot line).The annual terms of UCD1_GPS that atmosphere loading, non-tidaloceanic loading, snow and soil loading have been removed from GPS(GPS-MODEL, dashed line with circle). Vertical periodic component thatGRACE-derived displacement is subtracted from GPS solutions (GPS-GRACE, solid line with square). The solid line in green is groundwaterannual variation. (For interpretation of the references to color in thisfigure legend, the reader is referred to the web version of this article.)
Fig. 7. Groundwater induced surface variations from GPS. Red squaresare groundwater, and black lines represent surface. Besides, yellowsemicircles are the GPS antennas. For left map, when groundwater levelrises under surface (red dashed line), it uplift the surface from GPS results(black dashed line). In contrary (the right sketch), when groundwaterdrops (red dashed line), the ground (black solid line) would go down(black dashed line). (For interpretation of the references to color in thisfigure legend, the reader is referred to the web version of this article.)
Fig. 8. Groundwater induced surface motions from GRACE. For leftmap, when groundwater rises under surface (red dashed line), massincreases on surface according to GRACE, the ground (black solid line)would goes down (black dashed line). In contrary (the right sketch), whengroundwater drops (red dashed line), loss mass on surface from GRACE,the ground (black solid line) would uplift the surface (black dashed line).(For interpretation of the references to color in this figure legend, thereader is referred to the web version of this article.)
W. Tan et al. / Advances in Space Research xxx (2015) xxx–xxx 7
Thus, the discussion follows is on the assumption that allother factors, such as surface water, keep constant exceptgroundwater.
As we know, crustal seasonal displacement induced bygroundwater variations could be detected by GPS directly.The relationship between groundwater level variation andcompression of aquifer system is derived from the effectivestress principle proposed by Terzaghi (1943). Based on thetheory, simulations of groundwater induced surfacemotions have been validated to be useful by comparingwith GPS and InSAR data. Groundwater rise will upliftthe surface, whereas groundwater depletion will induceland subsidence (Galloway et al., 1999; Bawden et al.,2001; King et al., 2007; Ji and Herring, 2012; Gallowayand Sneed, 2013), which means GPS observations keepsconsistent with the groundwater variation. Fig. 7 is a con-ceptualization of this process.
Several studies have shown that GRACE gravity obser-vations can model the earth’s annual displacement (Daviset al., 2004; van Dam et al., 2007; Schmidt et al., 2008;Tregoning and Watson, 2009; Tesmer et al., 2011; Fuet al., 2012; Fu and Freymueller, 2012; Nahmani et al.,2012). But, for GRACE, a discrepancy exists when com-paring with GPS solutions for groundwater induced sur-face motions. GRACE senses the surface mass variationsdirectly through the spherical harmonics of the gravita-tional field. Then the site displacements caused by the mea-sured mass variations are calculated based on the elasticresponses of the Earth to surface loads (van Dam et al.,2001). The mass variation induced surface deformation iscalculated using the Green’s function method, which repre-sents the displacement caused by surface mass loading.When groundwater level rises in aquifer, mass increases
Please cite this article in press as: Tan, W., et al. Analysis of systematic dCentral Valley, California. Adv. Space Res. (2015), http://dx.doi.org/10.1
on surface from GRACE, indicating a ground subsidenceof earth’s surface. In contrast, when groundwater leveldrops, mass reduces on surface from GRACE, suggestingan uplift of the earth’s surface. Fig. 8 shows a conceptual-ization of the groundwater-induced deformation fromGRACE.
Hence, the groundwater induced surface variations fromGRACE modelling and GPS observation are totally oppo-site. Hydrological simulations in next subsection help toclarify the difference between GPS and GRACE that isinduced by groundwater.
3.2. Estimated Vertical displacements due to Groundwater
In the previous section, we qualitatively demonstratedthe opposite phase between mass loading induced surfacemotions and the deformation caused by groundwaterbeneath the surface. In this section, we will quantitativelysimulate the groundwater induced surface changes toexplain the discrepancy between GPS observed andGRACE modeled displacements.
ifferences from GPS-measured and GRACE-modeled deformation in016/j.asr.2015.08.034
8 W. Tan et al. / Advances in Space Research xxx (2015) xxx–xxx
As we know, load variations supported on the land willcompress the elastic crust. Likewise, crust will rebound inresponse to the removal of mass. Methods that estimatethe mass load produced static displacements of an elasticEarth are Terzaghi’s Principle (Terzaghi, 1943; Bawdenet al., 2001; King et al., 2007), Mogi’s Model (Mogi,1958; Cayol and Cornet, 1997; Lisowski, 2006) and Green’sfunction method (Longman, 1962; Farrell, 1972;Mangiarotti et al., 2001). Terzaghi’s Principle is the 1-Dsoil consolidation model. It describes the point responseto point force on a free surface. Green’s function approachshows the displacement field from a point mass loadapplied at the surface of an elastic half-space. Mogi’sModel measures a point pressure source which effects ona uniformly pressurized cavity, isotropic elastic full-space.
3.2.1. Theoretical background
3.2.1.1. Terzaghi’s Principle. The elastic response of theearth to the extraction of groundwater and replenishmentis derived from the changes of pore fluid pressure in aqui-fer. One common theory to describe this influence is theone-dimensional soil consolidation theory propose byTerzaghi (1943), in which the porous deformation isassumed to be vertical (Galloway et al., 1998; Bawdenet al., 2001; King et al., 2007). The theory gives the rela-tionship between water head and vertical surface displace-ment. With the relationship of
Db ¼ �SkDh ð1Þvertical displacement Db is computed. �Sk is the storagecoefficient in the aquifer, and Dh is change in head ofgroundwater level (King et al., 2007).
The storage coefficient of groundwater in aquifer hasbeen esti mated by several investigators (Davis et al.,1959; Olmsted et al., 1961; Williamson et al., 1989;Galloway et al., 1999; Bawden et al., 2001; King et al.,2007). According the ratio of surface vertical displacementto groundwater elevation change, King et al. (2007) esti-mate the elastic storage coefficient as 0.0035. In our defor-mation simulation, we set Sk = 0.0035.
3.2.1.2. Mogi’s Model. Mogi’s Model is commonly usedfor volcanic deformation. As Terzaghi’s Principle directlyrelates deformation with the groundwater table, we wouldlike to use spherical sources of pressure, Mogi’s Model(Mogi, 1958; Cayol and Cornet, 1997), to evaluate howthe depth and volume variations of the water sourceimpacts on displacement. On condition of sphericalsource’s radius is much smaller than its depth d, the dis-placements (u, v, w) at point(x, y, 0) would give as
u
v
w
0B@
1CA ¼ DV
1� mp
xR3
yR3
dR3
0B@
1CA ð2Þ
where R ¼ffiffiffiffiffiffiffiffiffiffiffiffiffiffiffiffiffiffiffiffiffiffiffiffiffix2 þ y2 þ d2
p, DV is the change of source vol-
ume, m is Poisson’s ratio the half-space.
Please cite this article in press as: Tan, W., et al. Analysis of systematic dCentral Valley, California. Adv. Space Res. (2015), http://dx.doi.org/10.1
In Central Valley, the thickness of the sediments rangesfrom 300 to 1000 m. Most of the freshwater is contained inthe upper part of the sediments (Olmstead et al., 1961;Williamson et al., 1989). In order to keep consistent forthe Central Valley aquifer system, the surface motion mod-elling are performed in a hypothetical of 1 km2 arealgroundwater basin, and vertically in thickness 500 m. Thevolume changes of the groundwater are head changes ofwater table at the 1 km2 basin respect 2006.
3.2.1.3. Green’s functions method. Another useful way tocompute the earth deformation is Green’s functionapproach, which is relate to a given load qn at the earth sur-face. Then the surface vertical displacements u can beexpressed as
uðhÞ ¼ 3
qe
X1N¼0
h0n2nþ 1
qn ð3Þ
where qe is the earth’s mean density, h0n is the load lovenumbers, n is degree (Farrell, 1972; Mangiarotti et al.,2001). Besides, the load caused by continental waters isrelated to depth h of water through
qn ¼ qwaterh ð4Þwhere the qwater is the water density.
Though Green’s function method harmonizes well withthe load on the earth’s surface, we still give the groundwa-ter induced deformation by Green’s function method inorder to compare the earth’s motion and the simulateddeformation from Green’s function method. We useGreen’s functions (Farrell, 1972) based on the PREMEarth model (Dziewonski and Anderson, 1981) to calculatethe deformation induced by mass loading changes. We per-form the simulation with an area of 0.5cm2.
3.2.2. Groundwater induced surface motions
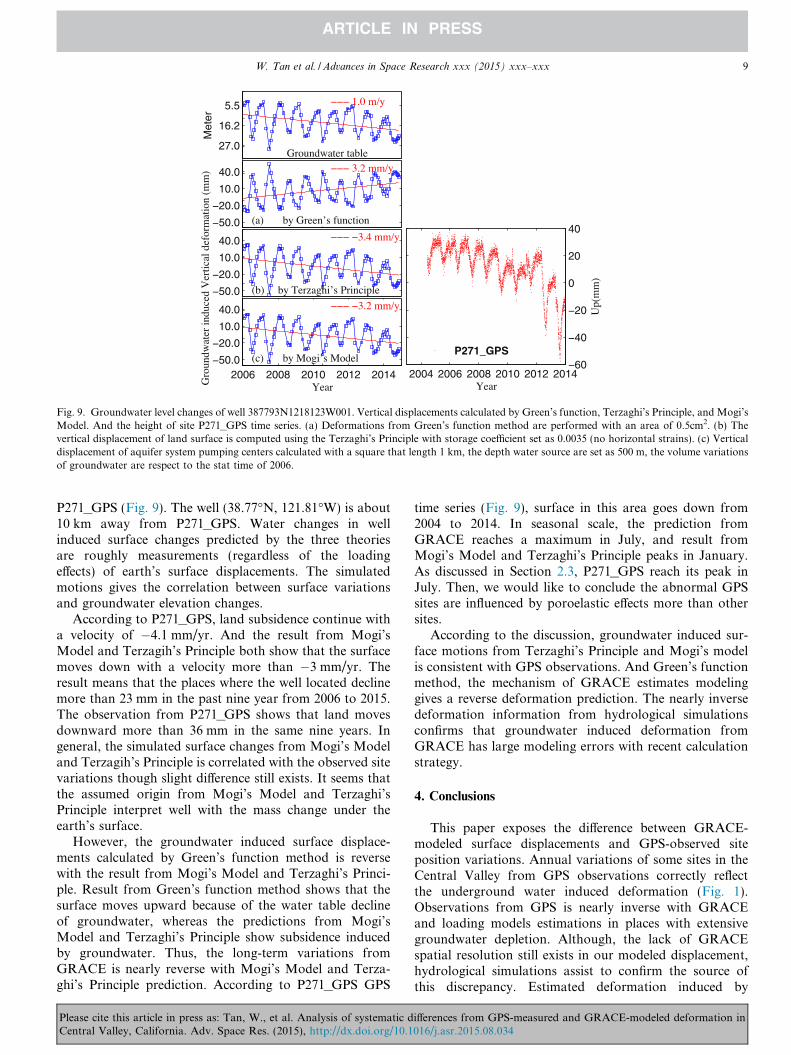
In this section, we simulated the groundwater induceddisplacement with Terzaghi’s Principle, Mogi’s Modeland Green’s function method. The groundwater data isobtained from the DWR database (regardless of well depthor well use). We concentrate the vertical displacement onthe point located where the well stands. The groundwatervariations and three methods predicted surface motionsare shown in Fig. 9. The water level declines more than10 m from 2006 to 2015. Terzaghi’s Principle gives aresponse of land subsidence to groundwater depletion.And the results from Mogi’s Model are in good agreementwith Terzaghi’s Principle predictions. On the contrary,Green’s function method, which is the same mechanismwith GRACE deformation modelling, depicts a reverseeffect that surface moves upward to response the ground-water decline. In addition, estimated annual componentfrom Green’s function method is out of phase with thetwo other methods.
We compare the predicted surface displacements aroundthe well with its adjacent GPS site position variations of
ifferences from GPS-measured and GRACE-modeled deformation in016/j.asr.2015.08.034
5.5
16.2
27.0
Met
er
Year
−−− 1.0 m/y
−50.0
−20.0
10.0
40.0
Year
−−− 3.2 mm/y
−50.0
−20.0
10.0
40.0
Year
−−− −3.4 mm/y
2006 2008 2010 2012 2014−50.0
−20.0
10.0
40.0
Year
−−− −3.2 mm/y
Groundwater table
(a) by Green’s function
(b) by Terzaghi’s Principle
(c) by Mogi’s Model
Gro
undw
ater
indu
ced
Ver
tical
def
orm
atio
n (m
m)
2004 2006 2008 2010 2012 2014−60
−40
−20
0
20
40
Year
Up(
mm
)
P271_GPS
Fig. 9. Groundwater level changes of well 387793N1218123W001. Vertical displacements calculated by Green’s function, Terzaghi’s Principle, and Mogi’sModel. And the height of site P271_GPS time series. (a) Deformations from Green’s function method are performed with an area of 0.5cm2. (b) Thevertical displacement of land surface is computed using the Terzaghi’s Principle with storage coefficient set as 0.0035 (no horizontal strains). (c) Verticaldisplacement of aquifer system pumping centers calculated with a square that length 1 km, the depth water source are set as 500 m, the volume variationsof groundwater are respect to the stat time of 2006.
W. Tan et al. / Advances in Space Research xxx (2015) xxx–xxx 9
P271_GPS (Fig. 9). The well (38.77�N, 121.81�W) is about10 km away from P271_GPS. Water changes in wellinduced surface changes predicted by the three theoriesare roughly measurements (regardless of the loadingeffects) of earth’s surface displacements. The simulatedmotions gives the correlation between surface variationsand groundwater elevation changes.
According to P271_GPS, land subsidence continue witha velocity of �4.1 mm/yr. And the result from Mogi’sModel and Terzagih’s Principle both show that the surfacemoves down with a velocity more than �3 mm/yr. Theresult means that the places where the well located declinemore than 23 mm in the past nine year from 2006 to 2015.The observation from P271_GPS shows that land movesdownward more than 36 mm in the same nine years. Ingeneral, the simulated surface changes from Mogi’s Modeland Terzagih’s Principle is correlated with the observed sitevariations though slight difference still exists. It seems thatthe assumed origin from Mogi’s Model and Terzaghi’sPrinciple interpret well with the mass change under theearth’s surface.
However, the groundwater induced surface displace-ments calculated by Green’s function method is reversewith the result from Mogi’s Model and Terzaghi’s Princi-ple. Result from Green’s function method shows that thesurface moves upward because of the water table declineof groundwater, whereas the predictions from Mogi’sModel and Terzaghi’s Principle show subsidence inducedby groundwater. Thus, the long-term variations fromGRACE is nearly reverse with Mogi’s Model and Terza-ghi’s Principle prediction. According to P271_GPS GPS
Please cite this article in press as: Tan, W., et al. Analysis of systematic dCentral Valley, California. Adv. Space Res. (2015), http://dx.doi.org/10.1
time series (Fig. 9), surface in this area goes down from2004 to 2014. In seasonal scale, the prediction fromGRACE reaches a maximum in July, and result fromMogi’s Model and Terzaghi’s Principle peaks in January.As discussed in Section 2.3, P271_GPS reach its peak inJuly. Then, we would like to conclude the abnormal GPSsites are influenced by poroelastic effects more than othersites.
According to the discussion, groundwater induced sur-face motions from Terzaghi’s Principle and Mogi’s modelis consistent with GPS observations. And Green’s functionmethod, the mechanism of GRACE estimates modelinggives a reverse deformation prediction. The nearly inversedeformation information from hydrological simulationsconfirms that groundwater induced deformation fromGRACE has large modeling errors with recent calculationstrategy.
4. Conclusions
This paper exposes the difference between GRACE-modeled surface displacements and GPS-observed siteposition variations. Annual variations of some sites in theCentral Valley from GPS observations correctly reflectthe underground water induced deformation (Fig. 1).Observations from GPS is nearly inverse with GRACEand loading models estimations in places with extensivegroundwater depletion. Although, the lack of GRACEspatial resolution still exists in our modeled displacement,hydrological simulations assist to confirm the source ofthis discrepancy. Estimated deformation induced by
ifferences from GPS-measured and GRACE-modeled deformation in016/j.asr.2015.08.034
10 W. Tan et al. / Advances in Space Research xxx (2015) xxx–xxx
groundwater in Terzaghi’s Principle and Mogi’s Model isconsistent with GPS measurements. Though Green’s func-tion method derived deformation may be opposite with theactual movements of crust, it demonstrates the technolo-gies difference between GRACE and GPS.
Due to the inherent correlation between the elastic sur-face displacement and the mass loading variations, theGPS, GRACE solutions and the geophysical models arecommonly used to infer the mass redistributions from sur-face displacement measurements or vice versa (Kusche andSchrama, 2005; Wu et al., 2012; Argus et al., 2014). For thesurface displacements caused by underground mass likegroundwater and magma, the poroelastic effect is dominantin the near-field above the aquifer or magma chamber, andthe elastic effect becomes dominant in far-field. Thus thewell-known Green’s function method is suitable for theinversion of underground mass distribution only for far-field stations (Argus et al., 2014). Problems may also existfor underground mass inversion from surface displacementin the near-field, in which may also lead an inverse resultfrom GPS and GRACE. We leave this problems for futureinvestigation.
Seasonal coordinate variations measured by geodetictechniques contain various geophysical processes, as wellas some systematic errors at seasonal periods, such as thedraconitic error in GPS series (Ray et al., 2008). However,observed unusual seasonal terms in Central Valley still pro-vide an opportunity to explore the systematic differencesbetween techniques. The abnormal seasonal terms open adoor to make a further investigation of the undergroundgeophysical activities.
Acknowledgments
Editor in chief Pascal Willis and three anonymousreviewers are acknowledged for their valuable suggestions.This research is supported by 100 Talents Programme ofthe Chinese Academy of Sciences, the National NaturalScience Foundation of China (NSFC) (Nos. 11273046,40974018, 11373017 and 11203058), the National HighTechnology Research and Development Program of China(Grant Nos. 2013AA122402 and 2014AA123102), theShanghai Committee of Science and Technology (GrantNos. 12DZ2273300 and 13PJ1409900).
References
Argus, D.F., Fu, Y., Landerer, F.W., 2014. Seasonal variation in totalwater storage in California inferred from GPS observations of verticalland motion. Geophys. Res. Lett. 41 (6), 1971–1980.
Amos, C.B., Audet, P., Hammond, W.C., Burgmann, R., Johanson, I.A.,Blewitt, G., 2014. Uplift and seismicity driven by groundwaterdepletion in central California. Nature.
Bawden, G.W., Thatcher, W., Stein, R.S., Hudnut, K.W., Peltzer, G.,2001. Tectonic contraction across Los Angeles after removal ofgroundwater pumping effects. Nature 412 (6849), 812–815.
Borchers, J.W., Carpenter, M., 2014. Land Subsidence from groundwateruse in California. California Water Foundation Full Report ofFindings/April 2014, 151
Please cite this article in press as: Tan, W., et al. Analysis of systematic dCentral Valley, California. Adv. Space Res. (2015), http://dx.doi.org/10.1
Cayol, V., Cornet, F.H., 1997. 3D mixed boundary elements forelastostatic deformation field analysis. Int. J. Rock Mech. Min. Sci.34 (2), 275–287.
Cheng, M., Tapley, B.D., 2004. Variations in the Earth’s oblatenessduring the past 28 years. J. Geophys. Res. Solid Earth 109 (B9) (1978–2012).
Davis, G.H., Green, J.H., Olmsted, F.H., Brown, D.W., 1959. Ground-water conditions and storage capacity in the San Joaquin Valley,California: U.S. Geological Survey Water-Supply Paper 1469, p. 287.
Dong, D., Herring, T.A., King, R.W., 1998. Estimating regional defor-mation from a combination of space and terrestrial geodetic data. J.Geod. 72 (4), 200–214.
Dong, D., Fang, P., Bock, Y., Cheng, M.K., Miyazaki, S., 2002. Anatomyof apparent seasonal variations from GPS-derived site position timeseries. J. Geophys. Res. Solid Earth 107 (B4), ETG-9 (1978–2012).
Dong, D., Fang, P., Bock, Y., Webb, F., Prawirodirdjo, L., Kedar, S.,Jamason, P., 2006. Spatiotemporal filtering using principal componentanalysis and Karhunen–Loeve expansion approaches for regional GPSnetwork analysis. J. Geophys. Res. Solid Earth 111 (B3) (1978–2012).
Davis, J.L., Elosegui, P., Mitrovica, J.X., Tamisiea, M.E., 2004. Climate-driven deformation of the solid Earth from GRACE and GPS.Geophys. Res. Lett. 31 (24).
Demir, D.O., Dogan, U., 2014. Determination of crustal deformationsbased on GPS observing-session duration in Marmara region, Turkey.Adv. Space Res. 53 (3), 452–462.
Dziewonski, A.M., Anderson, D.L., 1981. Preliminary reference Earthmodel. Phys. Earth Planet. Inter. 25 (4), 297–356.
Ek, M.B., Mitchell, K.E., Lin, Y., Rogers, E., Grunmann, P., Koren, V.,Tarpley, J.D., 2003. Implementation of Noah land surface modeladvances in the National Centers for Environmental Predictionoperational mesoscale Eta model. J. Geophys. Res. Atmos. 108(D22) (1984–2012).
Farrell, W.E., 1972. Deformation of the Earth by surface loads. Rev.Geophys. 10 (3), 761–797.
Famiglietti, J.S., Lo, M., Ho, S.L., Bethune, J., Anderson, K.J., Syed, T.H., Rodell, M., 2011. Satellites measure recent rates of groundwaterdepletion in California’s Central Valley. Geophys. Res. Lett. 38 (3).
Faunt, C.C., Hanson, R.T., Belitz. K., 2009. Ground-water availability inCalifornia’s Central Valley. U.S. Geological Survey Professional Paper1766, Chapter B, pp. 58–120.
Fu, Y., Freymueller, J.T., Jensen, T., 2012. Seasonal hydrological loadingin southern Alaska observed by GPS and GRACE. Geophys. Res.Lett. 39 (15).
Fu, Y., Freymueller, J.T., 2012. Seasonal and long-term vertical defor-mation in the Nepal Himalaya constrained by GPS and GRACEmeasurements. J. Geophys. Res. Solid Earth 117 (B3) (1978–2012).
Fu, Y., Argus, D.F., Freymueller, J.T., Heflin, M.B., 2013. Horizontalmotion in elastic response to seasonal loading of rain water in theAmazon Basin and monsoon water in Southeast Asia observed by GPSand inferred from GRACE. Geophys. Res. Lett. 40 (23), 6048–6053.
Galloway, D., Ingebritsen, S.A., Jones, D.R., 1999. Land subsidence inthe United States, U.S. Geol. Surv. Circ., 1182, 4.
Galloway, D.L., Sneed, M., 2013. Analysis and simulation of regionalsubsidence accompanying groundwater abstraction and compaction ofsusceptible aquifer systems in the USA. Bol. Soc. Geol. Mex 65, 123–134.
Galloway, D.L., Hudnut, K.W., Ingebritsen, S.E., Phillips, S.P., Peltzer,G., Rogez, F., Rosen, P.A., 1998. Detection of aquifer systemcompaction and land subsidence using interferometric syntheticaperture radar, Antelope Valley, Mojave Desert. Calif. Water Resour.Res. 34 (10), 2573–2585.
Ji, K.H., Herring, T.A., 2012. Correlation between changes in ground-water levels and surface deformation from GPS measurements in theSan Gabriel Valley, California. Geophys. Res. Lett. 39 (1).
Jin, S., van Dam, T., Wdowinski, S., 2013. Observing and understandingthe Earth system variations from space geodesy. J. Geodyn. 72,1–10.
ifferences from GPS-measured and GRACE-modeled deformation in016/j.asr.2015.08.034
W. Tan et al. / Advances in Space Research xxx (2015) xxx–xxx 11
King, M., Moore, P., Clarke, P., Lavallee, D., 2006. Choice of optimalaveraging radii for temporal GRACE gravity solutions, a comparisonwith GPS and satellite altimetry. Geophys. J. Int. 166 (1), 1–11.
King, N.E., Argus, D., Langbein, J., Agnew, D.C., Bawden, G., Dollar,R.S., Barseghian, D., 2007. Space geodetic observation of expansion ofthe San Gabriel Valley, California, aquifer system, during heavyrainfall in winter 2004–2005. J. Geophys. Res. Solid Earth 112 (B3)(1978–2012).
Khan, S.A., Wahr, J., Bevis, M., Velicogna, I., Kendrick, E., 2010. Spreadof ice mass loss into northwest Greenland observed by GRACE andGPS. Geophys. Res. Lett. 37 (6).
Kusche, J.E.J.O., Schrama, E.J.O., 2005. Surface mass redistributioninversion from global GPS deformation and Gravity Recovery andClimate Experiment (GRACE) gravity data. J. Geophys. Res. SolidEarth 110 (B9) (1978–2012).
Lisowski, M., 2006. Analytical Volcano Deformation Source Models.InVolcano Deformation. Springer, Berlin Heidelberg, pp. 279-304.
Longman, I.M., 1962. A Green’s function for determining the deforma-tion of the Earth under surface mass loads: 1. Theory. J. Geophys. Res.67 (2), 845–850.
Mangiarotti, S., Cazenave, A., Soudarin, L., Cretaux, J.F., 2001. Annualvertical crustal motions predicted from surface mass redistribution andobserved by space geodesy. J. Geophys. Res. Solid Earth 106 (B3),4277–4291 (1978–2012).
Mogi, K., 1958. Relations between the eruptions of various volcanoes andthe deformation of the ground surfaces around them. Bull. EarthquakeRes. Inst., Univ. Tokyo 36, 99–134.
Nahmani, S., Bock, O., Bouin, M.N., Santamarıa-Gomez, A., Boy, J.P.,Collilieux, X., Woeppelmann, G., 2012. Hydrological deformationinduced by the West African Monsoon: Comparison of GPS, GRACEand loading models. J. Geophys. Res. Solid Earth 117 (B5) (1978–2012).
Olmstead, F.H., Davis, G.H., 1961. Geologic features and ground-waterstorage capacity of the Sacramento Valley, California: U.S. GeologicalSurvey Water-Supply Paper 1497, pp. 287.
Ray, J., Altamimi, Z., Collilieux, X., van Dam, T., 2008. Anomalousharmonics in the spectra of GPS position estimates. GPS Solutions 12(1), 55–64.
Rodell, M., Houser, P.R., Jambor, U.E.A., Gottschalck, J., Mitchell, K.,Meng, C.J., Toll, D., 2004. The global land data assimilation system.Bull. Am. Meteorol. Soc. 85 (3), 381–394.
Please cite this article in press as: Tan, W., et al. Analysis of systematic dCentral Valley, California. Adv. Space Res. (2015), http://dx.doi.org/10.1
Scanlon, B.R., Faunt, C.C., Longuevergne, L., Reedy, R.C., Alley, W.M.,McGuire, V.L., McMahon, P.B., 2012. Groundwater depletion andsustainability of irrigation in the US High Plains and Central Valley.Proc. Natl. Acad. Sci. 109 (24), 9320–9325.
Schmidt, R., Petrovic, S., Guntner, A., Barthelmes, F., Wunsch, J.,Kusche, J., 2008. Periodic components of water storage changes fromGRACE and global hydrology models. J. Geophys. Res. Solid Earth113 (B8) (1978–2012).
Sneed, M., 2012, May. Recently measured rapid land subsidence in easternsan joaquin valley, In: 2012 NGWA Ground Water Summit: Innovateand Integrate. Ngwa, California.
Swenson, S., Chambers, D., Wahr, J., 2008. Estimating geocentervariations from a combination of GRACE and ocean model output.J. Geophys. Res. Solid Earth 113 (B8) (1978–2012).
Terzaghi, K., 1943. Theoretical Soil Mechanics, vol. 18. Wiley, New York.Tesmer, V., Steigenberger, P., van Dam, T., et al., 2011. Vertical
deformations from homogeneously processed GRACE and globalGPS long-term series. J. Geod. 85 (5), 291–310.
Tregoning, P., Watson, C., 2009. Atmospheric effects and spurious signalsin GPS analyses. J. Geophys. Res. Solid Earth 114 (B9) (1978–2012).
van Dam, T., Wahr, J., Milly, P.C.D., Shmakin, A.B., Blewitt, G.,Lavallee, D., Larson, K.M., 2001. Crustal displacements due tocontinental water loading. Geophys. Res. Lett 28 (4), 651–654.
van Dam, T., Wahr, J., Lavallee, D., 2007. A comparison of annualvertical crustal displacements from GPS and Gravity Recovery andClimate Experiment (GRACE) over Europe. J. Geophys. Res. SolidEarth 112 (B3) (1978–2012).
Wahr, J., Molenaar, M., Bryan, F., 1998. Time variability of the Earth’sgravity field: Hydrological and oceanic effects and their possibledetection using GRACE. J. Geophys. Res. Solid Earth 103 (B12),30205–30229 (1978–2012).
Wahr, J., Swenson, S., Zlotnicki, V., Velicogna, I., 2004. Time-variablegravity from GRACE: First results. Geophys. Res. Lett. 31 (11).
Williamson, A.K., Prudic, D.E., Swain, L.A., 1989. Ground-water flow inthe Central Valley, California: U.S. Geological Survey ProfessionalPaper 1401-D, pp. 127.
Wu, X., Ray, J., van Dam, T., 2012. Geocenter motion and its geodeticand geophysical implications. J. Geodyn. 58, 44–61.
ifferences from GPS-measured and GRACE-modeled deformation in016/j.asr.2015.08.034


![IntegrityVerificationofOutsourced FrequentItemsetMiningwith ...dongb/slides/icdm2013.pdf · ReferencesI [Bab85]LászlóBabai. Tradinggrouptheoryforrandomness. InProceedingsoftheseventeenthannualACMsymposiumonTheoryofcomputing,pages](https://img.pdfslide.us/doc/110x75/6023093425244c2b825ccdfd/integrityveriicationofoutsourced-frequentitemsetminingwith-dongbslidesicdm2013pdf.jpg)