Embed Size (px)
Citation preview
Introduction
These days, renewable fuels and other
biofuels play a growing role in the offer of
automotive fuels.
Currently, fatty acid methyl ester FAME,
mostly derived from vegetable oil, is
typically blended with regular diesel fuel
in the 5-10 or 20% range. An alternative
AN APPLICATION REPORT FROMSPECTRO ANALYTICAL INSTRUMENTS
XRF-93, Rev. 0
for the fairly expensive fresh vegetable
oil is recycled vegetable oil derived from
the food industry. An elemental analysis
of the pure FAME, the used vegetable oil,
the reprocessed vegetable oil; as well as
of the biofuel blends is required to show
compliance with actual specifications.
SPECTRO XEPOS (XEP05)
Analysis of Sulfur and Trace Element Content in FAME
Analysis Sulfur and Trace Element Content in FAME2
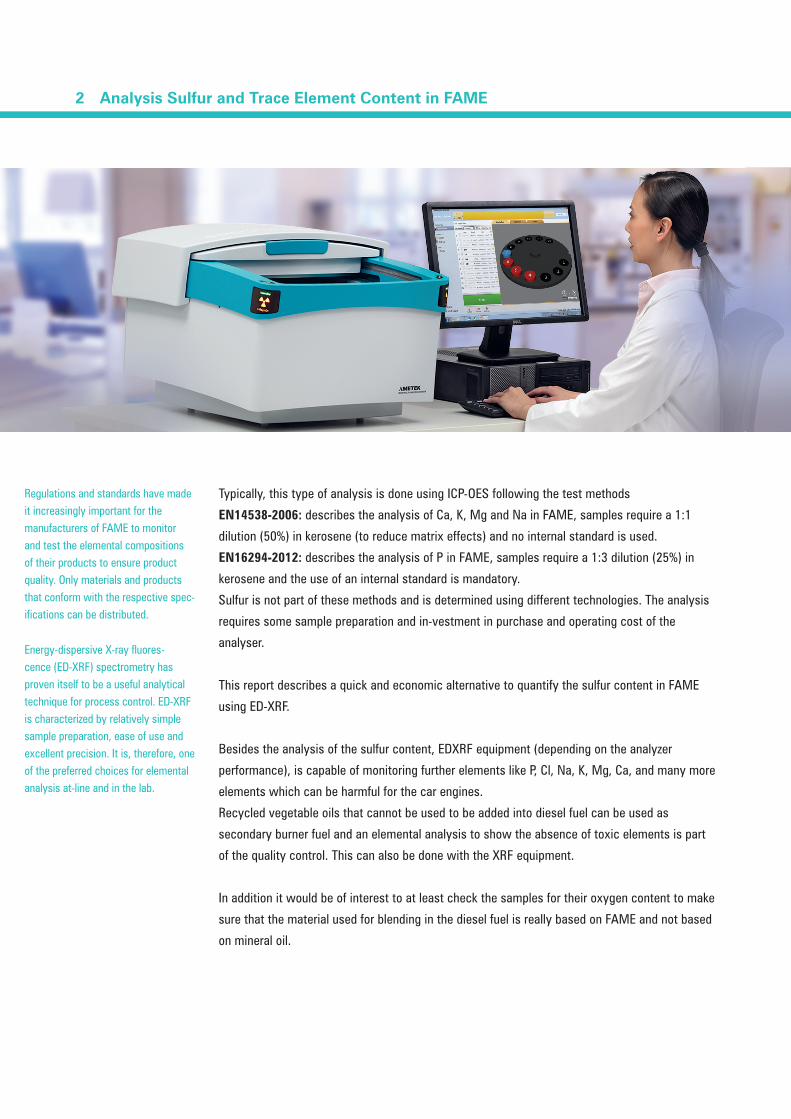
Regulations and standards have made it increasingly important for the manufacturers of FAME to monitor and test the elemental compositions of their products to ensure product quality. Only materials and products that conform with the respective spec-ifications can be distributed.
Energy-dispersive X-ray fluores-cence (ED-XRF) spectrometry has proven itself to be a useful analytical technique for process control. ED-XRF is characterized by relatively simple sample preparation, ease of use and excellent precision. It is, therefore, one of the preferred choices for elemental analysis at-line and in the lab.
Typically, this type of analysis is done using ICP-OES following the test methods
EN14538-2006: describes the analysis of Ca, K, Mg and Na in FAME, samples require a 1:1
dilution (50%) in kerosene (to reduce matrix effects) and no internal standard is used.
EN16294-2012: describes the analysis of P in FAME, samples require a 1:3 dilution (25%) in
kerosene and the use of an internal standard is mandatory.
Sulfur is not part of these methods and is determined using different technologies. The analysis
requires some sample preparation and in-vestment in purchase and operating cost of the
analyser.
This report describes a quick and economic alternative to quantify the sulfur content in FAME
using ED-XRF.
Besides the analysis of the sulfur content, EDXRF equipment (depending on the analyzer
performance), is capable of monitoring further elements like P, Cl, Na, K, Mg, Ca, and many more
elements which can be harmful for the car engines.
Recycled vegetable oils that cannot be used to be added into diesel fuel can be used as
secondary burner fuel and an elemental analysis to show the absence of toxic elements is part
of the quality control. This can also be done with the XRF equipment.
In addition it would be of interest to at least check the samples for their oxygen content to make
sure that the material used for blending in the diesel fuel is really based on FAME and not based
on mineral oil.
Analysis Sulfur and Trace Element Content in FAME 3
Test Methods
Several test methods are available that describe the use of ED-XRF for the analysis of sulfur in
fuel. ISO 13032 is one of them.
ISO 13032, “Petroleum products – Determination of low concentration of sulfur in automotive
fuels – Energy-dispersive X-ray fluorescence spectrometric method”, ISO
The currently available test methods using ED-XRF are limited to fuels with a discrete maximum
amount of FAME or oxygen. In the example of ISO 13032 the maximum content of FAME is
10 % or 3.7 % of oxygen.
The reason for this is that the oxygen has a matrix effect on the sulfur signal measured by XRF.
To be able to use XRF for this type of analy-sis various approaches are possible.
- Correction using defined correction values depending on the known oxygen content –
this requires a-priori knowledge of the oxygen content.
- Correction using fundamental parameters based on the matrix, which has to be
predefined – also this requires an a-priori knowledge of the oxygen content.
- Correction using backscatter information from the sample. This does not require any a-priori
knowledge of the sample matrix but the backscatter correction must be based on a signal,
which should be close to the analyte’s X-ray fluorescence energy as otherwise additional
effects occur.
- Additional references to test methods are given in the annex of this report.
For other elements of interest, the same effect is visible. Depending on the element, the
influence on the results is different.
Analysis Sulfur and Trace Element Content in FAME4
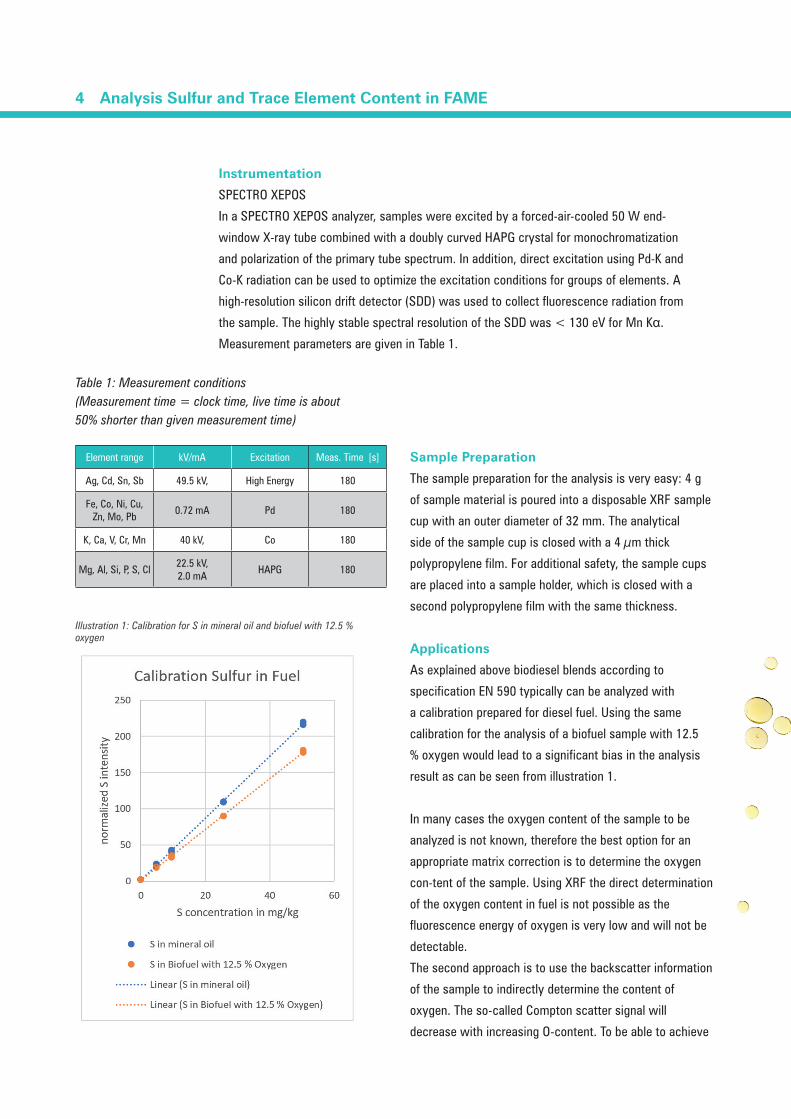
Table 1: Measurement conditions (Measurement time = clock time, live time is about 50% shorter than given measurement time)
Sample Preparation
The sample preparation for the analysis is very easy: 4 g
of sample material is poured into a disposable XRF sample
cup with an outer diameter of 32 mm. The analytical
side of the sample cup is closed with a 4 µm thick
polypropylene film. For additional safety, the sample cups
are placed into a sample holder, which is closed with a
second polypropylene film with the same thickness.
Applications
As explained above biodiesel blends according to
specification EN 590 typically can be analyzed with
a calibration prepared for diesel fuel. Using the same
calibration for the analysis of a biofuel sample with 12.5
% oxygen would lead to a significant bias in the analysis
result as can be seen from illustration 1.
In many cases the oxygen content of the sample to be
analyzed is not known, therefore the best option for an
appropriate matrix correction is to determine the oxygen
con-tent of the sample. Using XRF the direct determination
of the oxygen content in fuel is not possible as the
fluorescence energy of oxygen is very low and will not be
detectable.
The second approach is to use the backscatter information
of the sample to indirectly determine the content of
oxygen. The so-called Compton scatter signal will
decrease with increasing O-content. To be able to achieve
Element range kV/mA Excitation Meas. Time [s]
Ag, Cd, Sn, Sb 49.5 kV, High Energy 180
Fe, Co, Ni, Cu, Zn, Mo, Pb
0.72 mA Pd 180
K, Ca, V, Cr, Mn 40 kV, Co 180
Mg, Al, Si, P, S, Cl22.5 kV, 2.0 mA
HAPG 180
Instrumentation
SPECTRO XEPOS
In a SPECTRO XEPOS analyzer, samples were excited by a forced-air-cooled 50 W end-
window X-ray tube combined with a doubly curved HAPG crystal for monochromatization
and polarization of the primary tube spectrum. In addition, direct excitation using Pd-K and
Co-K radiation can be used to optimize the excitation conditions for groups of elements. A
high-resolution silicon drift detector (SDD) was used to collect fluorescence radiation from
the sample. The highly stable spectral resolution of the SDD was < 130 eV for Mn Kα.
Measurement parameters are given in Table 1.
Illustration 1: Calibration for S in mineral oil and biofuel with 12.5 % oxygen
Analysis Sulfur and Trace Element Content in FAME 5
this accurately the energy of the Comptonscatter signal
should be at relatively low energy as otherwise i.e. volume
effects will affect the determination.
As the SPECTRO XEPOS is equipped with an X-ray tube
with thick binary Pd/Co alloy anode in principle there are
two options to use backscatter information, one from the
excitation using the characteristic radiation of Pd, the
second using the characteristic radiation of Co.
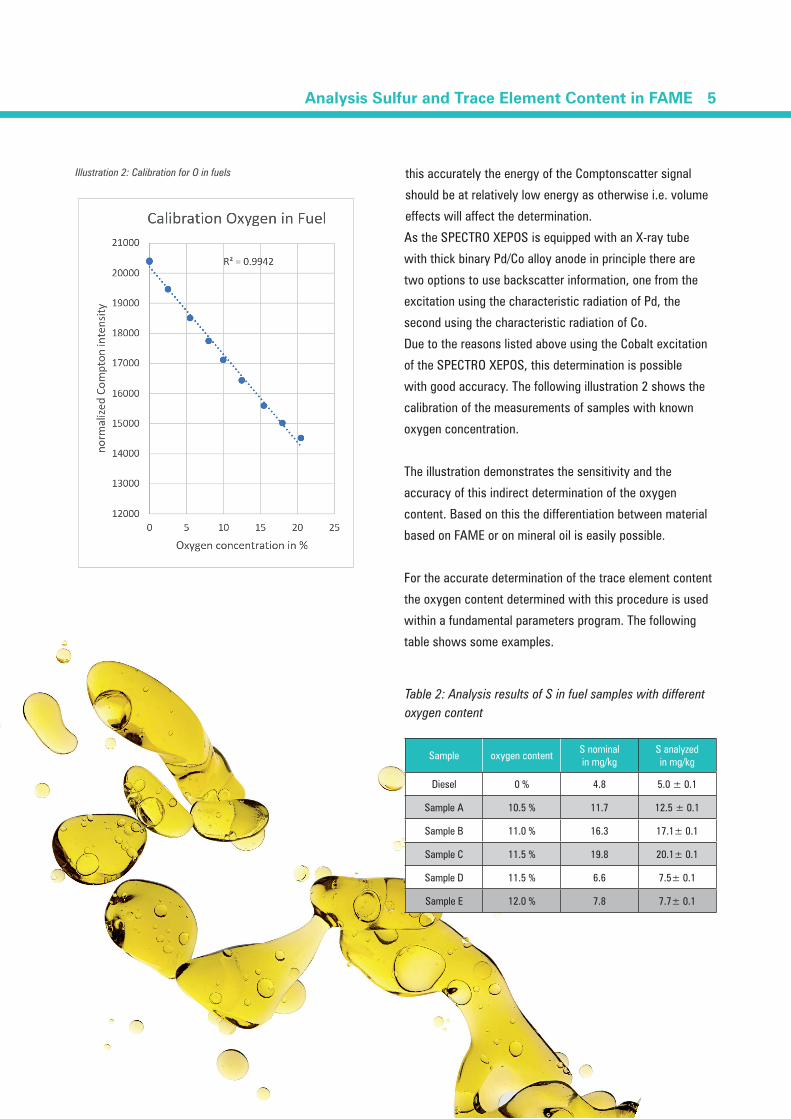
Due to the reasons listed above using the Cobalt excitation
of the SPECTRO XEPOS, this determination is possible
with good accuracy. The following illustration 2 shows the
calibration of the measurements of samples with known
oxygen concentration.
The illustration demonstrates the sensitivity and the
accuracy of this indirect determination of the oxygen
content. Based on this the differentiation between material
based on FAME or on mineral oil is easily possible.
For the accurate determination of the trace element content
the oxygen content determined with this procedure is used
within a fundamental parameters program. The following
table shows some examples.
Illustration 2: Calibration for O in fuels
Table 2: Analysis results of S in fuel samples with different oxygen content
Sample oxygen contentS nominal in mg/kg
S analyzed in mg/kg
Diesel 0 % 4.8 5.0 ± 0.1
Sample A 10.5 % 11.7 12.5 ± 0.1
Sample B 11.0 % 16.3 17.1± 0.1
Sample C 11.5 % 19.8 20.1± 0.1
Sample D 11.5 % 6.6 7.5± 0.1
Sample E 12.0 % 7.8 7.7± 0.1
Analysis Sulfur and Trace Element Content in FAME6
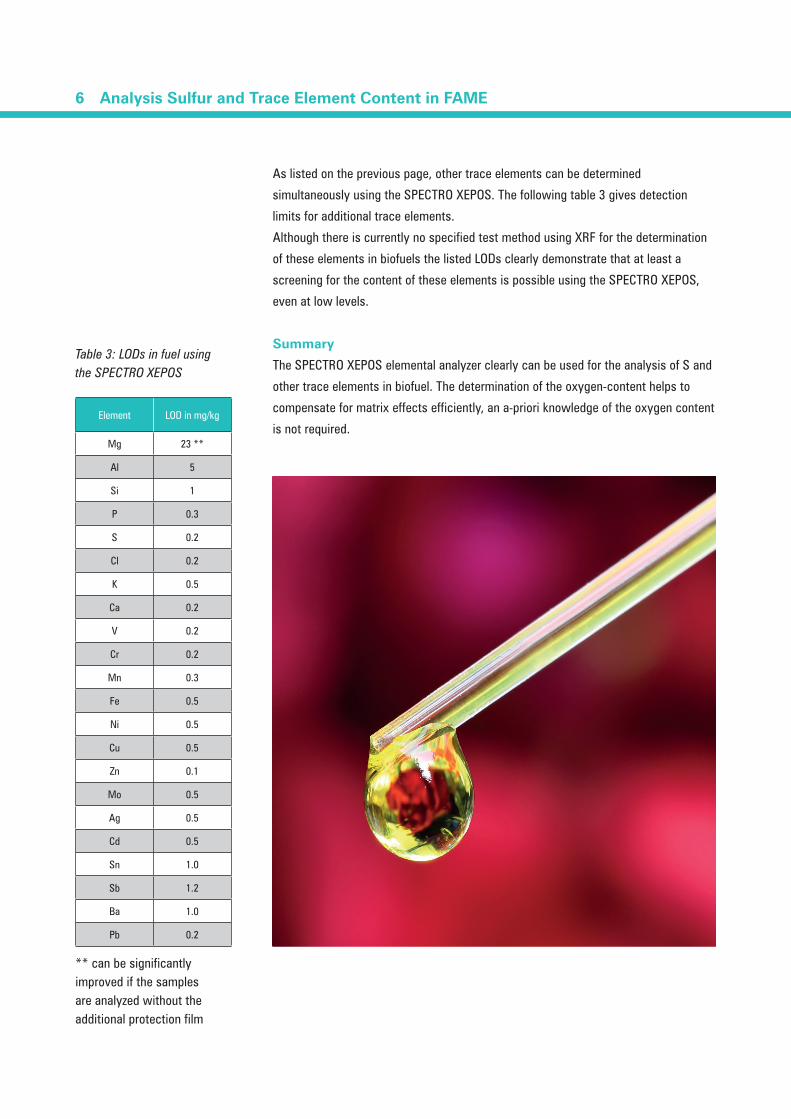
As listed on the previous page, other trace elements can be determined
simultaneously using the SPECTRO XEPOS. The following table 3 gives detection
limits for additional trace elements.
Although there is currently no specified test method using XRF for the determination
of these elements in biofuels the listed LODs clearly demonstrate that at least a
screening for the content of these elements is possible using the SPECTRO XEPOS,
even at low levels.
Summary
The SPECTRO XEPOS elemental analyzer clearly can be used for the analysis of S and
other trace elements in biofuel. The determination of the oxygen-content helps to
compensate for matrix effects efficiently, an a-priori knowledge of the oxygen content
is not required.
Table 3: LODs in fuel using the SPECTRO XEPOS
Element LOD in mg/kg
Mg 23 **
Al 5
Si 1
P 0.3
S 0.2
Cl 0.2
K 0.5
Ca 0.2
V 0.2
Cr 0.2
Mn 0.3
Fe 0.5
Ni 0.5
Cu 0.5
Zn 0.1
Mo 0.5
Ag 0.5
Cd 0.5
Sn 1.0
Sb 1.2
Ba 1.0
Pb 0.2
** can be significantly improved if the samples are analyzed without the additional protection film
Analysis Sulfur and Trace Element Content in FAME 7
References
Important references for specifications and test methods are listed below.
EN 590, “Automotive fuel- diesel- Requirements and Test Methods,” CEN.
EN 14214, “ Automotive fuels - Fatty acid methyl esters (FAME) for diesel engines -
Requirements and test methods,” CEN.
ASTM D6751, “ Standard Specification for Biodiesel Fuel Blend Stock (B100) for Mid-dle
Distillate Fuels,” ASTM International.
Energy dispersive X-ray Fluorescence spectrometry (EDXRF) is currently listed as one of the
standard test methods for the elemental analysis of S content in EN 590 and ASTM D6751.
Depending on the analyzer performance even lower levels of S can be monitored.
UK Environment Agency: Quality Protocol Processed Fuel Oil (PFO),
https://www.gov.uk/government/uploads/system/uploads/attachment_data/file/296420/
geho0211btmo-e-e.pdf
Test methods, which describe EDXRF and polarization EDXRF for the analysis of S content are:
ASTM D 4294, “Standard Test Method for sulfur in Petroleum and Petroleum Products by
Energy Dispersive X-Ray Fluorescence Spectrometry,” ASTM International.
ISO 20847, “Petroleum products- Determination of sulfur content of automotive fuels- Energy
dispersive X-ray fluorescence spectrometry,” ISO.
ASTM D 7220, “Standard Test Method for sulfur in Automotive Fuels by Polarization X-Ray
Fluorescence Spectrometry,” ASTM International.
ISO 13032, “Petroleum products – Determination of low concentration of sulfur in automotive
fuels – Energy-dispersive X-ray fluorescence spectrometric method”, ISO
For referenced ASTM standards, visit the ASTM website, http://www.astm.org or contact
ASTM Customer Service at [email protected].
For referenced CEN standards, visit the CEN website, http://www.cen.eu/cenorm/
For referenced ISO standards, visit the ISO website, http://www.iso.org/
Analysis Sulfur and Trace Element Content in FAME8
Choosing an ED-XRF analyzer
ED-XRF technology keeps getting better and better. Today’s most advanced instruments can provide a quantum leap in performance, even over earlier top-ranked models. Look for the following benefits:
High sensitivity and precision. In multi-element analysis of major, minor, and trace element concentra-tions, it’s critical to maximize spectrometric sensitivity and precision. Example: the newest SPECTRO XEPOS analyzers combine exclusive new excitation technol-ogy with innovative detector and tube designs. These help deliver up to 10X greater sensitivity and 3X better precision than previous models. So users get fast, accurate analysis of a wide range of elements, from sodium to uranium.
Long-term stability. Most ED-XRF analyzers shut down their X-ray tube between measurements. Unfor-tunately, resulting temperature variations can nega-tively affect repeatability and accurate readings. To ensure stability, look for an instrument that maintains constant tube power.
Low detection limits. Lower limits of detection (LODs) improve performance with minor and trace element concentrations. The best new models com-bine high sensitivity with minimized backgrounds, achieving exceptionally low LODs for a wide range of elements.
Consumables flexibility. Analysis in an inert-gas environment sometimes produces better results. But constant gas purging becomes expensive. SPECTRO XEPOS instruments offer low-volume helium purging only when required for light elements in liquids and powders, with a vacuum system for solid samples.
Lower costs. Today, an advanced ED-XRF analyzer such as SPECTRO XEPOS exhibits significantly lower costs — of initial investment and long-term owner-ship — than wavelength dispersive X-ray fluorescence (WD-XRF) spectrometers. Yet it generally provides comparable performance for many applications.
GERMANYSPECTRO Analytical Instruments GmbHBoschstrasse 10D-47533 KleveTel: +49.2821.892.0Fax: [email protected]
U.S.A.SPECTRO Analytical Instruments Inc.91 McKee DriveMahwah, NJ 07430Tel: +1.800.548.5809 +1.201.642.3000Fax: [email protected]
CHINAAMETEK Commercial Enterprise (Shanghai) CO., LTD. Part A1, A4 2nd Floor Building No.1 Plot SectionNo.526 Fute 3rd Road East; Pilot Free Trade Zone200131 ShanghaiTel.: +86.21.586.851.11Fax: [email protected]
www.spectro.com
Subsidiaries: uHong Kong: Tel. +852.2976.9162, Fax +852.2976.9132, [email protected], uFRANCE: Tel +33.1.3068.8970, Fax +33.1.3068.8999, [email protected], uGREAT BRITAIN: Tel +44.1162.462.950, Fax +44.1162.740.160, [email protected], uINDIA: Tel +91.22.6196 8200, Fax +91.22.2836 3613, [email protected], uITALY: Tel +39.02.94693.1, Fax +39.02.94693.650, [email protected], uJAPAN: Tel +81.3.6809.2405, Fax +81.3.6809.2410, [email protected], uSOUTH AFRICA: Tel +27.11.979.4241, Fax +27.11.979.3564, [email protected], uSWEDEN: Tel +46.8.5190.6031, Fax+46.8.5190.6034, [email protected]. uSPECTRO operates worldwide and is present in more than 50 countries. For SPECTRO near you, please visit www.spectro.com/worldwide© 2017 AMETEK Inc., all rights reserved, subject to technical modifications • C-17, Rev. 0 • Photos: SPECTRO, Corbis, Getty Images, iStockphoto • Registered trademarks of SPECTRO Analytical Instruments GmbH • : USA (3,645,267); EU (005673694); IR China (0929040); IR Japan (0929040); “SPECTRO”: EU (009693763); IR USA (1080434); IR China (1080434); IR Japan (1080434); IR South Korea (1080434); iCAL: EU (003131919); USA (3,189,726); “SPECTRO XEPOS”: Germany (39851192), USA (2,415,185)