Embed Size (px)
Citation preview
OPERATIONS AND SUPPLY CHAIN MANAGEMENT
Vol. 14, No. 3, 2021, pp. 320 – 337
ISSN 1979-3561 | EISSN 2759-9363
Analysis of Risk Factors for Temperature-
Controlled Warehouses
P. T. Ranil S. Sugathadasa
Department of Transport and Logistics Management,
University of Moratuwa, Katubedda 10400, Sri Lanka
Email: [email protected]
Deshan Wakkumbura
Department of Transport and Logistics Management,
University of Moratuwa, Katubedda 10400, Sri Lanka
Email: [email protected]
H. Niles Perera
Department of Transport and Logistics Management,
University of Moratuwa, Katubedda 10400, Sri Lanka
Email: [email protected]
Amila Thibbotuwawa
Department of Transport and Logistics Management,
University of Moratuwa, Katubedda 10400, Sri Lanka
Email: [email protected] (Corresponding Author)
ABSTRACT This paper investigates risk factors associated with
temperature-controlled warehouses with the aim of improving
long-run performance of cold chains. A risk mitigation strategy
is derived through Interpretive Structural Modelling (ISM) and
a graphical hierarchy is presented to prioritize the impact levels
of the risk factors. The paper also critically examines the
contextual relationship between individual potential risk
factors associated to temperature-controlled warehouses. The
findings provide pathways to predict uncertainties that can lead
to operational interruptions in temperature-controlled
warehouses alongside expert opinions that lead to the
development of risk mitigation strategies. Given its integrated
approach considering identification, evaluation, analysis, and
risk mitigation in temperature-controlled warehouses, we
believe this paper helps to enrich both the practice and the
literature. With the profound increase of significance in cold
chains within the broader domain of supply chain management,
this paper provides inspiration to more research in cold chains
and temperature-controlled warehouses.
Keywords: temperature-controlled warehouses, supply
chain risk factors, risk mitigation strategies, Interpretive Structural
Modeling (ISM), cold chain, Business Continuity Plan (BCP),
epidemics
1. INTRODUCTION Supply chains and its effectiveness has become an
important competitive tool. Supply Chain Management
integrates numerous business functions and processes by
managing the material, information, and monetary flow of
the company (Perera et al., 2020). Supply chain management
improves long term performances systematically and
strategically (Balachandra et al., 2020; Perera et al., 2016).
It ensures the operation efficiency and effectiveness of the
company concerning product transfer and information
sharing (Prajogo & Olhager, 2012; Kłosowski et al., 2018).
To have an efficient supply chain, management should
focus on monitoring and evaluating supply chain risks and
ways of mitigation. Core characteristics of the supply chain
are to coordinate the activities between organization,
customers and suppliers through effective upstream and
downstream relationships (Jüttner et al., 2003). Disruptions
to the supply chain heavily hinder the competence of an
organization to satisfy the customer (Jüttner et al., 2003).
Companies allocate huge sums of money toward supply
chain risk mitigation and make the flow smooth and
unrestricted from constraints. Risks can arise in unexpected
moments which might lead to interrupting the entire supply
chain. Risks can severely damage information sharing and
delivery of outbound supply chain activities. Previous
research has been reported that supply chain risk is one of
the most critical areas which lead to severe impacts on the
performance of the organizations (Craighead et al., 2007;
Hendricks & Singhal, 2005). Supply chain risk management
has become a central topic in the last decades among scholars
(Fahimnia et al., 2015).
Temperature-controlled warehouse industry is
strategically important in supply chains to handle the
complexities associated with perishable products such as
food, beverages, and pharmaceuticals which are temperature
sensitive (Bishara, 2006). Given the delicate nature of cold
chains, supply chain risk management is salient to ensure
high performance. Many scholars have studied risk
management with relevance to various industry spheres (Ho
et al., 2015). Limited literature can be found regarding
warehouse risk management despite “supply chain risk
management” being a highly covered topic in literature
Ranil, et al.: Analysis of Risk Factors for Temperature-Controlled Warehouses
Operations and Supply Chain Management 14(3) pp. 320 – 337 © 2021 321
(Farid et al., 2016). Literature connecting risk management
and temperature-controlled warehouse industry are even
more scarce. This study attempts to fill this vacuum of
knowledge.
Organoleptic quality of the food products is being
ensured through an effective cold chain since the initial
chilling or freezing of its raw ingredients during the stages
of storage and transport (James & James, 2010). The cold
chain is a network of equipment and processes that create a
conditioned environment for perishable food products and
once if that has been broken in any stage of the cold chain it
severely reduces product quality (Joshi et al., 2012).
Maintaining the product quality is the most critical factor for
frozen and chilled products in the supply chain which can be
dependent on the duration of delivery time and temperature
fluctuations in the cold chain (Zhang et al., 2009). The
practical scenario of the cold chain always aims to minimize
the cost of storage and transportation while engaging with
the quality of products. However, most food manufacturers
and dealers are small and medium-sized enterprises (SMEs)
and they may outsource their cold logistics requirements to
third party logistics providers (3PLs) to reduce the cost
(Siddh et al., 2017).
Temperature-controlled warehouses are widely used
across the globe since it ensures the quality and freshness of
products especially in pharmaceutical and perishable food
items (Akterian & Fikiin, 1994). Temperature controlled
warehouses have become an essential infrastructure in the
cold chain. Recent developments in the regulatory
frameworks, especially in the pharmaceutical and food
sectors have mandated managing risk of temperature-
controlled warehouses (Ziance et al., 2009). Thus, a
malfunction of the cooling system may affect cold chain
operations leading to spoilage of products. In this paper, we
focus on risk enabling factors that cold chains should
consider most and what are the risks that should be afforded
priority to make strategies to alleviate in building resilient
temperature-controlled warehouses.
The structure of the paper is as follows. Section 2
discusses the literature on supply chain risk management.
Section 3 presents the implemented methodology for the
study including ISM steps. Section 4 elaborates on the case
study while presenting the proposed methodology to
prioritize compatible risk mitigation strategies. The paper
winds up with the discussion and conclusion in Section 5.
2. LITERATURE REVIEW With globalization, supply chains have become
drastically complex with integrated networks and lengthy
supply lines processing within a dynamic business
environment. Industry 4.0 revolution has been empowered
this dynamic environment connecting with robotic
technologies and cloud based cyber physical systems
supporting to advance automations (Basl, 2017). This
revolution and complexity expose organizations toa greater
degree of risks and uncertainties that affected to the supply
chain disruptions. Thus, supply chain risk management is
still crucial to overcome these ailments. Usage of Cyber
physical things, Internet of thinks and Big data have made
industry leaders in near future (Zawadzki & Zywicki, 2016).
So, it is significant to numerical analysis of potential risk
factors while streamlining the operations with industry 4.0.
It will help to perceive information to diagnose the findings
from data and change the operational procedures accordingly
(Shrouf et al., 2014).
2.1 Supply Chain Risk Management Disruptions and uncertainties affect negatively on
supply chains which can have a direct effect on a business’s
ability to continue its operation smoothly (Jüttner et al.,
2003). Supply chains face a vast variety of inherent risks that
can occur instantaneously to interrupt operations (Simchi-
Levi et al., 2004). Some scholars have suggested that main
impacts of interruptions and uncertainties in supply chains
had been exacerbated in the last decade (Jüttner et al., 2003).
Literature exposes that more methodical and structured
approach to identify the susceptibilities to hazards and
supply chain risks can be traced in current studies (Zsidisin
et al., 2000). There are number of severe supply chain disruptions
have been occurred. The Tohoku earthquake, tsunami in
2004 and Thai flood in 2011 are some examples for crucial
uncertainties that made supply chains more vulnerable
(Fahimnia et al., 2015). Unexpected supply chain
interruptions can be impacted not only for short-run but also
long-run. Ericsson had lost 400 Euros in short run when their
supplier’s semiconductor plant incurred on fire in 2000. 33%
to 40% lost can be impacted relative to their industry
benchmark in long run when one disruption has been
occurred (Tang, 2006).
2.2 Complexity of Cold Chain Food and pharmaceutical manufacturing and
distribution industries rely heavily on maintaining a static
temperature of the products to avoid deterioration
(Sugathadasa et al., 2020). Consumers expect quality and
decent shelf-life of food and pharmaceutical products. The
retail industry also depends heavily on the quality of
products to satisfy customer demands. The temperature
ranges vary depends on the product to maintain the shelf-life
of varying products, and this need can only be satisfied
through temperature controlled warehouses (Smith &
Sparks, 2007). Temperature ranges of cold supply chain can
be simply classified as frozen, cold chill, medium chill, and
exotic chill. Failures to maintain the ideal temperature for
products adversely affects to either shelf-life or edibility of
the products (Smith & Sparks, 2007).
Cold chains have in increasing significance within the
retail sector as well. Frozen products in the United Kingdom
has grown in volume by 3 to 4 percent on per annum on
average in the last 40 years. “Fast food” has captured a huge
market share and it depends heavily on frozen products. Most
products require some degree of controlled temperature
conditions in different aspects along its supply chain to
ensure that a healthy product is delivered to the consumer
(Smith & Sparks, 2007). Since these products consist of a
sensitive nature, it is essential to care about temperature in
terms of harvesting, manufacturing, packaging, storing,
transportation and handling (Aung & Chang, 2014).
Ranil, et al.: Risk Factors for Temperature-Controlled Warehouses
322 Operations and Supply Chain Management 14(3) pp. 320 – 337 © 2021
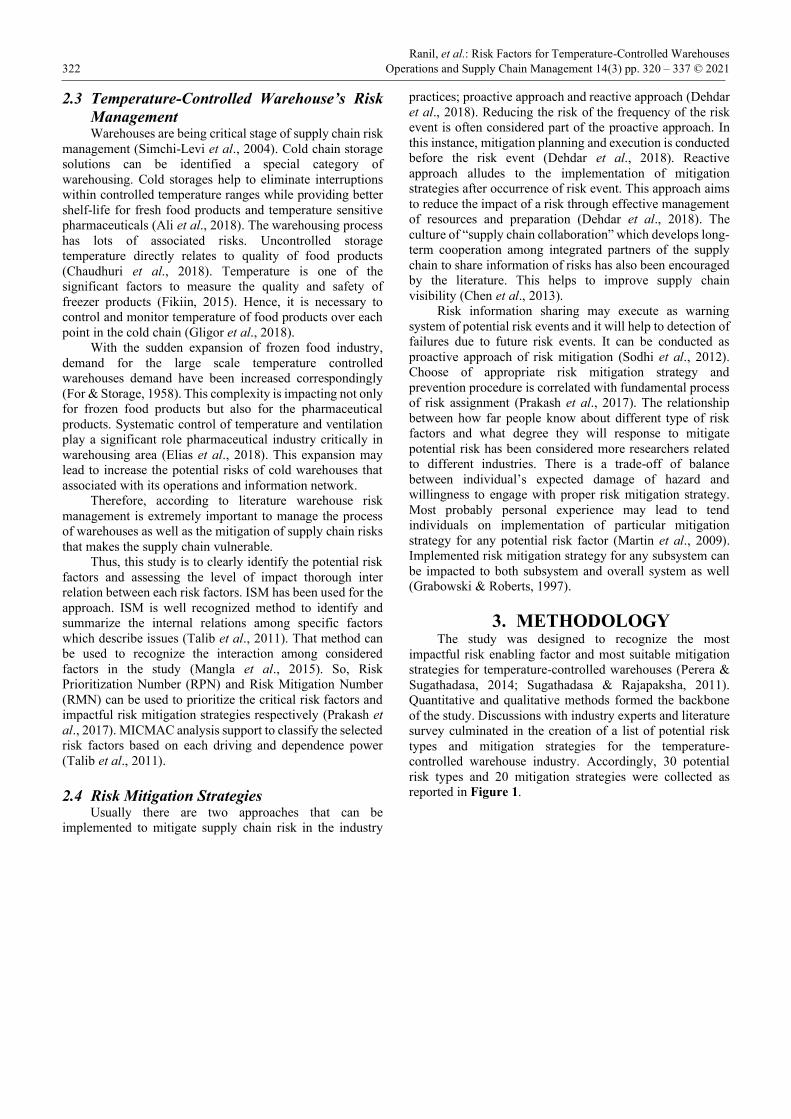
2.3 Temperature-Controlled Warehouse’s Risk
Management Warehouses are being critical stage of supply chain risk
management (Simchi-Levi et al., 2004). Cold chain storage
solutions can be identified a special category of
warehousing. Cold storages help to eliminate interruptions
within controlled temperature ranges while providing better
shelf-life for fresh food products and temperature sensitive
pharmaceuticals (Ali et al., 2018). The warehousing process
has lots of associated risks. Uncontrolled storage
temperature directly relates to quality of food products
(Chaudhuri et al., 2018). Temperature is one of the
significant factors to measure the quality and safety of
freezer products (Fikiin, 2015). Hence, it is necessary to
control and monitor temperature of food products over each
point in the cold chain (Gligor et al., 2018).
With the sudden expansion of frozen food industry,
demand for the large scale temperature controlled
warehouses demand have been increased correspondingly
(For & Storage, 1958). This complexity is impacting not only
for frozen food products but also for the pharmaceutical
products. Systematic control of temperature and ventilation
play a significant role pharmaceutical industry critically in
warehousing area (Elias et al., 2018). This expansion may
lead to increase the potential risks of cold warehouses that
associated with its operations and information network.
Therefore, according to literature warehouse risk
management is extremely important to manage the process
of warehouses as well as the mitigation of supply chain risks
that makes the supply chain vulnerable.
Thus, this study is to clearly identify the potential risk
factors and assessing the level of impact thorough inter
relation between each risk factors. ISM has been used for the
approach. ISM is well recognized method to identify and
summarize the internal relations among specific factors
which describe issues (Talib et al., 2011). That method can
be used to recognize the interaction among considered
factors in the study (Mangla et al., 2015). So, Risk
Prioritization Number (RPN) and Risk Mitigation Number
(RMN) can be used to prioritize the critical risk factors and
impactful risk mitigation strategies respectively (Prakash et
al., 2017). MICMAC analysis support to classify the selected
risk factors based on each driving and dependence power
(Talib et al., 2011).
2.4 Risk Mitigation Strategies Usually there are two approaches that can be
implemented to mitigate supply chain risk in the industry
practices; proactive approach and reactive approach (Dehdar
et al., 2018). Reducing the risk of the frequency of the risk
event is often considered part of the proactive approach. In
this instance, mitigation planning and execution is conducted
before the risk event (Dehdar et al., 2018). Reactive
approach alludes to the implementation of mitigation
strategies after occurrence of risk event. This approach aims
to reduce the impact of a risk through effective management
of resources and preparation (Dehdar et al., 2018). The
culture of “supply chain collaboration” which develops long-
term cooperation among integrated partners of the supply
chain to share information of risks has also been encouraged
by the literature. This helps to improve supply chain
visibility (Chen et al., 2013).
Risk information sharing may execute as warning
system of potential risk events and it will help to detection of
failures due to future risk events. It can be conducted as
proactive approach of risk mitigation (Sodhi et al., 2012).
Choose of appropriate risk mitigation strategy and
prevention procedure is correlated with fundamental process
of risk assignment (Prakash et al., 2017). The relationship
between how far people know about different type of risk
factors and what degree they will response to mitigate
potential risk has been considered more researchers related
to different industries. There is a trade-off of balance
between individual’s expected damage of hazard and
willingness to engage with proper risk mitigation strategy.
Most probably personal experience may lead to tend
individuals on implementation of particular mitigation
strategy for any potential risk factor (Martin et al., 2009).
Implemented risk mitigation strategy for any subsystem can
be impacted to both subsystem and overall system as well
(Grabowski & Roberts, 1997).
3. METHODOLOGY The study was designed to recognize the most
impactful risk enabling factor and most suitable mitigation
strategies for temperature-controlled warehouses (Perera &
Sugathadasa, 2014; Sugathadasa & Rajapaksha, 2011).
Quantitative and qualitative methods formed the backbone
of the study. Discussions with industry experts and literature
survey culminated in the creation of a list of potential risk
types and mitigation strategies for the temperature-
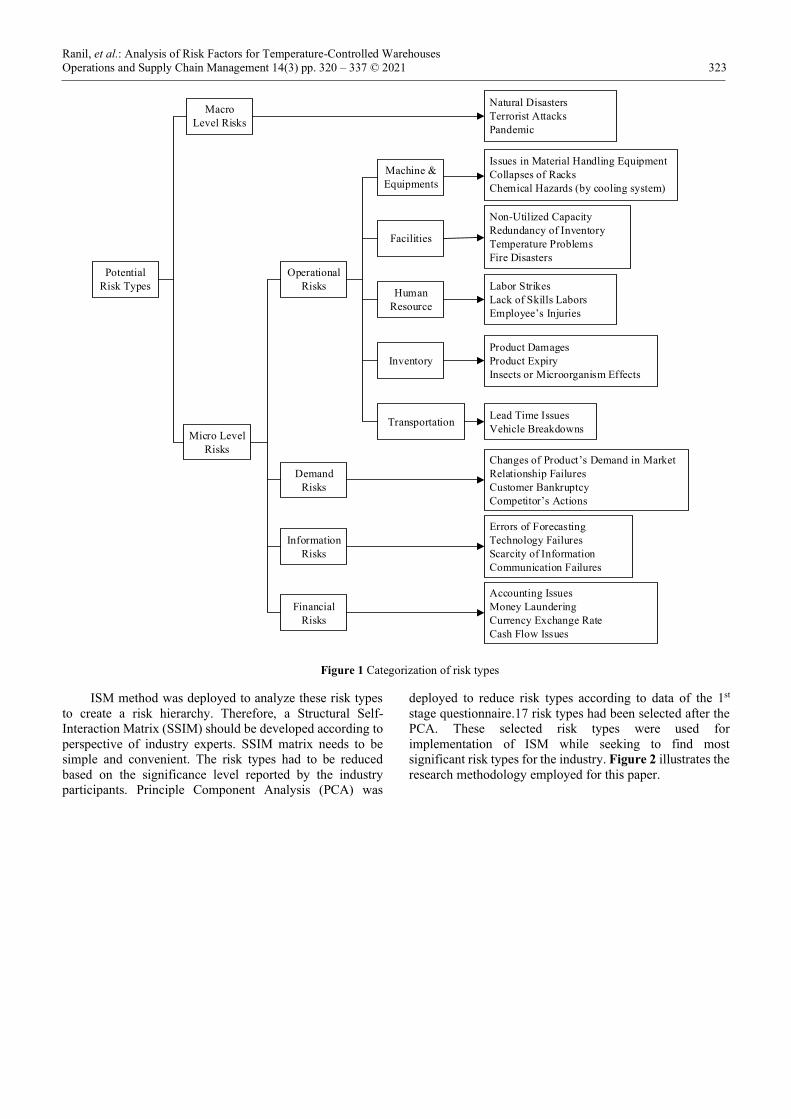
controlled warehouse industry. Accordingly, 30 potential
risk types and 20 mitigation strategies were collected as
reported in Figure 1.
Ranil, et al.: Analysis of Risk Factors for Temperature-Controlled Warehouses
Operations and Supply Chain Management 14(3) pp. 320 – 337 © 2021 323
Potential
Risk Types
Macro
Level Risks
Micro Level
Risks
Operational
Risks
Demand
Risks
Information
Risks
Financial
Risks
Machine &
Equipments
Facilities
Human
Resource
Inventory
Transportation
Natural Disasters
Terrorist Attacks
Pandemic
Issues in Material Handling Equipment
Collapses of Racks
Chemical Hazards (by cooling system)
Non-Utilized Capacity
Redundancy of Inventory
Temperature Problems
Fire Disasters
Labor Strikes
Lack of Skills Labors
Employee s Injuries
Product Damages
Product Expiry
Insects or Microorganism Effects
Lead Time Issues
Vehicle Breakdowns
Changes of Product s Demand in Market
Relationship Failures
Customer Bankruptcy
Competitor s Actions
Errors of Forecasting
Technology Failures
Scarcity of Information
Communication Failures
Accounting Issues
Money Laundering
Currency Exchange Rate
Cash Flow Issues
Figure 1 Categorization of risk types
ISM method was deployed to analyze these risk types
to create a risk hierarchy. Therefore, a Structural Self-
Interaction Matrix (SSIM) should be developed according to
perspective of industry experts. SSIM matrix needs to be
simple and convenient. The risk types had to be reduced
based on the significance level reported by the industry
participants. Principle Component Analysis (PCA) was
deployed to reduce risk types according to data of the 1st
stage questionnaire.17 risk types had been selected after the
PCA. These selected risk types were used for
implementation of ISM while seeking to find most
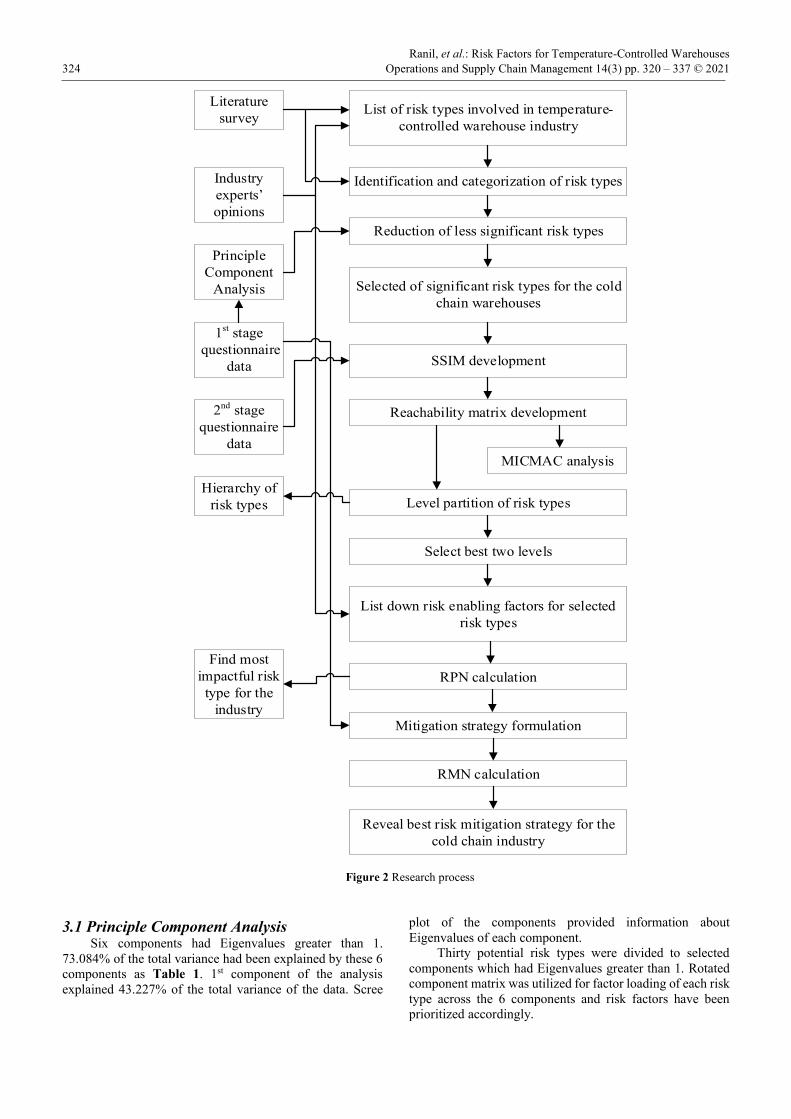
significant risk types for the industry. Figure 2 illustrates the
research methodology employed for this paper.
Ranil, et al.: Risk Factors for Temperature-Controlled Warehouses
324 Operations and Supply Chain Management 14(3) pp. 320 – 337 © 2021
List of risk types involved in temperature-
controlled warehouse industry
Literature
survey
Industry
experts
opinions
Identification and categorization of risk types
Reduction of less significant risk types
Principle
Component
Analysis Selected of significant risk types for the cold
chain warehouses
1st stage
questionnaire
data SSIM development
2nd stage
questionnaire
data
Reachability matrix development
MICMAC analysis
Level partition of risk types
List down risk enabling factors for selected
risk types
Hierarchy of
risk types
Select best two levels
RPN calculation
Find most
impactful risk
type for the
industry
Mitigation strategy formulation
RMN calculation
Reveal best risk mitigation strategy for the
cold chain industry
Figure 2 Research process
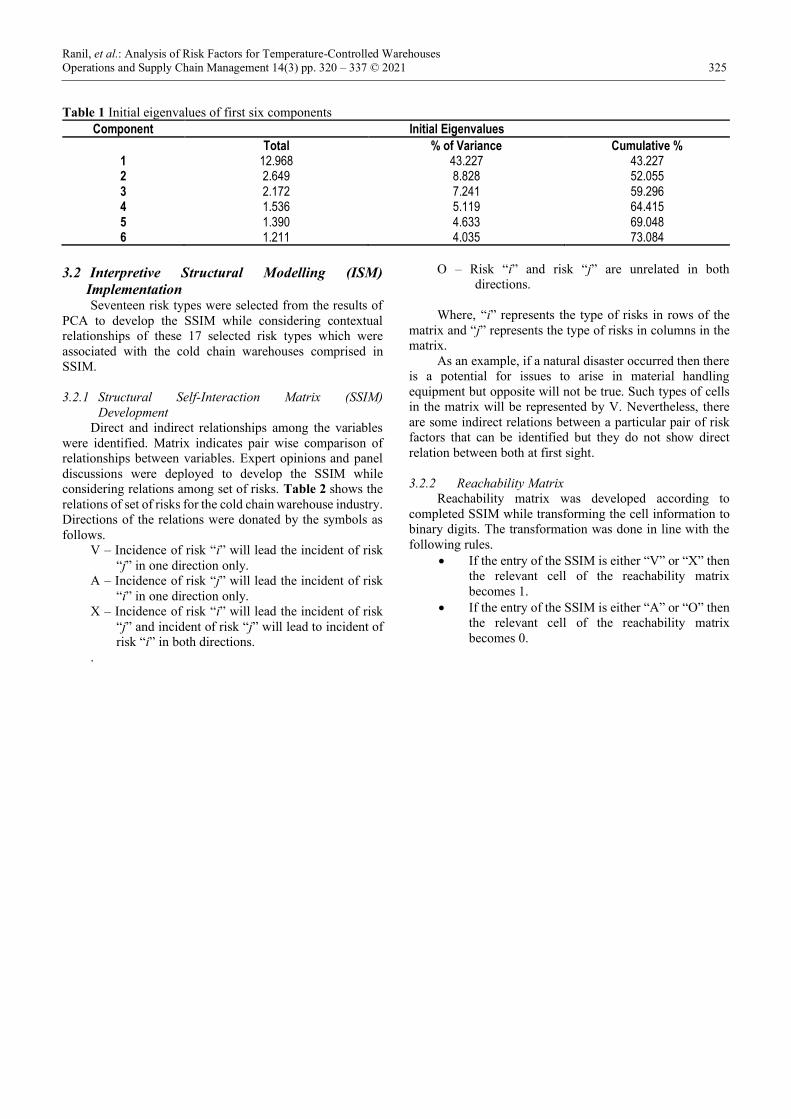
3.1 Principle Component Analysis Six components had Eigenvalues greater than 1.
73.084% of the total variance had been explained by these 6
components as Table 1. 1st component of the analysis
explained 43.227% of the total variance of the data. Scree
plot of the components provided information about
Eigenvalues of each component.
Thirty potential risk types were divided to selected
components which had Eigenvalues greater than 1. Rotated
component matrix was utilized for factor loading of each risk
type across the 6 components and risk factors have been
prioritized accordingly.
Ranil, et al.: Analysis of Risk Factors for Temperature-Controlled Warehouses
Operations and Supply Chain Management 14(3) pp. 320 – 337 © 2021 325
Table 1 Initial eigenvalues of first six components
Component Initial Eigenvalues
Total % of Variance Cumulative % 1 12.968 43.227 43.227 2 2.649 8.828 52.055 3 2.172 7.241 59.296 4 1.536 5.119 64.415 5 1.390 4.633 69.048 6 1.211 4.035 73.084
3.2 Interpretive Structural Modelling (ISM)
Implementation Seventeen risk types were selected from the results of
PCA to develop the SSIM while considering contextual
relationships of these 17 selected risk types which were
associated with the cold chain warehouses comprised in
SSIM.
3.2.1 Structural Self-Interaction Matrix (SSIM)
Development
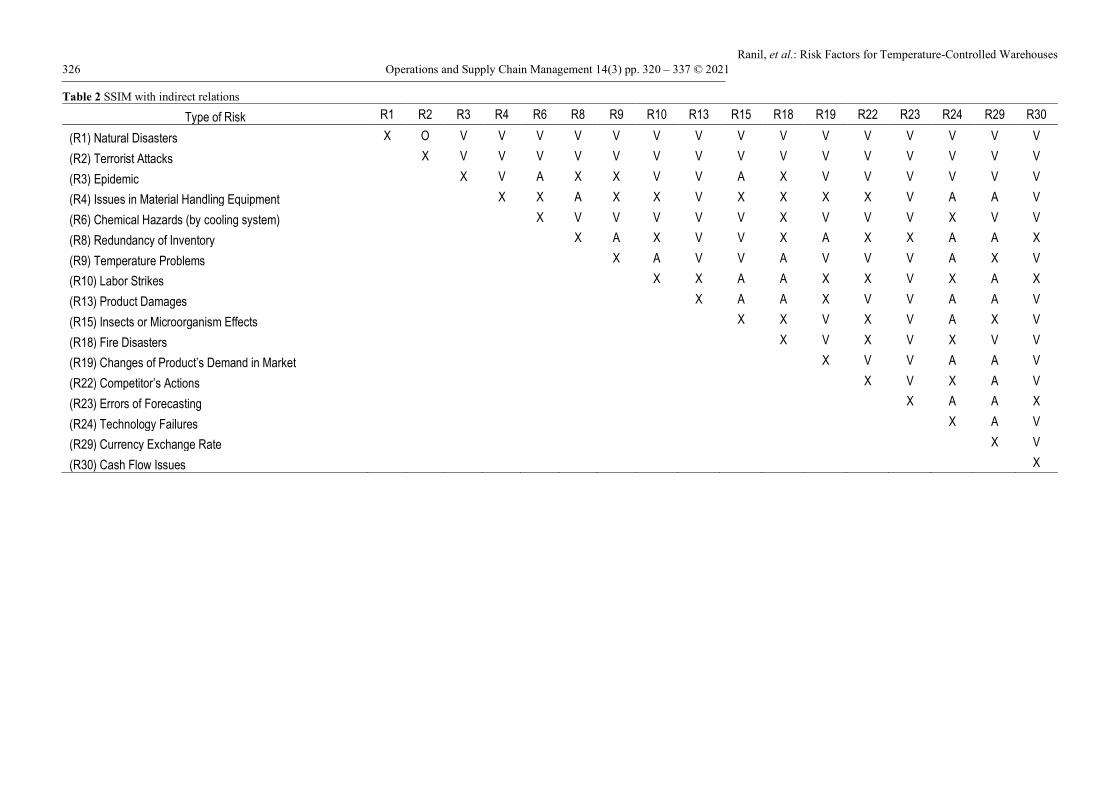
Direct and indirect relationships among the variables
were identified. Matrix indicates pair wise comparison of
relationships between variables. Expert opinions and panel
discussions were deployed to develop the SSIM while
considering relations among set of risks. Table 2 shows the
relations of set of risks for the cold chain warehouse industry.
Directions of the relations were donated by the symbols as
follows.
V – Incidence of risk “i” will lead the incident of risk
“j” in one direction only.
A – Incidence of risk “j” will lead the incident of risk
“i” in one direction only.
X – Incidence of risk “i” will lead the incident of risk
“j” and incident of risk “j” will lead to incident of
risk “i” in both directions.
O – Risk “i” and risk “j” are unrelated in both
directions.
Where, “i” represents the type of risks in rows of the
matrix and “j” represents the type of risks in columns in the
matrix.
As an example, if a natural disaster occurred then there
is a potential for issues to arise in material handling
equipment but opposite will not be true. Such types of cells
in the matrix will be represented by V. Nevertheless, there
are some indirect relations between a particular pair of risk
factors that can be identified but they do not show direct
relation between both at first sight.
3.2.2 Reachability Matrix
Reachability matrix was developed according to
completed SSIM while transforming the cell information to
binary digits. The transformation was done in line with the
following rules.
• If the entry of the SSIM is either “V” or “X” then
the relevant cell of the reachability matrix
becomes 1.
• If the entry of the SSIM is either “A” or “O” then
the relevant cell of the reachability matrix
becomes 0.
.
Ranil, et al.: Risk Factors for Temperature-Controlled Warehouses
326 Operations and Supply Chain Management 14(3) pp. 320 – 337 © 2021
Table 2 SSIM with indirect relations
Type of Risk R1 R2 R3 R4 R6 R8 R9 R10 R13 R15 R18 R19 R22 R23 R24 R29 R30
(R1) Natural Disasters X O V V V V V V V V V V V V V V V
(R2) Terrorist Attacks X V V V V V V V V V V V V V V V
(R3) Epidemic X V A X X V V A X V V V V V V
(R4) Issues in Material Handling Equipment X X A X X V X X X X V A A V
(R6) Chemical Hazards (by cooling system) X V V V V V X V V V X V V
(R8) Redundancy of Inventory X A X V V X A X X A A X
(R9) Temperature Problems X A V V A V V V A X V
(R10) Labor Strikes X X A A X X V X A X
(R13) Product Damages X A A X V V A A V
(R15) Insects or Microorganism Effects X X V X V A X V
(R18) Fire Disasters X V X V X V V
(R19) Changes of Product’s Demand in Market X V V A A V
(R22) Competitor’s Actions X V X A V
(R23) Errors of Forecasting X A A X
(R24) Technology Failures X A V
(R29) Currency Exchange Rate X V
(R30) Cash Flow Issues X
Ranil, et al.: Analysis of Risk Factors for Temperature-Controlled Warehouses
Operations and Supply Chain Management 14(3) pp. 320 – 337 © 2021 327
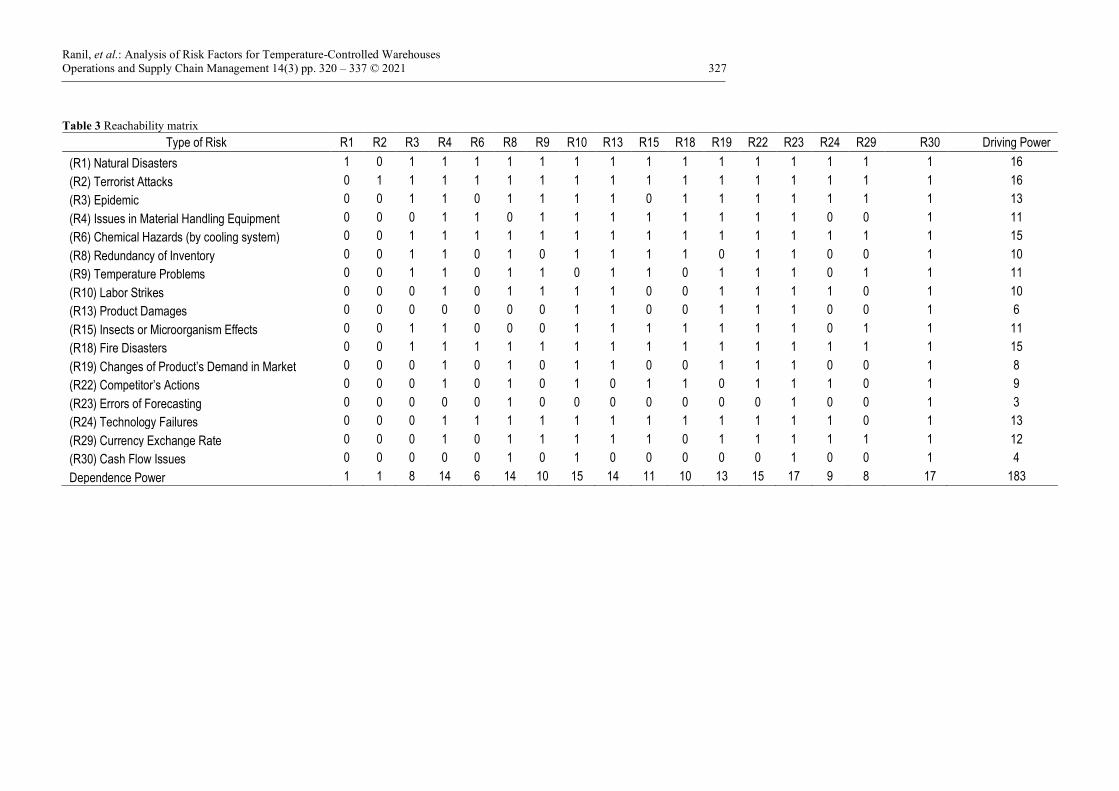
Table 3 Reachability matrix
Type of Risk R1 R2 R3 R4 R6 R8 R9 R10 R13 R15 R18 R19 R22 R23 R24 R29 R30 Driving Power
(R1) Natural Disasters 1 0 1 1 1 1 1 1 1 1 1 1 1 1 1 1 1 16
(R2) Terrorist Attacks 0 1 1 1 1 1 1 1 1 1 1 1 1 1 1 1 1 16
(R3) Epidemic 0 0 1 1 0 1 1 1 1 0 1 1 1 1 1 1 1 13
(R4) Issues in Material Handling Equipment 0 0 0 1 1 0 1 1 1 1 1 1 1 1 0 0 1 11
(R6) Chemical Hazards (by cooling system) 0 0 1 1 1 1 1 1 1 1 1 1 1 1 1 1 1 15
(R8) Redundancy of Inventory 0 0 1 1 0 1 0 1 1 1 1 0 1 1 0 0 1 10
(R9) Temperature Problems 0 0 1 1 0 1 1 0 1 1 0 1 1 1 0 1 1 11
(R10) Labor Strikes 0 0 0 1 0 1 1 1 1 0 0 1 1 1 1 0 1 10
(R13) Product Damages 0 0 0 0 0 0 0 1 1 0 0 1 1 1 0 0 1 6
(R15) Insects or Microorganism Effects 0 0 1 1 0 0 0 1 1 1 1 1 1 1 0 1 1 11
(R18) Fire Disasters 0 0 1 1 1 1 1 1 1 1 1 1 1 1 1 1 1 15
(R19) Changes of Product’s Demand in Market 0 0 0 1 0 1 0 1 1 0 0 1 1 1 0 0 1 8
(R22) Competitor’s Actions 0 0 0 1 0 1 0 1 0 1 1 0 1 1 1 0 1 9
(R23) Errors of Forecasting 0 0 0 0 0 1 0 0 0 0 0 0 0 1 0 0 1 3
(R24) Technology Failures 0 0 0 1 1 1 1 1 1 1 1 1 1 1 1 0 1 13
(R29) Currency Exchange Rate 0 0 0 1 0 1 1 1 1 1 0 1 1 1 1 1 1 12
(R30) Cash Flow Issues 0 0 0 0 0 1 0 1 0 0 0 0 0 1 0 0 1 4
Dependence Power 1 1 8 14 6 14 10 15 14 11 10 13 15 17 9 8 17 183

Ranil, et al.: Risk Factors for Temperature-Controlled Warehouses
328 Operations and Supply Chain Management 14(3) pp. 320 – 337 © 2021
According to Table 3, these binary digits amplify the
true or false status of each scenario (i, j). If any binary “1” is
included in a cell of reachability matrix, it means that
corresponding risk factor in row number makes considerable
impact on occurrence of corresponding risk factor in column
number. However, that does not mean there is any impact on
the corresponding risk factor in row number from
corresponding risk factor in column number.
Therefore, the total value of each row in reachability
matrix is describing the driving power of each risk factor that
belongs to corresponding row number. Accumulation of
each column in reachability matrix describes the dependent
power of each risk factor that belongs to corresponding
column number in reachability matrix.
3.2.3 Level Partitioning
The ultimate target of the reachability matrix is to
develop a hierarchy for each risk types that associate with
temperature-controlled warehouses. A Reachability set and
an Antecedent set for each risk type were obtained from the
reachability matrix. The reachability set of a particular risk
type consists of a risk type and other risk types which may
cause the risk under scrutiny. The antecedent set of an exact
risk type consists of a risk type and other risk types which
are triggered by the risk type under question. Subsequently,
the intersection set can be obtained using risk types that
belongs to both the reachability set and antecedent set. If the
particular type of risk elements of reachability set and
intersection are similar then that risk type will be prioritized
in the hierarchy (Talib et al., 2011). Then the prioritized risk
type is excluded from the subsequent iterations as we build
the hierarchy to include all risk types. The percentage value
of proximity to similarity factor was used to level partitions
over the iterations. The percentage of proximity to similarity
was calculated using the following equation:
Equation 1 Formula for the proximity to similarity
𝑃𝑒𝑟𝑐𝑒𝑛𝑡𝑎𝑔𝑒 𝑜𝑓 𝑝𝑟𝑜𝑥𝑖𝑚𝑖𝑡𝑦 𝑡𝑜 𝑠𝑖𝑚𝑖𝑙𝑎𝑟𝑖𝑡𝑦
=
𝑁𝑢𝑚𝑏𝑒𝑟 𝑜𝑓 𝑒𝑙𝑒𝑚𝑒𝑛𝑡𝑠 𝑐𝑜𝑛𝑠𝑖𝑠𝑡𝑒𝑑 𝑖𝑛 𝐼𝑛𝑡𝑒𝑟𝑠𝑒𝑐𝑡𝑖𝑜𝑛
𝑁𝑢𝑚𝑏𝑒𝑟 𝑜𝑓 𝑒𝑙𝑒𝑚𝑒𝑛𝑡𝑠 𝑐𝑜𝑛𝑠𝑖𝑠𝑡𝑒𝑑 𝑖𝑛 𝑅𝑒𝑎𝑐ℎ𝑎𝑏𝑖𝑙𝑖𝑡𝑦 𝑠𝑒𝑡
× 100%
Highest percentage of proximity to similarity risk types
were assigned as high levels of the hierarchy. Iterations of
the risk prioritization was conducted and the summary of the
11 iteration results are given in Table 4.
Table 4 Risk level prioritization
Type of Risk Reachability set Antecedent set Intersection Level Proximity
to similarity
(R1) Natural Disasters 1 1 1 11 100%
(R2) Terrorist Attacks 2 2 2 11 100%
(R3) Epidemic 3 1,2,3,6 3 9 100%
(R4) Issues in Material Handling Equipment
4,6,9,10,15,18,19 1,2,3,4,6,8,9,10,15, 18,19,24,29
4,6,9,10,15,18,19 4 100%
(R6) Chemical Hazards (by cooling system)
6 1,2,6 6 10 100%
(R8) Redundancy of Inventory
3,8,10,15,18 1,2,3,6,8,9,10,18,19,24,29 3,8,10,18 5 80%
(R9) Temperature Problems
3,9,15,29 1,2,3,6,9,18,24,29 3,9,29 7 75%
(R10) Labor Strikes 8,9,10,19,24 1,2,3,6,8,10,15,18,19,24,29 8,10,19,24 5 80%
(R13) Product Damages
10,13,19 1,2,3,4,6,8,9,10,13,15,18, 19,24,29
10,13,19 3 100%
(R15) Insects or Microorganism Effects
3,15,18,29 1,2,6,9,15,18,24,29 15,18,29 7 75%
(R18) Fire Disasters 3,6,18,24 1,2,3,6,18,24 3,6,18,24 8 100%
(R19) Changes of Product’s Demand in Market
19 1,2,3,6,9,15,18,19,24,29 19 6 100%
(R22) Competitor’s Actions
4,8,10,15,18,22,24 1,2,3,4,6,8,9,10,13,15,18, 19,22,24,29
4,8,10,15,18,22,24 2 100%
(R23) Errors of Forecasting
8,23,30 1,2,3,4,6,8,9,10,13,15,18, 19,22,23,24,29,30
8,23,30 1 100%
(R24) Technology Failures
6,18,24 1,2,3,6,18,24 6,18,24 8 100%
(R29) Currency Exchange Rate
9,15,24,29 1,2,3,6,9,15,18,29 9,15,29 7 75%
(R30) Cash Flow Issues
8,10,23,30 1,2,3,4,6,8,9,10,13,15,18, 19,22,23,24,29,30
8,10,23,30 1 100%
Ranil, et al.: Analysis of Risk Factors for Temperature-Controlled Warehouses
Operations and Supply Chain Management 14(3) pp. 320 – 337 © 2021 329
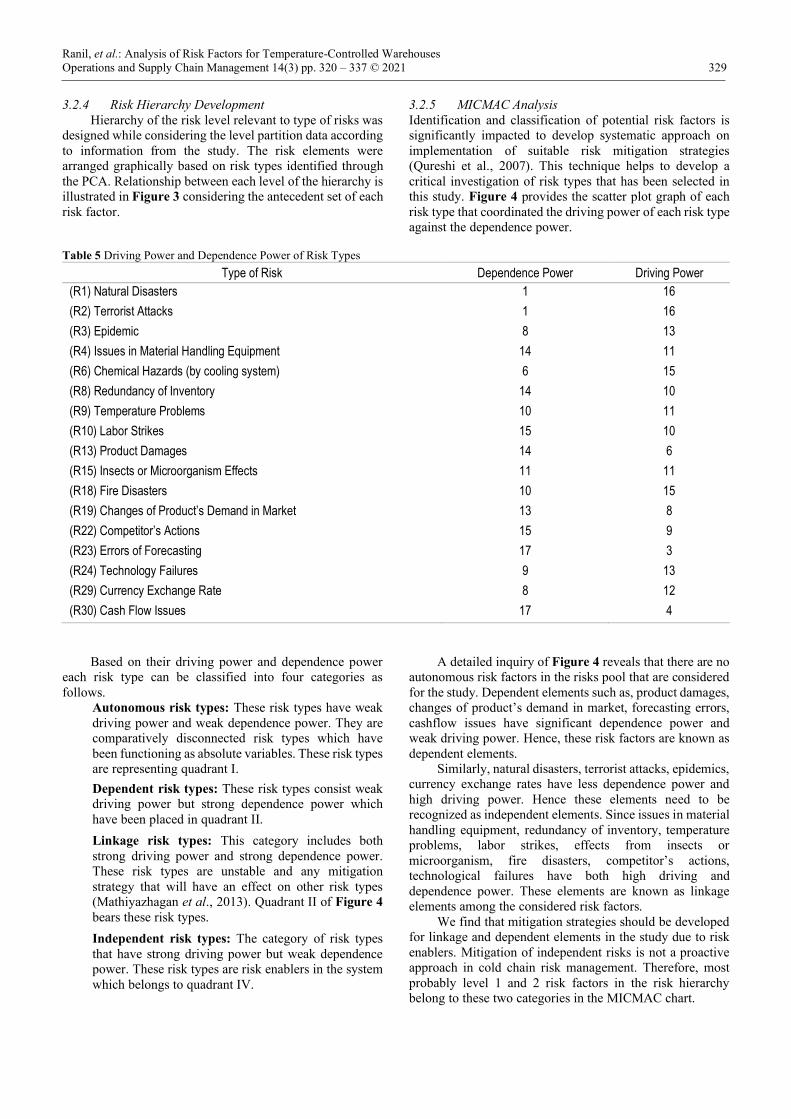
3.2.4 Risk Hierarchy Development
Hierarchy of the risk level relevant to type of risks was
designed while considering the level partition data according
to information from the study. The risk elements were
arranged graphically based on risk types identified through
the PCA. Relationship between each level of the hierarchy is
illustrated in Figure 3 considering the antecedent set of each
risk factor.
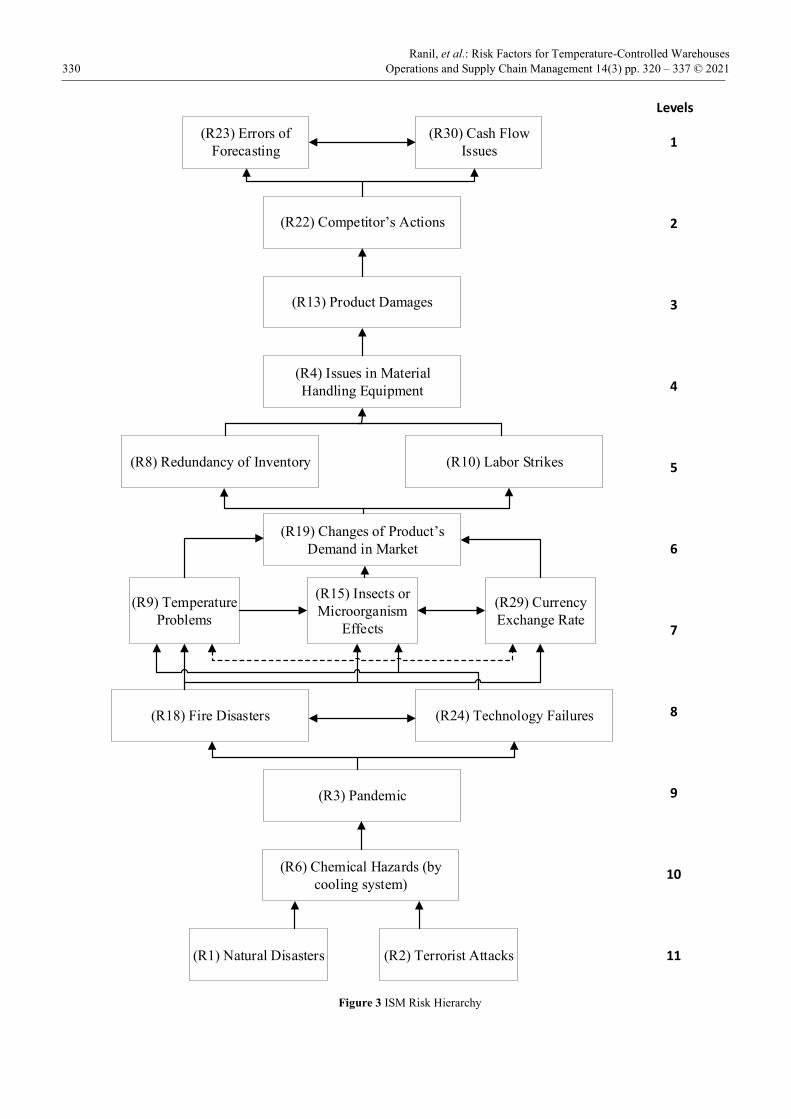
3.2.5 MICMAC Analysis
Identification and classification of potential risk factors is
significantly impacted to develop systematic approach on
implementation of suitable risk mitigation strategies
(Qureshi et al., 2007). This technique helps to develop a
critical investigation of risk types that has been selected in
this study. Figure 4 provides the scatter plot graph of each
risk type that coordinated the driving power of each risk type
against the dependence power.
Table 5 Driving Power and Dependence Power of Risk Types
Type of Risk Dependence Power Driving Power
(R1) Natural Disasters 1 16
(R2) Terrorist Attacks 1 16
(R3) Epidemic 8 13
(R4) Issues in Material Handling Equipment 14 11
(R6) Chemical Hazards (by cooling system) 6 15
(R8) Redundancy of Inventory 14 10
(R9) Temperature Problems 10 11
(R10) Labor Strikes 15 10
(R13) Product Damages 14 6
(R15) Insects or Microorganism Effects 11 11
(R18) Fire Disasters 10 15
(R19) Changes of Product’s Demand in Market 13 8
(R22) Competitor’s Actions 15 9
(R23) Errors of Forecasting 17 3
(R24) Technology Failures 9 13
(R29) Currency Exchange Rate 8 12
(R30) Cash Flow Issues 17 4
Based on their driving power and dependence power
each risk type can be classified into four categories as
follows.
Autonomous risk types: These risk types have weak
driving power and weak dependence power. They are
comparatively disconnected risk types which have
been functioning as absolute variables. These risk types
are representing quadrant I.
Dependent risk types: These risk types consist weak
driving power but strong dependence power which
have been placed in quadrant II.
Linkage risk types: This category includes both
strong driving power and strong dependence power.
These risk types are unstable and any mitigation
strategy that will have an effect on other risk types
(Mathiyazhagan et al., 2013). Quadrant II of Figure 4
bears these risk types.
Independent risk types: The category of risk types
that have strong driving power but weak dependence
power. These risk types are risk enablers in the system
which belongs to quadrant IV.
A detailed inquiry of Figure 4 reveals that there are no
autonomous risk factors in the risks pool that are considered
for the study. Dependent elements such as, product damages,
changes of product’s demand in market, forecasting errors,
cashflow issues have significant dependence power and
weak driving power. Hence, these risk factors are known as
dependent elements.
Similarly, natural disasters, terrorist attacks, epidemics,
currency exchange rates have less dependence power and
high driving power. Hence these elements need to be
recognized as independent elements. Since issues in material
handling equipment, redundancy of inventory, temperature
problems, labor strikes, effects from insects or
microorganism, fire disasters, competitor’s actions,
technological failures have both high driving and
dependence power. These elements are known as linkage
elements among the considered risk factors.
We find that mitigation strategies should be developed
for linkage and dependent elements in the study due to risk
enablers. Mitigation of independent risks is not a proactive
approach in cold chain risk management. Therefore, most
probably level 1 and 2 risk factors in the risk hierarchy
belong to these two categories in the MICMAC chart.
Ranil, et al.: Risk Factors for Temperature-Controlled Warehouses
330 Operations and Supply Chain Management 14(3) pp. 320 – 337 © 2021
(R22) Competitor s Actions
(R13) Product Damages
(R19) Changes of Product s
Demand in Market
(R4) Issues in Material
Handling Equipment
(R3) Pandemic
(R6) Chemical Hazards (by
cooling system)
Levels
1
2
3
4
5
6
7
8
9
10
11(R1) Natural Disasters (R2) Terrorist Attacks
(R24) Technology Failures(R18) Fire Disasters
(R9) Temperature
Problems
(R29) Currency
Exchange Rate
(R15) Insects or
Microorganism
Effects
(R8) Redundancy of Inventory (R10) Labor Strikes
(R23) Errors of
Forecasting
(R30) Cash Flow
Issues
Figure 3 ISM Risk Hierarchy
Ranil, et al.: Analysis of Risk Factors for Temperature-Controlled Warehouses
Operations and Supply Chain Management 14(3) pp. 320 – 337 © 2021 331
Figure 4 Driving Power and Dependence Power Diagram of Risk Factors
4 CASE STUDY
4.1 Overview of the Cold Warehouse A leading temperature-controlled warehouse service
provider was selected to assemble the Risk Enabling Factors
(REF) pertaining to the selected risk factors from the risk
hierarchy. This warehouse is the largest and most
technologically advanced temperature-controlled logistics
service provider in Sri Lanka. They have been operating for
15 years. The facility is fully racked with refrigerated air bag
enclosed dock areas, electrical material handling equipment,
clean and hygienic environment and cold chain compliance
while offering controlled temperature ranges for freezer,
chiller and ambient. Risk mitigation strategy prioritization
was implemented considering the logistics processes and
cold chain expertise of this warehouse.
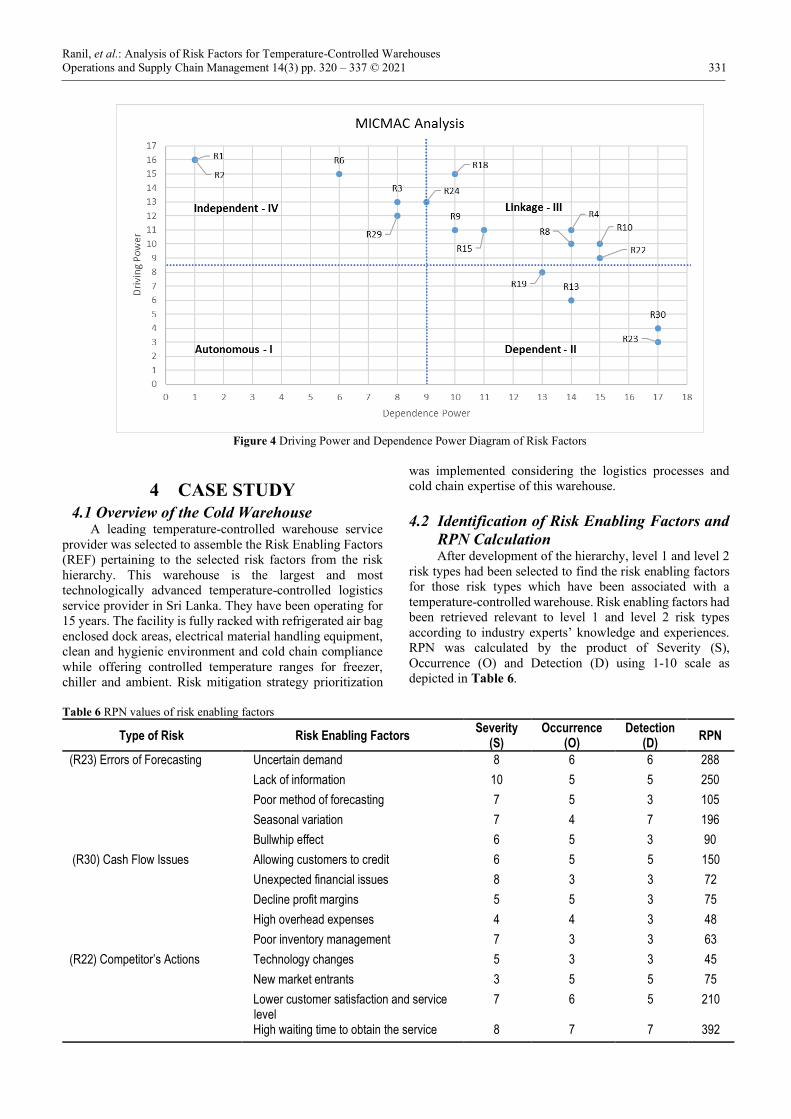
4.2 Identification of Risk Enabling Factors and
RPN Calculation After development of the hierarchy, level 1 and level 2
risk types had been selected to find the risk enabling factors
for those risk types which have been associated with a
temperature-controlled warehouse. Risk enabling factors had
been retrieved relevant to level 1 and level 2 risk types
according to industry experts’ knowledge and experiences.
RPN was calculated by the product of Severity (S),
Occurrence (O) and Detection (D) using 1-10 scale as
depicted in Table 6.
Table 6 RPN values of risk enabling factors
Type of Risk Risk Enabling Factors Severity
(S) Occurrence
(O) Detection
(D) RPN
(R23) Errors of Forecasting Uncertain demand 8 6 6 288
Lack of information 10 5 5 250
Poor method of forecasting 7 5 3 105
Seasonal variation 7 4 7 196
Bullwhip effect 6 5 3 90
(R30) Cash Flow Issues Allowing customers to credit 6 5 5 150
Unexpected financial issues 8 3 3 72
Decline profit margins 5 5 3 75
High overhead expenses 4 4 3 48
Poor inventory management 7 3 3 63
(R22) Competitor’s Actions Technology changes 5 3 3 45
New market entrants 3 5 5 75
Lower customer satisfaction and service level
7 6 5 210
High waiting time to obtain the service 8 7 7 392
Ranil, et al.: Risk Factors for Temperature-Controlled Warehouses
332 Operations and Supply Chain Management 14(3) pp. 320 – 337 © 2021
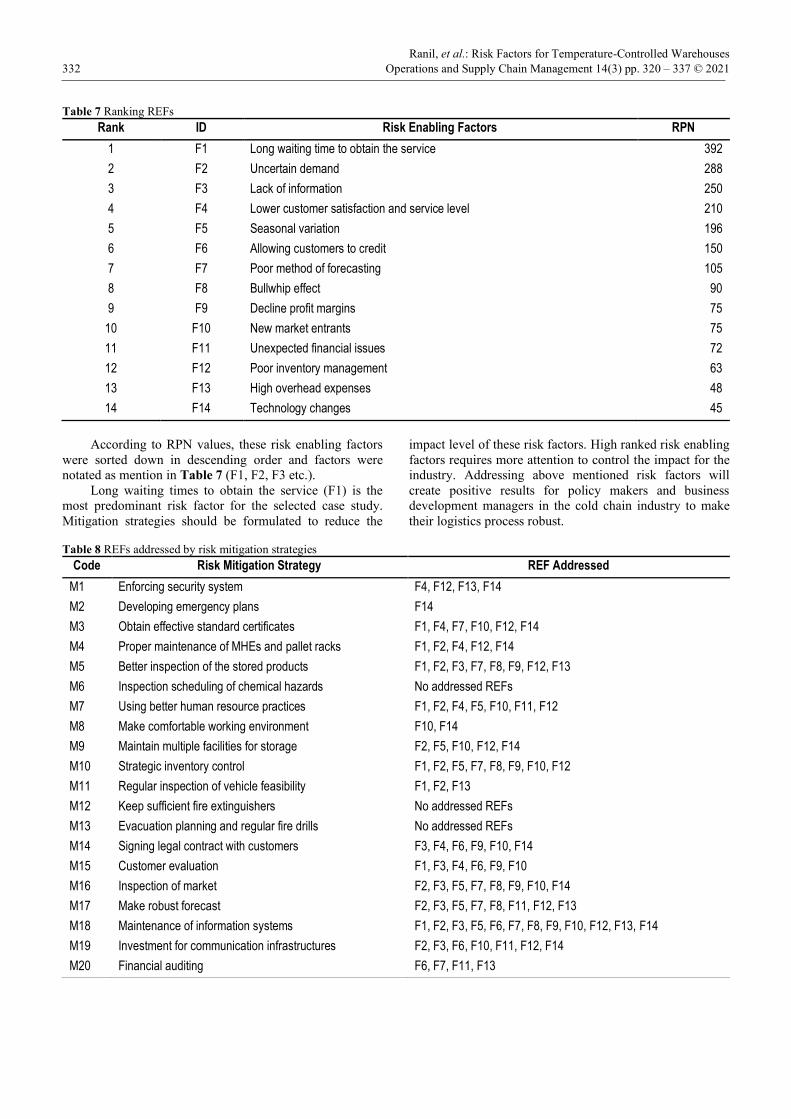
Table 7 Ranking REFs
Rank ID Risk Enabling Factors RPN
1 F1 Long waiting time to obtain the service 392
2 F2 Uncertain demand 288
3 F3 Lack of information 250
4 F4 Lower customer satisfaction and service level 210
5 F5 Seasonal variation 196
6 F6 Allowing customers to credit 150
7 F7 Poor method of forecasting 105
8 F8 Bullwhip effect 90
9 F9 Decline profit margins 75
10 F10 New market entrants 75
11 F11 Unexpected financial issues 72
12 F12 Poor inventory management 63
13 F13 High overhead expenses 48
14 F14 Technology changes 45
According to RPN values, these risk enabling factors
were sorted down in descending order and factors were
notated as mention in Table 7 (F1, F2, F3 etc.).
Long waiting times to obtain the service (F1) is the
most predominant risk factor for the selected case study.
Mitigation strategies should be formulated to reduce the
impact level of these risk factors. High ranked risk enabling
factors requires more attention to control the impact for the
industry. Addressing above mentioned risk factors will
create positive results for policy makers and business
development managers in the cold chain industry to make
their logistics process robust.
Table 8 REFs addressed by risk mitigation strategies
Code Risk Mitigation Strategy REF Addressed
M1 Enforcing security system F4, F12, F13, F14
M2 Developing emergency plans F14
M3 Obtain effective standard certificates F1, F4, F7, F10, F12, F14
M4 Proper maintenance of MHEs and pallet racks F1, F2, F4, F12, F14
M5 Better inspection of the stored products F1, F2, F3, F7, F8, F9, F12, F13
M6 Inspection scheduling of chemical hazards No addressed REFs
M7 Using better human resource practices F1, F2, F4, F5, F10, F11, F12
M8 Make comfortable working environment F10, F14
M9 Maintain multiple facilities for storage F2, F5, F10, F12, F14
M10 Strategic inventory control F1, F2, F5, F7, F8, F9, F10, F12
M11 Regular inspection of vehicle feasibility F1, F2, F13
M12 Keep sufficient fire extinguishers No addressed REFs
M13 Evacuation planning and regular fire drills No addressed REFs
M14 Signing legal contract with customers F3, F4, F6, F9, F10, F14
M15 Customer evaluation F1, F3, F4, F6, F9, F10
M16 Inspection of market F2, F3, F5, F7, F8, F9, F10, F14
M17 Make robust forecast F2, F3, F5, F7, F8, F11, F12, F13
M18 Maintenance of information systems F1, F2, F3, F5, F6, F7, F8, F9, F10, F12, F13, F14
M19 Investment for communication infrastructures F2, F3, F6, F10, F11, F12, F14
M20 Financial auditing F6, F7, F11, F13
Ranil, et al.: Analysis of Risk Factors for Temperature-Controlled Warehouses
Operations and Supply Chain Management 14(3) pp. 320 – 337 © 2021 333
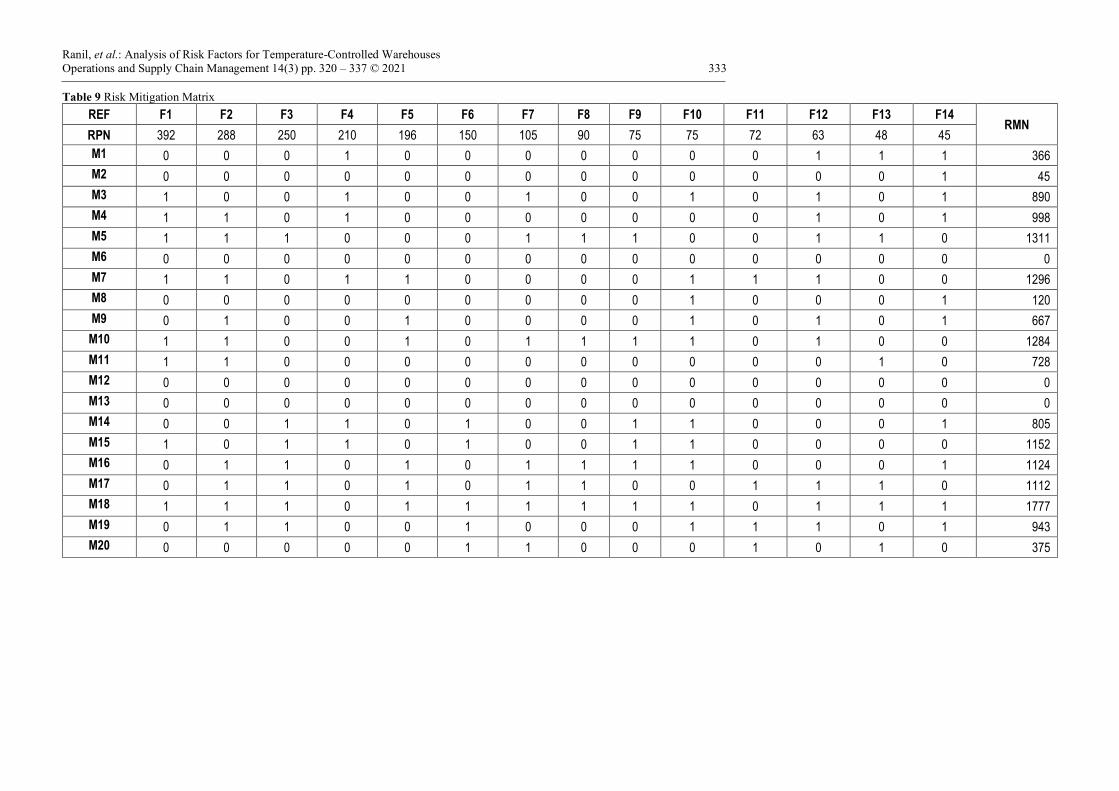
Table 9 Risk Mitigation Matrix
REF F1 F2 F3 F4 F5 F6 F7 F8 F9 F10 F11 F12 F13 F14 RMN
RPN 392 288 250 210 196 150 105 90 75 75 72 63 48 45
M1 0 0 0 1 0 0 0 0 0 0 0 1 1 1 366
M2 0 0 0 0 0 0 0 0 0 0 0 0 0 1 45
M3 1 0 0 1 0 0 1 0 0 1 0 1 0 1 890
M4 1 1 0 1 0 0 0 0 0 0 0 1 0 1 998
M5 1 1 1 0 0 0 1 1 1 0 0 1 1 0 1311
M6 0 0 0 0 0 0 0 0 0 0 0 0 0 0 0
M7 1 1 0 1 1 0 0 0 0 1 1 1 0 0 1296
M8 0 0 0 0 0 0 0 0 0 1 0 0 0 1 120
M9 0 1 0 0 1 0 0 0 0 1 0 1 0 1 667
M10 1 1 0 0 1 0 1 1 1 1 0 1 0 0 1284
M11 1 1 0 0 0 0 0 0 0 0 0 0 1 0 728
M12 0 0 0 0 0 0 0 0 0 0 0 0 0 0 0
M13 0 0 0 0 0 0 0 0 0 0 0 0 0 0 0
M14 0 0 1 1 0 1 0 0 1 1 0 0 0 1 805
M15 1 0 1 1 0 1 0 0 1 1 0 0 0 0 1152
M16 0 1 1 0 1 0 1 1 1 1 0 0 0 1 1124
M17 0 1 1 0 1 0 1 1 0 0 1 1 1 0 1112
M18 1 1 1 0 1 1 1 1 1 1 0 1 1 1 1777
M19 0 1 1 0 0 1 0 0 0 1 1 1 0 1 943
M20 0 0 0 0 0 1 1 0 0 0 1 0 1 0 375
Ranil, et al.: Risk Factors for Temperature-Controlled Warehouses
334 Operations and Supply Chain Management 14(3) pp. 320 – 337 © 2021
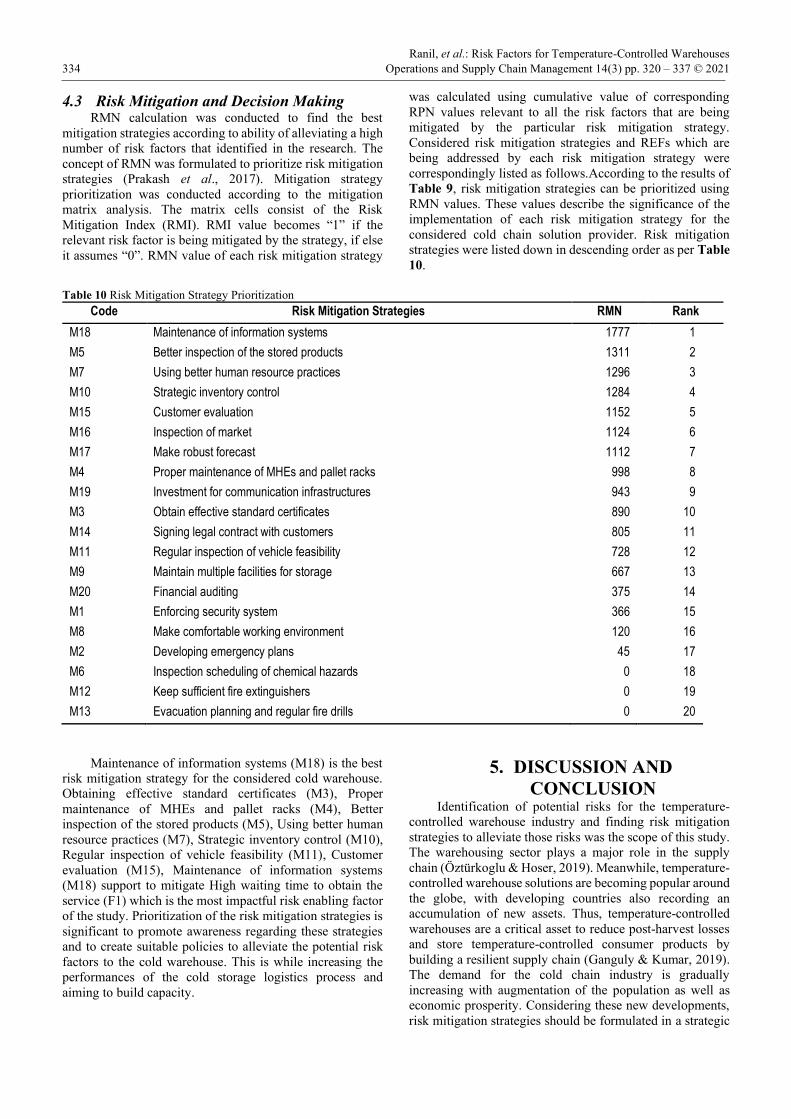
4.3 Risk Mitigation and Decision Making RMN calculation was conducted to find the best
mitigation strategies according to ability of alleviating a high
number of risk factors that identified in the research. The
concept of RMN was formulated to prioritize risk mitigation
strategies (Prakash et al., 2017). Mitigation strategy
prioritization was conducted according to the mitigation
matrix analysis. The matrix cells consist of the Risk
Mitigation Index (RMI). RMI value becomes “1” if the
relevant risk factor is being mitigated by the strategy, if else
it assumes “0”. RMN value of each risk mitigation strategy
was calculated using cumulative value of corresponding
RPN values relevant to all the risk factors that are being
mitigated by the particular risk mitigation strategy.
Considered risk mitigation strategies and REFs which are
being addressed by each risk mitigation strategy were
correspondingly listed as follows.According to the results of
Table 9, risk mitigation strategies can be prioritized using
RMN values. These values describe the significance of the
implementation of each risk mitigation strategy for the
considered cold chain solution provider. Risk mitigation
strategies were listed down in descending order as per Table
10.
Table 10 Risk Mitigation Strategy Prioritization
Code Risk Mitigation Strategies RMN Rank
M18 Maintenance of information systems 1777 1
M5 Better inspection of the stored products 1311 2
M7 Using better human resource practices 1296 3
M10 Strategic inventory control 1284 4
M15 Customer evaluation 1152 5
M16 Inspection of market 1124 6
M17 Make robust forecast 1112 7
M4 Proper maintenance of MHEs and pallet racks 998 8
M19 Investment for communication infrastructures 943 9
M3 Obtain effective standard certificates 890 10
M14 Signing legal contract with customers 805 11
M11 Regular inspection of vehicle feasibility 728 12
M9 Maintain multiple facilities for storage 667 13
M20 Financial auditing 375 14
M1 Enforcing security system 366 15
M8 Make comfortable working environment 120 16
M2 Developing emergency plans 45 17
M6 Inspection scheduling of chemical hazards 0 18
M12 Keep sufficient fire extinguishers 0 19
M13 Evacuation planning and regular fire drills 0 20
Maintenance of information systems (M18) is the best
risk mitigation strategy for the considered cold warehouse.
Obtaining effective standard certificates (M3), Proper
maintenance of MHEs and pallet racks (M4), Better
inspection of the stored products (M5), Using better human
resource practices (M7), Strategic inventory control (M10),
Regular inspection of vehicle feasibility (M11), Customer
evaluation (M15), Maintenance of information systems
(M18) support to mitigate High waiting time to obtain the
service (F1) which is the most impactful risk enabling factor
of the study. Prioritization of the risk mitigation strategies is
significant to promote awareness regarding these strategies
and to create suitable policies to alleviate the potential risk
factors to the cold warehouse. This is while increasing the
performances of the cold storage logistics process and
aiming to build capacity.
5. DISCUSSION AND
CONCLUSION Identification of potential risks for the temperature-
controlled warehouse industry and finding risk mitigation
strategies to alleviate those risks was the scope of this study.
The warehousing sector plays a major role in the supply
chain (Öztürkoglu & Hoser, 2019). Meanwhile, temperature-
controlled warehouse solutions are becoming popular around
the globe, with developing countries also recording an
accumulation of new assets. Thus, temperature-controlled
warehouses are a critical asset to reduce post-harvest losses
and store temperature-controlled consumer products by
building a resilient supply chain (Ganguly & Kumar, 2019).
The demand for the cold chain industry is gradually
increasing with augmentation of the population as well as
economic prosperity. Considering these new developments,
risk mitigation strategies should be formulated in a strategic
Ranil, et al.: Analysis of Risk Factors for Temperature-Controlled Warehouses
Operations and Supply Chain Management 14(3) pp. 320 – 337 © 2021 335
manner to improve the performance of the cold chain sector
that is vital to many other consumer-oriented supply chains.
Risks related to the temperature-controlled warehouse
industry have been identified in this study. Thirty risk types
were identified through literature and industry experts.
Seventeen significant risk types were selected using PCA.
ISM methodology was implemented on the selected risk
types and risk prioritization hierarchy was subsequently
developed. Errors of forecasting and Cash flow issues were
identified to be in level 1 and Competitor’s actions were
understood to be in level 2 in the hierarchy vertex.
MICMAC analysis provides categorization of each risk
types as Autonomous, Dependent, Linkage and Independent.
This categorization makes a significant managerial
implication to recognize the attributes of each risk type that
makes the cold chain warehousing industry more vulnerable.
It needs to be picked out that Dependent elements of the
MICMAC diagram should be alleviated. These risk types are
positioned on the top and middle level of the ISM hierarchy.
Therefore, more risk factors in the system enable other risk
factors which belong to this category while making
significant impacts on business continuity. Therefore,
elements in this category have a significant impact to reduce
the performances of the cold warehouses. Autonomous
elements can spring up in different uncertainties. Mitigation
strategies are not significantly addressing these risk types.
There are no Autonomous elements as depicted in MICMAC
chart relative to the study. Risk mitigation strategies should
be developed to mitigate impact of leading risk types
(Ganguly & Kumar, 2019). Cold chains should be subjected
to more strategic planning and scheduled training programs
to reduce the impact level of independent risk elements. This
is because these risk types cannot be eliminated due to
instantaneous result of various hazards. However,
autonomous risk factors are difficult to find due to the
network of relations among any risk factors that are
considered for this study. It is important to prioritize
mitigation strategies that affect on Linkage elements since
these risk types are the system connectors in the risk
hierarchy. Most Independent elements can occur without any
warnings. Therefore, it is imperative to have preplanned
mitigation strategies to reduce the impact of these risk types.
Risk enabling factors were listed down in alignment to
the case study and RPN values were calculated using product
of severity, occurrence and detection of each risk enabling
factor. RMN values were generated and prioritization was
conducted while completing the final research objective
which was “to reveal the best risk mitigation strategy in order
to minimize most impactful risk enabling factor”. Most
impactful risk enabling factor is Long waiting time to obtain
the service (F1) and the best mitigation strategy to alleviate
this risk factor is Maintenance of information systems (M18)
while addressing some other risk enabling factors of the case
study.
Business uncertainty is created through potential risk
factors. Thus, the warehouse industry increasingly pays
attention on potential risks and to alleviate the impact of
these risk factors (Öztürkoglu & Hoser, 2019). The ability to
mitigate risks would enforce organizations to comply with
their future business targets and goals. The Business
Continuity Plan (BCP) is extremely important for smooth
operations of cold chains. It consists of risk analysis and risk
mitigation strategies that can be conducted to reduce the
impact of uncertainties (Wieteska, 2020). This paper will
provide guidance to develop an effective business continuity
plan for the cold chain industry policy makers. Strategic level
leaders should aim to provide more leadership in strategic
planning and training decision makers to reduce the impact
level of risk factors which are positioned on the Independent
elements of MICMAC analysis. Namely (R1) Natural
Disasters, (R2) Terrorist Attacks, (R3) Epidemic (R6)
Chemical Hazards (by cooling system), (R29) Currency
Exchange Rate are extremely important to consider as
critical for the development of proper risk mitigation
strategies. Safety programs, regular fire drills, regular
inspection schedules, developing occupational hygiene rules
are important to be practical in proactive and reactive
approaches of the cold chain industry while focusing on
survival in unexpected molestations.
It is important to note that the authors considered
epidemics as a risk factor for this analysis. This was ahead
of the manifestation of the COVID-19 pandemic that has
made a huge impact to all supply chains, including cold
chains (Ahlqvist et al., 2020; Enyinda, 2018). Our analysis
shows that the epidemic risk factor (which could also be
elongated to a pandemic) belongs to quadrant IV which
indicates the Independent elements. Also, the epidemic risk
factor is included in level 9 of 11 in the risk hierarchy. That
means epidemics can be accountable for 73% of risk factors’
levels in this hierarchy. Thus, our findings show that an
epidemic/pandemic can make a serious impact to any supply
chain while driving other risk factors to an active level.
However, according to the MICMAC analysis the pandemic
risk does not directly impact cold chains (Ahlqvist et al.,
2020). Instead, other risk factors are triggered by it to derail
the cold chain. These depending risk factors create undesired
vulnerability in the cold chain warehouses. We find that it is
salient to follow reactive approaches while implementing
safety methods to avoid spread of a pandemic to escape from
any interruptions to the cold chain which is vital to the proper
functioning of the healthcare industry and food industry also.
ACKNOWLEDGEMENT The authors wsih to thank University of Moratuwa, Sri
Lanka’s Senate Research Committee Grant ID
SRC/LT/2020/20 for supporting this research.
REFERENCES Ahlqvist, V., Norrman, A., & Jahre, M. (2020). Supply chain risk
governance: Towards a conceptual multi-level framework. Operations and Supply Chain Management, 13(4), 382–395.
https://doi.org/10.31387/oscm0430278
Akterian, S. G., & Fikiin, K. A. (1994). Numerical simulation of
unsteady heat conduction in arbitrary shaped canned foods during sterilization processes. Journal of Food Engineering,
21(3), 343-354.
Ali, I., Nagalingam, S., & Gurd, B. (2018). A resilience model for
cold chain logistics of perishable products. International Journal of Logistics Management, 29(3), 922–941.
https://doi.org/10.1108/IJLM-06-2017-0147
Aung, M. M., & Chang, Y. S. (2014). Temperature management for
the quality assurance of a perishable food supply chain. Food Control, 40, 198–207.
Balachandra, K., Perera, H. N., & Thibbotuwawa, A. (2020).
Human Factor in Forecasting and Behavioral Inventory
Ranil, et al.: Risk Factors for Temperature-Controlled Warehouses
336 Operations and Supply Chain Management 14(3) pp. 320 – 337 © 2021
Decisions: A System Dynamics Perspective. In International
Conference on Dynamics in Logistics (pp. 516-526).
Springer, Cham. Basl, J. (2017). Pilot Study of Readiness of Czech Companies to
Implement the Principles of Industry 4.0. Management and
Production Engineering Review, 8(2), 3–8.
https://doi.org/10.1515/mper-2017-0012 Bishara, R. H. (2006). Cold chain management - An essential
component of the global pharmaceutical supply chain.
American Pharmaceutical Review, 9(1), 105–109.
Chaudhuri, A., Dukovska-Popovska, I., Subramanian, N., Chan, H. K., & Bai, R. (2018). Decision-making in cold chain logistics
using data analytics: a literature review. International Journal
of Logistics Management, 29(3), 839–861.
https://doi.org/10.1108/IJLM-03-2017-0059 Chen, A., Hsieh, C.-Y., & Wee, H. M. (2013). Mitigation of Losses
through Regional Purchasing Strategy: A Case Study for an
Automobile Company. Information Technology and
Computer Science, 4, 563–569. Craighead, C. W., Blackhurst, J., Rungtusanatham, M. J., &
Handfield, R. B. (2007). The severity of supply chain
disruptions: design characteristics and mitigation capabilities. Decision Sciences, 38(1), 131-156.
Dehdar, E., Azizi, A., & Aghabeigi, S. (2018). Supply Chain Risk
Mitigation Strategies in Automotive Industry : A Review.
2018 IEEE International Conference on Industrial Engineering and Engineering Management (IEEM), 84–88.
Elias, N., Yahya, N. M., & Sing, E. H. (2018). Numerical analysis
of fuzzy logic temperature and humidity control system in
pharmaceutical warehouse using MATLAB fuzzy toolbox. In Lecture Notes in Mechanical Engineering (Vol. 0, Issue
9789811087875). Springer Singapore.
https://doi.org/10.1007/978-981-10-8788-2_56
Enyinda, C. I. (2018). Modeling enterprise risk management in operations and supply chain: A pharmaceutical firm context.
Operations and Supply Chain Management, 11(1), 1–12.
https://doi.org/10.31387/oscm0300195
Fahimnia, B., Tang, C. S., Davarzani, H., & Sarkis, J. (2015). Quantitative models for managing supply chain risks: A
review. European Journal of Operational Research, 247(1),
1–15. https://doi.org/10.1016/j.ejor.2015.04.034
Farid, M. F., Elbarky, A. M., & Saeed, A. M. (2016). Superior rectus and lateral rectus muscle union surgery in the treatment
of myopic strabismus fixus: three sutures versus a single
suture. Journal of American Association for Pediatric
Ophthalmology and Strabismus, 20(2), 100–105. Fikiin, K. (2015). Temperature control strategies for smarter energy
use in refrigerated warehouses. Refrigeration Science An,
18(4), 76–79.
For, W., & Storage, C. (1958). A Lomv2o b4 Aua’a. Ganguly, K. K., & Kumar, G. (2019). Supply chain risk assessment:
A fuzzy AHP approach. Operations and Supply Chain
Management, 12(1), 1–13.
https://doi.org/10.31387/oscm0360217 Gligor, D., Tan, A., & Nguyen, T. N. T. (2018). The obstacles to
cold chain implementation in developing countries: insights
from Vietnam. International Journal of Logistics
Management, 29(3), 942–958. https://doi.org/10.1108/IJLM-02-2017-0026
Grabowski, M., & Roberts, K. (1997). Risk mitigation in large-
scale systems: Lessons from high reliability organizations.
California management review, 39(4), 152-161. Hendricks, K. B., & Singhal, V. R. (2005). An empirical analysis
of the effect of supply chain disruptions on long‐run stock
price performance and equity risk of the firm. Production and
Operations management, 14(1), 35-52 Ho, W., Zheng, T., Yildiz, H., & Talluri, S. (2015). Supply chain
risk management: A literature review. In International
Journal of Production Research (Vol. 53, Issue 16, pp. 5031–
5069). Taylor and Francis Ltd.
https://doi.org/10.1080/00207543.2015.1030467
James, S. J., & James, C. J. F. R. I. (2010). The food cold-chain and climate change. Food Research International, 43(7), 1944-
1956.
Joshi, R., Banwet, D. K., Shankar, R., & Gandhi, J. (2012).
Performance improvement of cold chain in an emerging economy. Production Planning & Control, 23(10-11), 817-
836.
Jüttner, U., Peck, H., & Christopher, M. (2003). Supply chain risk
management: outlining an agenda for future research. International Journal of Logistics: Research and
Applications, 6(4), 197–210.
Kłosowski, G., Gola, A., & Amila, T. (2018). Computational
intelligence in control of AGV multimodal systems. Ifac-papersonline, 51(11), 1421-1427
Mangla, S. K., Kumar, P., & Barua, M. K. (2015). Risk analysis in
green supply chain using fuzzy AHP approach: A case study.
Resources, Conservation and Recycling, 104, 375–390. https://doi.org/10.1016/j.resconrec.2015.01.001
Martin, W. E., Martin, I. M., & Kent, B. (2009). The role of risk
perceptions in the risk mitigation process: The case of wildfire in high risk communities. Journal of Environmental
Management, 91(2), 489–498. https://doi.org/10.1016/j.
jenvman. 2009.09.007
Mathiyazhagan, K., Govindan, K., NoorulHaq, A., & Geng, Y. (2013). An ISM approach for the barrier analysis in
implementing green supply chain management. Journal of
Cleaner Production, 47, 283–297.
https://doi.org/10.1016/j.jclepro.2012.10.042 Öztürkoglu, Ö., & Hoser, D. (2019). An evaluation of order-picking
tour efficiency in two-block warehouses. Operations and
Supply Chain Management, 12(2), 74–87.
https://doi.org/10.31387/oscm0370225 Perera, H. N., Fahimnia, B., & Tokar, T. (2020). Inventory and
ordering decisions: a systematic review on research driven
through behavioral experiments. International Journal of
Operations & Production Management. Perera, H. N., & Sugathadasa, P.T.R.S. (2014). Investigating
manufacturing supply chain transformations: a Sri Lankan
context. International Symposium on Logistics 2014.
Perera, H. N., Thibbotuwawa A., Rajasooriyar C., & Sugathadasa, P.T.R.S. (2016) Managing Supply Chain Transformation
Projects in the Manufacturing Sector: Case-based Learning
from Sri Lanka, Research for Transport & Logistics Industry
Conference (R4TLI), 2016, Colombo, Sri Lanka Prakash, S., Soni, G., Rathore, A. P. S., & Singh, S. (2017). Risk
analysis and mitigation for perishable food supply chain: a
case of dairy industry. Benchmarking, 24(1), 2–23.
https://doi.org/10.1108/BIJ-07-2015-0070 Prajogo, D., & Olhager, J. (2012). Supply chain integration and
performance: The effects of long-term relationships,
information technology and sharing, and logistics integration.
International Journal of Production Economics, 135(1), 514-522.
Qureshi, M. N., Kumar, D., & Kumar, P. (2007). Modeling the
logistics outsourcing relationship variables to enhance
shippers’ productivity and competitiveness in logistical supply chain. International Journal of Productivity and
Performance Management, 56(8), 689–714.
Shrouf, F., Ordieres, J., & Miragliotta, G. (2014). Smart factories in
Industry 4.0: A review of the concept and of energy management approached in production based on the Internet
of Things paradigm. IEEE International Conference on
Industrial Engineering and Engineering Management, 2015-
Janua, 697–701. Siddh, M. M., Soni, G., Jain, R., Sharma, M. K., & Yadav, V.
(2017). Agri-fresh food supply chain quality (AFSCQ): a
literature review. Industrial Management & Data Systems.
Ranil, et al.: Analysis of Risk Factors for Temperature-Controlled Warehouses
Operations and Supply Chain Management 14(3) pp. 320 – 337 © 2021 337
Simchi-Levi, D., Kaminsky, P., & Simchi-Levi, E. (2004).
Managing the Supply Chain: Definitive Guide. Tata
McGraw-Hill Education. Smith, D., & Sparks, L. (2007). Temperature Controlled Supply
Chains. In Food Supply Chain Management.
https://doi.org/10.1002/9780470995556.ch12
Sodhi, M. S., Son, B.-G., & Tang, C. S. (2012). Researchers’ perspectives on supply chain risk management. Production
and Operations Management, 21(1), 1–13.
Sugathadasa, P. T. R. S., Perera, H. N., & Liyanage, A. K. (2020).
Effective Management of Manufacturing Supply Chain Risks: A Sri Lankan Perspective. ENGINEER, 53(03), 63-76.
Sugathadasa, P.T.R.S. & Rajapaksha, S. S. (2011). An investigation
on relationship between third party logistics user and
provider at FMCG industry in Sri Lanka. Talib, F., Rahman, Z., & Qureshi, M. N. (2011). An interpretive
structural modelling approach for modelling the practices of
total quality management in service sector. International
Journal of Modelling in Operations Management, 1(3), 223. https://doi.org/10.1504/ ijmom.2011.039528
Tang, C. S. (2006). Perspectives in supply chain risk management.
International Journal of Production Economics, 103(2), 451–488. https://doi.org/10.1016/j.ijpe.2005.12.006
Wieteska, G. (2020). The impact of supplier involvement in product
development on supply chain risks and supply chain
resilience. Operations and Supply Chain Management, 13(4), 359–374. https://doi.org/10.31387/oscm0430276
Zawadzki, P., & Zywicki, K. (2016). Smart product design and
production control for effective mass customization in the
industry 4.0 concept. Management and Production Engineering Review, 7(3), 105–112.
https://doi.org/10.1515/mper-2016-0030
Zhang, J., Liu, L., Mu, W., Moga, L. M., & Zhang, X. (2009).
Development of temperature-managed traceability system for frozen and chilled food during storage and transportation.
Journal of Food, Agriculture & Environment, 7(3&4), 28-31.
Ziance, R., Chandler, C., & Bishara, R. H. (2009). Integration of
temperature-controlled requirements into pharmacy practice. Journal of the American Pharmacists Association, 49(3), e61-
e69.
Zsidisin, G. A., Panelli, A., & Upton, R. (2000). Purchasing
organization involvement in risk assessments, contingency plans, and risk management: an exploratory study. Supply
Chain Management: An International Journal, 5(4), 187–
198.
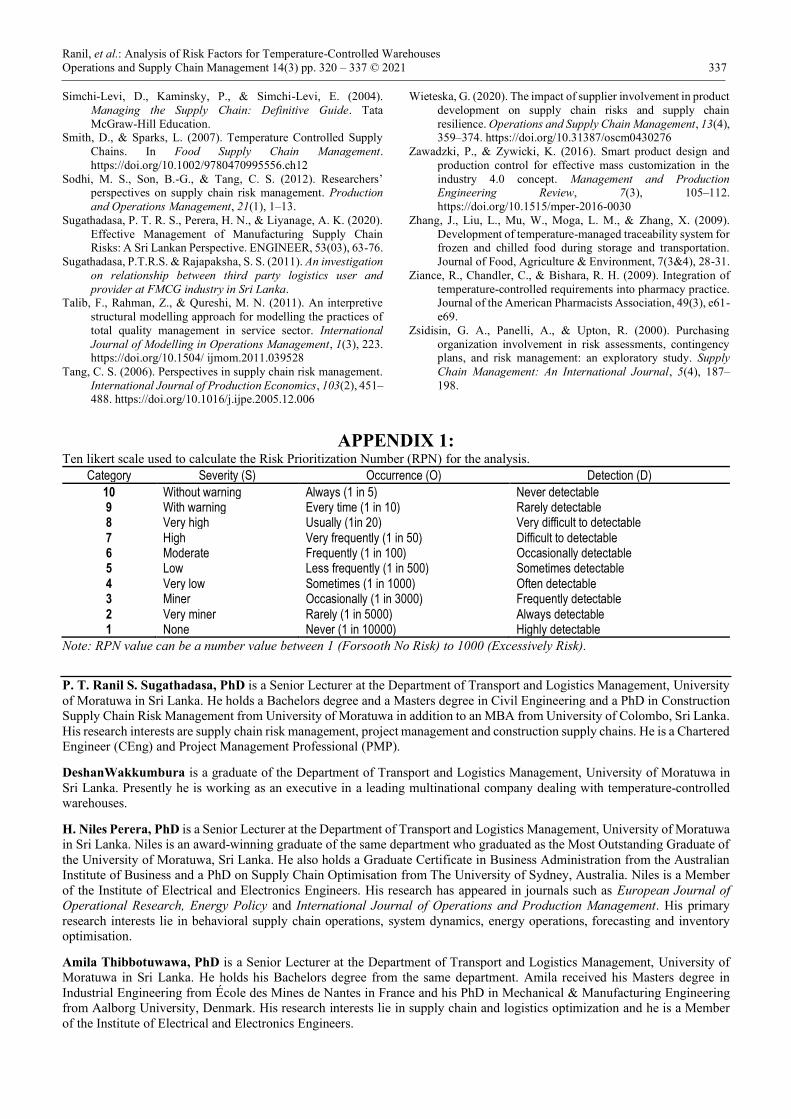
APPENDIX 1: Ten likert scale used to calculate the Risk Prioritization Number (RPN) for the analysis.
Category Severity (S) Occurrence (O) Detection (D)
10 Without warning Always (1 in 5) Never detectable 9 With warning Every time (1 in 10) Rarely detectable 8 Very high Usually (1in 20) Very difficult to detectable 7 High Very frequently (1 in 50) Difficult to detectable 6 Moderate Frequently (1 in 100) Occasionally detectable 5 Low Less frequently (1 in 500) Sometimes detectable 4 Very low Sometimes (1 in 1000) Often detectable 3 Miner Occasionally (1 in 3000) Frequently detectable 2 Very miner Rarely (1 in 5000) Always detectable 1 None Never (1 in 10000) Highly detectable
Note: RPN value can be a number value between 1 (Forsooth No Risk) to 1000 (Excessively Risk).
P. T. Ranil S. Sugathadasa, PhD is a Senior Lecturer at the Department of Transport and Logistics Management, University
of Moratuwa in Sri Lanka. He holds a Bachelors degree and a Masters degree in Civil Engineering and a PhD in Construction
Supply Chain Risk Management from University of Moratuwa in addition to an MBA from University of Colombo, Sri Lanka.
His research interests are supply chain risk management, project management and construction supply chains. He is a Chartered
Engineer (CEng) and Project Management Professional (PMP).
DeshanWakkumbura is a graduate of the Department of Transport and Logistics Management, University of Moratuwa in
Sri Lanka. Presently he is working as an executive in a leading multinational company dealing with temperature-controlled
warehouses.
H. Niles Perera, PhD is a Senior Lecturer at the Department of Transport and Logistics Management, University of Moratuwa
in Sri Lanka. Niles is an award-winning graduate of the same department who graduated as the Most Outstanding Graduate of
the University of Moratuwa, Sri Lanka. He also holds a Graduate Certificate in Business Administration from the Australian
Institute of Business and a PhD on Supply Chain Optimisation from The University of Sydney, Australia. Niles is a Member
of the Institute of Electrical and Electronics Engineers. His research has appeared in journals such as European Journal of
Operational Research, Energy Policy and International Journal of Operations and Production Management. His primary
research interests lie in behavioral supply chain operations, system dynamics, energy operations, forecasting and inventory
optimisation.
Amila Thibbotuwawa, PhD is a Senior Lecturer at the Department of Transport and Logistics Management, University of
Moratuwa in Sri Lanka. He holds his Bachelors degree from the same department. Amila received his Masters degree in
Industrial Engineering from École des Mines de Nantes in France and his PhD in Mechanical & Manufacturing Engineering
from Aalborg University, Denmark. His research interests lie in supply chain and logistics optimization and he is a Member
of the Institute of Electrical and Electronics Engineers.