Embed Size (px)
Citation preview

Analysis of QAQC Data:How Good is Good Enough?
Dennis Arne, PGeo (BC), RPGeo (AIG), Principal Consultant ‐ Geochemistry, CSA Global
www.csaglobal.com 1
OrHow to Make a Talk on QAQC Interesting
Vancouver MEG, December 15, 2016

Global Office Locations & Projects
2
Outline
Vancouver MEG, December 15, 2016
•What do the reporting codes have to say about QAQC?• Sampling – getting it right from the start• The importance of the correct digestion method•QAQC train wrecks•What’s it really all about?

Global Office Locations & Projects
3
NI43‐101
• Item 11: Sample Preparation, Analyses, and Security – Describe– (a) sample preparation methods and quality control measures employed before dispatch of samples to an analytical or testing laboratory, the method or process of sample splitting and reduction, and the security measures taken to ensure the validity and integrity of samples taken;
–(b) relevant information regarding sample preparation, assaying and analytical procedures used, the name and location of the analytical or testing laboratories, the relationship of the laboratory to the issuer, and whether the laboratories are certified by any standards association and the particulars of any certification;
–(c) a summary of the nature, extent, and results of quality control procedures employed and quality assurance actions taken or recommended to provide adequate confidence in the data collection and processing; and
–(d) the author's opinion on the adequacy of sample preparation, security, and analytical procedures.
But that’s But that’s not always the QP’s job!
Vancouver MEG, December 15, 2016

Global Office Locations & Projects
4
JORC 2012 Table 1
• “The nature, quality and appropriateness of the assaying and laboratory procedures used and whether the technique is considered partial or total.”
• “For geophysical tools, spectrometers, handheld XRF instruments, etc, the parameters used in determining the analysis including instrument make and model, reading times, calibrations factors applied and their derivation, etc.”
• “Nature of quality control procedures adopted (standards, blanks, duplicates, external laboratory checks) and whether acceptable levels of accuracy (ie lack of bias) and precision have been established.”
Vancouver MEG, December 15, 2016
So what is acceptable?

Global Office Locations & Projects
5
What We Often Do
• “The QAQC protocols meet current industry best practice.”
• “Paired field duplicate data suggest that the gold grades are difficult to reproduce by fire assay….However this trend is not uncommon in gold deposits with highly variable grades.”
• “In the opinion (of the QP), the data are sufficiently reliable for the purposes of resource estimation.”
Vancouver MEG, December 15, 2016

Global Office Locations & Projects
6
Sampling & Analysis
• Sample size, grain size and analytical methods generally default to convention or what the labs recommend
• Should be optimised for individual projects (ie. what are the data quality expectations for the project?)
• Objective is to obtain representative samples• The digestion should be relevant for proposed mineral processing• Have we maximised precision (i.e. minimised uncertainty)?
– note that errors are additive; how are these uncertainties carried through to resource estimates?
– potential to add metal value to a project through representative sampling
Vancouver MEG, December 15, 2016

Global Office Locations & Projects
7
Economic Consequences
•Non‐representative sampling does not reflect the underlying real in situ distribution
• Samples at the low end of the false distribution report as waste
• Samples at the high end of the false distribution report as high‐grade and are usually trimmed
• Results in an overall lowering of grade; value has been lost
From Sketchley, 1998; after Pitard, 1994
False “High‐grade” samples
Samples misclassified as waste
Vancouver MEG, December 15, 2016
Global Office Locations & Projects
8
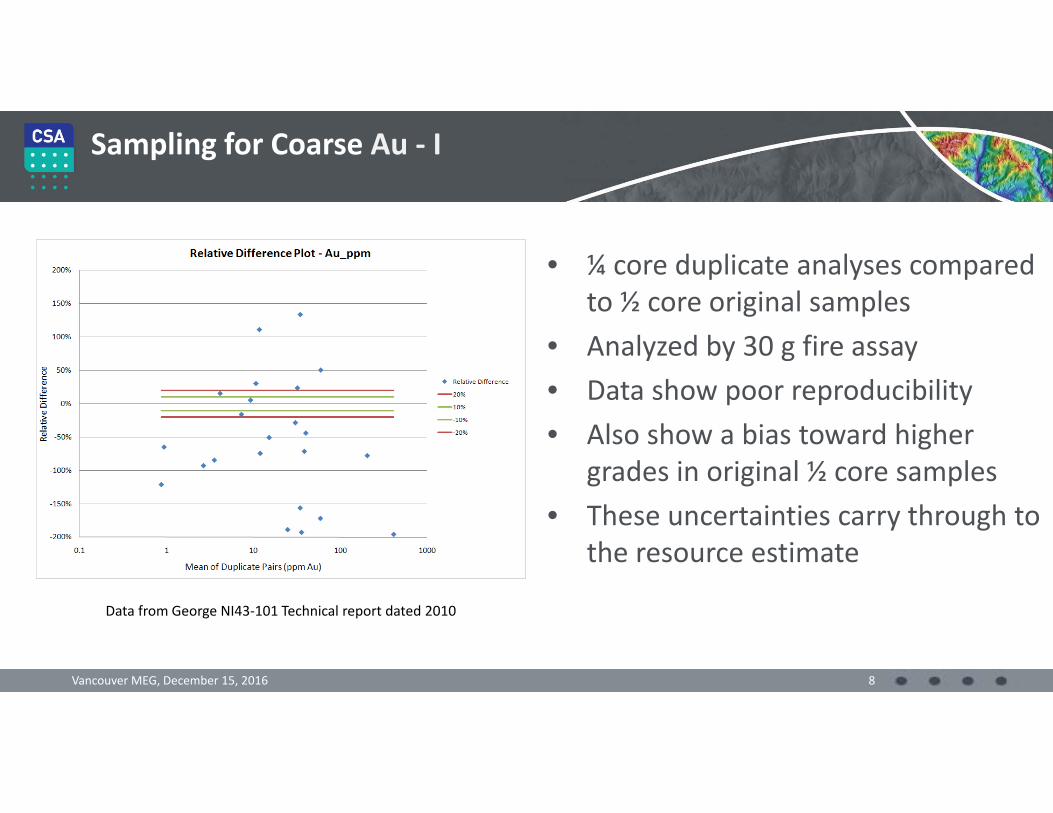
Sampling for Coarse Au ‐ I
• ¼ core duplicate analyses compared to ½ core original samples
• Analyzed by 30 g fire assay• Data show poor reproducibility• Also show a bias toward higher
grades in original ½ core samples• These uncertainties carry through to
the resource estimate
Vancouver MEG, December 15, 2016
Data from George NI43‐101 Technical report dated 2010

Global Office Locations & Projects
9
Effect of Sample Size on Precision
25 g FA RSD%
LW + tails SFA Bulk RSD(SFA/LW)
Average grade 13.23 13.73 13.11
Average (all) 28 9
Average (area 1) 25 11
Average (area 2) 33 8
Average (> 10 ppm) 30 10
Average (> 5 ppm) 30 10
• Average grades and relative standard deviations calculated for 25 duplicate pairs• Grade estimates are similar, but the bulk relative standard deviation is ~1/3 of that obtained for the 25 g fire assays using 200 g samples
RSD = relative standard deviation; LW + tails = 200 g Leachwell accelerated CN + tails fire assay; SFA – 200 g screened metallic fire assay
Vancouver MEG, December 15, 2016

Global Office Locations & Projects
10
Sampling for Coarse Au ‐ II
Gold grade (g/t) Method Description1.7 2 kg samples pulverised for 50 g fire assay0.8 2 kg screened metallic fire assay using 75 micron screen6.6 10‐12 kg of sample weighed, pulverised, tabled to produce a
weighed heavy mineral concentrate which is then analysed by fire assay and the grade back‐calculated based on the original weight
Vancouver MEG, December 15, 2016
Gold grades estimated over a 23 m interval at the Portia coarse gold deposit, South Australia
Data from Havilah Resources press release dated November 4, 2016

Global Office Locations & Projects
11
Sampling for Coarse Au ‐ III
• Beatons Creek, Western Australia
• Pulverisation of 9 kg sample; split of 3 kg analyzed by Leachwell accelerated
CN analyses
Data from van Heerdan NI43‐101 Technical report dated October 1, 2015
Vancouver MEG, December 15, 2016

Global Office Locations & Projects
12
Are Fire Assays Sufficient?
CL Test Oxidation Grain Size (µm) Grade Au Recovery (%)
Oxide 100 % 96 7.0 96.0
Oxide 100 % 99 7.0 96.5
Transitional 95 % 108 3.4 90.7
Transitional 95 % 114 3.4 91.5
Fresh 0 % 90 4.4 2.0
Fresh 0 % 35 4.4 2.8
Fresh 0 % 20 4.4 5.3
• ~50 % of original reported resource is from transitional material• Primary sulphide mineralisation strongly refractory• Recoveries in the transition zone are directly proportional to oxidation • Cyanide Au recoveries important for a proposed heap leach operationVancouver MEG, December 15, 2016

Global Office Locations & Projects
13
Effects of Complex Mineralogy
.• A fire assay gives a total Au value for this sample
• Cyanide digestion will only liberate the free Au component
• A component of Au is refractory and requires floatation
• Metallurgical testing was done on a single sample based on underground access
• Complex mineralogy = complex recoveries
Vancouver MEG, December 15, 2016
Sb‐Ag‐Au sulphosalt
High fineness Au(supergene?)
Au with ~20% Ag
Aurostibite(AuSb2)
0.01 mm

Global Office Locations & Projects
14
Appropriate Assay Methods
• Leachwell (accelerated CN digestion) with a tails fire assay of provides:– an estimate of the CN‐extractable Au in the sample
– an estimate of the refractory component
– the two values combined provide a more precise bulk analysis
– ratio of free to refractory Au in each sample
Sample 25 g Fire Assay (ppm)
25 g FireAssayRepeat(ppm)
200 g Leachwell(ppm)
25 g Leachwell Tails Fire Assay (ppm)
Total Au from BLEG + Fire Assay (ppm)
% Cyanide soluble to total Au
Sample008 13.16 n/a 1.16 12.73 13.89 8.8
Sample009 17.23 13.03 5.00 12.32 17.32 33.0
Sample010 5.23 n/a 0.43 5.35 5.78 8.2
Sample011 13.12 12.33 4.72 5.50 10.22 37.0
Sample012 30.24 30.60 19.95 12.38 32.33 65.6
Sample013 38.70 27.98 47.85 0.75 48.6 98
Vancouver MEG, December 15, 2016
Note that refractory Au analyses are repeatable; precision decreases with increasing free Au

Global Office Locations & Projects
15
El Castillo Gold Recovery Block Model
Either quantitative or semi‐quantitative information on metal recoveries can be built
into block models
Sourced from http://www.argonautgold.com/ September 20, 2013
Vancouver MEG, December 15, 2016

Global Office Locations & Projects
16
Upgrade in Gold Assay Results
• Example is from a Au‐rich epithermal system in Turkey
• Samples were re‐assayed using 500 g screened metallics fire assay
• A 12 m interval shows an average upgrade in Au values of 17.5%
• Potential to add metal value to this project
From (m) To (m)Interval (m)
Au (g/t) original fire assay
Au (g/t) screened metallics
Change %
116.0 117.5 1.5 2.26 2.35 4.1117.5 119.0 1.5 47.9 44.7 ‐6.6119.0 120.5 1.5 12.8 13.5 5.4120.5 122.0 1.5 338 382 13.1122.0 123.5 1.5 236 231 ‐2.3123.5 125.0 1.5 73.0 92.8 27.1125.0 126.5 1.5 681 880 29.3126.5 128.0 1.5 17.2 16.2 ‐5.6128.0 129.5 1.5 140 157 11.8129.5 131.0 1.5 3.89 3.63 ‐6.6
Total: 12.0 metres (117.5m‐129.5m) averaging: 193 g/t 227 g/t 17.50%
Data from Pilot Gold press release 22/01/2013
Vancouver MEG, December 15, 2016

Global Office Locations & Projects
1
10
100
1000
10000
1 10 100 1000 10000
10g Aq
ua Regia
500 g BLEG Sample
Au in Soils (ppb)
Additional samples classed as anomalous at >10 ppb Au (24)
Samples previously classed as anomalous and then
lost (2)
Additional samples classed as highly anomalous at >100 ppb Au (14)
Samples previously classed as highly anomalous and then lost (10)
17
An Exploration Example
• Original 10g aqua regia soil results not reproducible
• 500 g splits trialled using cyanide extraction
• Significantly more anomalous samples @ >10 ppb Au in bulk samples
• 20% more highly anomalous samples @ 100 ppb Au in bulk samples
Vancouver MEG, December 15, 2016
High probability of false negatives (missed opportunities)

Global Office Locations & Projects
18
Grain Size Matters
• Field duplicate orientation stream sediment samples analysed by:• Standard ‐177 micron (#80)
and aqua regia digest• 1 kg ‐177 micron
conventional BLEG• <2 micron clay fraction and
aqua regia digest
• Only the clay fraction separates gave good field reproducibility (ie. no nugget effect)
Steam Sediment Orientation Data Set – Golden Saddle/Coffee Deposits
Vancouver MEG, December 15, 2016
Data from Arne & MacFarlane, 2014

Global Office Locations & Projects
Water (confidence) line
19
The QAQC Iceberg
• What level of control is required?• Where is the major source of variation?• Are you using coarse blanks to assess cross contamination?
• Are the certified reference materials (CRMs) appropriate?
• Do the CRMs cover the range of expected grades & anticipated cut‐off?
• Are suitable procedures documented?• Can you access internal laboratory QAQC data?• What constitutes a QAQC failure?
Vancouver MEG, December 15, 2016
Too many QAQC failures reduce confidence in the data

Global Office Locations & Projects
20
What CRM Value do I Use?
• Use the standard deviation from the clean round robin data •Not the confidence interval on the mean determination•Make sure digestion method is appropriate
Vancouver MEG, December 15, 2016
CRM – certified reference material
PERFORMANCE GATES FOR OREAS 42P - MINOR ELEMENTS
Constituent Recommended value 1 Standard Deviation
Performance Gates2σ 3σ 5%
Low High Low High Low High4 Acid arsenic, As (ppm) 113 16.6 80 147 63 163 108 119Perchloric arsenic, As (ppm) 107 8.36 90 124 82 132 102 112AR arsenic, As (ppm) 100 10.4 79 121 69 132 95 1053A arsenic, As (ppm) 104 20.8 62 146 41 166 99 109PF arsenic, As (ppm) 131 16.6 98 165 82 181 125 138PPPXRF arsenic, As (ppm) 106 8.3 90 123 81 131 101 111

Global Office Locations & Projects
21
The CRM Should be Matrix Appropriate!
Sample Type Au (ppb)Soil 1.5Soil 2
Fresh sulphide CRM 2720Soil (memory effect) 32.1Soil (memory effect) 7.5
Soil 3.4Soil 2.5Soil 2.3Soil 2.2Soil 1.5Soil 1.3
Vancouver MEG, December 15, 2016
• Targeting soil anomalies >5 ppb Au• Inappropriate CRM matrix• Inappropriate grade• Carry‐over of Au in the ICP‐MS (memory effect)
• Data needed to be cleaned before use; if not caught it would have led to many false anomalies
Global Office Locations & Projects
22
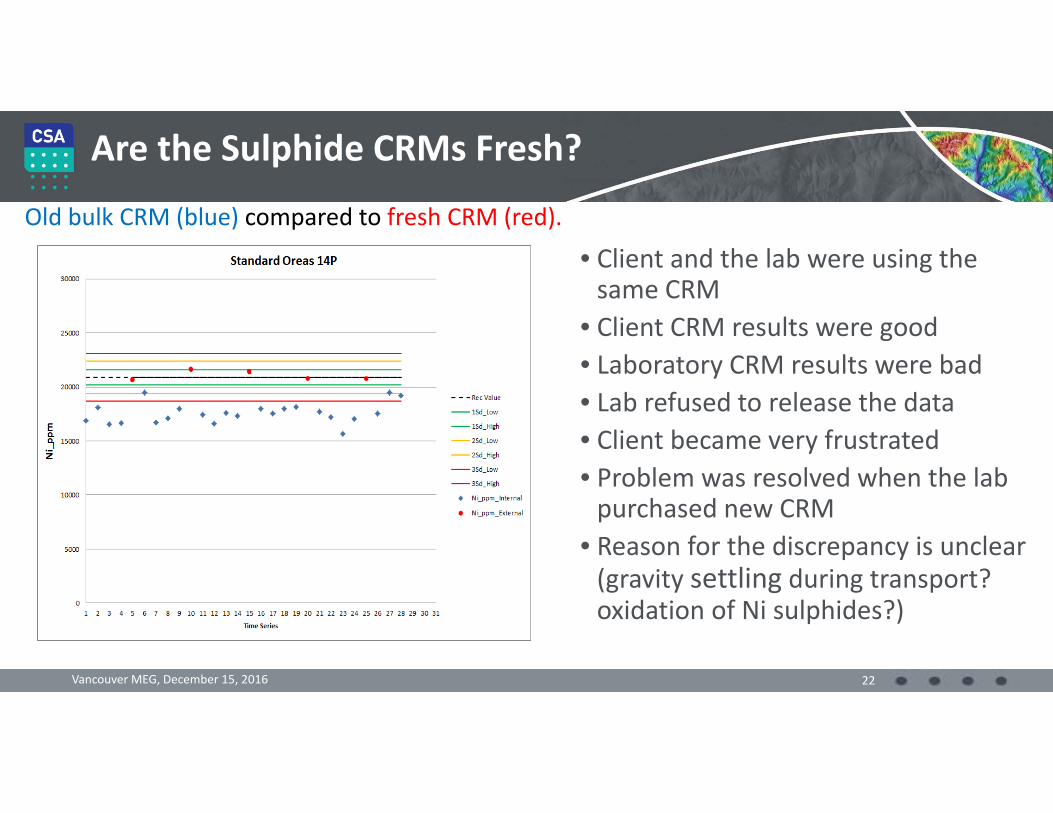
Are the Sulphide CRMs Fresh?
Old bulk CRM (blue) compared to fresh CRM (red).
• Client and the lab were using the same CRM
• Client CRM results were good• Laboratory CRM results were bad• Lab refused to release the data• Client became very frustrated• Problem was resolved when the lab purchased new CRM
• Reason for the discrepancy is unclear (gravity settling during transport? oxidation of Ni sulphides?)
Vancouver MEG, December 15, 2016

Global Office Locations & Projects
23
What Constitutes a CRM Failure?
• Codified in 1956 by the Western Electric Company for white goods coming off the assembly line
• Allows for a simple pass/fail decision to be made at batch level
• Can be made more complicated, but then becomes harder to implement
(Modified from Wikepedia, accessed Sept. 13, 2013)
Vancouver MEG, December 15, 2016

Global Office Locations & Projects
24
There Are Statistical “Failures”
The Au CRM results show the natural statistical
spread in the data
1 of 225 > 3 SD= ~0.4%, which is alsostatistically expected
11 of 225 > 2 SD= ~5%, which is
statistically expected
Vancouver MEG, December 15, 2016

Global Office Locations & Projects
25
All Labs Have a Bias
• Assessment of client CRMs showed a positive bias.
• Internal laboratory QAQC data shows instrumental drift over the period of concern
• Re‐assays performed after instrumental correction
• Intervention was timely – overall data quality >98 % pass rate
Period in which independent CRMsindicated elevated Cu values (failures).
Correction to calibration
Vancouver MEG, December 15, 2016

Global Office Locations & Projects
26
What’s an Acceptable Bias?
• The 5% average negative bias for this CRM is similar to the uncertainty in the certified mean of the CRM
• What are the data to be used for?‐ Exploration?‐ Grade control?‐ Resource estimation?‐ PEA, PF, BFS?• The bias will come through into the resource model if the data are not adjusted
Vancouver MEG, December 15, 2016

Global Office Locations & Projects
27
Induced Bias
• A negative bias can be introduced into a data set by selectively re‐assaying only high values and averaging the results
• High assays have a chance to decrease but low assays don’t have a chance to increase
• Check assays should be random, but focused on mineralised intervals
(Figure modified from Clifton et al., 1969, Sample size and meaningful gold analysis, USGS Prof. Paper 625C)
Vancouver MEG, December 15, 2016

Global Office Locations & Projects
28
Is Your Blank Contaminated?
• Locally sourced sand used as blanks but not analysed to demonstrate blankness
• Blank contains nuggetty Au (best anomalies!)
• Other bloopers include using:
–Nipissing diabase for PGE project (high background Pd)
– Local laterite for oxidised Au project (supergene Au?)
Vancouver MEG, December 15, 2016
Sand blank

Global Office Locations & Projects
29
Cross Contamination
Sample Au_ppm Ag_ppm Type992308 202.4 198.3 Core992309 13.9 10.6 Blank
• Samples were contaminated at the crushing stage
• Re‐assay of blank coarse rejects also indicates high values
• Core had to be re‐sampled• Note that including a blank right
after a high‐grade sample will not always be effective if dual pulverisers are used, as pictured* Note that the prep lab involved in the cross
contamination is not the one pictured
(photo courtesy of Chris Lee)Vancouver MEG, December 15, 2016

Global Office Locations & Projects
30
Quality Expectations
• Quality expectations will depend on project stage
• Data need to be fit for purpose
• The greater the uncertainties at the sampling and analytical stage, the greater the uncertainties propagated through to mineral resources and mineral reserves
• Uncertainties can be included in final grade and tonnage estimates (i.e. +/‐ X)
Increasing assay data accuracy, precision
and relevance
Figure 1 from JORC 2012
Vancouver MEG, December 15, 2016
Global Office Locations & Projects
31
Conclusions
• Errors are additive ‐ it starts with sampling• Set corporate data quality objectives early• Data should be fit for purpose• Quality expectations should evolve with the project• Focus on the desired result (JORC), not the process (NI43‐101)• Don’t forget the quality assurance (follow up failures promptly)• Mitigate risk by propagating sampling and analytical uncertainties
through to resource estimates• Representative sampling has the potential to add value
Vancouver MEG, December 15, 2016