Embed Size (px)
Citation preview
Int. J. Production Economics 62 (1999) 259}279
Analysis of order review/release problems in production systems
I. Sabuncuoglu*, H.Y. Karapmnar
Department of Industrial Engineering, Bilkent University, 06533 Ankara, Turkey
Received 4 May 1998; accepted 17 November 1998
Abstract
Order Review/Release (ORR) activities have mostly been ignored in past job shop research. In most previous studies,arriving jobs are immediately released to the shop #oor without considering any information about the system or jobcharacteristics. In practice however, these jobs are often "rst collected in a pool and then released to the system accordingto a speci"c criterion. Although practitioners often observe the bene"ts of ORR, researchers have found limited supportfor the use of these input reglation policies. One objective of this paper is to examine this research paradox ina capacitated system. We also o!er a new classi"cation framework for existing research work. Finally, for the "rst time inthis paper, both periodic and continuous ORR methods are compared simultaneously under various experimentalconditions against di!erent performance measures. The results of simulation experiments and statistical tests are alsopresented in the paper. ( 1999 Elsevier Science B.V. All rights reserved.
Keywords: Order review/release; Input control; Scheduling; Job shop; Simulation
1. Introduction
It is known in practice that controlling input ratehas a great impact on the system performance. Inmanufacturing systems, this input regulation is per-formed by the Order Review/Release (ORR) func-tion which is also referred to as input sequencing[1], input/output control [2], controlled release[3], input control [4] and input regulation [5].
The purpose of ORR is to improve system per-formance by controlling the #ow of productionorders to the system (i.e., the timing and conditionsof order release decisions). These improvements can
*Corresponding author. Tel.: 90 312 2901607; fax: 90 312 2664126; e-mail: [email protected].
be achieved in terms of increased #exibility, de-creased work in process, improved delivery perfor-mance, reduced congestion and manufacturing leadtimes [6]. The existing applications have alsoshowed that ORR, if implemented properly, cansimplify other shop #oor activities (e.g., dispatch-ing) due to controlling the number of jobs in thesystem. As indicated by Ragatz and Mabert [7], itis also an e!ective capacity management tool.
The timing of release decisions is importantbecause early releases cause congestion on the shop#oor, possibility of damage and obsolescence, high-er inventory holding costs, occupation of valuablefactory space, and interference with urgent jobs. Onthe other hand, late releases can result in misseddue-dates, loss of goodwill, idle resources, andincreased lead times. Since the consequences of
0925-5273/99/$ - see front matter ( 1999 Elsevier Science B.V. All rights reserved.PII: S 0 9 2 5 - 5 2 7 3 ( 9 8 ) 0 0 2 4 8 - 5
sub-optimal ORR decisions can be very severe,ORR systems should be designed carefully andimplemented e!ectively.
Despite the fact that ORR performs such animportant function, it has been mostly ignored inpast job shop research. In most studies, arrivingjobs are immediately released to the shop #oorwithout considering any information about the sys-tem and the job characteristics. In practice, how-ever, these jobs are often "rst collected in a pooland then released to the system according to somecriterion [8}11]. One practical reason for not re-leasing the jobs immediately is the fact that majorproduction/inventory decisions in practice aremade periodically (i.e., daily, weekly, etc). Anotherreason is that holding an order until a last momentbefore being released ensures that output can bebetter matched with actual demand [8]. Moreover,the system performance is less a!ected by revisionsof a upper level of planning system (i.e., masterproduction schedule) and/or changes in customerorders or speci"cations [4]. Consequently, the jobsare released to the shop #oor in a controlled man-ner in practice (usually on the periodic basis).
The literature on ORR is relatively recent. Mostof the signi"cant research in this area has been doneafter the mid-eighties. A number of ORR methodshave been proposed since then. These methodshave been compared for various performancemeasures under di!erent operating conditions. Theresults of these simulation-based studies have dem-onstrated some of the bene"ts of ORR mechanisms.However, as indicated by Melnyk et al. [12], ORRsystems also presents a research paradox, becauseresearchers have found limited support for the useof ORR for some performance measures in theirsimulation studies. Speci"cally, overall lead times(or total time in system) could not be reduced byORR even though some shop performancemeasures such as work in process, queue time, andsome due-date and cost performances were im-proved. Furthermore, as has been observed in somecases [4,13], the most e!ective strategy to optimizedue-date related performance measures such asmean tardiness is to release the jobs to the systemimmediately. However, this is completely contraryto what is expected from ORR. One of the purposesof this paper is to shed light on this paradox. We
believe that the potential bene"ts of ORR can berealized in research environments if congestion isproperly modeled. For that reason, we decided toreexamine the problem using a system in whichcongestion is explicitly modeled. Speci"cally, weconsider the job shop with materials handling sys-tem and "nite bu!er capacities, and show howa load-based release method can improve overallmanufacturing lead times. At this point, we shouldalso point out the fact that the full bene"t fromORR can realized without an a!ective capacityplanning system being present. In this respect,ORR should be viewed as a capacity managementtool which performs "ner capacity adjustmentsprior to a dispatching function. In this paper, weassume that all the major capacity planning relatedissues are resolved and our focus is on the e!ectivematerial #ow and release of orders on the shop #oor.
In this paper, we also propose a new classi"ca-tion framework by which the existing studies in theliterature can be easily classi"ed. To our know-ledge, this is the most comprehensive and up todate review of ORR. Moreover, we compare somewell known ORR methods under various experi-mental conditions for di!erent performancemeasures. Indeed, our study is the "rst detailedsimulation study in which both periodic and con-tinuous ORR methods are compared simulta-neously.
The rest of the paper is organized as follows. InSection 2, a classi"cation framework is presentedand the ORR literature is reviewed. This is followedby a description of the simulation model, systemconsiderations, and experimental design in Section 3.The research paradox is examined in Section 4.Comparisons of ORR methods and statistical testson the simulation results are given in Section 5.Finally, concluding remarks are made and futureresearch direction are outlined in Section 6.
2. Literature review
In recent years, there has been a growing interestin ORR research. As a result, a number of ORRmethods have been proposed in the literature.Simulation-based studies have been performed toinvestigate several issues concerning with the ORR
260 I. Sabuncuoglu, H.Y. Karapnnar/Int. J. Production Economics 62 (1999) 259}279
problems and solution approaches. The objectives ofthis section is to summarize the major "ndings ofprevious work and identify potential research areas.
Our classi"cation is basically an extension ofthat of Philipoom et al. [14] who identi"ed twomajor categories of ORR methods: load-limitedrelease and release methods based on calculatedrelease times. In this paper, we consider some addi-tional factors and propose the following classi"ca-tion scheme:
1. ORR Mechanisms which do not use any in-formation about shop status or characteristics ofthe jobs to be released. The methods in thiscategory can be further classi"ed into:(a) Immediate Release (IMR): This mechanism
releases jobs to the shop immediately. Hence,the release time of an order is equal to itsarrival time. Most job shop research whichignores the ORR function, uses this mecha-nism. It may also be considered as the `noorder review/releasea case, and is often usedin the literature as a benchmark in compari-sons. Although it is a naive rule, most simula-tion studies have found that it is superior toother ORR methods under some conditions.
(b) Interval Release (IR): This mechanism can beconsidered as a periodic version of IMR. Jobsare "rst collected in a release pool and thenreleased to the shop periodically. This policymay represent a situation where the jobs areheld in the pool for paperwork (or other pur-poses) and released in batches periodically(i.e., at the beginning of a shift or day).
2. Load limited order release: Jobs are released tothe shop according to the current workload inthe shop. No due-date information is utilized.The methods in this category can be furtherclassi"ed into:(a) Aggregate ¸oading (AGG): Release decisions
are based on an aggregate measure such astotal workload (i.e., amount of work in hours)or total number of jobs on the shop #oor. Inthis respect, AGG can be considered asa valve (or gate) that restricts the existingshop load to a speci"ed limit.
(b)=orkcenter Information Based ¸oading(WIBL): It utilizes more detailed information
than AGG. Speci"cally, total workloads of thejobs on their process routings are consideredto make the release decision. A periodic ver-sion of this release mechanism is called thePath-Based Bottleneck (PBB) method [14].
3. Release mechanisms based on calculated releasetimes: The basic idea is to release the jobs atpredetermined release times based on #ow timeestimates. These methods utilize information onlong-term capacity utilization and job due-datesto provide on-time deliveries. They can also beclassi"ed into:(a) In,nite ¸oading (INF): As shown below, the
release time is calculated by subtracting theexpected #ow time from due-date of a job:
Ri"D
i!F
i(1)
whereR
i"release time of job i,
Di"due date of job i,
Fi"#ow time estimate of job i.
Readers can refer to Mahmoodi et al. [13],Ragatz and Mabert [7] and Philipoom et al.[14] for alternative ways of setting #ow timeallowances in the ORR context. Shop capa-city information is not explicitly consideredby INF.
(b) Finite ¸oading (FIN): The methods in thiscategory uses more detailed informationabout the jobs and the system. Essentially,FIN considers available shop capacity overthe planning horizon and tries to match ma-chine requirements of the jobs with the avail-able capacity [6]. Two types of FIN can beidenti"ed:i. Forward Finite ¸oading (FFIN): This ap-
proach loads all operations of the job intoavailable capacity starting from the "rstoperation. The release decision of a par-ticular job is based on the loading periodof the last operation and the due-date ofa job. The job is released if the loadingperiod of the last operation is withina preset time window about the due-date.
ii. Backward Finite ¸oading (BFIN): Thismethod operates in the opposite direction.That is, each operation is placed intoavailable capacity starting with the last
I. Sabuncuoglu, H.Y. Karapnnar /Int. J. Production Economics 62 (1999) 259}279 261
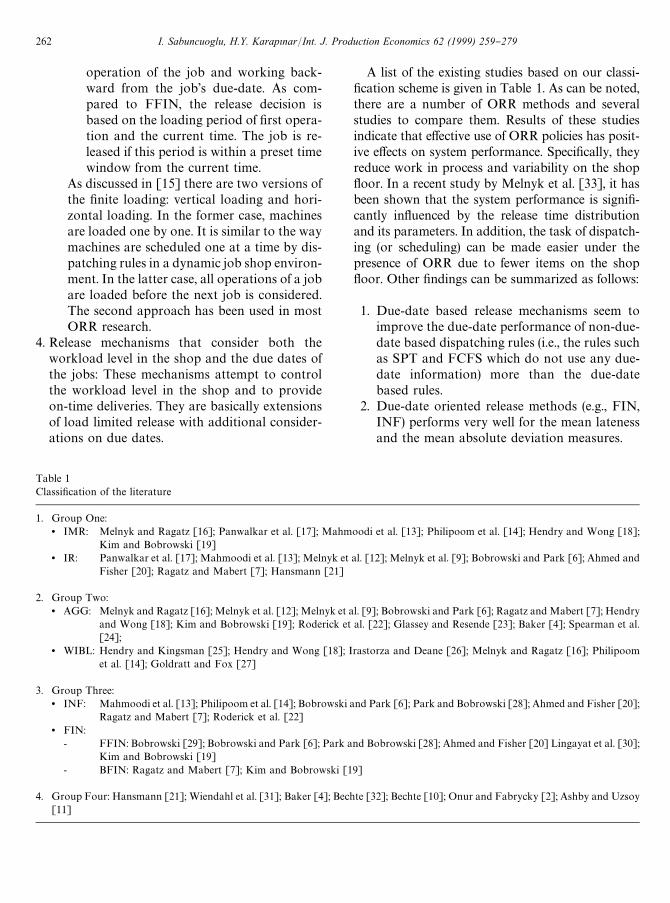
Table 1Classi"cation of the literature
1. Group One:z IMR: Melnyk and Ragatz [16]; Panwalkar et al. [17]; Mahmoodi et al. [13]; Philipoom et al. [14]; Hendry and Wong [18];
Kim and Bobrowski [19]z IR: Panwalkar et al. [17]; Mahmoodi et al. [13]; Melnyk et al. [12]; Melnyk et al. [9]; Bobrowski and Park [6]; Ahmed and
Fisher [20]; Ragatz and Mabert [7]; Hansmann [21]
2. Group Two:z AGG: Melnyk and Ragatz [16]; Melnyk et al. [12]; Melnyk et al. [9]; Bobrowski and Park [6]; Ragatz and Mabert [7]; Hendry
and Wong [18]; Kim and Bobrowski [19]; Roderick et al. [22]; Glassey and Resende [23]; Baker [4]; Spearman et al.[24];
z WIBL: Hendry and Kingsman [25]; Hendry and Wong [18]; Irastorza and Deane [26]; Melnyk and Ragatz [16]; Philipoomet al. [14]; Goldratt and Fox [27]
3. Group Three:z INF: Mahmoodi et al. [13]; Philipoom et al. [14]; Bobrowski and Park [6]; Park and Bobrowski [28]; Ahmed and Fisher [20];
Ragatz and Mabert [7]; Roderick et al. [22]z FIN:
- FFIN: Bobrowski [29]; Bobrowski and Park [6]; Park and Bobrowski [28]; Ahmed and Fisher [20] Lingayat et al. [30];Kim and Bobrowski [19]
- BFIN: Ragatz and Mabert [7]; Kim and Bobrowski [19]
4. Group Four: Hansmann [21]; Wiendahl et al. [31]; Baker [4]; Bechte [32]; Bechte [10]; Onur and Fabrycky [2]; Ashby and Uzsoy[11]
operation of the job and working back-ward from the job's due-date. As com-pared to FFIN, the release decision isbased on the loading period of "rst opera-tion and the current time. The job is re-leased if this period is within a preset timewindow from the current time.
As discussed in [15] there are two versions ofthe "nite loading: vertical loading and hori-zontal loading. In the former case, machinesare loaded one by one. It is similar to the waymachines are scheduled one at a time by dis-patching rules in a dynamic job shop environ-ment. In the latter case, all operations of a jobare loaded before the next job is considered.The second approach has been used in mostORR research.
4. Release mechanisms that consider both theworkload level in the shop and the due dates ofthe jobs: These mechanisms attempt to controlthe workload level in the shop and to provideon-time deliveries. They are basically extensionsof load limited release with additional consider-ations on due dates.
A list of the existing studies based on our classi-"cation scheme is given in Table 1. As can be noted,there are a number of ORR methods and severalstudies to compare them. Results of these studiesindicate that e!ective use of ORR policies has posit-ive e!ects on system performance. Speci"cally, theyreduce work in process and variability on the shop#oor. In a recent study by Melnyk et al. [33], it hasbeen shown that the system performance is signi"-cantly in#uenced by the release time distributionand its parameters. In addition, the task of dispatch-ing (or scheduling) can be made easier under thepresence of ORR due to fewer items on the shop#oor. Other "ndings can be summarized as follows:
1. Due-date based release mechanisms seem toimprove the due-date performance of non-due-date based dispatching rules (i.e., the rules suchas SPT and FCFS which do not use any due-date information) more than the due-datebased rules.
2. Due-date oriented release methods (e.g., FIN,INF) performs very well for the mean latenessand the mean absolute deviation measures.
262 I. Sabuncuoglu, H.Y. Karapnnar/Int. J. Production Economics 62 (1999) 259}279
3. Load oriented release methods such as AGGand WIBL outperform due-date oriented re-lease methods for the mean tardiness and theproportion tardy measures.
4. For the cost based measures, INF seems to bebetter than other rules.
5. Combinations of ORR and load smoothing(i.e., adjusting loads over the periods) reduceslead times and work in process on the shop#oor [9]. As indicated by Melnyk et al. [12],the e!ectiveness of ORR can be greatly en-hanced by controlling variance in the system.
6. There are signi"cant interactions between theORR policies and due-date assignmentmethods. The best rule combinations seem todepend on the system conditions and dispatch-ing rules in use [20].
7. The recent study by Malhotra et al. [34]pointed out a need for further research in ORRfor multiple customer priority classes.
8. The best policy for reducing the mean #ow time(i.e., time in the pool plus time in the shop), themean tardiness and the proportion tardiness isto release the jobs immediately. As describedearlier, this situation is controversial issuewhich will be investigated in this paper.
9. Except for Panwalkar et al. [17] there is no studywhere continuous and periodic ORR mecha-nisms are compared. The relative performance ofother methods are not generally known. In thispaper, we will also provide this comparison.
10. Finally, as indicated by Ashby and Uzsoy [11],the bene"ts of ORR and its interactions withdispatching di!er considerably depending onthe nature of the system, production processand product mix. In this context, the type of thesystem studied in this paper (i.e., job shop withmaterial handling and "nite bu!er capacities)will form a di!erent production environmentfor the ORR policies to be tested.
3. Experimental conditions
3.1. System considerations and simulation model
The job shop model is developed using theSIMAN simulation package [35]. The program
runs in UNIX environment. Some of the character-istics of the job shop model are identical to the oneused by Melnyk and Ragatz [16]. Additionally,a material handling system and "nite bu!er capaci-ties are added to the model to simulate congestionon the shop #oor. These new features are includedto study the research paradox stated earlier in thepaper. The system consists of six departments(workcenters). We assume that there is one machinein each department. Order (or job) arrival is ac-cording to Poisson process. The routing is purelyrandom with the number of operations uniformlydistributed between 1 and 6. When an order arrives,its due-date is assigned using the total work content(TWK) rule which is the most commonly used rulein the literature. According to this rule, due-datesare assigned in proportion to total processingtimes. Processing times are generated from theErlang distribution with parameter 1 unit time.
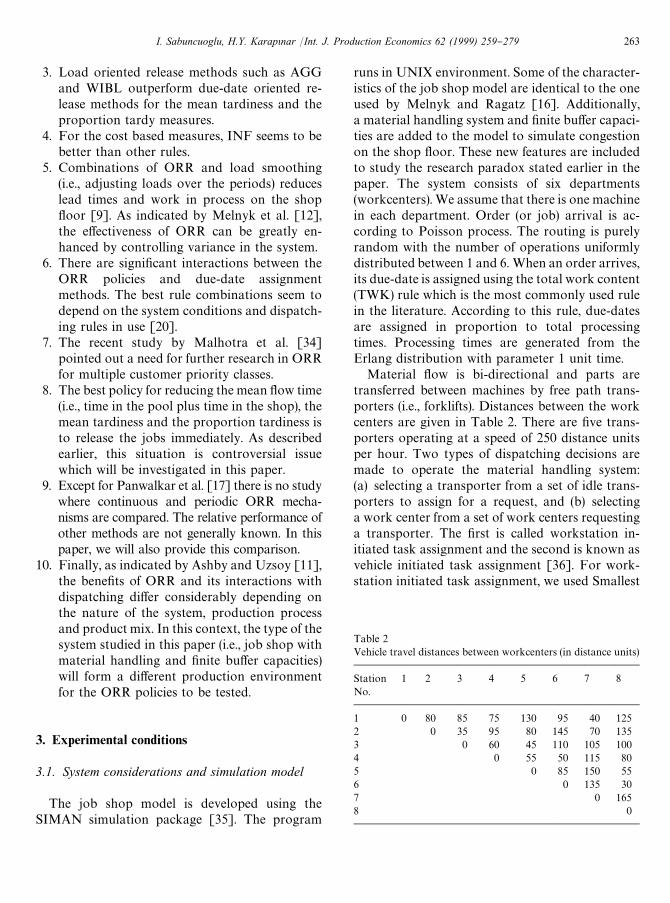
Material #ow is bi-directional and parts aretransferred between machines by free path trans-porters (i.e., forklifts). Distances between the workcenters are given in Table 2. There are "ve trans-porters operating at a speed of 250 distance unitsper hour. Two types of dispatching decisions aremade to operate the material handling system:(a) selecting a transporter from a set of idle trans-porters to assign for a request, and (b) selectinga work center from a set of work centers requestinga transporter. The "rst is called workstation in-itiated task assignment and the second is known asvehicle initiated task assignment [36]. For work-station initiated task assignment, we used Smallest
Table 2Vehicle travel distances between workcenters (in distance units)
StationNo.
1 2 3 4 5 6 7 8
1 0 80 85 75 130 95 40 1252 0 35 95 80 145 70 1353 0 60 45 110 105 1004 0 55 50 115 805 0 85 150 556 0 135 307 0 1658 0
I. Sabuncuoglu, H.Y. Karapnnar /Int. J. Production Economics 62 (1999) 259}279 263
Distance to Station (SDS) rule, where the trans-porter nearest to the station making the request isallocated. For vehicle initiated task assignment, weuse modi"ed-"rst-come-"rst-served (MOD FCFS)rule.
Machines have "nite input/output bu!er capaci-ties, capable of holding four jobs. There is alsoanother bu!er area in each department with a rela-tively large bu!er capacity, representing a commondepartmental storage area. The "nite bu!er capa-city and material handling makes our simulationmodel di!erent from the other models in the ORRliterature. Because the structure of the systemmodeled is di!erent from others in the literature, wemade some extensions to the operational rules asdescribed below. A transporter request is alwaysmade whenever a job is released to the shop fromthe pool or whenever job is put in the output queue.When a transporter arrives at its destination,it unloads the job if there is an empty place inthe input queue and there is no job waiting at thedepartmental bu!er. Otherwise, it takes it tothe departmental storage area. We assumed thatthe distance between the machine and this commonbu!er area is 25 distance units for each department.After unloading the job to the input queue, thetransporter picks up the oldest unassigned load atthe output queue. If there is no unassigned load atthe output queue, the transporter is directed to thestation from where the oldest transporter requesthas been made. If there is no transporter request inthe system, the transporter remains idle at thisstation. If there is no space in the output queuewhen an operation is completed, the job waits onthe machine until a job at the output queue isremoved. Hence, the machine is blocked. Finally, ifthe number of jobs in the input queue drops belowa threshold value (currently equal to one) and thereare jobs waiting in the departmental bu!er area, atransporter request is made by the station to "ll therespective input queue.
3.2. Experimental factors
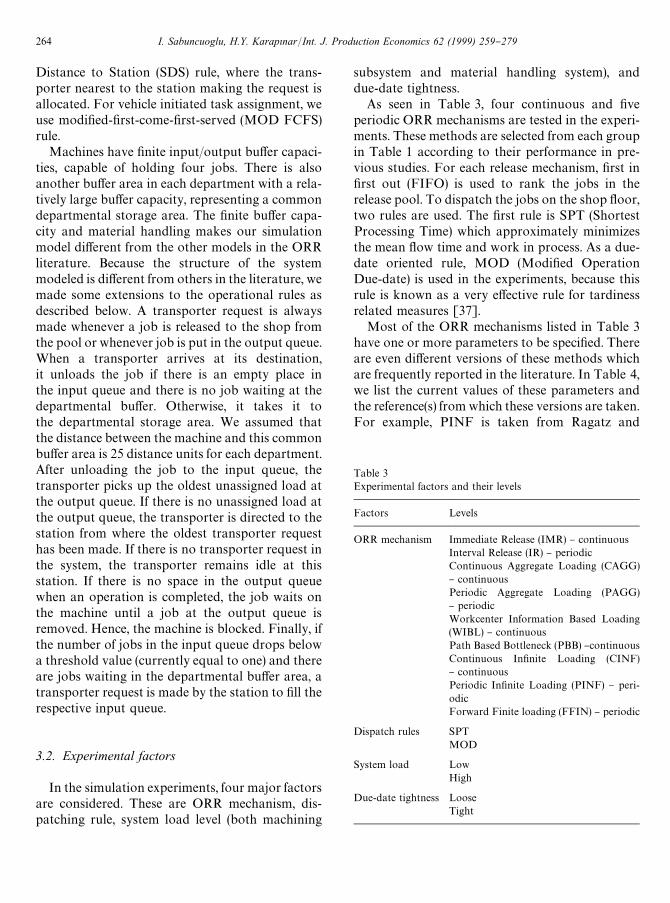
In the simulation experiments, four major factorsare considered. These are ORR mechanism, dis-patching rule, system load level (both machining
subsystem and material handling system), anddue-date tightness.
As seen in Table 3, four continuous and "veperiodic ORR mechanisms are tested in the experi-ments. These methods are selected from each groupin Table 1 according to their performance in pre-vious studies. For each release mechanism, "rst in"rst out (FIFO) is used to rank the jobs in therelease pool. To dispatch the jobs on the shop #oor,two rules are used. The "rst rule is SPT (ShortestProcessing Time) which approximately minimizesthe mean #ow time and work in process. As a due-date oriented rule, MOD (Modi"ed OperationDue-date) is used in the experiments, because thisrule is known as a very e!ective rule for tardinessrelated measures [37].
Most of the ORR mechanisms listed in Table 3have one or more parameters to be speci"ed. Thereare even di!erent versions of these methods whichare frequently reported in the literature. In Table 4,we list the current values of these parameters andthe reference(s) from which these versions are taken.For example, PINF is taken from Ragatz and
Table 3Experimental factors and their levels
Factors Levels
ORR mechanism Immediate Release (IMR) } continuousInterval Release (IR) } periodicContinuous Aggregate Loading (CAGG)} continuousPeriodic Aggregate Loading (PAGG)} periodicWorkcenter Information Based Loading(WIBL) } continuousPath Based Bottleneck (PBB) }continuousContinuous In"nite Loading (CINF)} continuousPeriodic In"nite Loading (PINF) } peri-odicForward Finite loading (FFIN) } periodic
Dispatch rules SPTMOD
System load LowHigh
Due-date tightness LooseTight
264 I. Sabuncuoglu, H.Y. Karapnnar/Int. J. Production Economics 62 (1999) 259}279
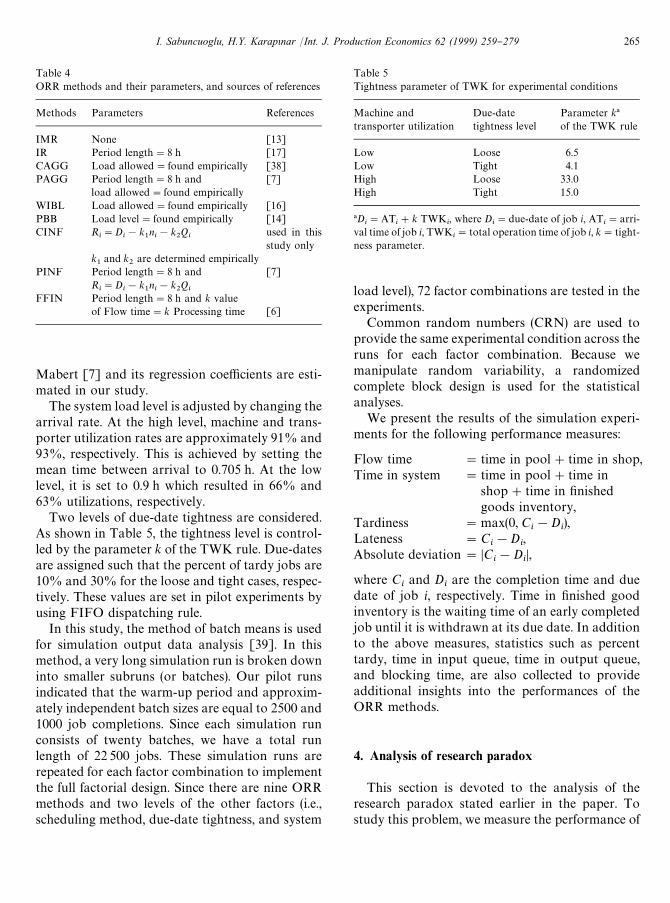
Table 4ORR methods and their parameters, and sources of references
Methods Parameters References
IMR None [13]IR Period length"8 h [17]CAGG Load allowed"found empirically [38]PAGG Period length"8 h and [7]
load allowed"found empiricallyWIBL Load allowed"found empirically [16]PBB Load level"found empirically [14]CINF R
i"D
i!k
1ni!k
2Q
iused in thisstudy only
k1
and k2
are determined empiricallyPINF Period length"8 h and [7]
Ri"D
i!k
1ni!k
2Q
iFFIN Period length"8 h and k value
of Flow time"k Processing time [6]
Mabert [7] and its regression coe$cients are esti-mated in our study.
The system load level is adjusted by changing thearrival rate. At the high level, machine and trans-porter utilization rates are approximately 91% and93%, respectively. This is achieved by setting themean time between arrival to 0.705 h. At the lowlevel, it is set to 0.9 h which resulted in 66% and63% utilizations, respectively.
Two levels of due-date tightness are considered.As shown in Table 5, the tightness level is control-led by the parameter k of the TWK rule. Due-datesare assigned such that the percent of tardy jobs are10% and 30% for the loose and tight cases, respec-tively. These values are set in pilot experiments byusing FIFO dispatching rule.
In this study, the method of batch means is usedfor simulation output data analysis [39]. In thismethod, a very long simulation run is broken downinto smaller subruns (or batches). Our pilot runsindicated that the warm-up period and approxim-ately independent batch sizes are equal to 2500 and1000 job completions. Since each simulation runconsists of twenty batches, we have a total runlength of 22 500 jobs. These simulation runs arerepeated for each factor combination to implementthe full factorial design. Since there are nine ORRmethods and two levels of the other factors (i.e.,scheduling method, due-date tightness, and system
Table 5Tightness parameter of TWK for experimental conditions
Machine andtransporter utilization
Due-datetightness level
Parameter k!
of the TWK rule
Low Loose 6.5Low Tight 4.1High Loose 33.0High Tight 15.0
!Di"AT
i#k TWK
i, where D
i"due-date of job i, AT
i"arri-
val time of job i, TWKi"total operation time of job i, k"tight-
ness parameter.
load level), 72 factor combinations are tested in theexperiments.
Common random numbers (CRN) are used toprovide the same experimental condition across theruns for each factor combination. Because wemanipulate random variability, a randomizedcomplete block design is used for the statisticalanalyses.
We present the results of the simulation experi-ments for the following performance measures:
Flow time "time in pool#time in shop,Time in system "time in pool#time in
shop#time in "nishedgoods inventory,
Tardiness "max(0, Ci!D
i),
Lateness "Ci!D
i,
Absolute deviation"DCi!D
iD,
where Ciand D
iare the completion time and due
date of job i, respectively. Time in "nished goodinventory is the waiting time of an early completedjob until it is withdrawn at its due date. In additionto the above measures, statistics such as percenttardy, time in input queue, time in output queue,and blocking time, are also collected to provideadditional insights into the performances of theORR methods.
4. Analysis of research paradox
This section is devoted to the analysis of theresearch paradox stated earlier in the paper. Tostudy this problem, we measure the performance of
I. Sabuncuoglu, H.Y. Karapnnar /Int. J. Production Economics 62 (1999) 259}279 265
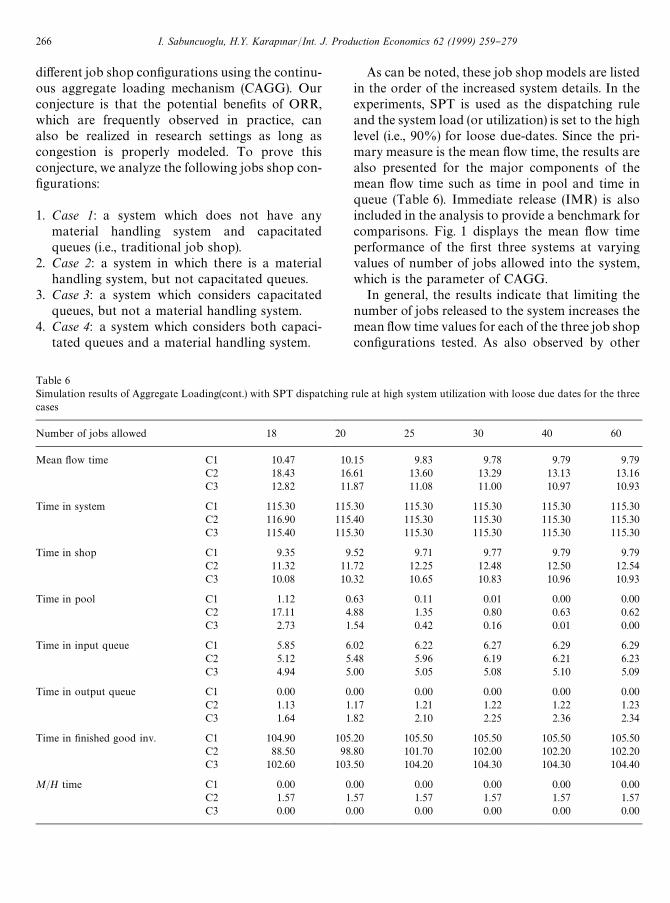
Table 6Simulation results of Aggregate Loading(cont.) with SPT dispatching rule at high system utilization with loose due dates for the threecases
Number of jobs allowed 18 20 25 30 40 60
Mean #ow time C1 10.47 10.15 9.83 9.78 9.79 9.79C2 18.43 16.61 13.60 13.29 13.13 13.16C3 12.82 11.87 11.08 11.00 10.97 10.93
Time in system C1 115.30 115.30 115.30 115.30 115.30 115.30C2 116.90 115.40 115.30 115.30 115.30 115.30C3 115.40 115.30 115.30 115.30 115.30 115.30
Time in shop C1 9.35 9.52 9.71 9.77 9.79 9.79C2 11.32 11.72 12.25 12.48 12.50 12.54C3 10.08 10.32 10.65 10.83 10.96 10.93
Time in pool C1 1.12 0.63 0.11 0.01 0.00 0.00C2 17.11 4.88 1.35 0.80 0.63 0.62C3 2.73 1.54 0.42 0.16 0.01 0.00
Time in input queue C1 5.85 6.02 6.22 6.27 6.29 6.29C2 5.12 5.48 5.96 6.19 6.21 6.23C3 4.94 5.00 5.05 5.08 5.10 5.09
Time in output queue C1 0.00 0.00 0.00 0.00 0.00 0.00C2 1.13 1.17 1.21 1.22 1.22 1.23C3 1.64 1.82 2.10 2.25 2.36 2.34
Time in "nished good inv. C1 104.90 105.20 105.50 105.50 105.50 105.50C2 88.50 98.80 101.70 102.00 102.20 102.20C3 102.60 103.50 104.20 104.30 104.30 104.40
M/H time C1 0.00 0.00 0.00 0.00 0.00 0.00C2 1.57 1.57 1.57 1.57 1.57 1.57C3 0.00 0.00 0.00 0.00 0.00 0.00
di!erent job shop con"gurations using the continu-ous aggregate loading mechanism (CAGG). Ourconjecture is that the potential bene"ts of ORR,which are frequently observed in practice, canalso be realized in research settings as long ascongestion is properly modeled. To prove thisconjecture, we analyze the following jobs shop con-"gurations:
1. Case 1: a system which does not have anymaterial handling system and capacitatedqueues (i.e., traditional job shop).
2. Case 2: a system in which there is a materialhandling system, but not capacitated queues.
3. Case 3: a system which considers capacitatedqueues, but not a material handling system.
4. Case 4: a system which considers both capaci-tated queues and a material handling system.
As can be noted, these job shop models are listedin the order of the increased system details. In theexperiments, SPT is used as the dispatching ruleand the system load (or utilization) is set to the highlevel (i.e., 90%) for loose due-dates. Since the pri-mary measure is the mean #ow time, the results arealso presented for the major components of themean #ow time such as time in pool and time inqueue (Table 6). Immediate release (IMR) is alsoincluded in the analysis to provide a benchmark forcomparisons. Fig. 1 displays the mean #ow timeperformance of the "rst three systems at varyingvalues of number of jobs allowed into the system,which is the parameter of CAGG.
In general, the results indicate that limiting thenumber of jobs released to the system increases themean #ow time values for each of the three job shopcon"gurations tested. As also observed by other
266 I. Sabuncuoglu, H.Y. Karapnnar/Int. J. Production Economics 62 (1999) 259}279
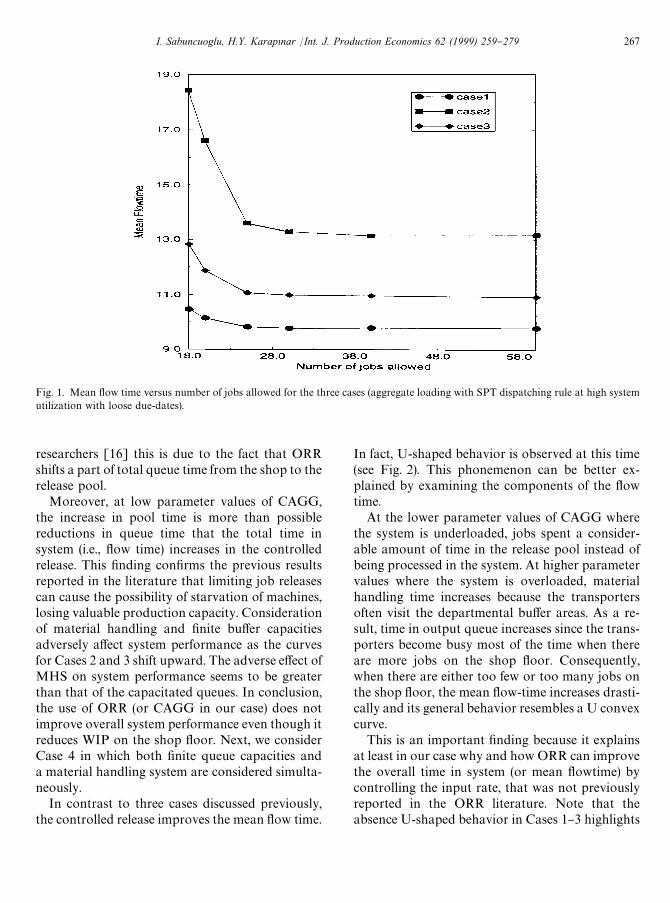
Fig. 1. Mean #ow time versus number of jobs allowed for the three cases (aggregate loading with SPT dispatching rule at high systemutilization with loose due-dates).
researchers [16] this is due to the fact that ORRshifts a part of total queue time from the shop to therelease pool.
Moreover, at low parameter values of CAGG,the increase in pool time is more than possiblereductions in queue time that the total time insystem (i.e., #ow time) increases in the controlledrelease. This "nding con"rms the previous resultsreported in the literature that limiting job releasescan cause the possibility of starvation of machines,losing valuable production capacity. Considerationof material handling and "nite bu!er capacitiesadversely a!ect system performance as the curvesfor Cases 2 and 3 shift upward. The adverse e!ect ofMHS on system performance seems to be greaterthan that of the capacitated queues. In conclusion,the use of ORR (or CAGG in our case) does notimprove overall system performance even though itreduces WIP on the shop #oor. Next, we considerCase 4 in which both "nite queue capacities anda material handling system are considered simulta-neously.
In contrast to three cases discussed previously,the controlled release improves the mean #ow time.
In fact, U-shaped behavior is observed at this time(see Fig. 2). This phonemenon can be better ex-plained by examining the components of the #owtime.
At the lower parameter values of CAGG wherethe system is underloaded, jobs spent a consider-able amount of time in the release pool instead ofbeing processed in the system. At higher parametervalues where the system is overloaded, materialhandling time increases because the transportersoften visit the departmental bu!er areas. As a re-sult, time in output queue increases since the trans-porters become busy most of the time when thereare more jobs on the shop #oor. Consequently,when there are either too few or too many jobs onthe shop #oor, the mean #ow-time increases drasti-cally and its general behavior resembles a U convexcurve.
This is an important "nding because it explainsat least in our case why and how ORR can improvethe overall time in system (or mean #owtime) bycontrolling the input rate, that was not previouslyreported in the ORR literature. Note that theabsence U-shaped behavior in Cases 1}3 highlights
I. Sabuncuoglu, H.Y. Karapnnar /Int. J. Production Economics 62 (1999) 259}279 267
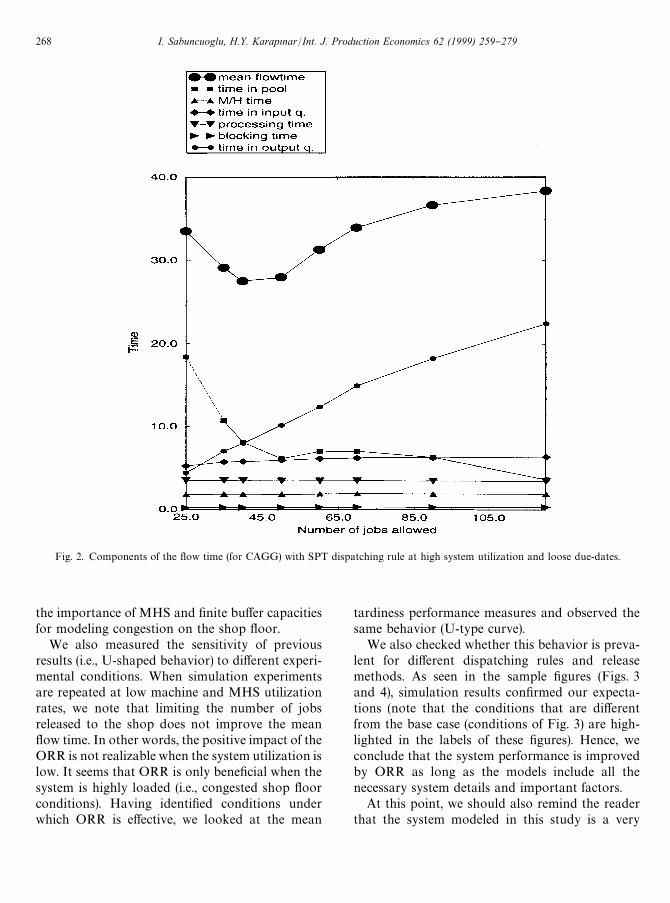
Fig. 2. Components of the #ow time (for CAGG) with SPT dispatching rule at high system utilization and loose due-dates.
the importance of MHS and "nite bu!er capacitiesfor modeling congestion on the shop #oor.
We also measured the sensitivity of previousresults (i.e., U-shaped behavior) to di!erent experi-mental conditions. When simulation experimentsare repeated at low machine and MHS utilizationrates, we note that limiting the number of jobsreleased to the shop does not improve the mean#ow time. In other words, the positive impact of theORR is not realizable when the system utilization islow. It seems that ORR is only bene"cial when thesystem is highly loaded (i.e., congested shop #oorconditions). Having identi"ed conditions underwhich ORR is e!ective, we looked at the mean
tardiness performance measures and observed thesame behavior (U-type curve).
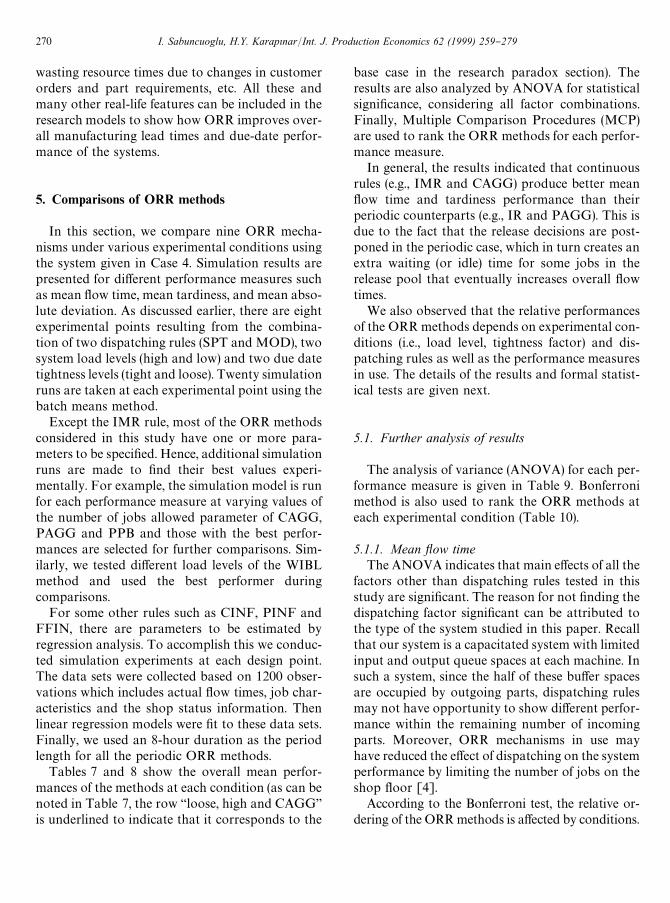
We also checked whether this behavior is preva-lent for di!erent dispatching rules and releasemethods. As seen in the sample "gures (Figs. 3and 4), simulation results con"rmed our expecta-tions (note that the conditions that are di!erentfrom the base case (conditions of Fig. 3) are high-lighted in the labels of these "gures). Hence, weconclude that the system performance is improvedby ORR as long as the models include all thenecessary system details and important factors.
At this point, we should also remind the readerthat the system modeled in this study is a very
268 I. Sabuncuoglu, H.Y. Karapnnar/Int. J. Production Economics 62 (1999) 259}279
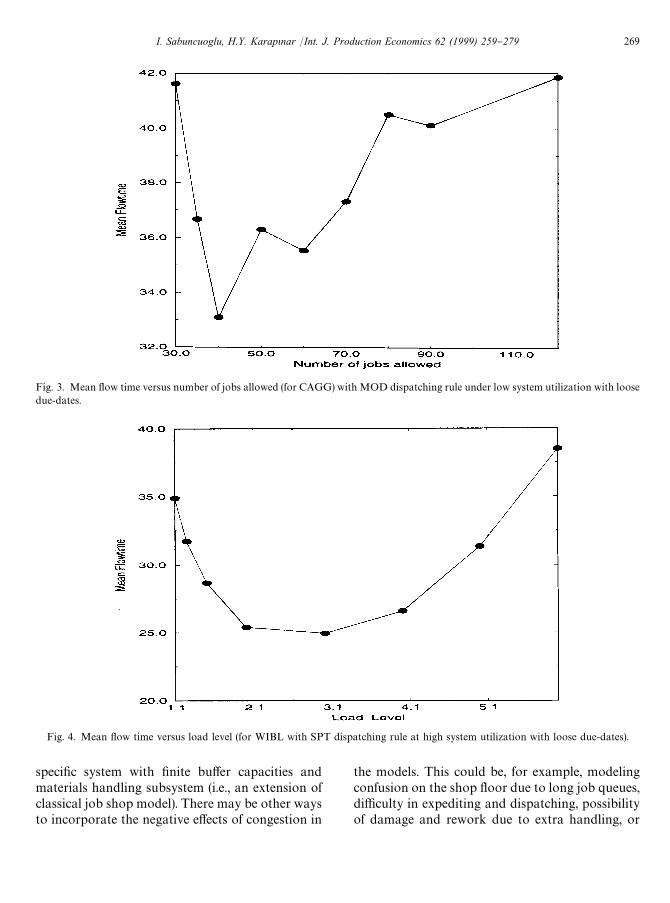
Fig. 3. Mean #ow time versus number of jobs allowed (for CAGG) with MOD dispatching rule under low system utilization with loosedue-dates.
Fig. 4. Mean #ow time versus load level (for WIBL with SPT dispatching rule at high system utilization with loose due-dates).
speci"c system with "nite bu!er capacities andmaterials handling subsystem (i.e., an extension ofclassical job shop model). There may be other waysto incorporate the negative e!ects of congestion in
the models. This could be, for example, modelingconfusion on the shop #oor due to long job queues,di$culty in expediting and dispatching, possibilityof damage and rework due to extra handling, or
I. Sabuncuoglu, H.Y. Karapnnar /Int. J. Production Economics 62 (1999) 259}279 269
wasting resource times due to changes in customerorders and part requirements, etc. All these andmany other real-life features can be included in theresearch models to show how ORR improves over-all manufacturing lead times and due-date perfor-mance of the systems.
5. Comparisons of ORR methods
In this section, we compare nine ORR mecha-nisms under various experimental conditions usingthe system given in Case 4. Simulation results arepresented for di!erent performance measures suchas mean #ow time, mean tardiness, and mean abso-lute deviation. As discussed earlier, there are eightexperimental points resulting from the combina-tion of two dispatching rules (SPT and MOD), twosystem load levels (high and low) and two due datetightness levels (tight and loose). Twenty simulationruns are taken at each experimental point using thebatch means method.
Except the IMR rule, most of the ORR methodsconsidered in this study have one or more para-meters to be speci"ed. Hence, additional simulationruns are made to "nd their best values experi-mentally. For example, the simulation model is runfor each performance measure at varying values ofthe number of jobs allowed parameter of CAGG,PAGG and PPB and those with the best perfor-mances are selected for further comparisons. Sim-ilarly, we tested di!erent load levels of the WIBLmethod and used the best performer duringcomparisons.
For some other rules such as CINF, PINF andFFIN, there are parameters to be estimated byregression analysis. To accomplish this we conduc-ted simulation experiments at each design point.The data sets were collected based on 1200 obser-vations which includes actual #ow times, job char-acteristics and the shop status information. Thenlinear regression models were "t to these data sets.Finally, we used an 8-hour duration as the periodlength for all the periodic ORR methods.
Tables 7 and 8 show the overall mean perfor-mances of the methods at each condition (as can benoted in Table 7, the row `loose, high and CAGGais underlined to indicate that it corresponds to the
base case in the research paradox section). Theresults are also analyzed by ANOVA for statisticalsigni"cance, considering all factor combinations.Finally, Multiple Comparison Procedures (MCP)are used to rank the ORR methods for each perfor-mance measure.
In general, the results indicated that continuousrules (e.g., IMR and CAGG) produce better mean#ow time and tardiness performance than theirperiodic counterparts (e.g., IR and PAGG). This isdue to the fact that the release decisions are post-poned in the periodic case, which in turn creates anextra waiting (or idle) time for some jobs in therelease pool that eventually increases overall #owtimes.
We also observed that the relative performancesof the ORR methods depends on experimental con-ditions (i.e., load level, tightness factor) and dis-patching rules as well as the performance measuresin use. The details of the results and formal statist-ical tests are given next.
5.1. Further analysis of results
The analysis of variance (ANOVA) for each per-formance measure is given in Table 9. Bonferronimethod is also used to rank the ORR methods ateach experimental condition (Table 10).
5.1.1. Mean yow timeThe ANOVA indicates that main e!ects of all the
factors other than dispatching rules tested in thisstudy are signi"cant. The reason for not "nding thedispatching factor signi"cant can be attributed tothe type of the system studied in this paper. Recallthat our system is a capacitated system with limitedinput and output queue spaces at each machine. Insuch a system, since the half of these bu!er spacesare occupied by outgoing parts, dispatching rulesmay not have opportunity to show di!erent perfor-mance within the remaining number of incomingparts. Moreover, ORR mechanisms in use mayhave reduced the e!ect of dispatching on the systemperformance by limiting the number of jobs on theshop #oor [4].
According to the Bonferroni test, the relative or-dering of the ORR methods is a!ected by conditions.
270 I. Sabuncuoglu, H.Y. Karapnnar/Int. J. Production Economics 62 (1999) 259}279
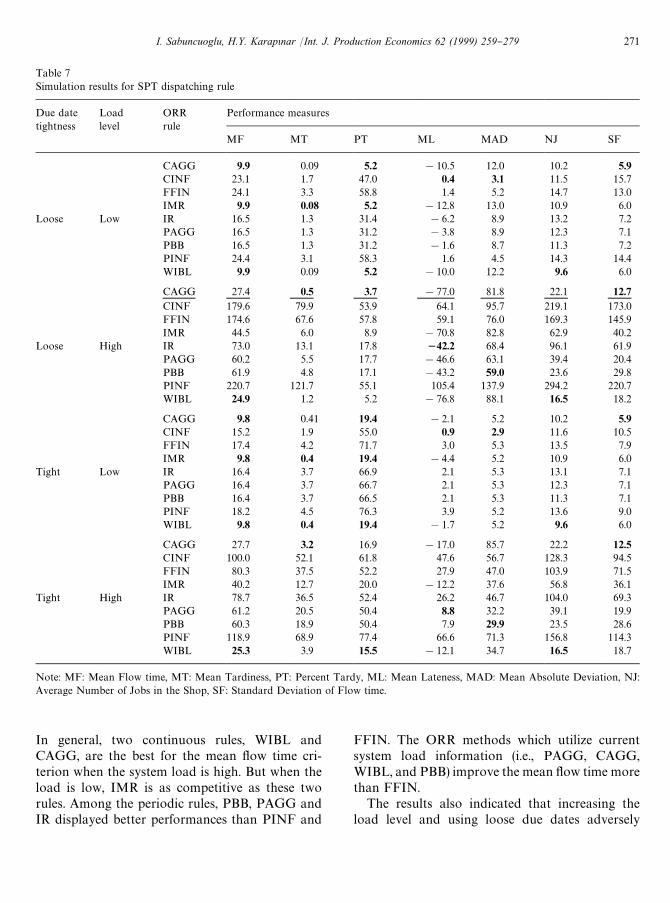
Table 7Simulation results for SPT dispatching rule
Due date Loadlevel
ORRrule
Performance measurestightness
MF MT PT ML MAD NJ SF
CAGG 9.9 0.09 5.2 !10.5 12.0 10.2 5.9CINF 23.1 1.7 47.0 0.4 3.1 11.5 15.7FFIN 24.1 3.3 58.8 1.4 5.2 14.7 13.0IMR 9.9 0.08 5.2 !12.8 13.0 10.9 6.0
Loose Low IR 16.5 1.3 31.4 !6.2 8.9 13.2 7.2PAGG 16.5 1.3 31.2 !3.8 8.9 12.3 7.1PBB 16.5 1.3 31.2 !1.6 8.7 11.3 7.2PINF 24.4 3.1 58.3 1.6 4.5 14.3 14.4WIBL 9.9 0.09 5.2 !10.0 12.2 9.6 6.0
CAGG 27.4 0.5 3.7 !77.0 81.8 22.1 12.7CINF 179.6 79.9 53.9 64.1 95.7 219.1 173.0FFIN 174.6 67.6 57.8 59.1 76.0 169.3 145.9IMR 44.5 6.0 8.9 !70.8 82.8 62.9 40.2
Loose High IR 73.0 13.1 17.8 242.2 68.4 96.1 61.9PAGG 60.2 5.5 17.7 !46.6 63.1 39.4 20.4PBB 61.9 4.8 17.1 !43.2 59.0 23.6 29.8PINF 220.7 121.7 55.1 105.4 137.9 294.2 220.7WIBL 24.9 1.2 5.2 !76.8 88.1 16.5 18.2
CAGG 9.8 0.41 19.4 !2.1 5.2 10.2 5.9CINF 15.2 1.9 55.0 0.9 2.9 11.6 10.5FFIN 17.4 4.2 71.7 3.0 5.3 13.5 7.9IMR 9.8 0.4 19.4 !4.4 5.2 10.9 6.0
Tight Low IR 16.4 3.7 66.9 2.1 5.3 13.1 7.1PAGG 16.4 3.7 66.7 2.1 5.3 12.3 7.1PBB 16.4 3.7 66.5 2.1 5.3 11.3 7.1PINF 18.2 4.5 76.3 3.9 5.2 13.6 9.0WIBL 9.8 0.4 19.4 !1.7 5.2 9.6 6.0
CAGG 27.7 3.2 16.9 !17.0 85.7 22.2 12.5CINF 100.0 52.1 61.8 47.6 56.7 128.3 94.5FFIN 80.3 37.5 52.2 27.9 47.0 103.9 71.5IMR 40.2 12.7 20.0 !12.2 37.6 56.8 36.1
Tight High IR 78.7 36.5 52.4 26.2 46.7 104.0 69.3PAGG 61.2 20.5 50.4 8.8 32.2 39.1 19.9PBB 60.3 18.9 50.4 7.9 29.9 23.5 28.6PINF 118.9 68.9 77.4 66.6 71.3 156.8 114.3WIBL 25.3 3.9 15.5 !12.1 34.7 16.5 18.7
Note: MF: Mean Flow time, MT: Mean Tardiness, PT: Percent Tardy, ML: Mean Lateness, MAD: Mean Absolute Deviation, NJ:Average Number of Jobs in the Shop, SF: Standard Deviation of Flow time.
In general, two continuous rules, WIBL andCAGG, are the best for the mean #ow time cri-terion when the system load is high. But when theload is low, IMR is as competitive as these tworules. Among the periodic rules, PBB, PAGG andIR displayed better performances than PINF and
FFIN. The ORR methods which utilize currentsystem load information (i.e., PAGG, CAGG,WIBL, and PBB) improve the mean #ow time morethan FFIN.
The results also indicated that increasing theload level and using loose due dates adversely
I. Sabuncuoglu, H.Y. Karapnnar /Int. J. Production Economics 62 (1999) 259}279 271
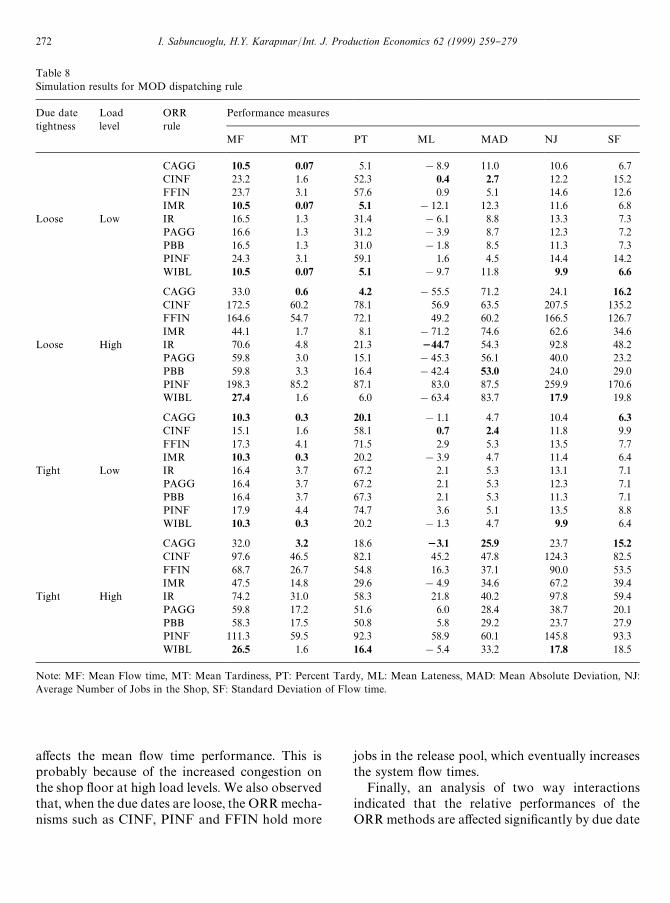
Table 8Simulation results for MOD dispatching rule
Due date Loadlevel
ORRrule
Performance measurestightness
MF MT PT ML MAD NJ SF
CAGG 10.5 0.07 5.1 !8.9 11.0 10.6 6.7CINF 23.2 1.6 52.3 0.4 2.7 12.2 15.2FFIN 23.7 3.1 57.6 0.9 5.1 14.6 12.6IMR 10.5 0.07 5.1 !12.1 12.3 11.6 6.8
Loose Low IR 16.5 1.3 31.4 !6.1 8.8 13.3 7.3PAGG 16.6 1.3 31.2 !3.9 8.7 12.3 7.2PBB 16.5 1.3 31.0 !1.8 8.5 11.3 7.3PINF 24.3 3.1 59.1 1.6 4.5 14.4 14.2WIBL 10.5 0.07 5.1 !9.7 11.8 9.9 6.6
CAGG 33.0 0.6 4.2 !55.5 71.2 24.1 16.2CINF 172.5 60.2 78.1 56.9 63.5 207.5 135.2FFIN 164.6 54.7 72.1 49.2 60.2 166.5 126.7IMR 44.1 1.7 8.1 !71.2 74.6 62.6 34.6
Loose High IR 70.6 4.8 21.3 244.7 54.3 92.8 48.2PAGG 59.8 3.0 15.1 !45.3 56.1 40.0 23.2PBB 59.8 3.3 16.4 !42.4 53.0 24.0 29.0PINF 198.3 85.2 87.1 83.0 87.5 259.9 170.6WIBL 27.4 1.6 6.0 !63.4 83.7 17.9 19.8
CAGG 10.3 0.3 20.1 !1.1 4.7 10.4 6.3CINF 15.1 1.6 58.1 0.7 2.4 11.8 9.9FFIN 17.3 4.1 71.5 2.9 5.3 13.5 7.7IMR 10.3 0.3 20.2 !3.9 4.7 11.4 6.4
Tight Low IR 16.4 3.7 67.2 2.1 5.3 13.1 7.1PAGG 16.4 3.7 67.2 2.1 5.3 12.3 7.1PBB 16.4 3.7 67.3 2.1 5.3 11.3 7.1PINF 17.9 4.4 74.7 3.6 5.1 13.5 8.8WIBL 10.3 0.3 20.2 !1.3 4.7 9.9 6.4
CAGG 32.0 3.2 18.6 23.1 25.9 23.7 15.2CINF 97.6 46.5 82.1 45.2 47.8 124.3 82.5FFIN 68.7 26.7 54.8 16.3 37.1 90.0 53.5IMR 47.5 14.8 29.6 !4.9 34.6 67.2 39.4
Tight High IR 74.2 31.0 58.3 21.8 40.2 97.8 59.4PAGG 59.8 17.2 51.6 6.0 28.4 38.7 20.1PBB 58.3 17.5 50.8 5.8 29.2 23.7 27.9PINF 111.3 59.5 92.3 58.9 60.1 145.8 93.3WIBL 26.5 1.6 16.4 !5.4 33.2 17.8 18.5
Note: MF: Mean Flow time, MT: Mean Tardiness, PT: Percent Tardy, ML: Mean Lateness, MAD: Mean Absolute Deviation, NJ:Average Number of Jobs in the Shop, SF: Standard Deviation of Flow time.
a!ects the mean #ow time performance. This isprobably because of the increased congestion onthe shop #oor at high load levels. We also observedthat, when the due dates are loose, the ORR mecha-nisms such as CINF, PINF and FFIN hold more
jobs in the release pool, which eventually increasesthe system #ow times.
Finally, an analysis of two way interactionsindicated that the relative performances of theORR methods are a!ected signi"cantly by due date
272 I. Sabuncuoglu, H.Y. Karapnnar/Int. J. Production Economics 62 (1999) 259}279
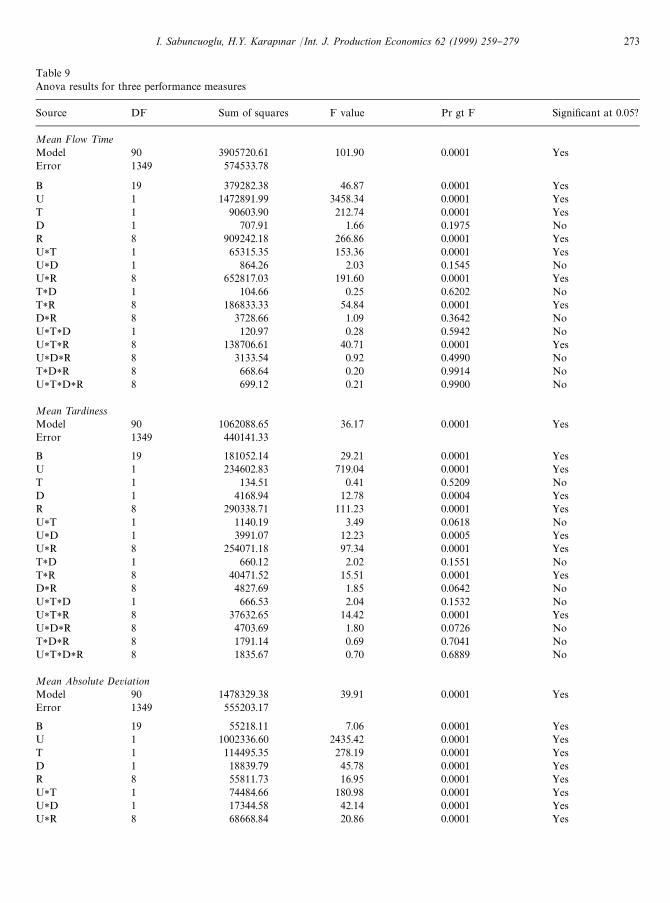
Table 9Anova results for three performance measures
Source DF Sum of squares F value Pr gt F Signi"cant at 0.05?
Mean Flow ¹imeModel 90 3905720.61 101.90 0.0001 YesError 1349 574533.78
B 19 379282.38 46.87 0.0001 YesU 1 1472891.99 3458.34 0.0001 YesT 1 90603.90 212.74 0.0001 YesD 1 707.91 1.66 0.1975 NoR 8 909242.18 266.86 0.0001 YesU*T 1 65315.35 153.36 0.0001 YesU*D 1 864.26 2.03 0.1545 NoU*R 8 652817.03 191.60 0.0001 YesT*D 1 104.66 0.25 0.6202 NoT*R 8 186833.33 54.84 0.0001 YesD*R 8 3728.66 1.09 0.3642 NoU*T*D 1 120.97 0.28 0.5942 NoU*T*R 8 138706.61 40.71 0.0001 YesU*D*R 8 3133.54 0.92 0.4990 NoT*D*R 8 668.64 0.20 0.9914 NoU*T*D*R 8 699.12 0.21 0.9900 No
Mean ¹ardinessModel 90 1062088.65 36.17 0.0001 YesError 1349 440141.33
B 19 181052.14 29.21 0.0001 YesU 1 234602.83 719.04 0.0001 YesT 1 134.51 0.41 0.5209 NoD 1 4168.94 12.78 0.0004 YesR 8 290338.71 111.23 0.0001 YesU*T 1 1140.19 3.49 0.0618 NoU*D 1 3991.07 12.23 0.0005 YesU*R 8 254071.18 97.34 0.0001 YesT*D 1 660.12 2.02 0.1551 NoT*R 8 40471.52 15.51 0.0001 YesD*R 8 4827.69 1.85 0.0642 NoU*T*D 1 666.53 2.04 0.1532 NoU*T*R 8 37632.65 14.42 0.0001 YesU*D*R 8 4703.69 1.80 0.0726 NoT*D*R 8 1791.14 0.69 0.7041 NoU*T*D*R 8 1835.67 0.70 0.6889 No
Mean Absolute DeviationModel 90 1478329.38 39.91 0.0001 YesError 1349 555203.17
B 19 55218.11 7.06 0.0001 YesU 1 1002336.60 2435.42 0.0001 YesT 1 114495.35 278.19 0.0001 YesD 1 18839.79 45.78 0.0001 YesR 8 55811.73 16.95 0.0001 YesU*T 1 74484.66 180.98 0.0001 YesU*D 1 17344.58 42.14 0.0001 YesU*R 8 68668.84 20.86 0.0001 Yes
I. Sabuncuoglu, H.Y. Karapnnar /Int. J. Production Economics 62 (1999) 259}279 273
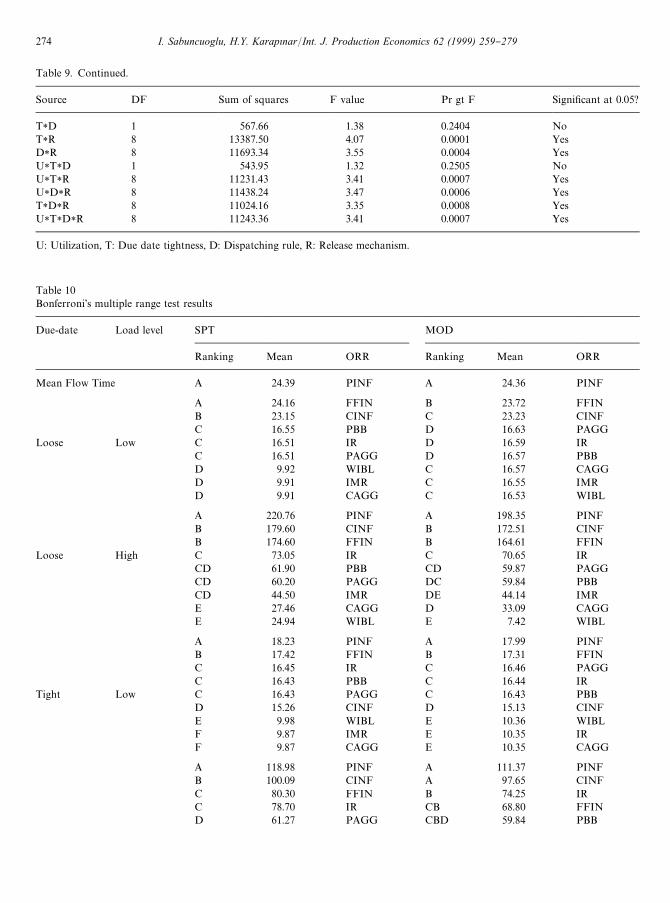
Table 9. Continued.
Source DF Sum of squares F value Pr gt F Signi"cant at 0.05?
T*D 1 567.66 1.38 0.2404 NoT*R 8 13387.50 4.07 0.0001 YesD*R 8 11693.34 3.55 0.0004 YesU*T*D 1 543.95 1.32 0.2505 NoU*T*R 8 11231.43 3.41 0.0007 YesU*D*R 8 11438.24 3.47 0.0006 YesT*D*R 8 11024.16 3.35 0.0008 YesU*T*D*R 8 11243.36 3.41 0.0007 Yes
U: Utilization, T: Due date tightness, D: Dispatching rule, R: Release mechanism.
Table 10Bonferroni's multiple range test results
Due-date Load level SPT MOD
Ranking Mean ORR Ranking Mean ORR
Mean Flow Time A 24.39 PINF A 24.36 PINF
A 24.16 FFIN B 23.72 FFINB 23.15 CINF C 23.23 CINFC 16.55 PBB D 16.63 PAGG
Loose Low C 16.51 IR D 16.59 IRC 16.51 PAGG D 16.57 PBBD 9.92 WIBL C 16.57 CAGGD 9.91 IMR C 16.55 IMRD 9.91 CAGG C 16.53 WIBL
A 220.76 PINF A 198.35 PINFB 179.60 CINF B 172.51 CINFB 174.60 FFIN B 164.61 FFIN
Loose High C 73.05 IR C 70.65 IRCD 61.90 PBB CD 59.87 PAGGCD 60.20 PAGG DC 59.84 PBBCD 44.50 IMR DE 44.14 IMRE 27.46 CAGG D 33.09 CAGGE 24.94 WIBL E 7.42 WIBL
A 18.23 PINF A 17.99 PINFB 17.42 FFIN B 17.31 FFINC 16.45 IR C 16.46 PAGGC 16.43 PBB C 16.44 IR
Tight Low C 16.43 PAGG C 16.43 PBBD 15.26 CINF D 15.13 CINFE 9.98 WIBL E 10.36 WIBLF 9.87 IMR E 10.35 IRF 9.87 CAGG E 10.35 CAGG
A 118.98 PINF A 111.37 PINFB 100.09 CINF A 97.65 CINFC 80.30 FFIN B 74.25 IRC 78.70 IR CB 68.80 FFIND 61.27 PAGG CBD 59.84 PBB
274 I. Sabuncuoglu, H.Y. Karapnnar/Int. J. Production Economics 62 (1999) 259}279
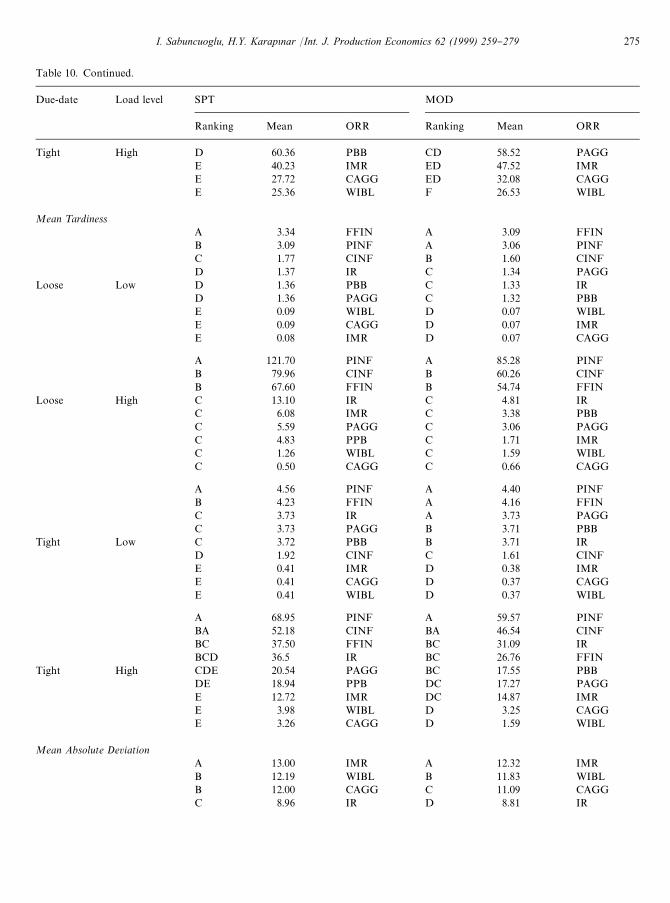
Table 10. Continued.
Due-date Load level SPT MOD
Ranking Mean ORR Ranking Mean ORR
Tight High D 60.36 PBB CD 58.52 PAGGE 40.23 IMR ED 47.52 IMRE 27.72 CAGG ED 32.08 CAGGE 25.36 WIBL F 26.53 WIBL
Mean ¹ardinessA 3.34 FFIN A 3.09 FFINB 3.09 PINF A 3.06 PINFC 1.77 CINF B 1.60 CINFD 1.37 IR C 1.34 PAGG
Loose Low D 1.36 PBB C 1.33 IRD 1.36 PAGG C 1.32 PBBE 0.09 WIBL D 0.07 WIBLE 0.09 CAGG D 0.07 IMRE 0.08 IMR D 0.07 CAGG
A 121.70 PINF A 85.28 PINFB 79.96 CINF B 60.26 CINFB 67.60 FFIN B 54.74 FFIN
Loose High C 13.10 IR C 4.81 IRC 6.08 IMR C 3.38 PBBC 5.59 PAGG C 3.06 PAGGC 4.83 PPB C 1.71 IMRC 1.26 WIBL C 1.59 WIBLC 0.50 CAGG C 0.66 CAGG
A 4.56 PINF A 4.40 PINFB 4.23 FFIN A 4.16 FFINC 3.73 IR A 3.73 PAGGC 3.73 PAGG B 3.71 PBB
Tight Low C 3.72 PBB B 3.71 IRD 1.92 CINF C 1.61 CINFE 0.41 IMR D 0.38 IMRE 0.41 CAGG D 0.37 CAGGE 0.41 WIBL D 0.37 WIBL
A 68.95 PINF A 59.57 PINFBA 52.18 CINF BA 46.54 CINFBC 37.50 FFIN BC 31.09 IRBCD 36.5 IR BC 26.76 FFIN
Tight High CDE 20.54 PAGG BC 17.55 PBBDE 18.94 PPB DC 17.27 PAGGE 12.72 IMR DC 14.87 IMRE 3.98 WIBL D 3.25 CAGGE 3.26 CAGG D 1.59 WIBL
Mean Absolute DeviationA 13.00 IMR A 12.32 IMRB 12.19 WIBL B 11.83 WIBLB 12.00 CAGG C 11.09 CAGGC 8.96 IR D 8.81 IR
I. Sabuncuoglu, H.Y. Karapnnar /Int. J. Production Economics 62 (1999) 259}279 275
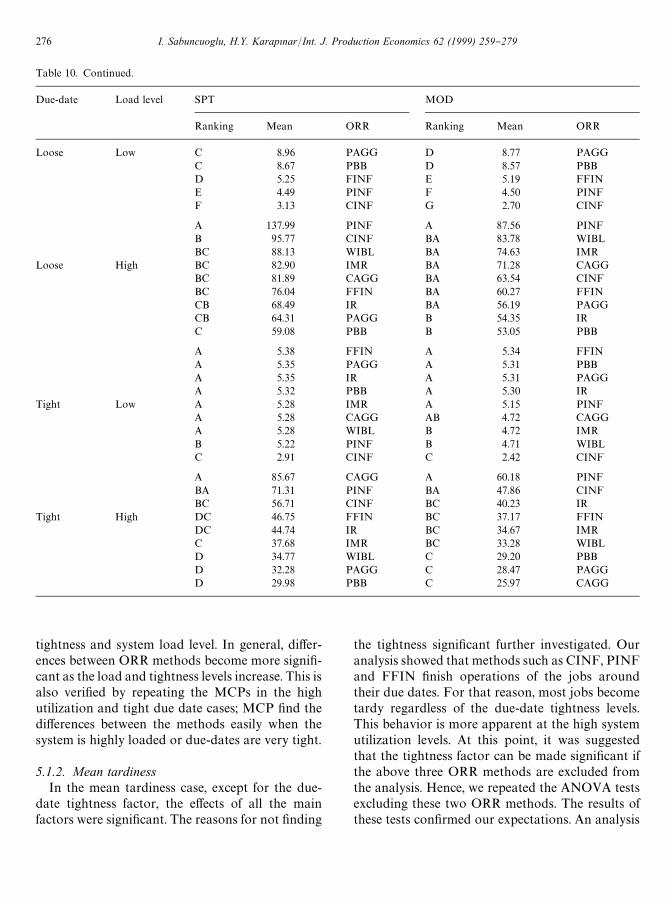
Table 10. Continued.
Due-date Load level SPT MOD
Ranking Mean ORR Ranking Mean ORR
Loose Low C 8.96 PAGG D 8.77 PAGGC 8.67 PBB D 8.57 PBBD 5.25 FINF E 5.19 FFINE 4.49 PINF F 4.50 PINFF 3.13 CINF G 2.70 CINF
A 137.99 PINF A 87.56 PINFB 95.77 CINF BA 83.78 WIBLBC 88.13 WIBL BA 74.63 IMR
Loose High BC 82.90 IMR BA 71.28 CAGGBC 81.89 CAGG BA 63.54 CINFBC 76.04 FFIN BA 60.27 FFINCB 68.49 IR BA 56.19 PAGGCB 64.31 PAGG B 54.35 IRC 59.08 PBB B 53.05 PBB
A 5.38 FFIN A 5.34 FFINA 5.35 PAGG A 5.31 PBBA 5.35 IR A 5.31 PAGGA 5.32 PBB A 5.30 IR
Tight Low A 5.28 IMR A 5.15 PINFA 5.28 CAGG AB 4.72 CAGGA 5.28 WIBL B 4.72 IMRB 5.22 PINF B 4.71 WIBLC 2.91 CINF C 2.42 CINF
A 85.67 CAGG A 60.18 PINFBA 71.31 PINF BA 47.86 CINFBC 56.71 CINF BC 40.23 IR
Tight High DC 46.75 FFIN BC 37.17 FFINDC 44.74 IR BC 34.67 IMRC 37.68 IMR BC 33.28 WIBLD 34.77 WIBL C 29.20 PBBD 32.28 PAGG C 28.47 PAGGD 29.98 PBB C 25.97 CAGG
tightness and system load level. In general, di!er-ences between ORR methods become more signi"-cant as the load and tightness levels increase. This isalso veri"ed by repeating the MCPs in the highutilization and tight due date cases; MCP "nd thedi!erences between the methods easily when thesystem is highly loaded or due-dates are very tight.
5.1.2. Mean tardinessIn the mean tardiness case, except for the due-
date tightness factor, the e!ects of all the mainfactors were signi"cant. The reasons for not "nding
the tightness signi"cant further investigated. Ouranalysis showed that methods such as CINF, PINFand FFIN "nish operations of the jobs aroundtheir due dates. For that reason, most jobs becometardy regardless of the due-date tightness levels.This behavior is more apparent at the high systemutilization levels. At this point, it was suggestedthat the tightness factor can be made signi"cant ifthe above three ORR methods are excluded fromthe analysis. Hence, we repeated the ANOVA testsexcluding these two ORR methods. The results ofthese tests con"rmed our expectations. An analysis
276 I. Sabuncuoglu, H.Y. Karapnnar/Int. J. Production Economics 62 (1999) 259}279
of two way interactions indicated that both therelease methods and dispatch rules are consider-ably a!ected by the system load level and due-datetightness. In general, di!erence between themethods become more signi"cant as the tightnessand system load level increase.
As compared to the mean #ow time case, thedispatching rule factor was signi"cant in favor ofthe MOD rule at this time. The relative ranking ofthe ORR methods change from one condition toanother. But in general, CAGG, WIBL, and IMRare better ORR policies which are followed by twoperiodic rules, PBB and PAGG. These twomethods perform better than FFIN, CINF, andPINF in the experiments.
5.1.3. Mean absolute deviationWe also used Mean Absolute Deviation (MAD)
as a criterion to compare the ORR methods. MADis a practical measure because it indicates how closethe jobs are completed near their due dates (i.e., justin time philosophy). It is also frequently used in theORR literature. In our study, MAD provided use-ful information about the release methods.
First of all, the ANOVA tests showed that all themain factors and their two way interactions aresigni"cant. In general, di!erences between ORRmethods become more signi"cant as the load levelincreases at loose due dates. We also observed thatthe performance of ORR methods worsened whenSPT was used. This rule also increased the di!er-ences between the ORR methods
According to the Bonferroni procedure, PBB isthe best ORR method when the system load is high.However, when the load is low CINF yields thebest performance. In contrast to the mean #ow timecriterion, the periodic rules (i.e., PBB, PAGG, IR)start perform better than their continuous counter-parts in the MAD case. This shows the advantagesof the periodic ORR methods over the continuousrules when the criterion is to complete the jobs ontime.
5.1.4. Other performance measuresThe following observations are made for the
other performance measures. First, we noted thatthe results for mean number of jobs, mean time inthe shop, and mean time in system measures are
similar to those for the mean #ow time criterion.Again, WIBL and CAGG are the two best ORRmethods and PINF is the worst. Among the peri-odic methods, PAGG and PBB improved thesystem performance more than others. The perfor-mance of WIBL and CAGG were also superior forthe percent tardy measure. We also noted that IMRcan become a competitive policy at the low systemutilization level.
For the standard deviation of #ow time measure,IMR, CAGG and WIBL performed better than theother release methods at low utilization. In the highutilization case, however, CAGG yielded smallerstandard deviation values. Among the periodic re-lease methods, PBB and PAGG stood out as thebest. In terms of standard deviation of number ofjobs in the shop measure, CAGG was ranked "rstwhich was followed by WIBL and other methods.CINF showed the worst performance for thismeasure due to its lack of ability to control the loadlevel in the shop.
6. Concluding remarks and suggestions for furtherresearch
In this paper, we have presented a new classi"ca-tion framework for the literature and studiedseveral issues concerning the ORR problem. Spe-ci"cally, we investigated the research paradox andcompared the ORR methods under various experi-mental conditions for di!erent performancemeasures. Our major "ndings are as follows:
1. Overall time in system can be reduced (or thepotential bene"ts of ORR can be realized in simu-lation models) if congestion on the shop #oors isproperly modeled. The results also indicated thatthe due date performances (i.e., tardiness andmean absolute deviation) of the system can beimproved considerably by an e!ective ORRmechanism. In this study, we did not consider theissues such as the di$culty in expediting (anddispatching) due to congestion and the possibilityof changes in customer orders or speci"cations.These real life features, if added to the model,could have further strengthened our conclusionabout the bene"ts of ORR in practice.
I. Sabuncuoglu, H.Y. Karapnnar /Int. J. Production Economics 62 (1999) 259}279 277
2. We also compared ORR methods under vari-ous experimental conditions for di!erent per-formance measures. To our knowledge, thisis the "rst detailed simulation study in whichboth periodic and continuous ORR methodsare compared simultaneously. The resultsindicated that continuous rules (i.e., CAGGand WIBL) performed well for the #ow timeand tardiness related criteria whereas periodicrules such as PBB and PAGG showed betterperformance for the mean absolute deviationcriterion. In practice, this means more frequentrevisions of ORR decisions (or small periodlengths in the periodic release systems) is neededto minimize manufacturing lead times or meantardiness. For the MAD criterion, it seems thata periodic release mechanism with an appropri-ate period length can produce satisfactoryresults.
3. Except for MAD, we did not observe any signi"-cant interaction between ORR and dispatching.In the MAD case, however, the performance ofORR methods can be improved more by usingdue date based dispatching rules (i.e., MOD).The results also indicated that di!erences in therelative performance of ORR mechanisms be-come more signi"cant at high utilization ratesand with tight due-dates. This means that theORR function is more important today in highlydynamic and competitive environments wheremanufacturers have to operate with very tightdue-dates and utilize expensive equipmente!ectively.
In addition, we observed that the current systemload and the job due-date information is very im-portant for the successful implementation of theORR policies. This point should be considered innewly proposed ORR methods. As a future re-search, there is de"nitely a need to test the ORRmethods under di!erent systems so that the practi-tioners can select the right models for their di!erentproduction environments. It would be also interest-ing to measure the robustness of all these releasemethods to variations in the system parameterssuch as changes in due-dates and cancelations oforders so that practitioners can utilize these tech-niques with a certain con"dence.
References
[1] J. Hutchison, Current issues concerning with FMS sched-uling OMEGA 29 (12) (1991) 529}537.
[2] L. Onur, W.J. Fabrycky, An input/output control systemfor the dynamic job shop, IIE Transactions 19 (1) (1987)88}96.
[3] O.W. Wight, Input/output control: a real handle on leadtimes, Production and Inventory Management 11 (1970)9}30.
[4] K.R. Baker, The e!ects of input control in a simple sched-uling model, Journal of Operations Management 4 (1984)99}112.
[5] R. Uzsoy, C. Lee, L.A. Martin-Vega, A review of produc-tion planning and scheduling models in the semiconductorindustry Part II: Shop #oor control, IIE Transaction 26 (5)(1994) 44}55.
[6] P.M. Bobrowski, P.S. Park, Work release strategies ina dual resource constrained job shop, Omega 17 (2) (1989)177}188.
[7] G.L. Ragatz, V.A. Mabert, An evaluation of order releasemechanisms in a job-shop environment, Decision Secien-ces 19 (1) (1988) 167}189.
[8] T.D. Fry, Controlling input: The real key to shorter leadtimes, The International Journal of Logistic Management1 (1) (1990) 7}12.
[9] S.A. Melnyk, G.L. Ragatz, L. Fredendall, Load smoothingby the planning and order review/release systems: A simu-lation experiment, Journal of Operations Management10 (4) (1991) 512}523.
[10] W. Bechte, Load-oriented manufacturing control, just-in-time production for job shops, Production Planning andControl 5 (3) (1994) 292}307.
[11] J.R. Ashby, R. Uzsoy, Scheduling and order release ina single-stage production system, Journal of manufactur-ing Systems 14 (4) (1995) 290}306.
[12] S.A. Melnyk, K.C. Tan, D.R. Denzler, L. Fredendall,Evaluating variance control, order review/release anddispatching: A regression analysis, International Journalof Production Research 32 (5) (1994) 1045}1061.
[13] F. Mahmoodi, K.J. Doley, P.J. Starr, An evaluation oforder releasing and due date assignment heuristics in acellular manufacturing systems, Journal of OperationsManagement 29 (4) (1991).
[14] P.R. Philipoom, M.K. Malhotra, J.B. Jensen, An evalu-ation of capacity sensitive order review and release proced-ures in job shops, Decision Sciences 24 (6) (1993)1109}1133.
[15] T.E. Vollmann, W.L. Berry, D.C. Whybark, ManufacturingPlanning and Control Systems, 2nd ed., Irwin, Illinois, 1988.
[16] S.A. Melnyk, G.L. Ragatz, Order review/release issues andperspectives, International Journal of Production Re-search 27 (7) (1989) 1081}1096.
[17] S.S. Panwalkar, M.L. Smith, R.A. Dudek, Scheduling withperiodic release of orders for production, Presented atORSA/TIMS Special Interest Conference on the Theoryand Application of Scheduling, 1976.
278 I. Sabuncuoglu, H.Y. Karapnnar/Int. J. Production Economics 62 (1999) 259}279
[18] L.C. Hendry, S.K. Wong, Alternative order release mecha-nisms: A comparison by simulation, International Journalof Production Research 32 (12) (1994) 2827}2842.
[19] S.J. Kim, P.M. Bobrowski, Evaluating order release mecha-nisms in a job shop with sequence-dependent set-up, Pro-duction and Operations Management 4 (2) (1995) 163}180.
[20] I. Ahmed, W.W. Fisher, Due date asingment, job orderrelease, and sequencing interaction in job shop scheduling,Decision Sciences 23 (3) (1992) 633}646.
[21] K.-W. Hansmann, Capacity oriented production control fora job shop production, Operations Research in ProductionPlanning and Control. Proceedings of a Joint German/USConference, Springer Berlin, 1993, pp. 89}105.
[22] L.M. Roderick, D.T. Phillips, G. Hogg, CONWIP: A pullalternative to Kanban, International Journal of Produc-tion Research 28 (5) (1990) 879}894.
[23] C.R. Glassey, M.G.C. Resende, Closed-loop job releasecontrol for VLSI circut manufacturing, IEEE Transac-tions on Semiconductor Manufacturing 1 (1) (1988) 36}46.
[24] M.L. Spearman, Woodru!, W. Hopp, A comparison of orderelease strategies in production control systems, InternationalJournal of Production Research 30 (3) (1992) 611}626.
[25] L.C. Hendry, B.G. Kingsman, Job release: Part of a hier-archical system to manage manufacturing lead times inmake-to-order companies, Journal of Operational Re-search Society 42 (10) (1991) 61}70.
[26] J.C. Irastorza, R.H. Deane, A loading and balancing meth-odology for job shop control, AIIE Transactions 6 (4)(1974) 300}307.
[27] E. Goldratt, R.E. Fox, The Race, North River Press,New York, 1986.
[28] P.S. Park, P.M. Bobrowski, Job Release and labour #exil-ity in a dual resource constrained job shop, Journal ofOperations Management 8 (3) (1989) 230}249.
[29] P.M. Bobrowski, Implementing a loading heuristic ina discrete release job shop, International Journal of Pro-duction Research 27 (11) (1989) 1935}1948.
[30] S. Lingayat, J. Mittenthal, R.M. O'Keefe, An order releasemechanism for a #exible #ow line, International Journal ofProduction Research 33 (5) (1995) 1241}1256.
[31] H.-P. Wiendahl, J. GlaK ssner, D. Petermann, Application ofload-oriented manufacturing control in industry, Produc-tion Planning and Control 3 (2) (1992) 118}129.
[32] W. Bechte, Theory and practice of load-oriented manufac-turing control, International Journal of Production Re-search 26 (3) (1988) 375}395.
[33] S.A. Melnyk, D. Denzler, G.L. Magnan, L. Fredendall, Anexperimental model for investigating the sensitivity of jobshop performance to job rlease time distribution para-meters, Production and Operations Management 3 (1)(1995) 64}74.
[34] M.K. Malhotra, J.B. Jensen, Dooley, P.R. Philipoom,Management of vital customer priorities in job shopmanufacturing environments, Decision Sciences 25 (5/6)(1995) 711}736.
[35] C.D. Pegden, R.E. Shannon, R.P. Sadowski, Introductionto Simulation Using SIMAN, McGraw-Hill, EnglewoodCli!s, NJ, 1990.
[36] P.J. Egbelu, M.A. Tanchoco, Characterization ofautomatic guided vehicle dispatching rules, InternationalJournal of Production Research 22 (3) (1983) 359}375.
[37] K.R. Baker, Sequencing rules and due-date assignments ina job shop, Management Science 30 (1984) 1093}1104.
[38] A. Sabuncuogy lu, A study of schudling rules of FMSs:A simulation approach, International Journal of Produc-tion Research 36 (2) (1998) 527}546.
[39] A.M. Law, W.D. Kelton, Simulation Modeling and Analy-sis, 2nd ed., McGraw-Hill, Singapore, 1991.
I. Sabuncuoglu, H.Y. Karapnnar /Int. J. Production Economics 62 (1999) 259}279 279