Embed Size (px)
Citation preview

UNIT 27.4Analysis of Nonsense-Mediated mRNADecay in Mammalian Cells
Pamela Nicholson,1 Raphael Joncourt,1 and Oliver Muhlemann1
1Department for Chemistry and Biochemistry, University of Bern, Bern, Switzerland
ABSTRACT
The nonsense-mediated mRNA decay (NMD) pathway acts to selectively identify anddegrade mRNAs that contain a premature translation termination codon (PTC), andhence reduce the accumulation of potentially toxic truncated proteins. NMD is one ofthe best studied mRNA quality-control mechanisms in eukaryotes, and it has becomeclear during recent years that many physiological mRNAs are also NMD substrates,signifying a role for NMD beyond mRNA quality control as a translation-dependent post-transcriptional regulator of gene expression. Despite a great deal of scientific researchfor over twenty years, the process of NMD is far from being fully understood with regardto its physiological relevance to the cell, the molecular mechanisms that underpin thispathway, all of the factors that are involved, and the exact cellular locations of NMD. Thisunit details some of the fundamental RNA based approaches taken to examine aspectsof NMD, such as creating PTC+ reporter genes, knocking down key NMD factorsvia RNAi, elucidating the important functions of NMD factors by complementationassays or Tethered Function Assays, and measuring RNA levels by reverse-transcriptionquantitative PCR. Curr. Protoc. Cell Biol. 55:27.4.1-27.4.61. C© 2012 by John Wiley &Sons, Inc.
Keywords: NMD � site-directed mutagenesis � RNAi � complementation assay �
Tethered Function Assay � RNA � RT-qPCR
INTRODUCTION
The cascade of events during expression of protein-coding genes involves a series ofcomplex and tightly linked steps from transcription of the respective DNA region tothe eventual protein synthesis. While the intricacy of gene expression allows for fine-tuned regulation at many different levels, it also makes each step susceptible to errors.Therefore, to ensure the accuracy of gene expression, cells have evolved elaborate quality-control mechanisms both in the nucleus and in the cytoplasm at multiple stages duringgene expression (Doma and Parker, 2007). At the level of messenger RNA (mRNA), twoimportant features are monitored: (i) if the correct set of proteins has bound to a particularmRNA and (ii) if the coding potential of the mRNA is intact. The nonsense-mediatedmRNA decay (NMD) pathway deals with the latter; it acts to selectively identify anddegrade mRNAs that contain a premature translation termination codon (PTC), and hencereduce the accumulation of potentially toxic truncated proteins.
NMD was first recognized in 1979, when studies in yeast showed that a nonsense mutationin the URA3 gene (coding for orotidine-5′-phosphate decarboxylase) destabilized theencoded mRNA without affecting its synthesis rate (Losson and Lacroute, 1979). In thesame year, a nonsense mutation in the β-globin gene was discovered in patients sufferingfrom the homozygous form of β-thalassemia (Chang and Kan, 1979). The low levels ofPTC-containing (PTC+) β-globin mRNA indicated a rapid mRNA turnover rate becausetranscription of the gene and processing of the mRNA were indistinguishable from thewild-type (PTC–) counterpart (Maquat et al., 1981). At the time, it was proposed that
Current Protocols in Cell Biology 27.4.1-27.4.61, June 2012Published online June 2012 in Wiley Online Library (wileyonlinelibrary.com).DOI: 10.1002/0471143030.cb2704s55Copyright C© 2012 John Wiley & Sons, Inc.
RNA-BasedMethods in CellBiology
27.4.1
Supplement 55

Analysis ofNonsense-
Mediated mRNADecay
27.4.2
Supplement 55 Current Protocols in Cell Biology
associated ribosomes protect mRNAs from nuclease attack, and that the ribosome-freeregions downstream of PTCs render PTC+ mRNAs vulnerable to nucleases. However,with the discovery of stable untranslated mRNAs in mammalian cells and many reducedmRNA levels of PTC-containing genes in different species, it became apparent thatnonsense mutations can activate a specific pathway leading to the specific degradationof the PTC+ mRNA (reviewed in Maquat, 1995).
A wealth of investigation has been done since 1979 to characterize and understand thisdegradation pathway in various model systems as well as in mammalian cells. Manyof the proteins that play a role in NMD have been identified and characterized. Toinvestigate the process of NMD, two fundamental questions need to be addressed: whatare the exact molecular mechanisms involved in the recognition of PTC+ mRNA, andafter its identification, how is it degraded. A great deal of effort has gone into answeringthese questions, and various models have been proposed (Chang et al., 2007; Isken andMaquat, 2007; Brogna and Wen, 2009; Nicholson et al., 2009; Rebbapragada and Lykke-Andersen, 2009). In addition to studies trying to elucidate its mechanism, NMD hasalso been extensively addressed from evolutionary, physiological, developmental, andgenome-wide perspectives.
It is vital to understand the molecular mechanisms that underpin NMD because a third ofall known disease-causing mutations are predicted to generate a PTC, and consequentlyNMD is a significant modulator of genetic disease phenotypes in humans (Frischmeyerand Dietz, 1999). In this sense, NMD can act either in a beneficial or in a detrimentalway: the latter if it prevents the production of proteins with some residual function andthe former if it prevents the synthesis of toxic truncated proteins (Holbrook et al., 2004;Khajavi et al., 2006; Kuzmiak and Maquat, 2006).
Many of the advances in dissecting the NMD process in mammalian cells have arisenfrom experiments involving the methods stipulated in this unit. Basic Protocol 1 in thisunit details the use of site-directed mutagenesis to create PTC+ reporter genes or genesfor expression of mutant NMD proteins. Basic Protocol 2 explains how to knock downvarious NMD factors using vector-based RNA interference (RNAi) technology. BasicProtocol 3 combines the first two methods and describes how to carry out NMD com-plementation assays by knocking down an endogenous NMD factor and simultaneouslyexpressing a recombinant RNA interference (RNAi)–resistant variant of this factor. BasicProtocols 4-6 will discuss how to measure RNA levels by reverse transcription quan-titative PCR (RT-qPCR), and finally, Basic Protocol 7 will aid in the establishment ofa Tethered Function system, which has been used extensively in the analysis of NMD.The method or experimental setup will be explained in detail and often with the aid ofNMD-specific examples. In the Commentary section at the end of the unit, backgroundinformation for the techniques, anticipated results, and time considerations are providedfor each experimental approach, as well as several recommended online resources. Thecritical parameters section details what needs to be thoroughly considered in setting upthe experiment, and also provides guidance for some of the well-known problems of agiven method.
STRATEGIC PLANNING
Creation of PTC+ mRNAs and Mutant NMD Proteins by Site-DirectedMutagenesis (Basic Protocol 1)
Designing synthetic primers for your site-directed mutagenesis reaction
The following considerations should be made for designing mutagenic primers:

RNA-BasedMethods in CellBiology
27.4.3
Current Protocols in Cell Biology Supplement 55
1. For the QuikChange II and II XL kits, both mutagenic primers must contain the de-sired mutation and anneal to the same sequence on opposite strands of the plasmid.Importantly, the primers should lack strong self-dimerization potential. Primers com-plement each other’s strand on the 5′ end, but do not completely overlap (as suggestedin the manual of the kit manufacturer), which enlarges the melting temperature (Tm)difference between desired primer-to-template annealing and undesired primer-pairself-annealing. For the QuikChange Multi-Site Kits, only one mutagenic primer is re-quired; a corresponding primer with the same mutation binding to the opposite strandis not necessary.
2. Primers should be between 25 and 45 bases in length.
3. Primer Tm should be at least 78◦C.
4. The desired mutation should be in the center of the primer with at least 10 bases ofcorrect sequence on both sides. When this is difficult (perhaps when several mutationsare incorporated into one primer), the mutation(s) should be placed at least 4 basesaway from the 5′-terminus and 6 to 8 bases from the 3′-terminus.
5. The primers should be as close to having a GC content of 40% as possible.
6. The primers should terminate in one or more C or G bases.
7. The mutagenesis efficiency is improved by using highly purified primers, prepared ei-ther by fast polynucleotide liquid chromatography (FPLC) or by preparative polyacry-lamide gel electrophoresis (PAGE). However, many researchers have used cartridge-purified or even unpurified primers without any issues.
8. When making amino-acid changes, consider the codon usage frequency when de-signing the primers. For instance, when creating a mutation in a codon that will nowdirect the insertion of a leucine amino acid in a construct that will be expressed in ahuman cell line, consider using CTG (40% human usage frequency) instead of CTA(7% human usage frequency).
9. For further consultation on constructing primers containing several mutations, see(Zheng et al., 2004).
Preparation of the plasmid DNAWhile plasmid DNA isolated from almost all of the commonly used E. coli strains(dam+), such as XL1-Blue, is methylated and is a suitable template for mutagenesis,plasmid DNA isolated from the dam– E. coli strains, such as JM110 and SCS110, arenot suitable. Also, the plasmid DNA to be used in the PCR reaction should be of goodquality and purity. Importantly, very large plasmids (longer than 10 kb) may be difficultto mutagenize, which is why the protocol for QuikChange II XL has been included below.This kit is optimized for mutagenizing long templates. Alternatively, consider subcloningthe region to be mutated into a smaller plasmid for mutagenesis and then subcloning theregion back into the desired plasmid.
pSUPuro-Based RNAi to Knock Down NMD Factors (Basic Protocol 2)
Creating pSUPER vector system for expression of short interferingRNA to knock down NMD genesThis vector system for RNAi uses the RNA polymerase III H1-RNA gene promoter, asit produces a small RNA transcript lacking a polyadenosine tail, has a well defined startof transcription, and has a termination signal consisting of five thymidines in a row (T5).Importantly, transcription terminates after the second uridine when RNA polymerase IIIreaches the T5 stretch, yielding a transcript resembling the ends of synthetic siRNAs,

Analysis ofNonsense-
Mediated mRNADecay
27.4.4
Supplement 55 Current Protocols in Cell Biology
which also contain two 3′ overhanging T or U nt’s. This protocol is based on insertingannealed oligonucleotides encoding an shRNA to silence a specific NMD gene into avector called pSUPuro (Paillusson et al., 2005), which was created from the pSUPERvector (Brummelkamp et al., 2002), and is explained in Figure 27.4.1A-B, along with anexample (Fig. 27.4.1C). It should be noted that the creators of the pSUPER RNAi systemalso sell a pSUPER vector containing the puromycin gene. A similar RNAi vector systemcan also be purchased from BD Biosciences Clontech (RNAi-Ready pSIREN Vectors).The plan for generating a vector for the expression of shRNA for the knockdown of adesired NMD related mRNA can be carried out as follows:
1. Identify a target sequence within the NMD gene of interest.
2. Design the corresponding oligonucleotides to generate the shRNA.
3. Anneal the forward and reverse strands of the oligonucleotides that contain the shRNAsequence.
4. Linearize pSUPuro vector with BglII and HindIII.
5. Ligate the annealed oligonucleotides into the BglII and HindIII sites of the vector.
6. Transform the ligation reaction into E.coli cells.
7. Screen for positive clones by restriction digestion analysis and DNA sequencing.
8. Prepare plasmid DNA of a confirmed positive clone. Ensure the purity of the pSUPuroDNA for transfection by a method that will isolate high-quality, endotoxin-free plas-mids.
Steps 1 to 2 are explained below; for step 3, see Support Protocol 1; for assistance withsteps 4 to 8, please refer to Molecular Cloning: A Laboratory Manual (Sambrook andRussell, 2000) or a similar laboratory methods manual.
Choosing target sequences1. Search for AA dimers within the coding sequence of your NMD gene and identify 19
nt immediately downstream thereof.
Figure 27.4.1 (appears on next page) pSUPER vector system for expression of short interfer-ing RNA to knockdown NMD genes. (A) pSUPuro is derived from pSUPER, a plasmid for stableexpression of shRNAs in mammalian cells from the polymerase III H1-RNA gene promoter (Brum-melkamp et al., 2002). It was created by insertion of a puromycin-resistance cassette lacking theHindIII site into the XhoI site of pSUPER (Paillusson et al., 2005). The legend outlines the otherfeatures of the plasmid. (B) Top shows the general design of the shRNA forward and reverseoligonucleotides, which are inserted as double-stranded oligonucleotides into pSUPuro betweenthe BgIII and HindIII sites. After this, these vectors contain dsDNA sequences that encode theshRNA cloned between the H1 promoter (a Pol III promoter) and a transcription termination site(gray sequence) comprising 5 thymidine residues. The transcript is terminated at position 2 ofthe termination site, and then folds into a stem-loop (gray sequence) structure with 3′-UU over-hangs (gray). The ends of the shRNAs are processed in vivo, transforming the shRNA into a 21-ntsiRNA-like molecule, which in turn initiates RNAi (see text for details and references). (C) Showsthe forward oligonucleotide which, annealed with the reverse oligonucleotide (not shown) and lig-ated into pSUPuro, was used to generate pSUPuro-SMG6 (see Basic Protocol 2 and Fig. 27.4.7).The 19-nt target sequence and its complementary antisense sequence have been underlined(Redon et al., 2007). (D) Depicts a primer used in QuikChange Multi-Site Directed mutagenesisto mutate the sequence of the SMG6 open reading frame targeted by the shRNA shown in (B) inthe pcDNA3-HA-SMG6 expression plasmid. The inclusion of these two silent mutations (shown ingray) means that the specific shRNA will no longer be able to bind to this region in SMG6 mRNA(see Basic Protocol 3 and Fig. 27.4.10).

RNA-BasedMethods in CellBiology
27.4.5
Current Protocols in Cell Biology Supplement 55
Lac promotor
pSUPuro4515 bp
H1 promotor
PuroR
pUC
IIII
I
f1(+)
restriction enzyme sites used for insertion of annealed oligonucleotides
Key: f1(+) ori: f1(+) origin for production of ssDNA H1 promoter: RNA polymerase III promoter from H1 gene PuroR: Puromycin resistance gene Lac promoter: Lac operon promoter pUC : origin of replication for high plasmid copy numbers in
: Ampicillin resistance gene
A
B
53-CATCCCCxxxxxxxxxxxxxxxxxxxTTCAAGAGAyyyyyyyyyyyyyyyyyyyTTTTTGGAAA-3 dsDNA
terminator-CTAGGGGyyyyyyyyyyyyyyyyyyyAAGTTCTCTxxxxxxxxxxxxxxxxxxxAAAAACCTTT-5
hairpin loopTranscription of target ds DNA
target sense sequence target antisense sequence
Folding of shRNA transcript by base-pairing
-CxxxxxxxxxxxxxxxxxxxUUCAAGAGAyyyyyyyyyyyyyyyyyyyUU-35
Forward oligonucleotide:
Reverse oligonucleotide:5
5
-CATCCCCxxxxxxxxxxxxxxxxxxxTTCAAGAGAyyyyyyyyyyyyyyyyyyyTTTTTGGAAA-3
-AGCTTTTCCAAAAAxxxxxxxxxxxxxxxxxxxTCTCTTGAAyyyyyyyyyyyyyyyyyyyGGG-3
shRNA transcript
shRNA5 -Cxxxxxxxxxxxxxxxxxxx
3-UUyyyyyyyyyyyyyyyyyyy
5 gatccccGGGTCACAGTGCTGAAGTAttcaagagaTACTTCAGCACTGTGACCCtttttggaaa-
5 GCAAAAGGGTCACAGTTCTTAAGTATTTTCTGGAAG-3
3
C
Mutagenic primer used to neutrally change two nucleotides in SMG6 abolishing perfect binding to the above shRNA sequence and hence making SMG6 RNAi resistant to the above target.
D
shRNA target sequences against SMG6 (cloned into ll and III sites)
UU C
AA
A AGG
Figure 27.4.1 (legend appears on previous page)

Analysis ofNonsense-
Mediated mRNADecay
27.4.6
Supplement 55 Current Protocols in Cell Biology
2. Do not select sequences in the 5′ or 3′ untranslated regions (UTR) or within 75 basesof the start codon, as such sequences are highly likely to be regulatory protein bindingsites which might interfere with the binding of RISC.
3. Long stretches of ≥ 4 T’s or 4 A’s in the target sequence should be avoided since theresulting ≥ 4 T stretch in the shRNA coding region may act as a termination signalfor RNA pol III.
4. GC content of the selected 19-nt oligonucleotide sequence should be between 30%and 70%; approximately 50% is optimal for siRNA activity.
5. Including the AA dimer in the candidate sequence, check the 21-base oligonucleotidefor secondary structure and long base runs, which can interfere with proper annealing.Eliminate candidate sequences with these features.
6. Compare the candidate sequence to an appropriate genome database to identify se-quences that are specific for the NMD gene of interest and show no significanthomology to other genes.
7. To optimize gene silencing, it is beneficial to identify and test multiple target sequencesthat are specific for the NMD gene.
Designing the oligonucleotidesTo effect the silencing of a specific NMD factor, the pSUPuro vector is used in concertwith a pair of custom-designed oligonucleotides that contain, among other features,a unique 19-nt sequence derived from the mRNA transcript of the gene targeted forsuppression (see above and Fig. 27.4.1A,B). A single-nt mismatch in the 19-nt targetingsequence can abrogate the ability to suppress gene expression. Therefore, the sequenceof the oligonucleotides can be designed using an online Web resource—in brief theyshould include the following features:
1. A 5′-BglII restriction site overhang on the top strand and a 5′-HindIII restriction siteoverhang on the bottom strand. These restriction sites will enable directional cloning ofthe annealed oligonucleotides into the pSUPuro vector. Note that the double-strandedoligonucleotide is designed to fit into the BglII site of the vector, but that the BglIIsite is destroyed upon ligation to enable more efficient screening of positive clones.
2. The 19-base oligonucleotide sense sequence (target sense sequence) of the shRNAtarget site.
3. A 7- to 9-nt hairpin loop sequence (see Fig. 27.4.1B, 5′-TTCAAGAGA- 3′).
4. The 19-base oligonucleotide antisense sequence (target antisense sequence) of theshRNA target site; ensure proper orientation for correct formation of the hairpinstructure. The 5′ end of the antisense strand should be less stable than its 3′ end inorder to favor the incorporation of the antisense strand into the RISC complex.
5. RNA Pol III terminator sequence consisting of a 5 to 6 nucleotide poly(T) tract.
6. PAGE purification of the two oligonucleotides is highly recommended.
Working in tissue cultureA micro-flow advanced biosafety cabinet or similar cabinet should be used to carryout all tissue culture techniques, including making all tissue culture reagents. Aseptictechniques should be followed at all times and routine checks should be carried out to testfor contamination or the existence of mycoplasma in cells. For further information read,Culture of Animal Cells: A Manual of Basic Technique and Specialized Applications,sixth edition, by R. Ian Freshney (Freshney, 2010).

RNA-BasedMethods in CellBiology
27.4.7
Current Protocols in Cell Biology Supplement 55
NMD Complementation Assays (Basic Protocol 3)
Creating plasmids expressing NMD factors that are RNAi resistantFirst, it is important to have generated and validated a pSUPuro vector that expresses ashort interfering RNA to knock down a specific NMD gene, as explained below. Next, itis important to have constructed a plasmid that is able to exogenously express the sameNMD gene (or a specific mutant of the gene, see Table 27.4.1). The strategic planningfor this method involves performing site-directed mutagenesis on this plasmid to createone or more silent point mutations in the third base of codons within the region targetedby the shRNA sequence to make the NMD gene expressed from the plasmid RNAiresistant, as shown in Figure 27.4.1D for SMG6. If more than one siRNA target is usedto create an effective knockdown, then all the target sequences within the ORF of theNMD gene in the expression plasmid will have to be slightly altered to abolish the abilityof all the shRNA targets to bind and elicit silencing. Importantly, only a few nt changesin the target region have to be made and, unless specifically desired, they should besilent mutations, meaning that they should not change the amino acid sequence of theexogenously expressed NMD protein.
Extraction of RNA and Analysis of RNA Levels by Reverse-TranscriptionQuantitative PCR (Basic Protocols 4-6)
Working with RNA
The biggest challenge in any aspect of RNA research is preparing intact RNA moleculesand keeping them undamaged throughout any subsequent manipulations. The RNAbackbone is inherently more sensitive to damage than DNA because of the 2′ hydroxylgroup attached to the pentose ring. The 2′ hydroxyl group adjacent to phosphodiesterlinkages can act as an intramolecular nucleophile attacking the adjacent phosphodiesterbond, creating a 2′, 3′ cyclic phosphate and cleaving the RNA backbone. Alkaline pH,divalent metal ions, and ribonucleases (RNases) are the three major causes of RNAdegradation. RNase A is a very abundant and very stable enzyme that hydrolyzes RNA,and is probably the most problematic source of RNA degradation. Extraction and isolationof undegraded RNA from cells requires careful laboratory technique; take all precautionsto prevent RNase contamination by wearing gloves, using RNase-free water, reagents,equipment, plasticware, glassware, and workspace, and by using aerosol-barrier filtertips for pipetting, especially if your pipets are also used for DNA cloning work etc.
Choosing the detection chemistries for your qPCR assaysThe simplest and least costly approach to RT-qPCR uses DNA binding fluorophores fornonspecific detection of DNA targets (such as BEBO, BOXTO, Eva Green, ethidiumbromide, or SYBR Green). With nonspecific detection chemistries, the sensitivity andspecificity of the assay is determined only by the forward and reverse primers. Thefluorophores used in these assays exhibit low fluorescence when unbound in solution,but start to fluoresce brightly when associated with dsDNA and exposed to a suitablewavelength of light. The fluorescence data are collected after each extension step tomonitor the progress of the reaction. A drawback to using dsDNA-binding fluorophoresis that they emit light in the presence of any dsDNA, even unwanted primer-dimerproducts or nonspecifically amplified DNA fragments, but this can be easily monitored byperforming a post-PCR melting curve analysis, as explained below. The protocol outlinesthe use of SYBR Green, which is the most commonly used DNA-binding fluorophore;its chemistry is illustrated in Figure 27.4.2B. The resulting DNA–SYBR Green complexabsorbs blue light (λmax = 497 nm) and emits green light (λmax = 520 nm). Actually,the stain preferentially binds to dsDNA, but will stain ssDNA with lower performance.SYBR Green can also stain RNA, albeit with a lower performance than with DNA (Zipperet al., 2004).

Analysis ofNonsense-
Mediated mRNADecay
27.4.8
Supplement 55 Current Protocols in Cell Biology
Tab
le27
.4.1
List
ofth
eM
ain
NM
DFa
ctor
san
dth
eM
ostI
mpo
rtan
tMut
ants
Tha
tHav
eB
een
Pub
lishe
dS
oFa
ra
Nam
eA
cces
sion
num
ber
Des
crip
tion
Loc
aliz
atio
nIs
ofor
ms
Size
Ref
eren
ces
UP
F1
RE
NT
1(h
uman
,mou
se)
SMG
2(C
.ele
gans
)
Gen
eID
:59
76N
M00
2911
.3R
NA
helic
ase,
nucl
eic
acid
depe
nden
tA
TP
ase,
and
RN
A-b
indi
ngpr
otei
n.P
hosp
hory
late
dat
seri
nere
sidu
esin
C-t
erm
inal
SQm
otif
s
Shut
tlin
gpr
otei
n;at
stea
dy-s
tate
pred
omin
antl
yin
the
cyto
plas
m
1:ca
noni
cals
eque
nce
2:A
A35
3-36
3m
issi
ng1:
1129
AA
/12
4,34
5kD
a2:
1118
AA
/123
,036
kDa
DE
636A
AH
ighl
yco
nser
ved
Asp
and
Glu
inm
otif
IIof
the
NT
P-bi
ndin
gan
dhy
drol
ysis
mot
ifs
chan
ged
toA
la.A
TPa
sean
dhe
licas
eac
tiviti
esar
elo
st.
Bha
ttach
arya
etal
.(20
00)
C12
6SPh
osph
oryl
atio
nst
ate
isgr
eatly
redu
ced.
Cop
reci
pita
tes
mor
eSM
G1,
eRF1
and
eRF3
,mod
estly
mor
eSM
G7.
Cop
reci
pita
tes
noU
PF2,
Y14
and
eIF4
A3.
Kas
him
aet
al.(
2006
)
K49
8QPu
tativ
eA
TP-
bind
ing
resi
due
issu
bstit
uted
.AT
Pase
activ
ityis
abol
ishe
d,bi
ndin
gto
AT
Pis
lost
.Hyp
erph
osph
oryl
ated
.M
odes
tdec
reas
ein
eRF3
copr
ecip
itatio
n.In
crea
sein
UPF
2an
dSM
G7
copr
ecip
itatio
n.Pr
efer
entia
llyas
soci
ates
with
UPF
3Ais
ofor
m2.
Kas
him
aet
al.(
2006
)
4SA
Four
AA
subs
titut
ions
pref
eren
tially
phos
phor
ylat
edby
SMG
1(S
1073
A,S
1078
A,S
1096
A,a
ndS1
116A
).M
odes
tdec
reas
ein
eRF3
copr
ecip
itatio
n.G
reat
lyre
duce
dco
prec
ipita
tion
ofSM
G7.
Pref
eren
tially
asso
ciat
esw
ithU
PF3A
isof
orm
1.K
ashi
ma
etal
.,(2
006)
dNT
N-t
erm
inal
63A
Ade
lete
d.R
educ
edab
ility
toas
soci
ate
with
SMG
5.M
odes
tdec
reas
ein
eRF3
copr
ecip
itatio
n.In
crea
sein
UPF
2co
prec
ipita
tion.
Hyp
erph
osph
oryl
ated
.Gre
atly
redu
ced
copr
ecip
itatio
nof
SMG
7.Pr
efer
entia
llyas
soci
ates
with
UPF
3Ais
ofor
m1.
Ohn
ishi
etal
.(20
03);
Kas
him
aet
al.(
2006
)
�C
HR
AA
130–
250
incl
udin
gC
H-r
ich
regi
onde
lete
d.R
educ
edbi
ndin
gto
eRF3
.Iv
anov
etal
.(20
08)
R84
4CM
utat
ion
inth
ehe
licas
edo
mai
n.In
hibi
tsN
MD
.Su
net
al.(
1998
)
G49
5R/
G49
7EG
495R
and
G49
7Ein
the
AT
Pase
/RN
Ahe
licas
edo
mai
n.H
yper
phos
phor
ylat
ed.R
educ
edco
-im
mun
opre
cipi
tatio
nof
SMG
1an
deR
F3.S
light
lyin
crea
sed
co-i
mm
unop
reci
pita
tion
ofeI
F4A
III.
Incr
ease
dco
-pre
cipi
tatio
nw
ithD
cp1a
,Xrn
1an
dR
rp4.
Iske
net
al.(
2008
) cont
inue
d

RNA-BasedMethods in CellBiology
27.4.9
Current Protocols in Cell Biology Supplement 55
Tab
le27
.4.1
List
ofth
eM
ain
NM
DFa
ctor
san
dth
eM
ostI
mpo
rtan
tMut
ants
Tha
tHav
eB
een
Pub
lishe
dS
oFa
ra,c
ontin
ued
Nam
eA
cces
sion
num
ber
Des
crip
tion
Loc
aliz
atio
nIs
ofor
ms
Size
Ref
eren
ces
UP
F2
RE
NT
2(h
uman
,mou
se)
Nm
d2p
(S.
cere
visi
ae)S
MG
3(C
.ele
gans
)
Gen
eID
:26
019
NM
0805
99.1
NM
0155
42.2
Pho
spho
prot
ein,
phos
phor
ylat
edat
seri
nere
sidu
esin
N-t
erm
inal
part
.P
rom
otes
phos
phor
ylat
ion
ofU
PF
1
Cyt
opla
smic
;m
ainl
ype
rinu
clea
r1:
cano
nica
lseq
uenc
e2:
AA
54-8
3m
issi
ng.A
A58
8-60
9:A
MD
FC
MN
M-
NT
KA
NR
KK
LVR
AL
F-
>EK
AF
CN
GN
LA
RV
NL
LL
R-
MAV
KK
AA
610-
1272
mis
sing
1:12
72A
A/
147,
810
kDa
2:57
9A
A/6
6,84
2kD
a
�(9
4-13
3)A
A94
-133
dele
ted.
Del
etes
N-t
erm
inal
UPF
1bi
ndin
gsi
te.W
eake
nsth
ein
tera
ctio
nto
UPF
1.Se
rin
etal
.(20
01)
�(9
4-13
3,10
95-1
272)
AA
94-1
33an
dA
A10
95-1
272
dele
ted.
Del
etes
UPF
1bi
ndin
gsi
tes.
Elim
inat
esin
tera
ctio
nto
UPF
1.Se
rin
etal
.(20
01)
�(5
26-7
22)
AA
526-
722
dele
ted.
Elim
inat
esin
tera
ctio
nto
UPF
3Bon
ly.
Seri
net
al.(
2001
)
�(7
11-9
28)
AA
711-
928
dele
ted.
Elim
inat
esin
tera
ctio
nto
UPF
3B.
Seri
net
al.(
2001
)
�(7
10-1
272)
AA
710-
1272
dele
ted.
Elim
inat
esin
tera
ctio
nto
UPF
3Aan
dU
PF3B
.Se
rin
etal
.(20
01)
�(7
11-9
28,
1095
-127
2)A
A71
1-92
8an
dA
A10
95-1
272
dele
ted.
Elim
inat
esin
tera
ctio
nto
UPF
3Aan
dU
PF3B
.Se
rin
etal
.(20
01)
�(7
88-1
272)
AA
788-
1272
dele
ted.
Elim
inat
esin
tera
ctio
nto
UPF
3Aan
dU
PF3B
.Se
rin
etal
.(20
01)
�(1
095-
1272
)A
A10
95-1
272
dele
ted.
Elim
inat
esth
ein
tera
ctio
nto
UPF
3Bon
ly.D
elet
esC
-ter
min
alU
PF1
bind
ing
site
.Wea
kens
inte
ract
ion
toU
PF1.
Seri
net
al.(
2001
)
E85
8RE
limin
ates
UPF
3Bin
tera
ctio
nin
vitr
o.K
adle
cet
al.(
2004
)
F111
3EA
lmos
tcom
plet
ely
abol
ishe
sU
PF1
bind
ing
invi
tro.
Cle
rici
etal
.(20
09)
F117
1EA
bolis
hes
UPF
1bi
ndin
gin
vitr
o.C
leri
ciet
al.(
2009
)
M11
73E
Abo
lishe
sU
PF1
bind
ing
invi
tro.
Cle
rici
etal
.(20
09)
L11
74E
Abo
lishe
sU
PF1
bind
ing
invi
tro.
Cle
rici
etal
.(20
09)
R11
76E
Red
uces
UPF
1bi
ndin
gin
vitr
o.C
leri
ciet
al.(
2009
) cont
inue
d

27.4.10
Supplement 55 Current Protocols in Cell Biology
Tab
le27
.4.1
List
ofth
eM
ain
NM
DFa
ctor
san
dth
eM
ostI
mpo
rtan
tMut
ants
Tha
tHav
eB
een
Pub
lishe
dS
oFa
ra,c
ontin
ued
Nam
eA
cces
sion
num
ber
Des
crip
tion
Loc
aliz
atio
nIs
ofor
ms
Size
Ref
eren
ces
UP
F3A
UP
F3X
(=U
PF
3B)
SMG
4(C
.ele
gans
)U
PF
3B
Gen
eID
:65
110
NM
0230
11.3
NM
0806
87.2
Gen
eID
:65
109
NM
0806
32.2
NM
0230
10.3
Ass
ocia
tes
wit
hth
eE
JC.P
rom
otes
phos
phor
ylat
ion
ofU
PF
1.
Shut
tlin
gpr
otei
n;at
stea
dy-s
tate
prim
arily
inth
enu
cleu
s(U
PF
3B)
UP
F3A
:1
(hU
pf3p
;hU
PF
3AL
):ca
noni
cal
sequ
ence
2(h
Upf
3pde
lta;
hUP
F3A
S):
AA
141-
173
mis
sing
UP
F3B
:1:
cano
nica
lseq
uenc
e2:
AA
270-
282
mis
sing
UP
F3A
1:47
6A
A/
54,6
96kD
a2:
443
AA
/51,
008
kDa
UP
F3B
1:48
3A
A/
57,7
62kD
a2:
470
AA
/56,
213
kDa
NE
S3A
AA
54-5
8V
VIR
RL
->A
VA
RR
Ain
UPF
3B.M
utat
ion
inth
epu
tativ
enu
clea
rex
port
sign
al(N
ES)
.Elim
inat
esin
tera
ctio
nto
UPF
2.Se
rin
etal
.,20
01
YV
F->
DV
DA
A11
7-11
9Y
VF-
>D
VD
inU
PF3B
.Elim
inat
esth
ein
tera
ctio
nto
UPF
2.Se
rin
etal
.,20
01
�(3
0-25
5)A
A30
-255
dele
ted
inU
PF3B
.Elim
inat
esth
ein
tera
ctio
nto
UPF
2.Se
rin
etal
.,20
01
K52
EIn
UPF
3B.E
limin
ates
inte
ract
ion
toU
PF2
invi
tro.
Kad
lec
etal
.,20
04
Upf
3A�
Y14
Con
serv
edC
-ter
min
alst
retc
hof
14A
A(4
34–4
47)
inU
PF3A
dele
ted.
Wea
kin
crea
seof
repo
rter
leve
lsw
hen
teth
ered
com
pare
dto
WT.
Kun
zet
al.(
2006
)
Upf
3B�
Y14
Con
serv
edC
-ter
min
alst
retc
hof
14A
A(4
21-4
34)
inU
PF3B
dele
ted.
Incr
ease
ofN
MD
repo
rter
mR
NA
leve
lsw
hen
teth
ered
com
pare
dto
WT.
Com
plet
elo
ssof
func
tion.
Elim
inat
esth
ein
tera
ctio
nto
Y14
/Mag
oh,e
IF4A
III
and
BT
Z.
Geh
ring
etal
.(20
03);
Kun
zet
al.(
2006
)
R41
7A,R
419A
,K
421A
,R42
3A,
P424
A,a
ndY
429F
Poin
tmut
atio
nsw
ithin
the
cons
erve
dC
-ter
min
al14
AA
stre
tch
ofU
PF3B
that
resu
ltin
wea
ker
NM
D,p
artic
ular
lyR
423A
.R
423A
elim
inat
esth
ein
tera
ctio
nto
Y14
.G
ehri
nget
al.(
2003
)
Upf
3a�
Upf
2A
A66
-140
dele
ted
inU
PF3A
.Elim
inat
esin
tera
ctio
nto
UPF
2.K
unz
etal
.(20
06)
Upf
3b�
Upf
2A
A49
–143
inU
PF3B
dele
ted.
Elim
inat
esin
tera
ctio
nto
UPF
2.K
unz
etal
.(20
06)
Upf
3aL
432R
A43
2Rin
UPF
3AL
.Inc
reas
esN
MD
activ
ity.
Kun
zet
al.(
2006
)
Upf
3a+3
bC
term
C-t
erm
inal
150
AA
sof
UPF
3AL
are
exch
ange
dfo
rth
eco
rres
pond
ing
sequ
ence
ofU
PF3B
.Inc
reas
esN
MD
activ
ity.
Kun
zet
al.(
2006
)
R43
4E/
R43
6E/
R43
8E
InU
PF3B
.Inc
reas
eof
NM
Dre
port
erm
RN
Ale
vels
whe
nte
ther
edco
mpa
red
toW
T.B
uchw
ald
etal
.(20
10)
cont
inue
d

27.4.11
Current Protocols in Cell Biology Supplement 55
Tab
le27
.4.1
List
ofth
eM
ain
NM
DFa
ctor
san
dth
eM
ostI
mpo
rtan
tMut
ants
Tha
tHav
eB
een
Pub
lishe
dS
oFa
ra,c
ontin
ued
Nam
eA
cces
sion
num
ber
Des
crip
tion
Loc
aliz
atio
nIs
ofor
ms
Size
Ref
eren
ces
SMG
1A
TX
Gen
eID
:23
049
NM
0150
92.4
Ser/
Thr
-kin
ase
ofP
IKK
fam
ily,p
hosp
hory
late
sU
PF
1
Cyt
opla
sman
dnu
cleu
s36
61A
A/4
10,5
01kD
a
2068
–365
7A
A20
68-3
657.
Doe
sno
tbin
dSM
G8
and
SMG
9an
ymor
e.A
rias
-Pal
omo
etal
.(2
011)
618–
3657
AA
618-
3657
.Int
erac
tion
toSM
G8
and
SMG
9is
sign
ifica
ntly
redu
ced.
Ari
as-P
alom
oet
al.
(201
1)
KD
1D
1705
A.A
bolis
hes
kina
seac
tivity
.D
enni
nget
al.(
2001
)
KD
2D
1724
A.A
bolis
hes
kina
seac
tivity
Den
ning
etal
.(20
01)
KD
3D
1724
EA
bolis
hes
kina
seac
tivity
.D
enni
nget
al.(
2001
)
SMG
-1-D
AD
2331
A.A
bolis
hes
kina
seac
tivity
.Y
amas
hita
etal
.(20
01)
SMG
5E
ST1B
Gen
eID
:23
381
NM
0153
27.2
Req
uire
dfo
rU
PF
1de
phos
phor
ylat
ion,
dire
cts
PP
2Ato
phos
phor
ylat
edU
PF
1
Cyt
opla
sm;
co-l
ocal
izes
wit
hSM
G7
toP
-bod
ies
1016
AA
/113
,928
kDa
dCT
C-t
erm
inal
23A
Ade
lete
d.L
eads
toac
cum
ulat
ion
ofph
osph
oryl
ated
UPF
1.In
crea
sed
copr
ecip
itatio
nof
UPF
1.O
hnis
hiet
al.(
2003
)
SMG
-5-D
AD
860A
.Lea
dsto
accu
mul
atio
nof
phos
phor
ylat
edU
PF1.
Incr
ease
dco
prec
ipita
tion
ofU
PF1.
Ohn
ishi
etal
.(20
03)
SMG
6E
ST1A
Gen
eID
:23
293
NM
0175
75.4
NM
0011
7095
7.1
Rib
onuc
leas
ew
ith
endo
nucl
eoly
tic
acti
vity
.R
equi
red
for
UP
F1
deph
osph
oryl
atio
n
Cyt
opla
sm1:
cano
nica
lseq
uenc
e2:
AA
1-10
89m
issi
ngA
A10
90-1
119:
ILE
ED
RL
L-
SGF
VP
LL
AA
PQ
DP
CY
-V
EK
TSD
K->
MR
-F
RL
CH
QR
GC
CP
HE
R-
EN
TC
TC
KM
IISS
LQ
1:14
19A
A/
160,
462
kDa
2:33
0A
A/3
7,46
5kD
a
R65
6E-R
737E
R65
6Ean
dR
737E
in14
-3-3
-lik
edo
mai
n.B
indi
ngto
UPF
1is
redu
ced
invi
tro.
Fuku
hara
etal
.(20
05)
D12
51A
One
ofth
eth
ree
cata
lytic
AA
sin
the
PIN
-dom
ain
mut
ated
.Non
func
tiona
lin
NM
D.
Hun
tzin
ger
etal
.(20
08)
D13
53A
One
cata
lytic
AA
inth
ePI
N-d
omai
nm
utat
ed.N
onfu
nctio
nali
nN
MD
.End
onuc
leas
eac
tivity
islo
stin
vitr
o.G
lava
net
al.(
2006
);E
berl
eet
al.(
2009
)
D12
51A
,D13
92A
Two
ofth
eth
ree
cata
lytic
AA
sin
the
PIN
-dom
ain
mut
ated
.Non
func
tiona
lin
NM
D.
Hun
tzin
ger
etal
.(20
08)
cont
inue
d

27.4.12
Supplement 55 Current Protocols in Cell Biology
Tab
le27
.4.1
List
ofth
eM
ain
NM
DFa
ctor
san
dth
eM
ostI
mpo
rtan
tMut
ants
Tha
tHav
eB
een
Pub
lishe
dS
oFa
ra,c
ontin
ued
Nam
eA
cces
sion
num
ber
Des
crip
tion
Loc
aliz
atio
nIs
ofor
ms
Size
Ref
eren
ces
D12
51A
,D
1353
A,D
1392
AT
heth
ree
cata
lytic
AA
sin
the
PIN
-dom
ain
mut
ated
.Non
func
tiona
lin
NM
D.
Ebe
rle
etal
.(20
09)
D12
51N
,D
1353
N,D
1392
NT
heth
ree
cata
lytic
AA
sin
the
PIN
-dom
ain
mut
ated
.Non
func
tiona
lin
NM
D.
Ebe
rle
etal
.(20
09)
�N
AA
1-57
6de
lete
d.In
tera
ctio
nto
NM
Dfa
ctor
s,Y
14an
dM
agoh
isel
imin
ated
.Int
erac
tion
toPA
BP
(via
RN
A)
isel
imin
ated
.K
ashi
ma
etal
.(20
10)
�PI
ND
elet
ion
ofth
ePI
N-d
omai
n,A
A12
39-1
419.
Inte
ract
ion
with
SMG
5is
elim
inat
ed.
Kas
him
aet
al.(
2010
)
�E
BM
1A
A42
–58
(EJC
bind
ing
mot
if1,
EB
M1)
dele
ted.
Stro
ngre
duct
ion
ofth
ein
tera
ctio
nw
ithY
14an
dM
agoh
.Som
ere
sidu
alY
14co
-im
mun
opre
cipi
tatio
n.K
ashi
ma
etal
.(20
10)
�E
BM
2A
A13
6–15
2(E
JCbi
ndin
gm
otif
2,E
BM
2)de
lete
d.St
rong
redu
ctio
nof
the
inte
ract
ion
with
Y14
and
Mag
oh.
Kas
him
aet
al.(
2010
)
�E
BM
1+2
EB
M1
and
2de
lete
d(A
A42
-58,
136-
152)
.Int
erac
tion
toY
14an
dM
agoh
isel
imin
ated
.K
ashi
ma
etal
.(20
10)
EB
M1-
Mut
R46
Ean
dY
52E
inE
BM
1.St
rong
redu
ctio
nof
the
inte
ract
ion
with
Y14
and
Mag
oh.S
ome
resi
dual
Y14
co-i
mm
unop
reci
pita
tion.
Kas
him
aet
al.(
2010
)
EB
M2-
Mut
K14
0E&
Y14
6Ein
EB
M2.
Stro
ngre
duct
ion
ofth
ein
tera
ctio
nw
ithY
14an
dM
agoh
.K
ashi
ma
etal
.(20
10)
EB
M1+
2M
utR
46E
and
Y52
Ean
dK
140E
&Y
146E
inE
BM
1an
d2.
Inte
ract
ion
toY
14an
dM
agoh
isel
imin
ated
.K
ashi
ma
etal
.(20
10)
SMG
7E
ST1C
Ebs
1p(S
.ce
revi
siae
)
Gen
eID
:98
87N
M17
3156
.2N
M20
1568
.2N
M20
1569
.2N
M00
1174
061.
1
Req
uire
dfo
rU
PF
1de
phos
phor
ylat
ion
Cyt
opla
sm;
co-l
ocal
izes
wit
hSM
G5
toP
-bod
ies
1:ca
noni
cals
eque
nce
2:A
A56
9-61
4m
issi
ng4:
AA
569-
614
mis
sing
AA
914-
914:
E->
ED
PK
SSP
L-
LP
PD
LL
KSL
AA
LE
E-
EE
EL
IFS
NT
PD
LY-
PAL
LG
PL
ASL
PG
RSL
FA
A11
01-1
137:
SIW
SSSM
MH
P...R
GQ
G-
TM
NP
PH
->K
H-
GV
LG
...P
FW
KR
RK
KG
K5:
Lac
ksa
port
ion
ofth
e5′
codi
ngre
gion
,ini
tiat
estr
ansl
atio
nat
dow
nstr
eam
star
tco
don.
Con
tain
sal
tern
ate
in-f
ram
eex
onin
the
3′ cod
ing
regi
on.
1:11
37A
A/
127,
282
kDa
2:10
91A
A/1
22,0
20kD
a4:
1178
AA
/13
1,65
4kD
a5:
1145
AA
/127
,854
kDa
cont
inue
d

RNA-BasedMethods in CellBiology
27.4.13
Current Protocols in Cell Biology Supplement 55
Tab
le27
.4.1
List
ofth
eM
ain
NM
DFa
ctor
san
dth
eM
ostI
mpo
rtan
tMut
ants
Tha
tHav
eB
een
Pub
lishe
dS
oFa
ra,c
ontin
ued
Nam
eA
cces
sion
num
ber
Des
crip
tion
Loc
aliz
atio
nIs
ofor
ms
Size
Ref
eren
ces
K66
E-R
163E
K66
Ean
dR
163E
inth
e14
-3-3
-lik
edo
mai
n.B
indi
ngto
UPF
1is
stro
ngly
redu
ced
invi
tro.
Fuku
hara
etal
.(20
05)
SMG
8G
ene
ID:
5518
1N
M01
8149
.6F
orm
sa
com
plex
wit
hSM
G1
Inhi
bits
SMG
1ki
nase
acti
vity
991
AA
/109
,684
kDa
SMG
9G
ene
ID:
5600
6N
M01
9108
.2F
orm
sa
com
plex
wit
hSM
G1
520
AA
/57,
651
kDa
2-18
1A
A2-
181.
Inte
ract
ion
toSM
G1
and
SMG
8is
lost
.Fe
rnan
dez
etal
.(20
11)
185-
520
AA
185-
520.
Inte
ract
ion
toSM
G1
and
SMG
8is
lost
.Fe
rnan
dez
etal
.(20
11)
175-
520
AA
175-
520.
Inte
ract
ion
toSM
G1
ishe
avily
impa
ired
.Fe
rnan
dez
etal
.(20
11)
NA
GSM
GL
1(C
.ele
gans
)G
ene
ID:5
1594
NM
0159
09.2
Ess
enti
alfo
rN
MD
inhu
man
san
dC
.ele
gans
2371
AA
/268
,571
kDa
DH
X34
SMG
L2
(C.e
lega
ns)
Gen
eID
:97
04N
M01
4681
.5R
NA
helic
ase
acti
vity
Ess
enti
alfo
rN
MD
inhu
man
san
dC
.ele
gans
1143
AA
/128
,120
kDa
aT
hew
ild-t
ype
fact
ors
and
the
corr
espo
ndin
gin
form
atio
nar
ein
bold
font
;th
esp
ecifi
cre
fere
nces
can
befo
und
inN
icho
lson
etal
.(20
09).
Nam
e,al
tern
ativ
ena
mes
(nam
esh
own
unde
rnea
th),
and
NC
BI
acce
ssio
nnu
mbe
rsar
epr
ovid
edfo
rid
entifi
catio
n.A
shor
tdes
crip
tion,
cellu
lar
loca
lizat
ion,
isof
orm
s,an
dm
olec
ular
mas
ses
are
also
prov
ided
.Mut
ants
ofea
chfa
ctor
are
desc
ribe
dbe
low
the
wild
-typ
ein
form
atio
n.

Analysis ofNonsense-
Mediated mRNADecay
27.4.14
Supplement 55 Current Protocols in Cell Biology
1. Polymerization. A fluorescent reporter (R) dye anda quencher (Q) are attached to the 5′ and 3′ end of aTaqMan probe respectively
forward primer
reverse primer
2. Strand displacement. When the probe is intact,the reporter dye emission is quenched.
3. Cleavage. During each extension cycle, the DNApolymerase cleaves the reporter dye from the probe
4. Polymerization completed. Once separated fromthe quencher, the reporter dye emits its characteristicfluorescence
3. Polymerization.During extension,primers and PCRproduct is generated
4. Polymerization iscompleted. SYBR Greendye binds to the ds DNAproduct resulting in anet increase influorescence
1. Reaction set-up.SYBR Green dyefluoresces whenbound to dsDNA
2. Denaturation. When the DNA isdenatured, the SYBR Green dye isreleased and flourescence isreduced
B
reverse primer
forward primer
5′
5′3′
5′
5′3′
5′
5′3′
5′
5′3′ 5′
5′3′
5′
5′3′
3
5′
5′′
A
′3
′3
′3
′3
5′
5′′3
probe
Figure 27.4.2 An illustration of TaqMan probe and SYBR Green chemistries. (A) A fluorophore (R) and a quencher (Q)dye are attached to opposite ends of a sequence-specific oligonucleotide probe (Holland et al., 1991). These two dyesform a donor-acceptor pair, with the fluorophore usually attached to the 5′ end of the probe and the quencher to the 3′
end. When a fluorophore is excited by light, it passes its energy to the quencher via FRET. As long as the donor andacceptor are in close proximity, very little fluorescence is generated. During each cycle of a qPCR protocol the dual-labeledprobe hybridizes to its complementary sequence just downstream from one of the PCR primers, encounters the probe,and hydrolyzes it from the 5′ end, releasing the fluorophore from the probe. As a result, the emission of the fluorophoreis no longer quenched and the increase in the fluorescence can be measured with a real-time qPCR device (reviewedin Bustin, 2000; Kubista et al., 2006). (B) The fluorophores used in nonspecific qPCR assays exhibit low fluorescencewhen unbound in solution (depicted by circles). Then, in the reaction, primers anneal and SYBR Green molecules bind tothe dsDNA. The DNA polymerase elongates the template and more SYBR Green molecules bind to the product formed,resulting in an exponential increase in the fluorescence level. The fluorescence data are collected after each extensionstep to monitor the progress of the reaction. SYBR Green is the most commonly used fluorophore for these assays; seetext for further details and references.

RNA-BasedMethods in CellBiology
27.4.15
Current Protocols in Cell Biology Supplement 55
Unlike DNA-binding fluorophores, target-specific chemistries that utilize fluorescentprobes and/or primers only detect the DNA containing the probe sequence; therefore,use of the reporter probe significantly increases specificity, and enables quantificationeven in the presence of nonspecific DNA amplification. Several types of specific detec-tion chemistries are available commercially, such as hairpin probes (molecular beacons,scorpions, sunrise primers, or LUX fluorogenic primers), hybridization probes, and hy-drolysis probes. They all utilize fluorescently tagged oligonucleotide probes that arespecifically designed to detect the target DNA sequence. Hydrolysis probes, typified bythe TaqMan chemistry and also known as 5′ nuclease assays, are the most commonlyused and are advocated in Basic Protocol 6. Here, a fluorophore and a quencher dye areattached to opposite ends of a sequence-specific oligonucleotide TaqMan probe. Thesetwo dyes form a donor-acceptor pair, with the fluorophore usually attached to the 5′ end ofthe probe and the quencher to the 3′ end. When a fluorophore is excited by light, it passesits energy to the quencher via fluorescence resonance energy transfer (FRET). As longas the donor and acceptor are in close proximity, i.e., linked to the same oligonucleotide,quenching is efficient and very little fluorescence is generated. During each cycle of aqPCR reaction, the dual-labeled probe hybridizes to its complementary sequence justdownstream from one of the PCR primers. When the elongating DNA polymerase en-counters the probe, its 5′-3′ exonuclease activity hydrolyzes the TaqMan probe, releasingthe fluorophore from the quencher. As a result, the emission of the fluorophore is nolonger quenched, and the increase in the fluorescence can be measured with a real-timeqPCR-instrument (Fig. 27.4.2A; Bustin, 2000; Wong and Medrano, 2005; Kubista et al.,2006).
Designing specific qPCR primers for SYBR Green I or TaqMan chemistry1. The optimal primer length is 15 to 25 bp.
2. The primers can have a G+C content between 20% to 70%.
3. The forward and reverse primer should have a similar Tm of approximately 60◦C (–/+1◦C).
4. No more than two G/C bases should be located in the last five bases at the 3′ end ofthe primer, because these base interactions are stronger than A/T interactions and maylead to mispriming.
5. Minimize the formation of primer-dimers by avoiding complementary sequencesbetween the forward and reverse primers, especially near their 3′ ends.
6. Where possible, try to design the primers in a way such that one of the primers isspanning an exon-exon boundary. This reduces the risk of amplification of any con-taminating genomic or plasmid DNA, since these intron-containing DNA sequencescannot be amplified by such primer pairs.
7. If the primers have to anneal to a very AT-rich sequence (hence making the Tm verylow), it might be advisable to substitute one or more bases with modified nucleic acidanalogs such as locked nucleic acids (LNA).
8. The optimal amplicon length for SYBR Green assays is a minimum of 100 bp, whichis needed to bind sufficient dye. Typical amplicons are between 100 and 200 bp long.Smaller amplicon sizes (60 to 100 bp) can be used in TaqMan assays (see below).Generally, shorter amplicon sizes are more favorable because they can be amplifiedmore efficiently.
9. Check that the target amplicon is not predicted to form any unfavorable secondarystructures.

Analysis ofNonsense-
Mediated mRNADecay
27.4.16
Supplement 55 Current Protocols in Cell Biology
Figure 27.4.3 Fluorophores and quenchers for TaqMan probes. The figure shows the approx-imate excitation spectra for many of the commercially available fluorophores. It also details thequenching ranges of the commercially available BHQ quenchers. For further details on TaqManassays, refer to the text.
10. If possible, the target amplicon should have a G+C content of no more than 60%.High GC content can reduce the amplification efficiency.
Designing fluorescently labeled probes for TaqMan assays1. Design the probe with a fluorophore at the 5′ end and a suitable “black hole quencher”
(BHQ) at the 3′ end. The emission spectrum of the fluorophore has to overlap withthe excitation spectrum of the quencher to achieve efficient quenching. The approx-imate excitation and emission spectra of the most frequently used fluorophores andquenchers are detailed in Figure 27.4.3. Use this to select an optimal commerciallyavailable fluorophore/quencher pair.
2. Avoid using G near the 5′ end as it can quench fluorescence.
3. Avoid long stretches of the same base, especially G.
4. The probe length should be no more than 30 bp in length to maximize the quenchingof the fluorophore.
5. The TaqMan probe Tm should be in the region of 68◦ to 70◦C (which is 10◦C higherthan the Tm of the primers to ensure that the TaqMan probe will always bind thetemplate before the primer).
6. Modifications such as minor groove binders (MGB) can be incorporated into probesto increase Tm, allowing the use of shorter probes or more AT-rich sequences.
Finally, for designing both primers and probes, a BLAST search should be carried out toidentify any significant matches to any other sequences in the database that could resultin false-positive results. Likewise, analyze the probe sequence for sources of variabilitysuch as SNP sites and splice variants. It is highly beneficial to use software tools that areavailable for primer and probe design.

RNA-BasedMethods in CellBiology
27.4.17
Current Protocols in Cell Biology Supplement 55
BASICPROTOCOL 1
CREATION OF PTC+ mRNAs AND MUTANT NMD PROTEINS BYSITE-DIRECTED MUTAGENESIS
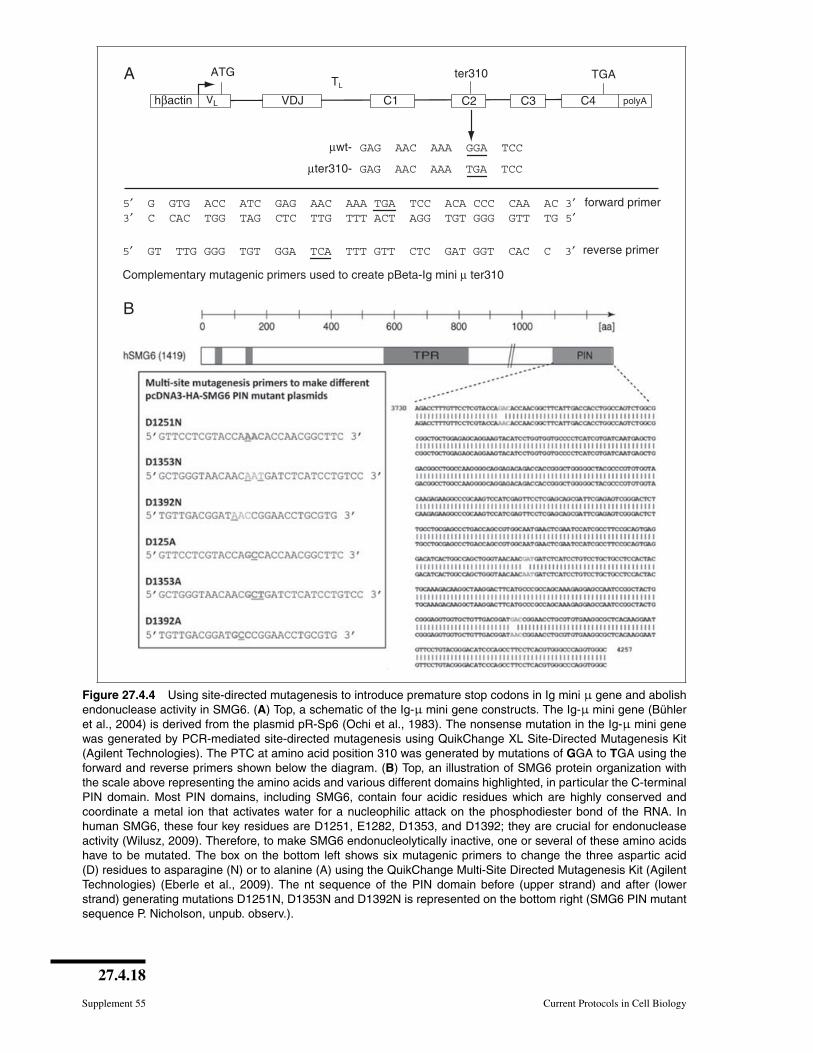
PTCs can appear in mRNAs for a variety of reasons. At the DNA level, PTCs arise fromerroneous bases in the gene sequence of the genome (mutations) or due to insertionsor deletions leading to frame-shift mutations in genes. At the RNA level, PTCs can beproduced by alternative splicing (or splicing errors in general), or less frequently bytranscriptional errors. It is estimated that in mammals about one-third of alternativelyspliced transcripts contain PTCs and are substrates for NMD (Lewis et al., 2003). Inaddition to having a damage-control function, NMD is a critical process in normal cellulardevelopment. For example, the immunoglobulin (Ig) superfamily and T cell–receptorgenes in mammalian lymphocytes undergo dramatic rearrangement during maturation ofthe immune system. This somatic recombination results in a high frequency (∼66%) offrame-shifted genes containing PTCs. To cope with this, the PTC+ mRNAs are down-regulated by 90% to 99% by NMD (Carter et al., 1995). For this reason, researchersinvestigating NMD often utilize these genes, where they compare the wild-type andPTC+ versions. For experiments relying on NMD reporter genes, the PTC is specificallyintroduced into the open reading frame of these genes by site-directed mutagenesis, asshown in Figure 27.4.4A for the Ig mini μ gene.
Messenger RNAs are associated with a host of protein factors throughout their lifetime,and mRNAs targeted for NMD are associated with many proteins that will direct themRNA to degradation. Therefore, to investigate the intricacies of degradation of non-sense mRNAs, it is important to know all of the factors involved in NMD. In particular,it is vital to structurally understand these factors and try to elucidate which parts of thesefactors might be essential for the degradation of nonsense mRNAs. A comprehensivesummary and discussion of all known NMD factors and factors associated with NMDare provided by recent reviews (Chang et al., 2007; Nicholson et al., 2009). A great dealof what is known about the different functions of the NMD proteins has been generatedby mutational studies. To serve as a useful reference for your NMD experiments, anextensive collection of existing NMD factor mutants is presented in Table 27.4.1. Exam-ples of altering one or a few specific nucleotides (nt) in plasmid DNA by site-directedmutagenesis to generate a PTC in a NMD reporter gene or to inactivate a functionaldomain of a NMD factor are shown in Figure 27.4.4.
Site-directed mutagenesis is a method in which a mutation is created at a precise sitein a DNA molecule. The protocols below use the QuikChange II kit from AgilentTechnologies to make point mutations, insertions, or deletions in plasmid DNA, andthe QuikChange Multi-Site kit from Agilent Technologies to make up to five amino acidchanges in the plasmid DNA, but the necessary reagents can also be purchased separately.The concepts behind these protocols are explained below and illustrated in Figure 27.4.5.These procedures are based on a combination of the Agilent Technologies QuikChangeprotocols and experience from our own laboratory. For further information about themethod of site-directed mutagenesis see (Fisher and Pei, 1997; Wang and Malcolm,1999; Zheng et al., 2004).
NOTE: Essential details to this protocol are included in the Commentary (see sectionsentitled “Basic Protocol 1: Creation of PTC+ mRNAs and mutant NMD proteins bysite-directed mutagenesis” in Background Information, Critical Parameters and Trou-bleshooting, Anticipated Results, and Time Considerations) and must be read in con-junction with this protocol before proceeding with any experiment.
27.4.18
Supplement 55 Current Protocols in Cell Biology
ter310ATG
VDJ C1 C2 C3hβactin
TGA
C4 polyA
μwt- GAG AAC AAA GGA TCC
GAG AAC AAA TGA TCCμter310-
A
5 G GTG ACC ATC GAG AAC AAA TGA TCC ACA CCC CAA AC 33 C CAC TGG TAG CTC TTG TTT ACT AGG TGT GGG GTT TG 5
5 GT TTG GGG TGT GGA TCA TTT GTT CTC GAT GGT CAC C 3
Complementary mutagenic primers used to create pBeta-Ig mini μ ter310
forward primer
reverse primer
TL
VL
B
Figure 27.4.4 Using site-directed mutagenesis to introduce premature stop codons in Ig mini μ gene and abolishendonuclease activity in SMG6. (A) Top, a schematic of the Ig-μ mini gene constructs. The Ig-μ mini gene (Buhleret al., 2004) is derived from the plasmid pR-Sp6 (Ochi et al., 1983). The nonsense mutation in the Ig-μ mini genewas generated by PCR-mediated site-directed mutagenesis using QuikChange XL Site-Directed Mutagenesis Kit(Agilent Technologies). The PTC at amino acid position 310 was generated by mutations of GGA to TGA using theforward and reverse primers shown below the diagram. (B) Top, an illustration of SMG6 protein organization withthe scale above representing the amino acids and various different domains highlighted, in particular the C-terminalPIN domain. Most PIN domains, including SMG6, contain four acidic residues which are highly conserved andcoordinate a metal ion that activates water for a nucleophilic attack on the phosphodiester bond of the RNA. Inhuman SMG6, these four key residues are D1251, E1282, D1353, and D1392; they are crucial for endonucleaseactivity (Wilusz, 2009). Therefore, to make SMG6 endonucleolytically inactive, one or several of these amino acidshave to be mutated. The box on the bottom left shows six mutagenic primers to change the three aspartic acid(D) residues to asparagine (N) or to alanine (A) using the QuikChange Multi-Site Directed Mutagenesis Kit (AgilentTechnologies) (Eberle et al., 2009). The nt sequence of the PIN domain before (upper strand) and after (lowerstrand) generating mutations D1251N, D1353N and D1392N is represented on the bottom right (SMG6 PIN mutantsequence P. Nicholson, unpub. observ.).

RNA-BasedMethods in CellBiology
27.4.19
Current Protocols in Cell Biology Supplement 55
Materials
Mutagenic primers (see Strategic Planning)Template dsDNA of interest (see Strategic Planning)Kits containing PCR reaction components (Table 27.4.2)Necessary controls (see Table 27.4.2)Restriction endonuclease DpnIUltracompetent cells (e.g., from XL10-Gold Ultracompetent cells from Agilent
Technologies)2-mercaptoethanol (optional)0.1 ng/μl pUC18 transformation control plasmidLuria-Bertani (LB) liquid medium (APPENDIX 2A) with and without appropriate
antibiotic (usually 100 μg/ml ampicillin or 50 μg/ml kanamycin; see recipe forantibiotic stocks) for the plasmid vector
LB agar plates (APPENDIX 2A) containing 100 μg/ml ampicillin (see recipe forantibiotic stocks), 80 μg/ml Xgal (prepare from 50 mg/ml stock; see recipe), and0.5 mM IPTG (prepare from 0.1 M stock; see recipe)
Plasmid DNA alkaline lysis miniprep kit
0.2-ml thin-walled PCR tubesThermal cycler42◦C water bath14-ml polypropylene round-bottom tubes (e.g., BD Falcon)37◦C shaking incubator
NOTE: In theory, for simple alterations, it is possible to follow the protocol describedbelow (excluding the control reactions) for the QuikChange II kit and provide the fol-lowing reagents from elsewhere: dNTP mix, high-fidelity DNA polymerase, and reactionbuffer containing Mg2+, DpnI restriction endonuclease, and competent bacteria.
Amplify mutant DNA by PCR1. In a 0.2-ml thin-walled PCR tube, mix the components shown in Table 27.4.2 and
program the thermal cycler for the cycling parameters shown in Table 27.4.3 for theappropriate kit. Perform PCR.
Digest methylated (parental) DNA using the restriction endonuclease DpnI2. Add 1 μl of 10 U/μl DpnI to the PCR reaction product from step 1. Gently and
thoroughly mix each reaction mixture by pipetting the solution up and down sev-eral times. Spin down the reaction mixtures in a microcentrifuge for 1 min, andimmediately incubate for 1 hr at 37◦C.
In the multi-site Lightning kit, the DpnI enzyme has been specifically enhanced so that a5-min incubation time is sufficient to digest the parental DNA, hence making the wholeprocedure faster.
IMPORTANT NOTE: If low mutagenesis efficiency is observed, the volume of DpnI usedand/or the incubation time of the reaction can be increased.
Transform bacteria using XL-10 Gold Ultracompetent E. coli cells3. Gently thaw the XL-10-Gold Ultracompetent cells on ice and aliquot 45 μl of the
cells into pre-chilled 14-ml polypropylene round-bottom tubes.
Escherichia coli strain, XL10-Gold Ultracompetent Cells (Agilent Technologies):
Genotype: Tetr �(mcrA)183 �(mcrCB-hsdSMR-mrr)173 endA1 supE44 thi-1 recA1gyrA96 relA1 lac Hte [F ’ proAB lacIqZ�M15 Tn10 (Tetr) Amy Camr].
Resistance: tetracycline and chloramphenicol.
Efficiency: ≥5·109 cfu/μg pUC18 DNA.

Analysis ofNonsense-
Mediated mRNADecay
27.4.20
Supplement 55 Current Protocols in Cell Biology
A BQuikChange II QuikChange Multi-Site
1
2
3
thermal cycles
Me Me
Me Me
MeMe
1
2
3
(predominant product from step 1)
Figure 27.4.5 Overview of various QuikChange Kits (Agilent Technologies). (A) The methodemploys a supercoiled double-stranded DNA (dsDNA) vector with an insert of interest and two syn-thetic oligonucleotide primers, both containing the desired mutation. The oligonucleotide primers,each complementary to opposite strands of the vector, are extended during PCR, without primerdisplacement. Extension of the oligonucleotide primers generates a mutated plasmid containingstaggered nicks (step 1 in this figure). Then, the product is treated with DpnI, which is specificfor methylated and hemi-methylated DNA and is used to digest the parental DNA template andto select for mutation-containing synthesized DNA, because DNA isolated from almost all E. colistrains is dam methylated and therefore susceptible to DpnI digestion (step 2 in the figure). Thenicked vector DNA containing the desired mutations is then transformed into E. coli cells (step3 in the figure). The QuikChange II XL is a more specialized version of the method shown in(A), whereby the kit is tailored to the efficient mutagenesis of large (or difficult to mutagenize)plasmid templates. Here, QuikSolution is added to the PCR to aid in the replication of large tem-plates, and the bacterial cells used in this kit have much higher transformation efficiency. (B) Forthe QuikChange Multi Site-Directed mutagenesis, PCR is carried out with supercoiled dsDNAtemplate, two or more synthetic phosphorylated oligonucleotide primers containing the desiredmutations all binding to the same strand, and the kit-provided enzyme blend, which can seal thenicks in the one strand bearing multiple mutations and containing nicks. This ssDNA PCR productis treated with DpnI as in (A). Then, the reaction mixture, enriched for multiply mutated ssDNA,is transformed into E. coli cells, where the mutant closed circle ssDNA is converted into duplexform in vivo. The QuikChange Lightning Multi Site-Directed mutagenesis method is the same asoutlined in (B). However, it is faster due to speedier cycling parameters, and the DpnI enzyme hasbeen enhanced so that a reaction time of 5 min rather than 60 min is sufficient. The diagrams havebeen adapted from the Agilent Technologies QuikChange manuals.
4. Optional: Add 2 μl of 2-mercaptoethanol to the cells and incubate the tubes on icefor 10 min, gently swirling the contents of the tube every 2 min.
5. Transfer 2 μl of the DpnI-treated DNA into the 45 μl of XL-10-Gold ultracompetentcells. Keep the remainder of the DpnI-treated DNA at −20◦C in case the reactiondoes not work optimally.
As a transformation control, 1 μl of pUC18 control plasmid (0.1 ng/μl) can also betransformed into 45 μl of cells.
RNA-BasedMethods in CellBiology
27.4.21
Current Protocols in Cell Biology Supplement 55
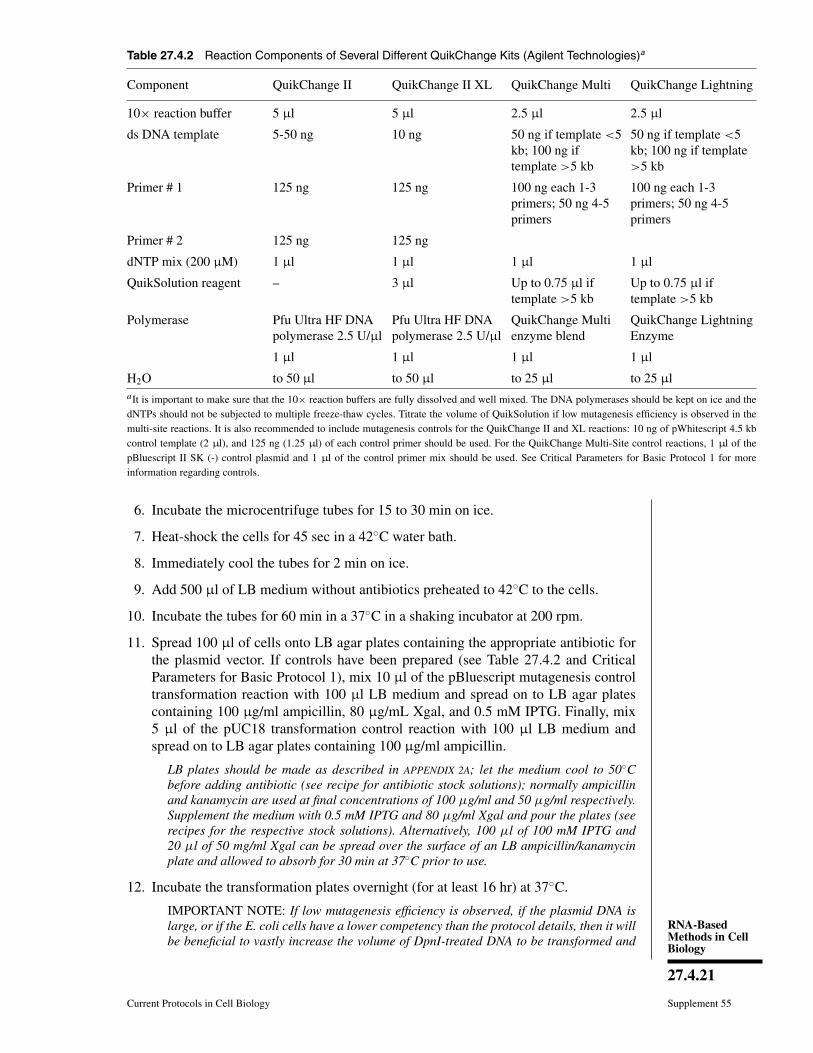
Table 27.4.2 Reaction Components of Several Different QuikChange Kits (Agilent Technologies)a
Component QuikChange II QuikChange II XL QuikChange Multi QuikChange Lightning
10× reaction buffer 5 μl 5 μl 2.5 μl 2.5 μl
ds DNA template 5-50 ng 10 ng 50 ng if template <5kb; 100 ng iftemplate >5 kb
50 ng if template <5kb; 100 ng if template>5 kb
Primer # 1 125 ng 125 ng 100 ng each 1-3primers; 50 ng 4-5primers
100 ng each 1-3primers; 50 ng 4-5primers
Primer # 2 125 ng 125 ng
dNTP mix (200 μM) 1 μl 1 μl 1 μl 1 μl
QuikSolution reagent – 3 μl Up to 0.75 μl iftemplate >5 kb
Up to 0.75 μl iftemplate >5 kb
Polymerase Pfu Ultra HF DNApolymerase 2.5 U/μl
Pfu Ultra HF DNApolymerase 2.5 U/μl
QuikChange Multienzyme blend
QuikChange LightningEnzyme
1 μl 1 μl 1 μl 1 μl
H2O to 50 μl to 50 μl to 25 μl to 25 μlaIt is important to make sure that the 10× reaction buffers are fully dissolved and well mixed. The DNA polymerases should be kept on ice and thedNTPs should not be subjected to multiple freeze-thaw cycles. Titrate the volume of QuikSolution if low mutagenesis efficiency is observed in themulti-site reactions. It is also recommended to include mutagenesis controls for the QuikChange II and XL reactions: 10 ng of pWhitescript 4.5 kbcontrol template (2 μl), and 125 ng (1.25 μl) of each control primer should be used. For the QuikChange Multi-Site control reactions, 1 μl of thepBluescript II SK (-) control plasmid and 1 μl of the control primer mix should be used. See Critical Parameters for Basic Protocol 1 for moreinformation regarding controls.
6. Incubate the microcentrifuge tubes for 15 to 30 min on ice.
7. Heat-shock the cells for 45 sec in a 42◦C water bath.
8. Immediately cool the tubes for 2 min on ice.
9. Add 500 μl of LB medium without antibiotics preheated to 42◦C to the cells.
10. Incubate the tubes for 60 min in a 37◦C in a shaking incubator at 200 rpm.
11. Spread 100 μl of cells onto LB agar plates containing the appropriate antibiotic forthe plasmid vector. If controls have been prepared (see Table 27.4.2 and CriticalParameters for Basic Protocol 1), mix 10 μl of the pBluescript mutagenesis controltransformation reaction with 100 μl LB medium and spread on to LB agar platescontaining 100 μg/ml ampicillin, 80 μg/mL Xgal, and 0.5 mM IPTG. Finally, mix5 μl of the pUC18 transformation control reaction with 100 μl LB medium andspread on to LB agar plates containing 100 μg/ml ampicillin.
LB plates should be made as described in APPENDIX 2A; let the medium cool to 50◦Cbefore adding antibiotic (see recipe for antibiotic stock solutions); normally ampicillinand kanamycin are used at final concentrations of 100 μg/ml and 50 μg/ml respectively.Supplement the medium with 0.5 mM IPTG and 80 μg/ml Xgal and pour the plates (seerecipes for the respective stock solutions). Alternatively, 100 μl of 100 mM IPTG and20 μl of 50 mg/ml Xgal can be spread over the surface of an LB ampicillin/kanamycinplate and allowed to absorb for 30 min at 37◦C prior to use.
12. Incubate the transformation plates overnight (for at least 16 hr) at 37◦C.
IMPORTANT NOTE: If low mutagenesis efficiency is observed, if the plasmid DNA islarge, or if the E. coli cells have a lower competency than the protocol details, then it willbe beneficial to vastly increase the volume of DpnI-treated DNA to be transformed and

Analysis ofNonsense-
Mediated mRNADecay
27.4.22
Supplement 55 Current Protocols in Cell Biology
Table 27.4.3 Thermal Cycling Programs for Different QuikChange Protocolsa
Step QuikChange II QuikChange II XL QuikChangeMulti-Site
QuikChange LightningMulti-Site
Time/temp. Cycles Time/temp. Cycles Time/temp. Cycles Time/temp. Cycles
Initialdenaturation
30 sec at95◦C
1× 60 sec at95◦C
1× 60 sec at95◦C
1× 120 sec at95◦C
1×
Denaturation 30 sec at95◦C
12-18× 50 sec at95◦C
18× 60 sec at95◦C
30× 20 sec at95◦C
30×
Primerannealing
60 sec at55◦C
50 sec at60◦C
60 sec at55◦C
30 sec at60◦C
Elongation 60 sec/kbat 68◦C
60 sec/kbat 68◦C
120sec/kb at65◦C
30 sec /kbat 65◦C
FinalElongation
— — 420 sec at68◦C
1× 300 sec at65◦C
1×
aThe reaction stringency can be increased, if many false positives are being observed using the QuikChange II and XL cycling parameters,by increasing the annealing temperature.
to also plate more of the transformed bacteria on to the agar plates. However, alwaysensure that the DNA comprises no more than 10% of the transformation reaction.
As an indication that the positive control supplied with the site-directed mutagenesis kitof choice has been successful, there should be predominantly blue-colored colonies onthe LB/ampicillin/IPTG/Xgal plates. As an indication that the transformation procedurewas successful, there should be as many white colonies on the pUC18 transformationcontrol LB/ampicillin plate. For further information regarding these controls, please referto Critical Parameters for Basic Protocol 1 (section on “Controls”).
13. Pick single colonies and inoculate each into 5 ml of LB medium containing theappropriate antibiotic.
14. Incubate the cultures overnight in a 37◦C shaking incubator at 200 rpm.
15. Prepare small-scale high quality double-stranded DNA using a miniprep kit accord-ing to the alkaline lysis method.
16. Perform DNA sequencing to check that you have introduced your desired change(s)but that the PCR has not introduced any unintentional errors.
BASICPROTOCOL 2
pSUPuro-BASED RNAi TO KNOCK DOWN NMD FACTORS
Four different types of RNA molecules are commonly used for knockdown experiments:synthetic siRNAs, small hairpin RNAs (shRNAs), small hairpin microRNAs (shmiR-NAs), and long double-stranded RNAs (dsRNA) (Echeverri and Perrimon, 2006; Leeand Kumar, 2009). Synthetic siRNAs are small RNA duplexes composed of 19 comple-mentary base pairs (bps) and 2-nt 3′ overhangs. They are transfected into cells or injectedinto animals. On entering cells, the strand with thermodynamically less stably paired 5′end of the siRNA duplex is incorporated into the multi-subunit RNA-induced silencingcomplex (RISC) and directs RISC to the target mRNA by complementary base-pairing,resulting in mRNA degradation. The effects of the siRNAs are transient, especially inactively dividing cells. In contrast, shRNA and shmiRNA-synthesizing vectors allow forcontrolled or continuous expression of effector RNA molecules in the cell. The shRNAand shmiRNA transcripts consist of both the sense and antisense strand connected bya loop sequence. The DNA-encoding shRNA or shmiRNAs are either transfected into

RNA-BasedMethods in CellBiology
27.4.23
Current Protocols in Cell Biology Supplement 55
cells as plasmids or delivered in the form of viral particles, and are maintained as extra-chromosomal copies or stably integrated in the genome as transgenes. The 50- to 70-bpsingle-stranded RNA (ssRNA) transcripts fold back to form stem-loop structures thatare processed in the cytoplasm by Dicer to generate siRNAs, of which one strand thenassembles into RISC as for synthetic siRNAs.
NOTE: Essential details to this protocol are included in the Commentary (see sectionsentitled “Basic Protocol 2: pSUPuro-based RNAi to knock down NMD factors” inBackground Information, Critical Parameters and Troubleshooting, Anticipated Results,and Time Considerations) and must be read in conjunction with this protocol beforeproceeding with any experiment.
Materials
Human cervix epithelioid carcinoma cell line (HeLa cells) or human cell line ofchoice
pSUPuro plasmid with inserted oligonucleotides that contain theshRNA-expressing sequences targeting gene of choice (see Strategic Planningand Fig. 27.4.1)
pSUPuro plasmid with no inserted oligonucleotides (pSUPuro-empty)DMEM+/+ medium (see recipe)DMEM–/– medium (see recipe)DreamFect transfection reagent (OZ Biosciences, http://www.ozbiosciences.com/)DMEM+/– medium (see recipe)Phosphate-buffered saline (PBS; APPENDIX 2A)0.05% trypsin/EDTA (e.g., Invitrogen, cat. no. 25300-062)0.5 mg/ml puromycin stock solution (see recipe)
Hemacytometer6-well culture plates25-cm2 culture flasksTissue culture inverted microscope
Additional reagents and equipment for basic cell culture techniques includingcounting cells (UNIT 1.1), harvesting cells (Support Protocol 2), protein blotting(UNIT 6.2), and RT-qPCR (Basic Protocols 5 and 6)
Day 11. Use a hemacytometer or automated cell counter to determine the quantity of cells
present (UNIT 1.1) and to calculate the dilution factor necessary to seed 2 × 10⁵
cells/well in 6-well plate(s). Seed the cells using DMEM+/+ medium.
Day 22. Ensure that the cells seeded the day before are at least 60% confluent.
3. Allow the transfection reagent to warm to room temperature and gently vortex thesolution.
4. Dilute 400 ng of the pSUPuro containing the siRNA-expressing sequences orpSUPuro empty plasmid with DMEM–/– (without serum and antibiotics) to afinal volume of 100 μl.
5. Dilute 4 μl of DreamFect transfection reagent per μg of DNA to a final volume of100 μl. Ensure that the transfection reagent doesn’t touch the side of the tube, dilutedirectly into the DMEM–/– solution, and move on to step 6 within 5 min.

Analysis ofNonsense-
Mediated mRNADecay
27.4.24
Supplement 55 Current Protocols in Cell Biology
6. Combine the diluted DNA and diluted DreamFect, gently mix (do not vortex orcentrifuge) the solution and incubate the DNA-DreamFect mixture for at least 15 minat room temperature.
7. Carefully add the 200 μl transfection mixture drop-wise to the cells growing inDMEM+/− medium and gently rock the plate from side to side to ensure a uniformdistribution of the mixture.
8. Incubate the cells at 37◦C in a CO2 incubator under standard conditions until day 3.
IMPORTANT NOTE: Contamination of plasmid DNA samples with bacterial endo-toxin can cause massive cell death and interfere with transfection efficiencies. Therefore,ethanol precipitation of the plasmid DNA after using a kit is recommended to obtainhigh-quality endotoxin-free DNA.
Day 39. Remove medium from the cells, being careful not to disturb the cells.
10. Wash monolayers twice with PBS.
11. Add 100 μl of 0.05% trypsin/EDTA to the cells in each well of the 6-well plate, thengently rock the plate to ensure uniform coverage of the cells with TE buffer.
12. Return the plate to the incubator for 5 min to allow the cells to detach.
13. Meanwhile, calculate the volume of medium required for 5 ml, 25-cm2 flasks anddilute the stock solution of puromycin into the calculated volume of DMEM+/+ toa final concentration of 1.5 μg/ml puromycin.
14. Transfer the cells in 5 ml of puromycin-containing medium from each well in the6-well plate to a 25-cm2 flask to specifically select for the cells containing thepSUPuro plasmids.
15. For the next 48 hr incubate the cells at 37◦C in a CO2 incubator under standardconditions.
Day 4Observe the cells under the microscope. The selection process is on-going and untrans-fected cells should be dying.
Day 516. Remove the puromycin-containing medium from the 25-cm2 flasks.
17. Wash the transfected cells twice with PBS, being careful not to disturb the cells.
18. Add 5 ml fresh DMEM+/+ lacking puromycin.
19. Incubate the cells at 37◦C in a CO2 incubator under standard conditions until thenext day.
Day 620. Remove the medium from the 25-cm2 flasks.
21. Wash twice with PBS.
22. Harvest the cells for both protein (see Support Protocol 2) and RNA analyses (seeBasic Protocols 4-6).
23. Check the knockdown efficiency at the protein level by SDS-PAGE and westernblotting and at the mRNA level by RT-qPCR or northern blotting.
Blotting techniques are described in UNIT 6.2; RT-qPCR is described in Basic Protocols5 and 6.

RNA-BasedMethods in CellBiology
27.4.25
Current Protocols in Cell Biology Supplement 55
BASICPROTOCOL 3
NMD COMPLEMENTATION ASSAYS
The protocol in this section is based upon the previous two methodologies: creatingspecific mutations in genes by site-directed mutagenesis and knocking down genes byvector-based RNAi. Experiments investigating NMD show that a reporter mRNA con-taining a PTC will be rapidly degraded compared to its wild-type counterpart. Therefore,if an essential protein for NMD is depleted by RNAi, then the PTC reporter mRNAlevels will be similar to the wild-type counterpart because it will no longer be subjectedto NMD. The basis of the NMD complementation assay is to knock down an essentialNMD protein, which will abolish NMD, and then rescue the phenotype by exogenouslyexpressing the same gene that has been made resistant to the RNAi via silent mutationsin the shRNA binding sites.
All of the same materials are required as listed in Basic Protocol 2 but the followingadditional materials are necessary.
NOTE: Essential details to this protocol are included in the Commentary (see sectionsentitled “Basic Protocol 3: NMD complementation assays” in Background Information,Critical Parameters and Troubleshooting, Anticipated Results, and Time Considerations)and must be read in conjunction with this protocol before proceeding with any experiment.
Materials
pSUPuro empty (pSUPuro-E)pSUPuro Vector that expresses a short interfering RNA, to knockdown SMG6 gene
(pSUPuro-SMG6, see Fig. 27.4.4C)Empty vector is from Invitrogen (pcDNA3-E) or pcDNA3 plasmid expressing
another NMD factorPlasmid exogenously expressing SMG6 (pcDNA3-HA-SMG6)Plasmid exogenously expressing RNAi resistant version of SMG6 gene
(pcDNA3-HA-SMG6-RNAiR, see Fig. 27.4.4D)Plasmid exogenously expressing RNAi resistant version of SMG6 gene that has
mutations to make it endonucleolytically inactive, as shown in Figure 27.4.4B(pcDNA3-HA-SMG6 PIN mut-RNAiR)
Plasmid expressing green fluorescence protein (GFP) to act as a transfectioncontrol (p-EGFP-C1 BD Biosciences, Clontech)
pBeta-actin-Ig mini μ wild-type (Ig mu wt)pBeta-actin-Ig mini μ Ter 310 (Ig mu ter 310; see Fig. 27.4.4A)
MethodologyThe only difference from Basic Protocol 2 is the transfection procedure. On Day 2, theplasmids exogenously expressing NMD factors must be included in the transfection.Table 27.4.4 shows an example protocol detailing a typical transfection scheme for aSMG6 complementation experiment.
EXTRACTION OF RNA AND ANALYSIS OF RNA LEVELS BY REVERSETRANSCRIPTION–QUANTITATIVE PCR
For determination of relative RNA levels, reverse transcription (RT) followed by quantita-tive PCR (RT-qPCR) is a sensitive, accurate, and relatively quick—and hence popular—technique. The RNA is first isolated and purified from cells (Basic Protocol 4), thentranscribed into complementary DNA (cDNA; Basic Protocol 5), which is used in turnas a template in the qPCR assay (Basic Protocol 6). Since cDNA is usually created fromspliced messenger RNA (mRNA), it differs from genomic DNA in that it does not con-tain introns. The lack of introns in cDNA can be exploited for designing cDNA-specificprimers over exon-exon junctions that will not amplify possible contaminants of the RNA

Analysis ofNonsense-
Mediated mRNADecay
27.4.26
Supplement 55 Current Protocols in Cell Biology
Table 27.4.4 An Example of a Co-transfection Plan for an SMG6 Complementation Assaya
Transfection PTC-/+ Transfection control RNAi Expression plasmid
TF 1 Ig-mu wt p-EGFP-C1 pSUPuro-E pcDNA3-E
TF 2 Ig-mu ter310 p-EGFP-C1 pSUPuro-E pcDNA3-E
TF 3 Ig-mu wt p-EGFP-C1 pSUPuro-E pcDNA3-HA-SMG6
TF 4 Ig-mu ter310 p-EGFP-C1 pSUPuro-E pcDNA3-HA-SMG6
TF 5 Ig-mu wt p-EGFP-C1 pSUPuro-E pcDNA3-HA-SMG6-RNAiR
TF 6 Ig-mu ter310 p-EGFP-C1 pSUPuro-E pcDNA3-HA-SMG6-RNAiR
TF 7 Ig-mu wt p-EGFP-C1 pSUPuro-E pcDNA3-HA-SMG6-PIN-mut-RNAiR
TF 8 Ig-mu ter310 p-EGFP-C1 pSUPuro-E pcDNA3-HA-SMG6-PIN-mut-RNAiR
TF 9 Ig-mu wt p-EGFP-C1 pSUPuro-SMG6 pcDNA3-E
TF 10 Ig-mu ter310 p-EGFP-C1 pSUPuro-SMG6 pcDNA3-E
TF 11 Ig-mu wt p-EGFP-C1 pSUPuro-SMG6 pcDNA3-HA-SMG6
TF 12 Ig-mu ter310 p-EGFP-C1 pSUPuro-SMG6 pcDNA3-HA-SMG6
TF 13 Ig-mu wt p-EGFP-C1 pSUPuro-SMG6 pcDNA3-HA-SMG6-RNAiR
TF 14 Ig-mu ter310 p-EGFP-C1 pSUPuro-SMG6 pcDNA3-HA-SMG6-RNAiR
TF 15 Ig-mu wt p-EGFP-C1 pSUPuro-SMG6 pcDNA3-HA-SMG6-PIN-mut-RNAiR
TF 16 Ig-mu ter310 p-EGFP-C1 pSUPuro-SMG6 pcDNA3-HA-SMG6-PIN-mut-RNAiR
aMost probably, 100 ng of Ig mini μ expression plasmids, 100 ng of the EGFP expression plasmid, and 400 ng of thepSUPuro plasmids would be used in each transfection. However, it is difficult to state the exact amounts of the RNAi-resistant NMD factor expression plasmids that would be required to express these genes at similar levels to each other.Hence, this table simply describes the plasmids that should be co-transfected only.
samples with genomic or plasmid DNA. The RT phase (RNA to cDNA) is crucial forprecise and sensitive quantification, because the amounts of cDNA produced must beproportional to the original amounts of RNA. Successful cDNA synthesis is dependenton the integrity and purity of the template RNA and on using well optimized conditions.RT-qPCR can be performed in a one-step or a two-step assay. This protocol uses thetwo-step RT-qPCR method. In two-step assays, the RT and qPCR steps are performed inseparate tubes, with different optimized buffers and reaction conditions. By performingthe RT step separately, a stable cDNA pool is generated that can be stored for long peri-ods of time and used for multiple measurements. It has also been reported that one-stepprotocols are less sensitive than two-step protocols (Battaglia et al., 1998). However,the two-step method does mean more pipetting, different tubes, and more time. In BasicProtocol 6, the qPCR procedure follows the basic principle of PCR. Its key feature is thatthe amplified cDNA is detected as the reaction develops in real time, unlike in standardPCR, where the product of the reaction is detected at its endpoint. qPCR is based onthe observation that there is a quantitative relationship between the amount of the targetmaterial present before PCR and the amount of product formed during the PCR process.Two common methods for detection of products in real-time PCR are: (1) nonspecificchemistries that usually detect fluorescence of a DNA-binding dye, and (2) target-specific

RNA-BasedMethods in CellBiology
27.4.27
Current Protocols in Cell Biology Supplement 55
chemistries that utilize fluorescence probes and/or primers. The fluorophores used in RT-qPCR assays absorb light energy at one wavelength and almost immediately re-emit thelight energy at another, longer wavelength. Each fluorophore has a distinctive range ofwavelengths at which it absorbs light and another at which it emits light. This propertyenables their use for specific detection of PCR products by qPCR-instruments.
NOTE: Essential details to these protocols are included in the Commentary (see sectionsentitled “Basic Protocols 4-6: Extraction of RNA and analysis of RNA levels by reversetranscription–quantitative PCR” in Background Information, Critical Parameters andTroubleshooting, Anticipated Results, and Time Considerations) and must be read inconjunction with these protocols before proceeding with any experiment.
BASICPROTOCOL 4
Guanidium Thiocyanate–Phenol–Chloroform Extraction of RNA
Methodology
Briefly, this method depends on phase separation by centrifugation of a mix of theaqueous sample and a solution containing water-saturated phenol, chloroform, and achaotropic denaturing agent called guanidinium thiocyanate, resulting in an upper aque-ous phase and a lower organic phase (mainly phenol/chloroform). RNA partitions in theaqueous phase and genomic DNA partitions in the interphase, while protein partitionsin the organic phase. In a last step, RNA is recovered from the aqueous phase by pre-cipitation with isopropanol. This RNA isolation method was originally devised by PiotrChomczynski and Nicoletta Sacchi and published in 1987 (referred to as Guanidiniumthiocyanate-phenol-chloroform extraction; Chomczynski and Sacchi, 1987, 2006). Thistype of reagent used for RNA extraction can be purchased from Sigma-Aldrich (TRI-reagent), from Invitrogen (TRIzol), and also from Bioline (Trisure). In our laboratory,we prepare TRI-mix ourselves for a fraction of the cost of the commercially availableproducts (see Reagents and Solutions for the recipe). The TRI-mix protocol takes slightlylonger than column-based methods such as the silica-based purification, but it has highercapacity and can yield more RNA. It is important to note that most column-based methodsare typically unsuitable for purification of short (<200 nts) RNA species. For all appli-cations involving cell pellets or tissues, 10 times more TRI–mix is used than biologicalmaterial to be extracted (volume/volume).
Materials
Cell samples for extraction of RNA (see protocols above)Phosphate-buffered saline (PBS; APPENDIX 2A)TRI-mix (see recipe; very toxic)Chloroform (potential narcotic)20 mg/ml glycogen, molecular biology grade (e.g., Sigma, cat. no. G1767)Isopropanol (2-propanol)75% ethanol in DEPC-treated waterRNase-free water: filtered or DEPC treated as described in APPENDIX 2A
Ambion TURBO DNA-free DNase Treatment and Removal Reagents (InvitrogenApplied Biosystems:10 × TURBO DNase BufferTURBO DNase, 2 U/μlDNase inactivation solution and nuclease-free water
Aerosol-barrier pipet tipsNuclease-free 1.5-ml microcentrifuge tubesRefrigerated microcentrifugeThermomixer heat block (e.g., Eppendorf Thermomixer Compact)
Additional reagents and equipment for spectrophotometric quantitation of RNA(Support Protocol 3)

Analysis ofNonsense-
Mediated mRNADecay
27.4.28
Supplement 55 Current Protocols in Cell Biology
Separate phases1. Remove the medium from the cells.
2. Wash monolayer twice with PBS.
3. Add 1 ml TRI-mix per 10-cm2 of culture dish surface area directly to the cells in thedish.
For example, for a 6-well plate, each well would require 1 ml of TRI-mix.
4. Lyse the cells directly in the culture dish by pipetting up and down several times.If the sample is not solubilizing and is still very viscous, increase the solubilizationby pipetting the sample repeatedly up and down. After 5 min of incubation at roomtemperature, proceed to the next step.
If not ready to proceed immediately with the rest of the protocol, the homogenized samplemay be stored at room temperature for several hours or at –70◦C for 1 month or longer.
5. Add 0.2 ml of chloroform per ml of TRI-mix used.
Scale the volumes up or down where appropriate (for example, if only 200 μl of TRI-mixwas used, then only add 40 μl of chloroform at this step).
6. Vigorously mix by hand for 15 sec.
7. Incubate for 3 min at room temperature.
8. Centrifuge for 15 min at 12,000 × g, 4◦C.
The chloroform causes the solution to separate into two phases, and, after centrifugation,the organic (yellow) phase is at the bottom of the tube and the aqueous (clear) phase,which contains the extracted RNA, is at the top. There will also be a visible white interfacethat contains DNA and some denatured proteins.
9. Move the upper aqueous layer to a fresh microcentrifuge tube.
The aqueous phase should be ∼600 μl. When the aqueous phase is transferred to a freshtube, it is important to avoid disturbing this interphase or pipetting any of this material.To be absolutely certain of avoiding contamination of the aqueous phase with interphase,leave a small amount of aqueous phase behind when pipetting.
10. Add 1 μl of glycogen to each sample.
The glycogen acts as a carrier of the RNA, promoting efficient precipitation, preventingsmall amounts of RNA from sticking to the side of the tube and aiding in detection of theRNA pellet.
Precipitate the RNA11. Precipitate the RNA by adding 2 volumes of isopropanol. Mix well by inversion.
12. Incubate for 10 min at room temperature.
13. Centrifuge for 10 min at 12,000 × g, 4◦C.
14. Remove the supernatant, leaving a white glycogen pellet.
15. Resuspend the precipitated pellet in 80 μl 75% ethanol to wash.
16. Briefly vortex.
17. Centrifuge 5 min at 12,000 × g, 4◦C.
18. Remove the ethanol supernatant.
19. Repeat wash steps 15 to 18.

RNA-BasedMethods in CellBiology
27.4.29
Current Protocols in Cell Biology Supplement 55
20. Air dry the RNA pellets for no longer that 5 to 10 min.
Note that over-dried pellets will be difficult to resuspend.
21. Dissolve the RNA pellet in 45 μl of RNase-free water or in RNase-free Tris-EDTAbuffer heated briefly to 55◦ to 65◦C in a heat block to aid solubilization if desired.
Note that remnants of non-inactivated DEPC may inhibit RT reactions.
Remove DNA contaminationThe RNA samples are treated with RNase-free DNase I. This DNase treatment is espe-cially critical if the primers for the qPCR step cannot be designed to fall across exon-exonboundaries or in separate exons.
22. Add 5 μl of 10 × TURBO DNase Buffer to 45 μl of RNA solution from step 21 andmix by pipetting.
23. Add 1 μl TURBO DNase (kept on ice), then gently mix the solution.
24. Incubate for 30 min at 37◦C.
25. Add 5 μl DNase inactivation reagent, then mix well by flicking the tube.
26. Incubate for 5 min at room temperature, flicking the tube two to three times toredistribute the inactivation reagent.
27. Centrifuge 10 min at 10,000 × g, room temperature.
28. Transfer the supernatant to a fresh sterile microcentrifuge tube, being very carefulnot to disturb the DNase I inactivation reagent pellet.
The pellet can sequester divalent cations and change buffer conditions, which would bedetrimental to downstream applications such as RT-qPCR.
29. Proceed to spectrophotometric quantification of RNA (Support Protocol 3).
BASICPROTOCOL 5
Synthesis of Mammalian cDNA Using Total Cellular RNA
This protocol uses 1 μg of total RNA in the production of single-stranded complementarycopy DNA (cDNA) through reverse transcription (RT). RT coupled to PCR (RT-PCR)is commonly used to detect and quantitate levels of mRNA, pre-mRNAs, or other typesof RNA. The method involves using a primer annealed to the RNA of interest. Theprimer is usually a synthetic oligo(dT)15-18, random hexamer (dN)6, or a synthetic DNAoligonucleotide that is complementary to a specific transcript (a gene-specific primer).The primer:RNA hybrid serves as a template during RT, which generates the first strand,a single-stranded cDNA copy of a portion of the target RNA molecule. Using randomhexamer priming, it is possible to obtain representative cDNA copies of sequences fromthe entire length of the mRNAs and pre-mRNAs in a population. This cDNA can be usedas a template for PCR.
Materials
1 μg of total RNA (Basic Protocol 4)RNase-free water: filtered or DEPC treated as described in APPENDIX 2A
150 ng/μl random hexamers (e.g., Applied Biosystems, cat. no. N8080127)Reagents for RT master mix (Table 27.4.5)
10 × AffinityScript RT buffer (Agilent Technologies)100 mM DTT10 mM each dNTPRNasin

Analysis ofNonsense-
Mediated mRNADecay
27.4.30
Supplement 55 Current Protocols in Cell Biology
AffinityScript Multiple Temperature Reverse Transcriptase (AgilentTechnologies)
Aerosol-barrier pipet tipsNuclease-free 1.5-ml microcentrifuge tubesThermomixer heat block (e.g., Eppendorf Thermomixer Compact)
1. Mix 1 μg total RNA, nuclease-free water, and 300 ng random hexamers (2 μlof 150 ng/ml random hexamers) to a final volume of 13.7 μl in a nuclease-freemicrocentifuge tube.
2. Incubate for 5 min at 65◦C.
This is a separate RNA denaturation step before cDNA synthesis and it is only requiredif the template RNA has a high degree of secondary structure. Such a denaturation step(5 min at 65◦C) should be performed before adding the RT buffer and reverse transcriptaseto the reaction mix.
3. Mix gently and incubate for 10 min at room temperature to cool down.
4. Add the components shown in Table 27.4.5, in the order shown, to each annealedprimer/template generated in steps 1 to 3.
5. Mix gently and incubate for 10 min at 25◦C for initial primer extension.
This step is important when using random hexamers or oligo(dT) primers because oth-erwise the primers may dissociate from the template when the samples are incubatedimmediately at >37◦C.
6. Incubate for 1 hr in a 50◦C heat block, for cDNA synthesis.
Incubation at 37◦C will work for most templates but it can be optimized between 37◦ and55◦C if necessary. Increasing the temperature can be helpful if the template has strongsecondary structures, and may also improve specificity if gene-specific primers are used.30 min incubation is sufficient in most cases. The cDNA synthesis incubation time can beextended up to 60 min if the target sequence is located near the 5′ end of a long transcriptand oligo (dT) priming is used, or if the target sequence is rare. However, extended timesat high temperatures induce RNA degradation.
7. Incubate for 15 min in a 70◦C heat block, for inactivation of the reverse transcriptaseat the end of the reaction to prevent it from interfering with subsequent qPCRreactions.
8. Dilute the freshly synthesized cDNA to 8 ng/μl by adding 105 μl of RNase-freewater. Place the cDNA on ice for subsequent use or store it at – 20◦C for later use.
Table 27.4.5 Components and Amounts for the RT Reactiona
Components Amount per reaction Volume per reaction
AffinityScript buffer (10×) 1× 2.0 μl
DTT (100 mM) 10 mM 2.0 μl
dNTPs (10 mM each) 0.4 mM each 0.8 μl
RNasin 40 U 0.5 μl
AffinityScript Multi-Temp ReverseTranscriptase
50 U 1.0 μl
Total/reaction 6.3 μlaDue to the small volumes that are required for each component, it is highly recommended to make amaster mix of the above components tailored to the number of RNA samples that need to be reversetranscribed. This will minimize variations between the samples due to pipetting errors.

RNA-BasedMethods in CellBiology
27.4.31
Current Protocols in Cell Biology Supplement 55
BASICPROTOCOL 6
Quantitative PCR
All real-time PCR instruments combine a thermal cycler to drive the DNA amplification,an optical system to excite fluorophores and capture emitted fluorescence from thedetection chemistry, and specialized software to collect and analyze the quantitative datagenerated. The instrument described in this protocol (Corbett RotorGene 6200 system)uses a rotary format where reaction vessels are heated and cooled with air. It can bepurchased along with a robot that accurately pipets the PCR master mix and the samplesinto the polypropylene V-well tubes. Having a robot will standardize the PCR reactionsetup and reduce pipetting errors. After pipetting, the wells have to be efficiently sealed,to prevent evaporative losses which can in turn lead to variable results.
Materials
8 ng/μl cDNA samples from Basic Protocol 5TaqMan or SYBR Green assay components (see Strategic Planning and
Table 27.4.6):SYBR Green Assay: forward and reverse primers and 2× KAPA SYBR FAST
Universal qPCR Master Mix (KAPA Biosystems;http://www.kapabiosystems.com)
TaqMan Assay: forward and reverse primers, TaqMan Probe and 2× Brillant IIFast chemistry qPCR master mix (Agilent Technologies)
DNase-free and RNase-free highly pure deionized water
Aerosol-barrier pipet tipsReal-time PCR machine, accessory machines, and analysis software (we use the
Corbett RotorGene 6200 system, robot, and heat sealer;http://corbettlifescience.com/)
1. Turn on the real-time PCR instrument and sealing equipment (if necessary) to warmit up.
2. Mix the PCR components as shown in Table 27.4.6 for either a TaqMan or a SYBRGreen assay in to the appropriate vessels for the specific qPCR-instrument in use.
Table 27.4.6 The Required Components and Volumes for Both TaqMan and SYBR Green Assaysa
TaqMan assay Volume perreaction
SYBR Green assay Volume perreaction
qPCR standard water 3.75 μl qPCR standard water 6.20 μl
2× Brillant II Fast chemistry qPCR mastermix (Agilent Technologies)
7.50 μl 2× KAPA SYBR FAST UniversalqPCR Master Mix (KAPABiosystems)
10.00 μl
20× TaqMan probe/primer mix (made bymixing 16 μM forward primer, 16 μMreverse primer, and 4 μM TaqMan probe.
0.75 μl forward primer 10 μM reverseprimer 10 μM
0.40 μl 0.40 μl
8 ng/μl cDNA sample 3.00 μl 8 ng/μl cDNA sample 3.00 μl
Total 15.00 μl 20.00 μlaImportantly, these PCR master mixes contain nucleoside triphosphates, dye, buffer, magnesium, and a DNA polymerase. Importantly, the DNApolymerase must be heat-stable, robust, and efficient, and in the case of TaqMan assays, it must also contain 5′-3′ exonuclease activity. Such mastermixes are recommended for qPCR assays, as they are optimized and consistent in composition. Avoid multiple freeze-thaw cycles with these mastermixes. The 2× master mixes, primers, and probes and water volumes should be assembled as a master mix tailored to the number of reactions thatare to be carried out in total; this reduces inaccuracies due to pipetting very small volumes. Quantitative PCR standard water means highly puredeionized water that is nuclease-free.

Analysis ofNonsense-
Mediated mRNADecay
27.4.32
Supplement 55 Current Protocols in Cell Biology
Table 27.4.7 Cycling Parameters for Both TaqMan and SYBR Green Assaysa
Step of TaqMan assay Temp. Time CyclesSteps of SYBRGreen assay
Temp. Time Cycles
Initial denaturation 95◦C 120 sec 1× Initial denaturation 95◦C 120 sec 1×Denaturation 95◦C 5 sec 40× Denaturation 95◦C 5 sec 40×Primer annealing andelongation
60◦C 20 sec Primer annealingand elongation
60◦C 20 sec
Dissociation 60◦C to99◦C 1◦C/cycle
90◦C premeltconditioning step.Then 5 sec /cycle
aAn initial denaturation step is needed to ensure efficient reactivation of some hot-start DNA polymerases and complete denaturation of the template.Denaturation at 95◦C is used in most commercial kits. The temperature and incubation time can be changed according to the requirements of theamplicon and reaction buffer. For most amplicons, a combined annealing and extension step at 60◦C works well if the primers have been designedto anneal efficiently at 60◦C. If the Tm of the primers is low, it is often better to use separate annealing and extension steps. 35 to 45 cycles ofamplification are sufficient for most applications even when the template is present at a very low copy number. More than 45 cycles tends toincrease the amount of nonspecific products. The melting curve step is carried out to monitor the specificity of the amplified PCR product whenusing DNA-binding dyes such as SYBR Green as the detection chemistry. An additional extension step can be performed before the melting curvestep to ensure that all amplification products are in dsDNA form. Specific products can be distinguished from the nonspecific products by thedifference in their Tm’s (see text for further details).
Keep the qPCR master mixes at −20◦C until needed, and then thaw the master mixes andstore on ice. Following this initial thawing of the master mixes, the unused portion can bestored at 4◦C for up to 3 months or returned to −20◦C for longer-term storage. Protectthe SYBR Green master mix and TaqMan probes from light.
3. After the reactions are assembled, seal the vessels.
4. Program the real-time PCR instrument for the cycling parameters shown inTable 27.4.7 for either a TaqMan or a SYBR Green assay.
5. Perform PCR amplification under optimized conditions.
The fluorescence of the samples in most chemistries is collected after each extension stepto monitor the progress of the reaction.
6. Acquire the data and calculate the relative mRNA levels. If a SYBR Green assay hasbeen performed, analyze the data by first inspecting the melting curve and makingsure that the products formed in each sample have a uniform melting transition atthe expected temperature for the amplicon. For evaluation of a qPCR run, set thethreshold manually in a region where the amplification rate of the cDNAs is the samein all samples. Measure the mRNA levels by calculating the relative change of thetarget sequence compared to a reference sequence, using the following formula:
x = E(b – a)
where, x = expression level of the RNA of interest relative to a reference sample;E = amplification efficiency (see below); a = Ct of RNA of interest in the sample ofinterest; and
b = Ct of RNA of interest in the reference sample.
Finally, divide the relative mRNA levels of the gene of interest by the relative mRNAlevels of the co-transfected or endogenous normalizer gene to generate the relativenormalized mRNA levels, which can be compared to each other.
For accurate measurements, it is important to determine the amplification efficiencyexperimentally. Theoretically, the amount of DNA is doubled with every PCR cycle,

RNA-BasedMethods in CellBiology
27.4.33
Current Protocols in Cell Biology Supplement 55
meaning the efficiency (E) is equal to 1. However, in practice, such an ideal efficiencyis rarely reached due to suboptimal PCR conditions. To determine the effective E fora specific primer/probe set, a serial dilution should be made with cDNA to generate astandard curve, in which the Ct values (y axis) are plotted against the log of the cDNAconcentration (x axis). E can be derived from the slope of this standard curve using thefollowing formulas (Rasmussen et al., 2001):
Exponential amplification = [10(-1/slope)].
Efficiency = [10(-1/slope)]-1.
BASICPROTOCOL 7
THE USE OF TETHERED FUNCTION ASSAYS TO STUDY NMD
This approach is flexible and overcomes numerous obstacles in the study of mRNA-binding proteins, which is why such assays have been used to show the role of proteinsin control of mRNA transport, translation, localization, stability (Coller and Wickens,2002, 2007; Keryer-Bibens et al., 2008), and, of particular importance here, in NMD (seeTable 27.4.8). The Tethered Function Assay (also see Background Information) is souseful for examining the process of NMD because mRNA regulatory events generallyoccur through multi-protein complexes formed via protein-protein and protein-RNAinteractions. In such cases, RNA binding may occur via one critical protein, which tethersthe activity of another protein to the mRNA. Thus, the active protein may not directlycontact the RNA. An advantage of the tethered approach is its ability to examine theactivity independently of RNA binding. In many cases, putative RNA-binding proteinshave been identified, but their respective RNA targets are unknown. Moreover, this assayis useful in NMD because many of the NMD proteins are essential for cell viability,and traditional genetic techniques are complicated by pleiotropic effects. The TetheredFunction Assay allows the function of the protein to be examined on just one mRNAspecies in an otherwise wild-type cell.
NOTE: Essential details to this protocol are included in the Commentary (see sectionsentitled “Basic Protocol 7: Using the Tethered Function Assay to Investigate NMD” inBackground Information, Critical Parameters and Troubleshooting, Anticipated Results,and Time Considerations) and must be read in conjunction with this protocol beforeproceeding with any experiment.
Methodology
This basic protocol is a set of guidelines to aid in the establishment of the TetheredFunction Assay. Each necessary component of the assay is methodically considered andexplained below so that the assay can be established and optimized based on the ultimateaims of the investigator. The guidelines closely follow Figure 27.4.6A, where the methodto establish a Tethered Function Assay has been summarized and is accompanied byan elaborate example in Figure 27.4.6B. This assay utilizes the skills that have beenoutlined in Basic Protocols 1, 2, 4, 5, and 6 of this unit. Please refer to these protocolswhen necessary.
Decide on the Tethering System You Would Like to Use for Studying NMD in YourLaboratory
In Tethered Function Assays, the polypeptide of interest is tethered to a reporter mRNAvia a heterologous RNA-protein interaction, and, so far, four main tethering systems havebeen used with success by a number of laboratories. Table 27.4.9 summarizes the salientfeatures of each tethering system; for a more detailed exploration of each system refer toColler and Wickens (2007). The two most common systems involve tethering proteins ofbacteriophage origin: the coat protein from the MS2/R17 bacteriophage (Bardwell andWickens, 1990; Coller et al., 1998; Graveley and Maniatis, 1998) and the 1–22 peptide

27.4.34
Supplement 55 Current Protocols in Cell Biology
Table 27.4.8 Using the Tethered Function Assay to examine NMD: Details and Simplified Results of Most of the TetheredFunction Assays that Have Been Used to Study Aspects of NMD Reported to Date
Proteins tethered Reporters Effects Ref.
MS2 tagged hUPF1,hUPF2, hUPF3a, andhUPF3b
β-globin transcript wild-type lacking MS2coat binding sites (bs) in the 3′UTRβ-globin transcript with a PTC at position 39,lacking MS2 coat bs in the 3′UTRβ-globin transcript wild-type with either 2, 4,6, or 8 MS2 coat bs in the 3′UTRβ-globin transcript wild-type where thetermination codon UAA has been mutated to aUAC codon, with 6 MS2 coat bs in the 3′UTRβ-globin transcript wild-type lacking MS2coat bs but instead has a 645 nt fragment ofthe GAPDH ORF inserted into the 3′UTR
Tethered UPFs transforma normal message in to amessage subject to NMD
Lykke-Andersenet al. (2000)
MS2 tagged Y14,RNPS1, DEK, REF-2-1,SRm160
Same reporters were used as detailed above inLykke-Andersen et al. (2000)
Tethered RNPS1 and to alesser extent Y14stimulate NMD on anormal message
Lykke-Andersenet al. (2001)
λN-tagged hUPF3b andY14
β-globin transcript wild-type lacking BoxBbinding sites (bs) in the 3′UTRβ-globin transcript with a PTC at position 39,lacking BoxB bs in the 3′UTRβ-globin transcripts wild-type with either 2, 3or 5 BoxB bs in the 3′UTRβ-globin transcripts wild-type where thenatural termination codon UAA has beenmutated to a CAA codon and UAA stopcodons have been created at locations furtherdownstream in the 3′UTR within the 5 BoxBbsβ-globin transcripts wild-type containingeither a functional or non-functional IRE inthe 5′UTR, with 5 BoxB bs in the 3′UTRβ-globin transcript wild-type which hasextended second and third exons, lackingBoxB binding sites (bs) in the 3′UTR
Characterization ofY14/hUPF3b interactionand demonstration that itis essential for NMDwhile the UPF2/UPF3interaction is not
Gehring, et al.(2003)
λN-tagged Y14 andMagoh
Same reporters were used as detailed above inGehring et al., 2003
Y14/Magoh interaction isessential for NMD
Fribourg et al.(2003)
MS2 tagged UPF1-3,Y14, RNPS1, DEK,REF-2-1, SRm160
Renilla luciferase transcript wild-type with 5′
end situated 6 MS2 coat bs immediatelypreceeding the Renilla luciferase ORF andjust after the start codonβ-globin transcript wild-type with 6MS2 coatbs in the 3′UTR
Y14, Magoh, RNPS1 andUPF1-3 stimulatetranslation when tetheredto the 5′ end of the ORF
Nott et al. (2004)
λN-tagged Y14, SMG5,SMG6 and SMG7 andmutations thereof
β-globin transcripts wild-type where thenatural termination codon UAA has beenmutated to a CAA codon and UAA stopcodons have been created at locations furtherdownstream either in the within the 5 BoxBbs or at the end of the 5 BoxB bs in the 3′UTRGFP transcript wild-type with 5 BoxB bs inthe 3′UTR
SMG7 elicits mRNAdecay when tethered to areporter transcript. Thiseffect does not requireSMG6 but does needDCP2 and XRN1
Unterholzner andIzaurralde (2004)
continued

27.4.35
Current Protocols in Cell Biology Supplement 55
Table 27.4.8 Using the Tethered Function Assay to examine NMD: Details and Simplified Results of Most of the TetheredFunction Assays that Have Been Used to Study Aspects of NMD Reported to Date, continued
Proteins tethered Reporters Effects Ref.
GFP transcript wild-type with 5′ end situtated5 BoxB bs (containing stop codons) justpreceeding the GFP ORF
MS2 tagged UPF1,UPF2, UPF3
Firefly luciferase transcript wild-type lackingMS2 coat binding sites (bs) in the 3′UTRFirefly luciferase transcript wild-type with 8MS2 coat binding sites (bs) in the 3′UTR
RNAi of CBP80abrogates the reduction inreporter mRNA that isinduced by tetheringUPF2 and UPF3 but itdoes not alter the effectby tethering UPF1, while4E-BP1 inhibits the effectof tethering UPF1 but notUPF2 and UPF3
Hosoda et al.(2005)
MS2 tagged PABPC1 β-globin transcript wild-type lacking MS2coat binding sites (bs) in the 3′UTRβ-globin transcripts with a PTC at position39, with one MS2 coat bs located either 15codons or 44 codons downstream from thePTC
Tethering PABPC1 to 15codons downstream of aPTC repressed NMD buttethering PABPC1 at 44codons downstream of thePTC had no such effect.
Silva et al.(2008)
MS2 tagged PABPC1 Mini μ transcripts with a PTC at position 310,with 6 MS2 coat bs located either 50 ntdownstream of the PTC much furtherdownstream from the PTCTCR-β transcripts with a PTC at position 68,with 6 MS2 coat bs located either 50 ntdownstream of the PTC or much furtherdownstream from the PTC (see Fig. 27.4.6)
Tethering of PABPC1 50nts downstream of thePTC repressed NMDwhile tethering PABPC1further downstream hadno such effect (see Fig.27.4.6).
Eberle et al.(2008)
MS2 tagged PABPC1 andλN-tagged Y14, RNPS1and Magoh
β-globin transcript wild-type with 4 BoxB bsand 4MS2 coat bs respectively in the 3′UTRβ-globin transcript wild-type with 4MS2 coatbs and 4 BoxB bs respectively in the 3′UTR
Demonstrated thatPABPC1 can overcomethe effect of tetheredY14, RNPS1 or Magohwhen positioned closer tothe termination codon
Ivanov et al.(2008)
MS2 tagged PNRC2 This study used β-globin reporter genes fromLykke-Andersen et al. (2000)
Tethering PNRC2 to themRNA 3′UTR elicitsmRNA decay
Cho et al. (2009)
λN-tagged eIF4AIII,Upf1, Y14 and Ago2
Constructs composed of Renilla luciferasecDNA, no stop codon and β-globin wild-typewith 5 BoxB bs in the 3′UTRConstructs composed of Renilla luciferasecDNA, no stop codon and β-globincontaining a PTC at position 39, with 5 BoxBbs in the 3′UTR
Tethering of Ago2inhibited CT efficientlyand thus NMD
Choe et al.(2010)
λN-tagged Ago2,Ago2F2V2
This study used the same reporter constructsas detailed in Choe et al., 2010 in addition toa further control reporterRenilla luciferase cDNA with a stop codon,lacking any BoxB bs in the 3′UTR
Tethering of Ago2inhibited CT efficientlyand thus NMD Thiseffect requires thecap-associating activityof Ago2
Choe et al.(2011)

Analysis ofNonsense-
Mediated mRNADecay
27.4.36
Supplement 55 Current Protocols in Cell Biology
The Assay
Harvest cells and extract total cellular RNA (Basic Protocol 4)
Analyze reporter RNA levels (Basic Protocols 5 and 6)
a normalizer gene. Further considerations
Creating the Tether
Important Controls
Designing the Reporter
ADecide on a system, see box 2.1
FTC or regulartory elements
otocol 2 to perform the tethered function
to the tethered protein, see Basic Protocol 1 and Table 1
Figure 27.4.6 (continued) Establishing a Tethered Function Assay system to study NMD. (A) Flow diagram forthe steps that need to be taken and the deliberations that need to be made when setting up a Tethered FunctionAssay to examine NMD from cloning the reporter and plasmids to performing the actual assay and interpretingthe results. (B) Flow diagram exemplifying the steps taken to perform a tethering assay to examine the role ofPABPC1 in NMD (taken from Eberle et al., 2008) to mirror the flow diagram described in (A) and is explained inthe text.
of lambda N protein (λN) (De Gregorio et al., 1999). These tethering systems are mostpopular because the tether in each case is small, thus minimizing potential interferencesto the test protein, and also because they bind to their target RNA stem-loops with highspecificity and selectivity. The U1A protein and iron responsive protein (IRP) have alsobeen used successfully as tethers (De Gregorio et al., 1999; Finoux and Seraphin, 2006),but both of these proteins are relatively large—38 kDa for U1A and 97 kDa for IRP—sothey have not been as commonly used in Tethered Function Assays.

RNA-BasedMethods in CellBiology
27.4.37
Current Protocols in Cell Biology Supplement 55
BExample: Using the MS2 tethered function assay to examine if PABPC1 inhibits NMD in mammalian cells
Designing the Reporter Creating the Tether Controls
Rel
ativ
e m
iniμ
mR
NA
Seed 2 105 HeLa cells in 6-well plates. Next day, co-transfect the cells with 300 ng MS2 fusion protein-encoding plasmid, 100 ng of reporter plasmid and 100 ng of pCMVrGPx1-TGC for normalization. Harvest the cells 48 hr after transfaction. Isolate total cellular RNA using TRI- mix, ensuring the samples are Dnase I treated (Basic Protocol 4) Reverse transcribe 1 μg mRNA levels by RT-PCR (Basic Protocol 5) Measure relative reporter mRNA levels by RT-PCR using 24 ng of cDNA/measurement (Basic Protocol 6) Repeat the experiment at least twice for biological reproducibility
The Assay
Figure 27.4.6 (legend appears on previous page)
The MS2 system, unlike the others, allows a high quantity of tethered proteins to bepresent on the mRNA because the MS2 coat interacts with its target sequence as anobligate dimer (Valegard et al., 1994). Thus, for every stem-loop present in the mRNAreporter, two tethered proteins can bind. Also, MS2 binds cooperatively to two stem-loops, further increasing the occupancy of sites (Witherell et al., 1990). In certain cases,this might be favorable because the more protein that is bound, the better; both of thesefeatures contribute to a strong signal in the functional assay, and this can be achievedwithout greatly increasing the overall length of the mRNA reporter, an undesired situationin some applications. On the other hand, the MS2 coat protein is not the simplest selectionwhen it is obligatory to carefully control the number of tethered protein molecules bound.
Therefore, some laboratories have elected to use the λN-peptide rather than MS2 coatprotein, because the tether is smaller and binds 1:1 to its RNA target. However, despitethis bias, it should be noted that tethering via the λN peptide or the MS2 coat proteinappeared to produce similar results. Indeed, functional studies of the factors requiredfor NMD have used both systems (Lykke-Andersen et al., 2000, 2001; Gehring et al.,2003, 2005; Kunz et al., 2006), and, as nonconflicting results were attained, these studiesalso show that the functionality of the complex formed around the tethered protein isindependent of the tethering protein. It is clear that each of the tethering systems hascertain advantages in particular situations. Therefore, in designing experiments using thetethering assay, it is highly recommended that these characteristics be fully taken intoaccount within the constraints of the structural requirements for the protein to be fusedwith the tethering moiety.

Analysis ofNonsense-
Mediated mRNADecay
27.4.38
Supplement 55 Current Protocols in Cell Biology
Table 27.4.9 Summary of the Important Features of Four Different Tethering Systems
System Tether Size of tetherRNAbinding site
Interactionspecificity
Interaction characteristics
Bacteriophage MS2coat protein binds toMS2 binding sites
MS2bacteriophagecoat protein
14 kDa 21 nt RNAstem-loop
Kd = 1 nM MS2 coat interacts as a dimer andbinds cooperatively to twostem-loops. Certain mutations in thestem-loop can increase or decreasethe interaction affinity. U-C alterationincreases affinity by over 50 fold.Only the loop nt’s are important forthe interaction.
λN-peptide binds tostem-loops calledBoxB
BacteriophageλN peptide
22 aminoacids
19 nt RNAstem-loop
Kd = 1.3 nM λN peptide binds 1:1 with its target.nt in both the stem and loop areimportant for the interaction.
U1A protein bindsto stem loop II
U1A protein 38 kDa 30 nt RNAstem-loop
Kd = 5 nM U1A binds 1:1 with its target
IRP binding proteinbinds to tem loopscalled iron responseelements
IRP 97 kDa 30 nt RNAstem-loop
Kd = 90 pM IRP binds 1:1 with its target. Can becomplicated by the fact that thisbinding site will exist in the 5′UTRand 3′UTR of various physiologicalmRNA in eukaryotic cells.
aThe description of each system, the name of the tether, the size of the tether, the number of nt required for each binding site in the reporter mRNA, andthe interaction specificity of tether and its binding site are detailed in the table. Some important features of the interaction characteristics of the tetherand its binding site are also described for each system.
Choosing the Reporter mRNA to Use in Your Assays
The Tethered Function Assay can be adapted to measure the effect of a tethered proteinin many steps of mRNA metabolism and function. The adaptability comes mainly fromthe choice of reporter mRNA and the final assay performed. The choice of reportermRNA obviously is dictated by the effect to be assayed. With regard to examining NMD,prevalent choices have included nonmammalian genes such as Renilla luciferase, fireflyluciferase, and green fluorescent protein (GFP). The former two are popular becausethe mRNA level can be indirectly examined by measuring the luciferase activity in aluminometer. Genes that are found in eukaryotes such as β-globin and TCR-β have alsobeen employed, whereby the labs have adapted genes that had previously been used tostudy NMD. To this end, several studies have also looked at PTC+ mRNAs, as in theexample in Figure 27.4.6. The inherent behavior of the reporter mRNA is an importantconsideration. To determine whether a tethered protein stabilizes an mRNA, the mRNAmust be unstable in the absence of the protein; conversely, to determine whether a tetheredprotein destabilizes the mRNA, the mRNA reporter must be stable without the protein.Therefore, it is helpful to select as a reporter mRNA where the cis-acting sequences arewell characterized.
The Location of Tethered Binding Sites
Next, it must be decided where the tethered sites should be located within the codingregion or in the UTRs. From Table 27.4.8, it can be seen that the tethering binding siteshave been placed in various different regions, mostly to suit the study and the specificquestions the study is trying to answer. For instance, in two studies, the tethering bindingsites were placed very close to the PTC and, as a comparison, further downstream fromthe PTC because the researchers wanted to examine if the physical distance between thetermination codon and PABPC1 is a crucial determinant for PTC recognition in humancells (see Fig. 27.4.6) (Eberle et al., 2008; Silva et al., 2008). However, in most cases,

RNA-BasedMethods in CellBiology
27.4.39
Current Protocols in Cell Biology Supplement 55
the tethering site(s) have been placed within the 3′ UTR of the reporter mRNA. Often,this has been the region of the endogenous target mRNAs to which the studied proteinbound. In addition, it is known that the exact location of several 3′ UTR regulators is notcritical for their function, implying that precise spatial positioning is not critical. Also,the 3′ UTR has fewer constrictions than the 5′ UTR, whereby tethering a protein near tothe 5′ end of the mRNA can inhibit translation independently of its normal function(s)(Stripecke et al., 1994; Grskovic et al., 2003). Finally, it is worth examining the sequenceinto which the tethering binding sites are embedded. This may be of importance, andsome of the variability as to the number of sites required could be due to the presence ofinessential sequences. For example, Witherell et al. (1990) showed that binding of MS2coat protein can be prevented by occlusion of the binding site(s) by alternative structures(Witherell et al., 1990).
The Number of Tethered Binding Sites
Another feature to take into account when designing a reporter is the number of tetheredbinding sites to include. In several cases, using the MS2 bacteriophage coat as thetether, two stem-loops have been adequate to observe an effect (Coller et al., 1998; Grayet al., 2000; Ruiz-Echevarria and Peltz, 2000; Minshall et al., 2001) and only one BoxBsequence was enough in the initial study with the BoxB system (De Gregorio et al.,1999).However, in the early use of each of these tethering systems to study NMD, morebinding sites were used, and this was systematically worked out. Accordingly, Lykke-Andersen et al. (2001) used 2, 4, 6, and 8 MS2 sites inserted into the 3′ UTR of theβ-globin gene, and Gehring et al. (2003) used 2, 3, or 5 BoxB elements within thesame reporter (see Table 27.4.8 and references therein). In the absence of tethered NMDfactors, no effect of the number of binding sites on the steady-state level of the reportermRNA was noted in either of these studies. Since these original studies, 6 to 8 MS2binding sites and 5 BoxB binding sites have been used on average in NMD studies withthese systems.
Considering the Tether to Use in Your Assays
In choosing which protein to use as the tether, it is essential to consider affinity andspecificity for the RNA tag, subcellular localization, and impact of the tether on theactivity of the test protein.
Mutagenesis of tethered proteinsSince the effects of a tethered protein are examined on a single reporter mRNA, theeffects of many manipulations of the protein sequence can be examined readily andconclusively. This can reveal novel molecular properties in the protein. In most of thestudies detailed in Table 27.4.8, NMD factors with specific mutations have been tetheredto gain information about the function of the NMD protein. See Table 27.4.1 for acomprehensive list of a multitude of known mutations made in NMD factors.
N-terminal or C-terminal fusionsThe two independent studies examining the role of poly(A)-binding protein C1 (PABPC1)on NMD actually had the MS2 tethering moiety at opposite ends of the PABPC1: in theSilva et al. (2008) report, it was at the N terminus of PABPC1, whereas the oppositewas true for Eberle and colleagues (see Table 27.4.8, Fig. 27.4.6 and references therein).The same conclusions were drawn from the two studies despite this difference. However,the relative positions of the tethering protein and the protein of interest is not alwaysso straightforward. It can be observed that tethering the MS2 coat protein to the oneterminus can result in much more activity and/or better expression than if the tether werelocated at the opposite terminus. It is unclear why this is the case for some proteins, andit has to be determined on a case-by-case basis by testing both orientations.

Analysis ofNonsense-
Mediated mRNADecay
27.4.40
Supplement 55 Current Protocols in Cell Biology
Trans effectsAnother key issue to consider is that the fusion protein may have trans-acting effects.Often, the Tethered Function Assay is performed in a wild-type background with theendogenous copy of the test protein present. It is possible that the presence of thetethering moiety may produce a dominant negative allele that hampers the function ofthe normal protein in vivo. Such an event would seriously confound the results fromthe assay. Therefore, controls to ensure that any observed effects occur only in cis withrespect to the mRNA reporter are vital.
Designing all the necessary controls for your assaySeveral controls are critical in Tethered Function Assays, and should always be per-formed. Starting with controls concerning the reporter mRNA, it is important to comparethe stability of the reporter with the binding sites to the same reporter lacking the bindingsites to certify that the tethered binding site does not affect the mRNA on its own. An-other control concerning the reporter mRNA is to make specific mutations in the RNAstem-loop which affect the tether-stem-loop interaction. This is a particularly well knowncontrol for the MS2 system, and examines the specificity of the system, i.e., whether thechanges in reporter RNA levels are really due to the test protein being tethered to thereporter. In a similar theme, several controls can be carried out concerning the tether thatalso control for any effects being specific to the fact that the test protein was tetheredto the RNA. The tethering moiety alone should be tethered (MS2 alone in the examplein Fig. 27.4.6), the tethering moiety fused to an unrelated but similarly sized proteinshould be tethered (in the example in Fig. 27.4.6, LacZ-MS2 was used as a control, andit was truncated to be of a similar size to the test protein, PABPC1), and the test proteinwithout the tethering moiety should also be tethered (just PABPC1 alone in Fig. 27.4.6).All of these outlined controls will test that the tethering moiety alone does not have anyinfluence, that any observed effects occur only when the protein is bound to the mRNA,and for possible trans-acting effects. Finally, experiment-specific controls can also beincluded. For instance, in the example in Figure 27.4.6, PABPN1 was also tethered, andthis served as a control for this specific experiment because it is generally thought thatonly the cytoplasmic PABP has an influence on cytoplasmic translation events and thatthe nuclear PABP does not.
Adapting your assay: Identifying mRNA localization functions and visualizingtagged mRNAs in vivoSeveral adaptations of the Tethered Function Assay have been developed to tag an mRNAfor analysis in living cells, and this technique has also recently been used to study NMD.Although this is not a Tethered Function Assay per se because the protein that is fusedto the tethering moiety is just a tag, it is still the same fundamental system. The initialuse of such a method followed the localization of ASH1 (absent, small, and homeoticdiscs 1) mRNA to the bud tip in S. cerevisiae (Bertrand et al., 1998). This was achievedby tethering GFP fused in-frame to the MS2 coat protein to a recombinant ASH1 mRNAcontaining six MS2 binding sites in the 3′ UTR. The localization of this RNA wasthen monitored in real time in living cells by time-lapse fluorescence microscopy. Thisapproach is widely used and has been well reviewed (Beach et al., 1999; Singer et al.,2005) and further developed (Larson et al., 2011). It has also very recently been used tostudy NMD (de Turris et al., 2011). In this study, an in vivo approach to measure synthesisand release kinetics at the transcription sites of PTC- and PTC+ Ig mini μ reporter genesstably integrated into the genome of U2OS cells was developed to monitor PTC-specificdifferences. These Ig mini μ reporter genes contained 24 MS2 binding sites in the 3′UTR (see Fig. 27.4.10), which allowed for the visualization of transcription sites in vivoupon binding of these stem-loops by the MS2 coat protein fused to a yellow fluorescentprotein (YFP). Using this method revealed that PTC+transcripts are specifically retainedat the transcription site.

RNA-BasedMethods in CellBiology
27.4.41
Current Protocols in Cell Biology Supplement 55
SUPPORTPROTOCOL 1
ANNEALING THE OLIGONUCLEOTIDES
This is a support protocol that elaborates on step 3 of the Strategic Planning guideline,accompanying Basic Protocol 2, entitled “Creating pSUPER vector system for expressionof short interfering RNA to knock down NMD genes” (see Strategic Planning at beginningof unit). In that specific step, the forward and reverse strands of the oligonucleotides thatcontain the siRNA-expressing sequence targeting your gene of interest (designed basedon steps 1 and 2 of the Strategic Planning guideline mentioned above) are annealed sothat they can be effectively ligated into the BglII and HindIII sites of the pSUPER vectorat later steps in the strategic planning procedure.
Materials
Forward and reverse oligonucleotidesAnnealing solution (see recipe)Thermomixer heat block (e.g., Eppendorf Thermomixer Compact)
1. Mix the following components in a sterile microcentrifuge tube:
1 μl of 100 μM forward oligonucleotide1 μl of 100 μM reverse oligonucleotide48 μl annealing solution (100 mM sodium acetate, 20 mM Tris pH 7.5, 2 mM
EDTA)50 μl highly pure deionized water.
2. Incubate the mixture for 4 min at 95◦C using a Thermomixer.
3. Incubate for 10 min at 70◦C using a Thermomixer.
4. Slowly cool the annealed oligonucleotides to room temperature before using themor moving them to 4◦C. For longer storage keep them at −20◦C.
SUPPORTPROTOCOL 2
HARVESTING CELLS FOR EVENTUAL PROTEIN ANALYSIS
This support protocol accompanies Basic Protocol 2 “pSUPuro-based RNAi to knockdown NMD factors.” As is the standard procedure, the extent of gene knockdown shouldbe tested on the mRNA and on the protein level. For the former, gene knockdownverification on the mRNA level can be monitored by RNA isolation followed by RT-qPCR (see Basic Protocols 4 to 6 and Fig. 27.4.7A), or by northern blotting. Usually,mRNA analyses are easier to perform, since a gene-specific probe for northern blottingor quantitative PCR can be designed from available sequence data. For the latter, geneknockdown confirmation on the protein level is a key measurement in RNAi experimentsand can be monitored by performing epitope tagging, reporter gene assays, or mostcommonly, western blotting (see below and Fig. 27.4.7B). However, these analysesrequire that the gene product is known and that a specific antibody for it is available (forthe majority of the known NMD factors, several antibodies are commercially available),that the protein has a biochemical activity that can be measured, or that the protein hasbeen tagged. Carrying on where Basic Protocol 2 leaves off, the support protocol belowexplains how to collect whole-cell extract samples (from the cells that been depleted ofan NMD factor by RNAi) for eventual verification of the gene knockdown by SDS-PGEfollowed by western blotting.

Analysis ofNonsense-
Mediated mRNADecay
27.4.42
Supplement 55 Current Protocols in Cell Biology
WCE
scr-shRNA
SMG6-shRNA
SMG6
Tyr-Tu b
1 2 3 4 5 6
– +– –
+– – – – –
––
BSMG6 mRNA
SMG6 kdControl0
20
40
60
80
100
A
Cha
nge
upon
kno
ckdo
wn
Figure 27.4.7 SMG6 knockdown levels monitored at RNA and protein level. (A) The histogram showsrelative SMG6 mRNA levels measured by RT-qPCR in Ig mini μ wild-type cells (light gray bars) and Igmini μ ter310 cells (dark gray bars) after knockdown of SMG6 or a control knockdown using a scrambledshRNA. All mRNA levels were normalized against 18S rRNA. Average values and standard deviations fromtwo independent experiments are displayed (Data from de Turris et al., 2011). (B) Western blot monitoringSMG6 protein levels in whole cell extract (WCE). The asterisks (*) mark the SMG6 specific band. ControlWCE (–) from Ig mini μ wild-type cells (equivalent cells) and three-fold serial dilutions of the untreatedcells were loaded in lanes 1 to 4. Treated Ig mini μ wild-type (lane 5 and 6) (+) or (–) plasmids expressingscrambled-shRNA (scr-shRNA) or SMG6-targeting shRNA (SMG6-shRNA). Tyrosine-Tubulin (Tyr-Tub) wasused as loading control.
Materials
Cells (any particular kind)Modified radio immunoprecipitation assay (RIPA) buffer (see recipe), ice cold2× SDS-PAGE sample buffer (APPENDIX 2A)
Refrigerated shakerRefrigerated centrifuge
Additional reagents and equipment for counting cells
1. Count the desired number of cells (50,000 to 200,000 cells).
2. Lyse the cells in ice-cold modified RIPA buffer using 1 μl of buffer per 2 × 10⁴ cells
3. Incubate for 30 min with slight shaking at 250 rpm at 4◦C.
4. Centrifuge the lysate for 15 min at 12,000 × g, 4◦C.
5. Mix the recovered supernatant with 1 volume of 2× SDS-PAGE sample buffer.
6. Store the samples at – 20◦C until they are required.
The results of an SMG6 knockdown experiment done according to this protocol usingpSUPuro SMG6 (Fig. 27.4.1C) is shown in Figure 27.4.7. To examine the SMG6 knock-down efficiency at the protein level, SDS-PAGE followed by western blotting with ananti-SMG6 antibody was carried out (Fig. 27.4.7B); for analysis of the SMG6 mRNAlevels, RT-qPCR was performed (Fig. 27.4.7A).
SUPPORTPROTOCOL 3
SPECTROPHOTOMETRIC QUANTIFICATION OF RNA
Successful completion of the procedures outlined in this unit demand the isolation ofhigh-quality total RNA. In this case, quantifying RNA using A260 spectrophotometryvalues can stand as a proxy for quality determination. Desired values will be A260/A280
= ∼1.9 to 2.1.

RNA-BasedMethods in CellBiology
27.4.43
Current Protocols in Cell Biology Supplement 55
Materials
RNA samples to be quantifiedSolution used to dissolve RNA pellets in Basic Protocol 4NanoDrop 2000 spectrophotometer (Thermo Fisher Scientific)
1. Switch the settings of the NanoDrop spectrophotometer to RNA, which will set theabsorbance to 280 nm (A280).
2. Use 2 μl of the solution that was used to dissolve the RNA pellet as a blank.
3. Use 2 μl of each RNA sample to assess the RNA quantity.
Record the readings at 260 nm, 270 nm, and 280 nm if possible. If the optical density at270 nm is greater than that at 260 nm, this indicates phenol contamination of the RNA (inthis case, re-precipitate the RNA to remove the phenol contamination). The ratio of themeasurements at 260 nm and 280 nm indicate the purity of each sample. Ratios of 1.9 to 2.1are very pure, whereas lower ratios indicate possible protein contamination. Although thisprocedure will measure the amount of RNA, it does not tell anything about the quality ofthe preparation, i.e., whether the RNA is intact or partially degraded. This is important fordownstream applications such as RT-qPCR, because a significantly degraded RNA samplewill not give accurate quantification of the target mRNAs. The presence of contaminatingproteins may inhibit the qPCR reaction overall, and contaminating DNA can lead tounwanted amplification products
REAGENTS AND SOLUTIONSUse deionized, distilled water in all recipes and protocol steps. For common stock solutions, seeAPPENDIX 2A; for suppliers, see SUPPLIERS APPENDIX.
Annealing solution
100 mM sodium acetate20 mM Tris·Cl, pH 7.5 (APPENDIX 2A)2 mM EDTAStore up to 2 years at room temperature
Antibiotic stocks
All stock solutions of antibiotics for bacterial work are made up in deionizeddistilled water and filter sterilized using Terumo syringes and MillexGP 0.22-μm filter membranes (Millipore). Stock solutions are aliquotted and stored up to6 months at −20◦C.
Normally ampicillin stocks are prepared at 100 mg/ml and kanamycin stocks are preparedat 100 mg/ml.
5-Bromo-4-chloro-3-indolyl-β-D-galactoside (Xgal) stock, 50 mg/ml
100 mg 5-bromo-4-chloro-3-indolyl-β-D-galactoside (Xgal)2 ml N,N′-dimethylformamideStore in aliquots in glass tubes covered with aluminum foil up to 6 to 12 months at
−20◦C
If the solution turns pink, then it should be discarded.
DMEM –/–
Measure out 950 ml deionized, distilled water using a 1-liter mixing container. Add12 g DMEM/F-12 plus glutamine powder (Invitrogen, cat. no. 32500-035; storeclosed at 4◦C) to the water at room temperature. Add 1.125 g NaHCO3 powder or15 ml of 7.5% sodium bicarbonate solution (Invitrogen, cat. no. 25080060). Dilute
continued

Analysis ofNonsense-
Mediated mRNADecay
27.4.44
Supplement 55 Current Protocols in Cell Biology
to 1 liter with water and stir until dissolved; do not over-mix. Adjust the pH to 0.2to 0.3 below 7.2 (because the pH normally rises 0.1 to 0.3 upon filtration) using 1 NNaOH and/or 1 N HCl added slowly with stirring. After the pH has been adjusted,keep the container closed. Sterilize immediately by membrane filtration using a0.2-μm filter and, if possible, a positive-pressure system. Store in the dark up to12 months at 4◦C.
DMEM+/–
450 ml DMEM –/– (see recipe)50 ml FBS (10% v/v final; mycoplasma and virus-screened)
During use, the medium should be stored predominantly at 4◦C up to 4 months in thedark, but should be supplemented after 3 weeks with a 1× final concentration of L-glutamine, added from 100× L-glutamine solution (Invitrogen, cat. no. 25030-124). Alsosee http://www.invitrogen.com/etc/medialib/en/filelibrary/pdf.Par.54294.File.dat/MediaPreparation O064037.pdf.
DMEM+/+450 ml DMEM –/– (see recipe)50 ml FBS (10% v/v final; mycoplasma and virus-screened)5 ml 100× (5000 U/ml penicillin/5000 mg/ml streptomycin) penicillin-strept-
omycin solution (1× final)
During use, the medium should be stored predominantly at 4◦C up to 4 months in the dark,but should be supplemented after 3 weeks with a 1× final concentration of L-glutamine,added from 100× L-glutamine solution (Invitrogen, cat. no. 25030-124). Also seehttp://www.invitrogen.com/etc/medialib/en/filelibrary/pdf.Par.54294.File.dat/MediaPre-paration O064037.pdf.
Isopropyl β-D-thiogalactopyranoside (IPTG) stock, 0. 1 M
Dissolve 1.2 g IPTG and make up to 50 ml using distilled deionized water. Storeup to several weeks in aliquots at 4◦C or up to several months at −20◦C.
Modified RIPA buffer
50 mM Tris·Cl, pH 7.5 (APPENDIX 2A)150 mM NaCl1 mM EDTA1% (v/v) Triton X-1000.25% (w/v) sodium desoxycholateStore up to 2 years protected from light at 4◦CAdd 1× protease inhibitor cocktail just prior to use
Puromycin dihydrochloride, 0.5 mg/ml stock
Store 25 mg of puromycin dihydrochloride solid at −20◦C, protected from moistureuntil ready to reconstitute using 50 ml of PBS (APPENDIX 2A) to create a 0.5 mg/mlstock solution. Filter sterilize the solution using a Terumo syringe and MillexGP0.22-μm filter membranes (Millipore). Store in aliquots up to 2 months at −20◦C.
TRI-mix
94.53 g/liter (800 mM) guanidine thiocyanate30.45 g/liter (400 mM) ammonium thiocyanate8.20 g/liter (100 mM) sodium acetate380 ml/liter (38% v/v) phenol50 ml/liter (5% v/v) glycerol1.0 g/liter (0.1% w/v) 8-quinolinol, pH 5.0Store up to 2 years at 4◦C

RNA-BasedMethods in CellBiology
27.4.45
Current Protocols in Cell Biology Supplement 55
COMMENTARY
Background Information
Basic Protocol 1: Creation of PTC+mRNAs and mutant NMD proteins bysite-directed mutagenesis
Site-directed mutagenesis using oligonu-cleotides was first reported in 1978 (Hutchi-son et al., 1978). Michael Smith, its inventor,shared the Nobel Prize in Chemistry with KaryMullis, who invented PCR. Using site-directedmutagenesis, the information in the geneticmaterial can be altered. This reprogrammedDNA molecule can, e.g., direct the synthesisof a protein with an exchanged amino acid.Michael Smith’s method has become one ofmolecular biology’s most important instru-ments. Not surprisingly, this method is alsoused extensively in NMD research—it formsthe key foundations of nearly all experimentscarried out in NMD from simple analyses toother approaches outside the scope of this unit,such as protein-protein and protein-RNA inter-action studies. The importance of this methodis evident from the long list of mutant NMDproteins (see Table 27.4.1) that have been gen-erated by crucial amino acid changes and alsoby the ability to make genes carrying muta-tions that will give rise to PTCs in the mRNAand hence trigger NMD (see Fig. 27.4.4A).
Basic Protocol 2: pSUPuro-based RNAi toknock down NMD factors
RNAi enables sequence-specific, experi-mentally induced silencing of virtually anygene by tapping into innate regulatory mech-anisms that are conserved among virtuallyall eukaryotes, with the notable exceptionof Saccharomyces cerevisiae. Historically,observations relating to RNA interferencewere known by other names, including co-suppression, post-transcriptional gene silenc-ing, and quelling. Only after these apparentlyunrelated processes were fully understood didit become clear that they all actually could beexplained by RNAi. In 2006, Andrew Fire andCraig Mello were awarded The Nobel Prizein Physiology or Medicine for their researchon RNAi in C. elegans. Soon after the initialdiscovery by Fire and Mello (Fire et al., 1998)that dsRNAs can be used to knock down the ac-tivity of individual genes, many RNAi-basedmethods were (and continue to be) added to thetool-boxes of various organisms. These meth-ods have truly revolutionized the field of func-tional genomics because of their relative ease,and most significantly because RNAi, unlikemore traditional genetic screening methods,
provides a powerful reverse genetic approach,especially for organisms in which geneticsis difficult, as is the case with mammaliansystems.
At its core, RNAi is a response to dsRNA(Fire et al., 1998). This unusual structure, oftenreflective of the presence of viral replicationintermediates or genetic elements, is recog-nized and deconstructed into small RNAs thatare a defining feature of this family of path-ways. In the classical response, the dsRNAprocessing step is carried out by a RNase IIIfamily enzyme called Dicer (Bernstein et al.,2001; Jinek and Doudna, 2009). Dicer cleaveslong dsRNA molecules into short dsRNA frag-ments of ∼21 nts in each strand that are calledsiRNAs. This siRNA is flanked by two nt3′overhangs on both sides (Elbashir et al.,2001). Each siRNA is subsequently unwoundinto two ssRNAs, namely the passenger strandand the guide strand. The passenger strand willbe degraded, and the guide strand is incorpo-rated into the RISC, which has an Argonautefamily protein (AGO proteins) as its core com-ponent (Hock and Meister, 2008; Nowotny andYang, 2009). RISC uses the sequence of itsbound guide RNA to search for complemen-tary substrates, which it engages via Watson-Crick base pairing. In animal cells, AGO2, acomponent of RISC, cleaves the mRNA ina metal-assisted reaction in the middle of aperfectly complementary siRNA-mRNA du-plex. The endonucleolytically cleaved targetmRNA is then released, freeing RISC to acton additional targets as a multiple turnover en-zyme (Haley and Zamore, 2004). Hence, thisprocess works efficiently even under limitedmolar concentrations of siRNA, and in cer-tain organisms (e.g., C. elegans), the siRNAscan even spread systemically throughout theorganism. This manner of post-transcriptionalgene silencing is used for knockdown experi-ments as described here.
In contrast, endogenous microRNAs (miR-NAs) do not form perfectly base-paired du-plexes with their target mRNAs, and silencegene expression through different mechanismsthat result in translation inhibition and/or re-cruitment of deadenylation and decapping fac-tors (Bartel, 2009). MicroRNAs are producedfrom longer primary transcripts called pri-miRNAs. These contain regions that fold intoshort, duplexed structures that are initially pro-cessed within the nucleus by Drosha, anotherconserved RNase III family nuclease. Thisliberates a short hairpin structure, known as

Analysis ofNonsense-
Mediated mRNADecay
27.4.46
Supplement 55 Current Protocols in Cell Biology
pre-miRNA, that is exported to the cytoplasm.Further processing of pre-miRNAs by Diceryields something akin to an siRNA that be-comes loaded onto RISC. MicroRNAs recog-nize their targets via interactions that dependdisproportionately on a region spanning nt2 to 8 of the miR strand (guide strand). Thisseed region is also likely important for initialtarget recognition by siRNAs, particularly inorganisms where the miRNA and siRNA aremediated by identical components (e.g., mam-mals) (Bartel, 2009).
The use of RNAi in NMD research has ad-vanced the field tremendously from uncover-ing the proteins involved in the process viavarious genetic screens, to enhancing our un-derstanding of small mechanistic details of themechanism, to larger genome-wide implica-tions. Indeed, genome-wide studies in yeast,flies, and human cells have recently shown that3% to 10% of all mRNAs are changed by theRNAi-mediated depletion of the central NMDfactor UPF1 (reviewed in Rehwinkel et al.,2006; Nicholson et al., 2009). Interestingly,these studies identified many mRNAs with in-tact ORFs as NMD targets, which changedthe definition of NMD and denoted a role forNMD beyond RNA quality control as a post-transcriptional regulator of gene expression.
Basic Protocol 3: NMD complementationassays
Wide-ranging efforts in bioinformaticshave been focused toward the design ofsuccessful reagents that maximize geneknockdown but minimize off-target effects.However, an siRNA might trigger a number ofpotential unspecific events such as the degra-dation of partially complementary mRNA dueto cross-hybridization, leading to unspecificRNAi, or to translational arrest due to anmiRNA-like effect where a siRNA hybridizesto a mRNA with one or few mismatches. Thus,it is of paramount importance to ensure thatthe phenotypic effects observed as a result ofsiRNA presence in cells are due to silencingof the target gene only. It has been estimatedfrom studying the genomes of H. sapiens,C. elegans, and S. pombe that about 10%of possible siRNAs will have substantial off-target effects. Rescue experiments in which theRNAi effect is reversed through expression ofa target gene refractory to silencing by a par-ticular siRNA can give confirmation that anobserved effect is specifically due to knockingdown the target of interest. Beyond assessingthe specificity of RNAi-induced NMD factorsilencing by rescuing a RNAi-mediated-loss-
of-function phenotype by expressing a RNAi-resistant version of the NMD target gene, com-plementation assays are also useful for ex-amining exactly what part or function of theprotein is necessary to rescue NMD by ex-ogenously expressing RNAi resistant mutantversions of the NMD factor (see Table 27.4.1)and observing if it can still rescue the loss ofNMD after the endogenous NMD factor hasbeen depleted by RNAi.
Basic Protocols 4-6: Extraction of RNA andanalysis of RNA levels by reversetranscription–quantitative PCR
In order to meticulously detect and quan-tify gene expression from small amounts ofRNA, amplification of the gene transcript isessential. RT-qPCR is a powerful tool for thedetection and quantification of small amountsof specific RNA species. It is widely usedbecause of its high sensitivity, specificity,good reproducibility, wide dynamic range,and speed. Specifically, RT-qPCR assays mea-sure the amount of PCR product after eachPCR cycle. The change in concentration ofthe target DNA is detected using fluores-cent molecules that interact with DNA. Thesecan be fluorescent dyes that intercalate withdouble-stranded DNA (e.g., SYBR Green, seeFig. 27.4.2B) or fluorescently tagged oligonu-cleotide probes that change signal intensity asa result of DNA amplification (e.g., TaqManprobes, see Fig. 27.4.2A). The fluorescent sig-nal is monitored during the reaction and itsintensity correlates to the amount of productformed (Mackay et al., 2002; Bustin, 2005;Wong and Medrano, 2005; Fleige and Pfaffl,2006; Kubista et al., 2006). The course of theexperiment can be broken down into fourphases: the linear ground phase, early ex-ponential phase, late exponential phase, andplateau phase. The linear ground phase is dur-ing the early cycles (first 10 to 15 cycles); theDNA duplication is not detected because ofDNA quantities that produce insufficient sig-nal/background ratio. Baseline fluorescence iscalculated during this phase. The target DNAsequence starts to double in concentration witheach cycle, causing the signal level to in-crease exponentially after it has become de-tectable above background. The amplificationefficiency (E) of a well-optimized qPCR assayis very high (near 1) at the beginning of the re-action and remains relatively stable during theearly exponential phase of the amplification.In qPCR, quantification is performed duringthis early exponential phase, when reactionefficiency is still stable. In later cycles, the

RNA-BasedMethods in CellBiology
27.4.47
Current Protocols in Cell Biology Supplement 55
reporter poly(A)
reporter poly(A)
XX
Assay biological function of protein X:
Figure 27.4.8 Tethered Function Assay. The design of the Tethered Function Assay is relativelystraightforward. To determine the effects of protein X on mRNA metabolism, a chimeric proteinis expressed in vivo in which protein X is continuous with a tethering polypeptide. The tetheringprotein is an RNA-binding protein that recognizes an RNA tag sequence with high specificity andaffinity. The effect of the fusion protein on mRNA metabolism is determined by co-expressingthe chimera with an mRNA reporter (such as LacZ or Firefly luciferase) into which a tag RNAsequence has been embedded. The fusion protein’s effects on mRNA metabolism are assayedby conventional means such as western blotting, northern blotting, RT-PCR, etc. (altered diagramof the original shown in Coller and Wickens, 2002).
signal levels off (late exponential and plateauphase) and the intensity of the fluorescenceis no longer related to the starting templatecopy number. This saturation results from thereaction running out of critical components,such as primers, fluorescence dye, and dNTPs(Bustin, 2000). Saturation can also occur dueto competition from re-annealing reactions,the changing concentration ratios of the com-ponents, or the decreasing ratio of enzymeunits to DNA substrate molecules.
The cycle threshold [Ct; also referred toas quantification cycle (Cq) or crossing point(CP)] is the metric used for analyzing qPCRresults. The Ct value represents the number ofcycles needed to reach a set threshold fluo-rescence signal level. The greater the amountof starting template, the fewer cycles it takesto attain a detectable fluorescence level. Theexact level used for this threshold should bechosen so that it captures data during the earlyexponential phase and is the same for all sam-ples analyzed in a run. To determine Ct valuesin practice, background fluorescence levels arefirst subtracted from raw data. The backgroundvalue is typically based on the relatively stablefluorescence level of the first few cycles. Then,a fluorescence threshold is chosen either man-ually or using an instrument-based algorithm.The data analysis searches data curves for each
sample and interpolates a Ct that representswhere that sample crossed the threshold. Thus,the specific Ct obtained is a relative value. Itis relative to the starting template copy num-ber (Heid et al., 1996), but it is also specificfor the instrument and reagents used, the effi-ciency of the PCR amplification, the efficiencyof cleavage or hybridization of the fluorogenicprobe, and the sensitivity of detection. Quan-titative PCR can be used to quantify nucleicacids by two methods: relative quantificationand absolute quantification. Relative quantifi-cation is based on internal reference genesto determine fold-differences in expression ofthe target gene. Absolute quantification givesthe exact number of target DNA moleculesby comparison with DNA standards; both arefurther explained below and the former is ex-emplified in Basic Protocol 6.
In comparison to traditional end-pointPCR, qPCR results can be obtained morequickly and with less variability due to the useof very sensitive fluorogenic chemistries andthe elimination of post-PCR detection proce-dures. Also, qPCR reduces the risk of labora-tory contamination because the tubes need notbe opened post-PCR. qPCR assays are alsowell-suited to more challenging applicationssuch as high-throughput analysis. However,due to its high sensitivity, it demands a sound

Analysis ofNonsense-
Mediated mRNADecay
27.4.48
Supplement 55 Current Protocols in Cell Biology
experimental design and a meticulous under-standing of quantification and normalizationtechniques for accurate results to be obtained.
Basic Protocol 7: Using the TetheredFunction Assay to investigate NMD
The basic design of the TetheredFunction Assay
Many steps in the control of gene expres-sion are dependent upon RNA-binding pro-teins, most of which are bi-functional, mean-ing they both bind to RNA and interact withother protein partners in a functional com-plex. Due to the importance of RNA-bindingproteins in gene regulation, one of the majortasks in molecular cell biology is to determinethe biological role of these proteins and themechanisms by which they achieve their var-ious functions. Certainly, RNA-binding pro-teins are involved in a wide spectrum of bothregulated and constitutive functions in the cell,and much groundwork has been done by bio-chemical studies, but the real evidence of bi-ological function requires analyses in vivo.However, this is not trivial, because in manyinstances the natural mRNA target for a givenprotein is unknown; any assay of function musttherefore be performed independently of thenatural RNA-protein interaction. Also, sincepost-transcriptional regulatory steps are oftencoupled, genetic analysis of functions in vivocan be complicated by subsidiary effects. Fur-thermore, mutations in many critical RNA-binding proteins can have pleiotropic effectson the cell, making it very difficult to de-duce which functions are direct. Therefore,a different approach to study the functionalproperties of these proteins in vivo, indepen-dently of their RNA-binding ability, is to at-tach or tether them to specifically engineeredreporter mRNAs whose fate can be easily fol-lowed. This powerful technique is called aTethered Function Assay and is based on theuse of two recombinant molecules—firstly, ahybrid mRNA comprising the coding regionof the protein under study fused in-frame tothe RNA-binding domain of a well charac-terized RNA-binding protein, and, secondly,a recombinant reporter mRNA encoding aneasily measurable protein and the sequenceelement (tether) recognized with high affin-ity by the exogenous RNA-binding domain ofthe fusion protein. When co-expressed in acell, the fusion protein should be bound (i.e.,tethered) to the reporter mRNA via the exoge-nous RNA-binding domain, thereby imposingthe functional consequences of its association
with a mRNA on the reporter mRNA (see Fig.27.4.8). One of the main advantages of thissystem as a means of determining protein func-tion is that a prior knowledge of a protein’sRNA-binding specificity is not required, andalso that high levels of the endogenous proteinwill not necessarily be a problem, as only thefunction of the tethered protein is monitored.This technique has been expertly covered innumerous reviews (Coller and Wickens 2002,2007; Keryer-Bibens et al., 2008).
Critical Parameters andTroubleshooting
Basic Protocol 1: Creation of PTC+mRNAs and mutant NMD proteins bysite-directed mutagenesis
Deciding which site-directed mutagenesistechnology to use
Site-directed mutagenesis has become sovaluable an experimental tool that it has beenextensively improved since its discovery, andseveral companies are continuously trying tostreamline and enhance the process. This isparticularly true of the QuikChange kits (Ag-ilent Technologies), some of which have beenexamined here. Importantly, as highlightedhere, they have engineered various alterationsto their basic system to tailor each kit to spe-cific needs. For instance, if the template DNAis very large, the QuikChange II XL is tailoredto help in this situation, and this was neces-sary for the example given in Figure 27.4.5A.Similarly, if it is desirable to make multiplemutations within the same DNA plasmid, likein Figure 27.4.4B, then instead of doing multi-ple rounds of QuikChange using pairs of com-plementary primers, the QuikChange Multi-Site protocol will save time due to the useof their DNA enzyme blend described in Fig-ure 27.4.5. In actuality, it can work out morecheaply to simply order one primer and usethe QuikChange Multi-Site kit than to ordertwo primers for every alteration and use theQuikChange II kit. The technology and choiceoffered by Agilent is very popular, as theirsystems require no specialized vectors, uniquerestriction sites, or multiple transformations.However, for simple mutations, a kit is perhapsnot entirely necessary and many other compa-nies (Finnzymes, BD Biosciences Clontech,Invitrogen, Promega, and Takara Bio) also of-fer site-directed mutagenesis technologies.
Primer design and useThe primers are central to the procedure,
which is why extensive guidelines have been

RNA-BasedMethods in CellBiology
27.4.49
Current Protocols in Cell Biology Supplement 55
included in the protocol. The primers shouldalways be in excess, and it may be bene-ficial to keep the primer quantity constantwhile varying the plasmid DNA content inthe reaction. Particularly in reactions wheretwo complementary primers are being usedand low efficiency is being observed, run2.5 μl of the reaction on an agarose gel. Ifa strong primer-dimer band is observed, mostlikely primer-primer annealing is favored overprimer-template annealing, and primer-DNAtemplate quantities should be evaluated. If,after extensive troubleshooting using all theadvice given in the protocol, the mutagenesisefficiency is still poor, strongly consider re-designing the primers.
High-quality and high-fidelity DNApolymerase
The PCR reaction goes around the entireplasmid DNA, and so it is essential to use ahigh-fidelity polymerase in order to minimizethe chances of introducing unwanted muta-tions in both your gene and the vector back-bone. A hot-start formulation of the enzymeis desirable, as the proofreading capability ofmost of these enzymes may otherwise degradethe primers during the reaction setup.
Highly competent bacterial cells arenecessary for transformation step
This process does not amplify the DNA ex-ponentially, but linearity and yields are com-plicated by the fact that the product DNAmust undergo the nick repair and are not su-percoiled, resulting in reduced efficiency ofbacterial transformation. Therefore, the use ofhighly competent bacterial cells is crucial forthis step in the protocol.
ControlsWhile many of the companies have de-
signed site-directed mutagenesis kits that arefaster, with fewer, less-complicated steps,there are still a wide range of factors that canhinder an efficient reaction, and, dependingon the specific reaction, optimization and/ortroubleshooting will have to be carried out toobtain positive results. Inclusion of good con-trols in the mutagenesis reaction can give in-formation as to where in the protocol theremight be a problem. It is highly recommendedto use the mutagenesis control included in theQuikChange kits. In brief, the positive controlis based on the pBluescript plasmid, which hasone premature stop codon (or in the case of theMulti-Site kit, several premature stop codons)in the LacZ coding region, preventing the pro-
duction of the gene product β-galactosidase.In a positive reaction, the control primer(s) willmutagenize these stop codons back to their ap-propriate codons and thus allow for expressionof the LacZ gene, producing β-galactosidase,which in presence of IPTG and Xgal will pro-duce blue-colored colonies. Similarly, includ-ing a positive control such as transformingpUC18 in the transformation step can posi-tively control for this part of the protocol too.
The nature of the mutationsThe variety of alterations to the DNA se-
quences can be extensive for a wide varietyof experimental reasons, but when specificchanges are made to the coding region of anNMD protein, it is valuable to think carefullyabout exactly what kind of effect the desiredchange is aiming to have on the protein itselfin the cell. In some cases, it might be desirableto make a neutral change, meaning a muta-tion to the nt sequence that will not changethe amino acid sequence at the protein level.This is desirable when making genes RNAiresistant, as featured in Figure 27.4.1D. How-ever, to change functionally important aminoacids by site-directed mutagenesis of the DNAsequence requires careful consideration anddepends on the desired effect. If the goal isto inactivate an enzyme as illustrated in Fig-ure 27.4.4B, change the chemical properties ofconserved amino acids in the catalytic center,here for example aspartic acid (D), to the simi-larly sized but polar and uncharged asparagine(N) or to the smaller and nonpolar alanine (A).Bear in mind that certain amino acid changesin the polypeptide chain may be detrimentalto correct folding, and hence stability, of theprotein. Therefore, one should always checkthat similar amounts of protein are expressedfrom the mutated and the wild-type gene.
Basic Protocol 2: pSUPuro-based RNAi toknock down NMD factors
Design of oligonucleotidesThe design of the shRNA-encoding
oligonucleotides is essential, and should bebased upon the correct nt sequence of theexact gene intended for depletion. Moreover,many studies have examined the degree ofcomplementarity needed to elicit an effectivesilencing response (Siomi and Siomi, 2009).This is important especially for designing spe-cific silencing triggers. Therefore, the triggershould be designed to be fully complementaryto the target. If the gene levels are not suit-ably decreased, which is a common and poorly

Analysis ofNonsense-
Mediated mRNADecay
27.4.50
Supplement 55 Current Protocols in Cell Biology
understood problem, it is worthwhile to tryseveral targets. Due to the unavoidable risk ofoff-target effects in knockdown experiments,knockdown-associated phenotypes should bereproduced by use of a second target sequenceagainst the same target mRNA. Alternatively,rescue experiments by expression of a recom-binant version of the depleted protein from aRNAi-resistant mRNA can be performed todemonstrate the specificity of the observedphenotype (see below).
TransfectionThe transfection protocol in this unit uses
DreamFect, a transfection reagent based onthe “triggered endosomal escape” technologyand which is lipid based. However, certain celltypes may not achieve high levels of transfec-tion efficiency with this reagent. If so, thereare several other transfection reagents avail-able. For instance, we find that Fugene HD(Promega) works more efficiently than Dream-fect for this protocol in U2OS cells. In general,it is very important to optimize this part of theprotocol for your cell type and for the specificexperiment, because if there is low transfectionefficiency, then massive cell death will occurunder puromycin selection.
Toxicity of the gene knockdownA genetic knockout of many of the NMD
factors is lethal; thus, knocking down thesegenes for prolonged periods of time will alsobe detrimental to the cells. If you are experi-encing that the knockdown is particularly toxicto your cells, you can shorten the duration ofthe experiment by reducing the puromycin se-lection time from 48 hr to 24 hr, which mayallow analysis of the cells before they die. Forinstance, we find that, in particular, depletionof SMG6 and UPF1 are quite toxic for humancell lines.
Cell typeFor this protocol, the very common HeLa
cell line has been used. This method can beadapted to other cell types. However, the trans-fection will have to be optimized as previ-ously explained, and the optimal conditionsfor puromycin selection will have to be de-termined by titrating the puromycin concen-tration. Puromycin is an aminoglycoside an-tibiotic produced by Streptomyces alboniger.It specifically inhibits peptidyl transfer onboth prokaryotic and eukaryotic ribosomesthrough the pac gene encoding a puromycinN-acetyl-transferase (PAC), and the differentcells have different sensitivity levels for suchan antibiotic. Unfortunately, we have found
that HEK293-T cells do not work well withthis protocol due to their high sensitivity topuromycin.
ControlsAs with all experiments, controls are vi-
tal to interpret the results. In this method,the set of experiments carried out using thepSUPuro plasmid encoding the shRNA tar-geting the knockdown of a particular NMDfactor should also be carried out in parallel us-ing a pSUPuro plasmid expressing no shRNAs(pSUPuro empty) or a pSUPuro plasmid ex-pressing a scrambled sequence which is pre-dicted to target no gene in the used species.Finally, off-target effects can arise when an in-troduced shRNA has a base sequence that canpair with and thus reduce the expression ofmultiple genes at a time.
Basic Protocol 3: NMD complementationassays
The mutation(s) introduced to create RNAiresistance must match the RNAi targetsequence
It cannot be stressed enough that the silentmutations that are made in the exogenously ex-pressed NMD factor have to be based upon theexact target sequence used to knock down theNMD gene. The shRNA must lose its absolutecomplementarity to the specific target regionin the exogenous mRNA due to these intro-duced mutations. Furthermore, if more thanone shRNA is used to knock down the NMDgene, then silent mutations should be made inall the regions of the exogenous mRNA wherethe multiple shRNAs bind, making the exoge-nously expressed NMD factor resistant to alltargets.
Expression levels of the exogenousRNAi-resistant factors
It is important to ensure that the exoge-nously expressed RNAi resistant NMD pro-teins and any functional mutants thereof havesimilar expression levels to the endogenousprotein, and in particular to each other. Thiswill require titrating the amount of plasmidDNA transfected for each RNAi resistant ex-pression plasmid so that similar protein levelsare achieved. It is recommended to keep the ex-pression levels of the exogenously expressedNMD proteins similar to the endogenously ex-pressed NMD proteins to make the experimentphysiologically relevant. Likewise, it is im-portant to keep the expression levels of thedifferent RNAi-resistant NMD factors (wild-type and mutants thereof) very similar to each

RNA-BasedMethods in CellBiology
27.4.51
Current Protocols in Cell Biology Supplement 55
Western Northern
SMG6R expr
FL
G3
1 2 5 6 7 8
fulllength
SMG6 KD – +
–
– + – +
WT m1
Anti-SMG6
SMG6 expr
SMG6R expr
– +
– – –
– + – + – +
WT
SMG6 KD
Anti-SmB/B′
– – WT m1
1 2 3 4 5 6 7 8
A B
Figure 27.4.9 SMG6 complementation assay showing that SMG6 endonuclease activity is required for the degradationof TCRβ PTC+ RNA by NMD. (A) Western blotting analysis demonstrating RNAi-mediated knockdown of SMG6 and theectopic expression of RNAi resistant HA-tagged versions of SMG6 (wild-type (WT) and m1 HA-SMG6R) at equal levels inHeLa–TCRβ PTC+ cells. Lanes 1 and 2 depict an efficient SMG6 knockdown of endogenous SMG6, lanes 3 and 4 depictan efficient knockdown of both endogenous and exogenous SMG6, lanes 5 and 6 show that the exogenously expressedRNAi resistant SMG6 is expressed even under knockdown conditions, and the same is true for lanes 7 and 8, where anexogenously expressed SMG6 PIN mutant is tested. (B) Northern blotting analysis of total RNA isolated from HeLa–TCRβ
PTC+ cells shown in lanes 1, 2, 5, 6, 7, and 8 of the western blot to the right. The northern blot was hybridized with a probespanning the VDJ region of TCRβ gene. Lane 2 shows that the depletion of SMG6 has abolished NMD. Lane 6 showsthat expression of the exogenous RNAi-resistant wild-type SMG6 can rescue the loss of NMD, shown by the reducedRNA level, whereas the exogenous expression of a RNAi-resistant SMG6 that is endonucleolytically inactive is not able torescue NMD, as portrayed in lane 8 (data from Eberle et al., 2009).
other to allow for a fair interpretation of theresults. Indeed, in Figure 27.4.9, only 500 ngof the pcDNA3-HA-SMG6 was transfected,whereas 2000 ng of its PIN mutant counter-part had to be transfected to gain a similarprotein level.
A loss of function has to be observed in orderto be rescued
An mRNA containing a PTC should be de-graded by the NMD pathway, unlike its wild-type counterpart, and this should be observedby very low levels of PTC+ mRNA comparedto its wild-type counterpart. However, if a keyprotein necessary for NMD is depleted fromcells by RNAi, this abolishes NMD, and in thissituation the PTC+ mRNA is not degraded byNMD and thus has stabilized mRNA levels(see Fig. 27.4.9B). This is how to monitor theeffect the knockdown has and how to observe aloss of function. Therefore, it is critical to alsotransfect a plasmid that will express a PTC-containing mRNA and its wild-type counter-part in the cells.
ControlsAs with every experiment, a set of con-
trols is necessary for a complete experimentand for proper interpretation of the results.Four controls are needed: a co-transfectioncontrol, a control for the vector-based RNAi(use of pSUPuro empty), a control for NMD(comparing wild-type RNA to a PTC+ RNA),
and a control for the exogenously expressedRNAi-resistant proteins (comparing RNAi re-sistant SMG6 to SMG6 that is not RNAi re-sistant). Here, the former control should befurther explained, as the others have alreadybeen discussed. Co-transfection controls areuseful to remove variability due to transfec-tion efficiency, and in the above protocol, aplasmid expressing GFP is included in everytransfection for this reason. The importance ofappropriate normalization controls in quantita-tive polymerase chain reaction (qPCR) exper-iments has become more apparent as the num-ber of biological studies using this methodol-ogy has increased. In developing a system tostudy gene expression from transiently trans-fected plasmids, it became clear that normal-ization using chromosomally encoded genesis not ideal, as it does not take into accountthe transfection efficiency and the significantlylower expression levels of the plasmids.
Basic Protocols 4-6: Extraction of RNA andanalysis of RNA levels by reversetranscription-quantitative PCR
RNA extraction and RT reactionUse an RNA isolation procedure that pro-
duces high-quality total RNA from all sam-ples to be analyzed. In this protocol, quan-tifying RNA using A260 values was outlinedwhereby spectrophotometry values can indi-cate RNA quality (A260/A280 = 1.9 to 2.1).
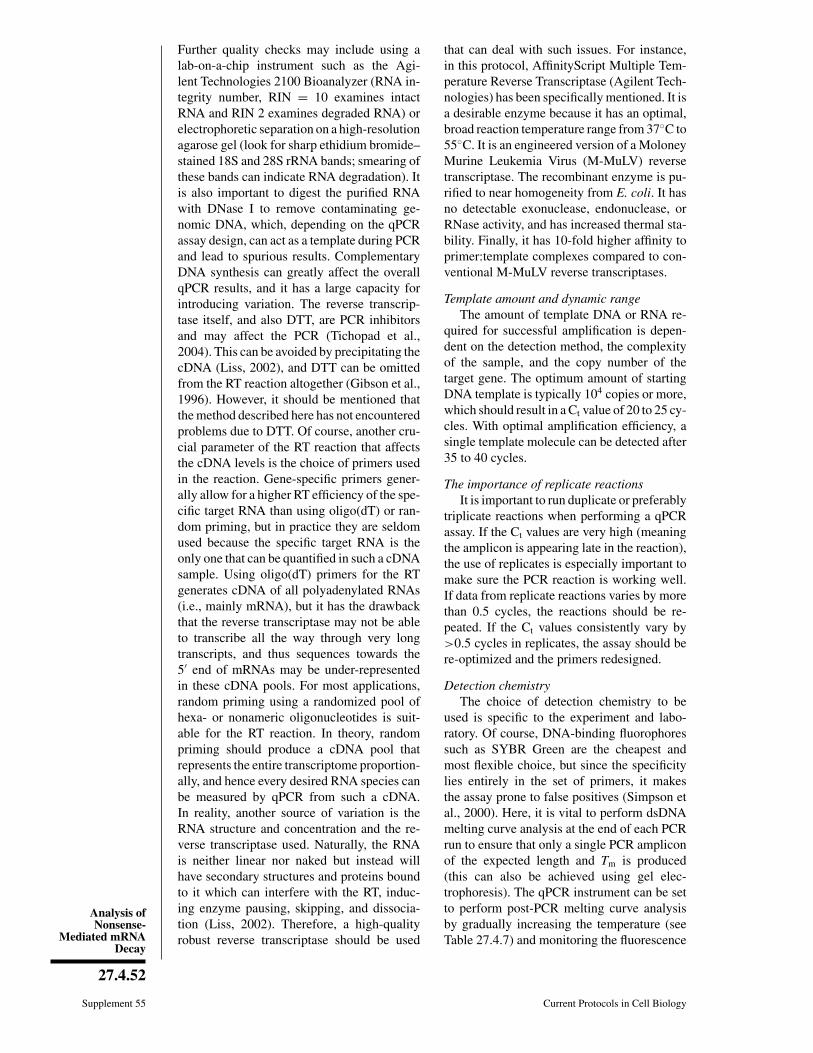
Analysis ofNonsense-
Mediated mRNADecay
27.4.52
Supplement 55 Current Protocols in Cell Biology
Further quality checks may include using alab-on-a-chip instrument such as the Agi-lent Technologies 2100 Bioanalyzer (RNA in-tegrity number, RIN = 10 examines intactRNA and RIN 2 examines degraded RNA) orelectrophoretic separation on a high-resolutionagarose gel (look for sharp ethidium bromide–stained 18S and 28S rRNA bands; smearing ofthese bands can indicate RNA degradation). Itis also important to digest the purified RNAwith DNase I to remove contaminating ge-nomic DNA, which, depending on the qPCRassay design, can act as a template during PCRand lead to spurious results. ComplementaryDNA synthesis can greatly affect the overallqPCR results, and it has a large capacity forintroducing variation. The reverse transcrip-tase itself, and also DTT, are PCR inhibitorsand may affect the PCR (Tichopad et al.,2004). This can be avoided by precipitating thecDNA (Liss, 2002), and DTT can be omittedfrom the RT reaction altogether (Gibson et al.,1996). However, it should be mentioned thatthe method described here has not encounteredproblems due to DTT. Of course, another cru-cial parameter of the RT reaction that affectsthe cDNA levels is the choice of primers usedin the reaction. Gene-specific primers gener-ally allow for a higher RT efficiency of the spe-cific target RNA than using oligo(dT) or ran-dom priming, but in practice they are seldomused because the specific target RNA is theonly one that can be quantified in such a cDNAsample. Using oligo(dT) primers for the RTgenerates cDNA of all polyadenylated RNAs(i.e., mainly mRNA), but it has the drawbackthat the reverse transcriptase may not be ableto transcribe all the way through very longtranscripts, and thus sequences towards the5′ end of mRNAs may be under-representedin these cDNA pools. For most applications,random priming using a randomized pool ofhexa- or nonameric oligonucleotides is suit-able for the RT reaction. In theory, randompriming should produce a cDNA pool thatrepresents the entire transcriptome proportion-ally, and hence every desired RNA species canbe measured by qPCR from such a cDNA.In reality, another source of variation is theRNA structure and concentration and the re-verse transcriptase used. Naturally, the RNAis neither linear nor naked but instead willhave secondary structures and proteins boundto it which can interfere with the RT, induc-ing enzyme pausing, skipping, and dissocia-tion (Liss, 2002). Therefore, a high-qualityrobust reverse transcriptase should be used
that can deal with such issues. For instance,in this protocol, AffinityScript Multiple Tem-perature Reverse Transcriptase (Agilent Tech-nologies) has been specifically mentioned. It isa desirable enzyme because it has an optimal,broad reaction temperature range from 37◦C to55◦C. It is an engineered version of a MoloneyMurine Leukemia Virus (M-MuLV) reversetranscriptase. The recombinant enzyme is pu-rified to near homogeneity from E. coli. It hasno detectable exonuclease, endonuclease, orRNase activity, and has increased thermal sta-bility. Finally, it has 10-fold higher affinity toprimer:template complexes compared to con-ventional M-MuLV reverse transcriptases.
Template amount and dynamic rangeThe amount of template DNA or RNA re-
quired for successful amplification is depen-dent on the detection method, the complexityof the sample, and the copy number of thetarget gene. The optimum amount of startingDNA template is typically 104 copies or more,which should result in a Ct value of 20 to 25 cy-cles. With optimal amplification efficiency, asingle template molecule can be detected after35 to 40 cycles.
The importance of replicate reactionsIt is important to run duplicate or preferably
triplicate reactions when performing a qPCRassay. If the Ct values are very high (meaningthe amplicon is appearing late in the reaction),the use of replicates is especially important tomake sure the PCR reaction is working well.If data from replicate reactions varies by morethan 0.5 cycles, the reactions should be re-peated. If the Ct values consistently vary by>0.5 cycles in replicates, the assay should bere-optimized and the primers redesigned.
Detection chemistryThe choice of detection chemistry to be
used is specific to the experiment and labo-ratory. Of course, DNA-binding fluorophoressuch as SYBR Green are the cheapest andmost flexible choice, but since the specificitylies entirely in the set of primers, it makesthe assay prone to false positives (Simpson etal., 2000). Here, it is vital to perform dsDNAmelting curve analysis at the end of each PCRrun to ensure that only a single PCR ampliconof the expected length and Tm is produced(this can also be achieved using gel elec-trophoresis). The qPCR instrument can be setto perform post-PCR melting curve analysisby gradually increasing the temperature (seeTable 27.4.7) and monitoring the fluorescence
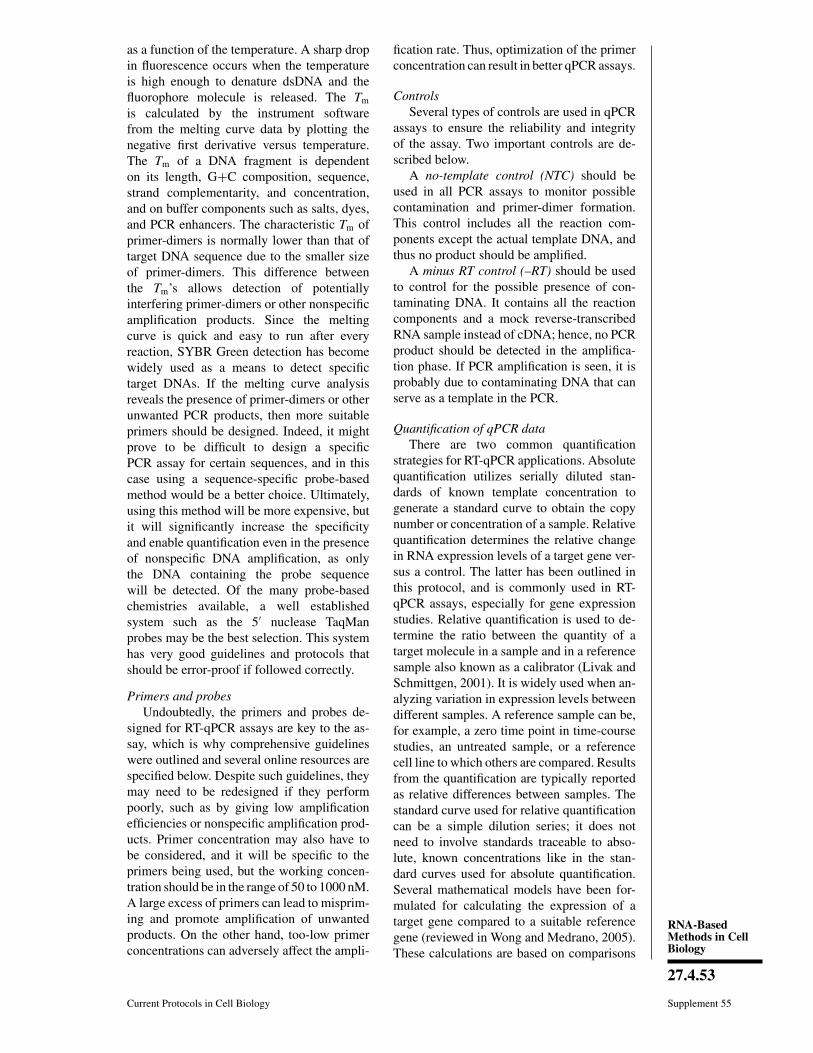
RNA-BasedMethods in CellBiology
27.4.53
Current Protocols in Cell Biology Supplement 55
as a function of the temperature. A sharp dropin fluorescence occurs when the temperatureis high enough to denature dsDNA and thefluorophore molecule is released. The Tm
is calculated by the instrument softwarefrom the melting curve data by plotting thenegative first derivative versus temperature.The Tm of a DNA fragment is dependenton its length, G+C composition, sequence,strand complementarity, and concentration,and on buffer components such as salts, dyes,and PCR enhancers. The characteristic Tm ofprimer-dimers is normally lower than that oftarget DNA sequence due to the smaller sizeof primer-dimers. This difference betweenthe Tm’s allows detection of potentiallyinterfering primer-dimers or other nonspecificamplification products. Since the meltingcurve is quick and easy to run after everyreaction, SYBR Green detection has becomewidely used as a means to detect specifictarget DNAs. If the melting curve analysisreveals the presence of primer-dimers or otherunwanted PCR products, then more suitableprimers should be designed. Indeed, it mightprove to be difficult to design a specificPCR assay for certain sequences, and in thiscase using a sequence-specific probe-basedmethod would be a better choice. Ultimately,using this method will be more expensive, butit will significantly increase the specificityand enable quantification even in the presenceof nonspecific DNA amplification, as onlythe DNA containing the probe sequencewill be detected. Of the many probe-basedchemistries available, a well establishedsystem such as the 5′ nuclease TaqManprobes may be the best selection. This systemhas very good guidelines and protocols thatshould be error-proof if followed correctly.
Primers and probesUndoubtedly, the primers and probes de-
signed for RT-qPCR assays are key to the as-say, which is why comprehensive guidelineswere outlined and several online resources arespecified below. Despite such guidelines, theymay need to be redesigned if they performpoorly, such as by giving low amplificationefficiencies or nonspecific amplification prod-ucts. Primer concentration may also have tobe considered, and it will be specific to theprimers being used, but the working concen-tration should be in the range of 50 to 1000 nM.A large excess of primers can lead to misprim-ing and promote amplification of unwantedproducts. On the other hand, too-low primerconcentrations can adversely affect the ampli-
fication rate. Thus, optimization of the primerconcentration can result in better qPCR assays.
ControlsSeveral types of controls are used in qPCR
assays to ensure the reliability and integrityof the assay. Two important controls are de-scribed below.
A no-template control (NTC) should beused in all PCR assays to monitor possiblecontamination and primer-dimer formation.This control includes all the reaction com-ponents except the actual template DNA, andthus no product should be amplified.
A minus RT control (–RT) should be usedto control for the possible presence of con-taminating DNA. It contains all the reactioncomponents and a mock reverse-transcribedRNA sample instead of cDNA; hence, no PCRproduct should be detected in the amplifica-tion phase. If PCR amplification is seen, it isprobably due to contaminating DNA that canserve as a template in the PCR.
Quantification of qPCR dataThere are two common quantification
strategies for RT-qPCR applications. Absolutequantification utilizes serially diluted stan-dards of known template concentration togenerate a standard curve to obtain the copynumber or concentration of a sample. Relativequantification determines the relative changein RNA expression levels of a target gene ver-sus a control. The latter has been outlined inthis protocol, and is commonly used in RT-qPCR assays, especially for gene expressionstudies. Relative quantification is used to de-termine the ratio between the quantity of atarget molecule in a sample and in a referencesample also known as a calibrator (Livak andSchmittgen, 2001). It is widely used when an-alyzing variation in expression levels betweendifferent samples. A reference sample can be,for example, a zero time point in time-coursestudies, an untreated sample, or a referencecell line to which others are compared. Resultsfrom the quantification are typically reportedas relative differences between samples. Thestandard curve used for relative quantificationcan be a simple dilution series; it does notneed to involve standards traceable to abso-lute, known concentrations like in the stan-dard curves used for absolute quantification.Several mathematical models have been for-mulated for calculating the expression of atarget gene compared to a suitable referencegene (reviewed in Wong and Medrano, 2005).These calculations are based on comparisons

Analysis ofNonsense-
Mediated mRNADecay
27.4.54
Supplement 55 Current Protocols in Cell Biology
MCP-YFP
TGAter310ATG
VDJ C1hβactin C2 C3 C4 polyA24 MBSTL
Figure 27.4.10 An in vivo approach to measure transcription in real-time on the single-cell leveland to monitor differences in behavior between a PTC- and a PTC+ gene. New versions of thegenes explained in Figure 27.4.4 were created by exploiting the MS2 system (Bertrand et al.,1998; Darzacq et al., 2007). The insertion of 24 MS2 binding sites (MBS) in the 3′ UTR of theIg mini μ gene allowed for the visualization of transcription sites in vivo upon binding of thesestem–loops by the MS2 coat protein (MCP) fused to yellow fluorescent protein (MCP-YFP) shownby gray stars. Stable transfection of the Ig mini μ genes either with the wild-type sequence or witha single point mutation generating a PTC at amino acid 310 in to U2OS cells allowed for live-cellimaging of active transcription sites (diagram from de Turris et al., 2011).
of separate quantification cycle values (Ct) ata particular fluorescence level. The followingrelative quantification methods all use a stan-dard curve to calculate amplification efficien-cies: Standard Curve Method (Livak, 1997),Comparative Ct Model (Livak and Schmittgen,2001), Pfaffl Model (Pfaffl, 2001), and Q-gene(Muller et al., 2002).
Normalization: Relative gene expressiondata obtained with RT-qPCR should be nor-malized in order to correct for several vari-ables, including the amount of cells or nucleicacid in the sample, instrument-dependent vari-ation in fluorescence collection, and variationin reaction efficiency, nucleic acid integrity,and sample purity. A normalizer can be anexogenous control (such as measuring GFPmRNA levels from the example experiment inTable 27.4.4, Basic Protocol 3) or an endoge-nous control such as a reference gene. How-ever, any variations in the normalizer can hidethe actual expression-level changes and pro-duce misleading results. It is important that, ifreference genes are used as normalizers, thegenes be well validated and results not be re-ported more precisely than the normalizer canbe quantified. Normalizers can be simultane-ously amplified in the same tube as the targetgene as a multiplex assay, or separately am-plified in parallel reactions, although the latterapproach reduces the value of the normalizer,since tube-to-tube variations in pipetting andreaction rates are not normalized.
An external, artificial RNA molecule withknown concentration can be added into theRNA sample and used as an exogenous ref-erence for normalizing against experimentalvariation (such as the use of GFP in Basic Pro-tocol 3). These added external molecules can
be cloned from other species or produced syn-thetically. They will be exposed to the sameeffects and experimental errors as the targetRNA. However, this type of internal referencedoes not normalize for variability in the RNAextraction process (reviewed in Huggett et al.,2005). Hence, this method also requires extravalidation to demonstrate that it is a suitablebasis for normalization.
Reference genes should also be used tonormalize for variation in sample prepara-tion procedures and for variations in each RTreaction. A gene used as a reference should beexpressed at a constant level across all samplesand experimental conditions tested. If these re-quirements are not fulfilled, the normalizationprocess can result in significant errors. Theamplification efficiency of a reference geneshould be the same as the efficiency of thetarget gene; otherwise, the data need to be cor-rected for variation. Reference genes are usu-ally well known housekeeping genes. Somehousekeeping genes frequently used as ref-erence genes include GAPDH, β-actin, and18S rRNA. It should be noted that some sam-ple treatment methods may have a differenteffect on rRNA and mRNA expression. Forexample, rRNA is transcribed with a differ-ent polymerase than mRNA, so variations inpolymerase activity can result in different ef-fects in expression levels (reviewed in Huggettet al., 2005; Wong and Medrano, 2005). A bigproblem is that even the expression of house-keeping genes usually varies to some extent.That is why several reference genes are oftenrequired, and their expression levels need tobe checked for each experiment. To this end,several Excel-based macros and programs areavailable for assessment of multiple reference

RNA-BasedMethods in CellBiology
27.4.55
Current Protocols in Cell Biology Supplement 55
genes. Screening a panel of candidate refer-ence genes under specified experimental con-ditions and using the statistical methods andsoftware packages recommended under Inter-net Resources in this unit will yield the moststable reference gene or set of genes.
Basic Protocol 7: Using the TetheredFunction Assay to investigate NMD
Basic Protocol 7 is a comprehensive guidewhere each component of the assay has beenmethodically addressed to aid in the creationof a tethered function assay. Every aspect ofthe assay has been carefully discussed andall options have been explained so that themost suited and optimized assay can be estab-lished by the investigator. Two key points areworth reiterating. (1) It is of paramount im-portance that the outlined controls be createdand included in the assay. Any results gener-ated from such an assay will be meaninglesswithout these stipulated controls. (2) It is alsoof great importance to verify that the NMDfactor of interest fused to the desired tethercan be expressed. Additionally, this assay canmake use of the methods described in BasicProtocols 1, 2, 4, 5, and 6. Thus, the CriticalParameters and Troubleshooting sections ac-companying each of these protocols should beread and considered when encountering anyproblems.
Anticipated Results
Basic Protocol 1: Creation of PTC+mRNAs and mutant NMD proteins bysite-directed mutagenesis
The anticipated outcome is to generate theplasmid DNA containing the planned alter-ations and no other mutations as confirmed byDNA sequencing analysis. For changes madeto plasmids below 10 kb, 80% to 100% ofcolonies should contain a correct plasmid. Forlonger plasmids or more complicated alter-ations, it may be necessary to optimize theprotocol or screen more colonies.
Basic Protocol 2: pSUPuro-based RNAi toknock down NMD factors
This method should ideally reduce the pro-tein level of the targeted gene by >10-fold.In many cases, studying the effects of this de-crease can reveal the physiological role of thegene product. However, since RNAi does nottotally abolish expression of the gene, it is pos-sible that even strongly reduced protein levelsmay still be sufficient to sustain the biologicalprocess under investigation. Therefore, it can-not be overstated that a negative result (i.e., no
change upon depletion of the target protein) ina knockdown experiment is inconclusive. Thisis a severe limitation of the RNAi method thatfundamentally distinguishes it from genetic“knockout“ techniques in which expression ofa gene can be entirely eliminated.
Basic Protocol 3: NMD complementationassays
The NMD factor that is depleted by RNAican be rescued by exogenously expressing thesame NMD factor which has been made RNAiresistant. The depletion of the NMD factorsshould cause an abrogation of NMD, whichwill be reflected in a stabilization of PTC-containing reporters, but the inclusion of theRNAi-resistant exogenous NMD factor shouldrescue the loss of NMD, and thus PTC+ RNAwill be rapidly degraded and thus have lowRNA levels when analyzed.
Basic Protocols 4-6: Extraction of RNA andanalysis of RNA levels by reversetranscription–quantitative PCR
The projected outcome of Basic Protocol 4is the production of highly pure RNA that isfree of DNA contamination. The expected re-sult of Basic Protocol 5 is the efficient reversetranscription of 1 μg of RNA into its com-plementary DNA (cDNA), which should becontaminant free and ready for use in qPCR.The anticipated outcome of Basic Protocol 6 isaccurate extrapolation of the relative transcriptabundance for each gene in each sample testedin the optimized qPCR procedure.
Basic Protocol 7: Using the TetheredFunction Assay to investigate NMD
Anticipating the results produced by suchassays is impossible because the success andthe results of such an approach are entirelycase specific. However, these assays have beenvery successfully utilized for studying NMD,and will most likely continue to be worthwhileas more NMD factors are found. It should beborne in mind that while this is a powerfulmethod, it is artificial, and only positive re-sults are meaningful. Interpretations cannot bemade when no effects have been observed.
Time Considerations
Basic Protocol 1: Creation of PTC+mRNAs and mutant NMD proteins bysite-directed mutagenesis
After designing and ordering the oligonu-cleotide primers, it may take up to 1 week untilyou receive them. During this time, the high-quality template DNA can be prepared. The

Analysis ofNonsense-
Mediated mRNADecay
27.4.56
Supplement 55 Current Protocols in Cell Biology
PCR reaction, DpnI digestion, and transforma-tion into competent bacteria can be completedin a day. Picking colonies to inoculate culturesand plasmid DNA preparation will take 2 days.The length of time for DNA sequencing anal-ysis will depend upon specific laboratory fa-cilities and may take 1 day to several weeks.The Lightning kits from Agilent Technologieshave been specifically made to reduce the timeaspect of this procedure, and the use of this kithas also been outlined in Basic Protocol 1.
Basic Protocol 2: pSUPuro-based RNAi toknock down NMD factors
Once the pSUPuro plasmid expressing ashRNA against your gene of choice has beencreated and tested, which can take severalweeks or even longer if initial target sequenceswork inefficiently and new targets need to bedesigned or further optimizations are required,no further time or money has to be invested increating this tool again, and a research labora-tory can build up a large repertoire of plasmidsto knock down many genes. Then, the exper-iment itself, from seeding the cells to proteinand RNA analysis, should take a minimum of7 to 8 days each time.
Basic Protocol 3: NMD complementationassays
Construction of all the plasmids necessaryfor this experiment will initially take a com-paratively long time because it will involvecloning and site-directed mutagenesis. Thevalidation of the pSUPuro based knockdownand the titration of the expression plasmidsto achieve similar expression levels will alsotake a reasonable length of time, dependingon how much optimization may be required inboth cases. After complete preparation of theplasmids, the experiment itself from seedingthe cells to protein and RNA analysis shouldtake a minimum of 7 to 8 days each time.
Basic Protocols 4-6: Extraction of RNA andanalysis of RNA levels by reversetranscription-quantitative PCR
The extraction, isolation, DNase treatment,spectrophotometric quantification of RNA,and RT reaction should take less than 4 hr de-pending on sample numbers. The qPCR mayinitially take some time to optimize all the pa-rameters, but after this initial optimization andwith the use of the fast-chemistry qPCR mastermixes detailed in Basic Protocol 6, the actualqPCR running time for a TaqMan assay canbe only 60 min, and slightly longer (70 min)for SYBR Green assays due to the inclusion ofthe melting curve at the end of the run. In fact,
the Brillant II Fast qPCR master mix is soonto be replaced by an even faster qPCR mastermix, meaning that the run-time for TaqManassays could take less than 60 min. Therefore,in Basic Protocols 4 to 6, extraction of totalRNA from cells to an accurate measurementof mRNA levels by RT-qPCR can be carriedout in one working day.
Basic Protocol 7: Using the TetheredFunction Assay to investigate NMD
While the assay seems quite straightfor-ward, several issues that have been discussedshould be considered at the outset in design-ing a tethering experiment (see Fig. 27.4.6),and thus establishing this assay may take sometime. Once it has been established, it can be ex-panded by tethering more factors, introducingmutations into the test proteins, or performingthe assays in cells that are depleted of certainfactors. In summary, the more elaborate thesystem, the longer it will take.
Literature CitedAndersen, C.L., Jensen, J.L., and Orntoft, T.F.
2004. Normalization of real-time quantitativereverse transcription-PCR data: A model-basedvariance estimation approach to identify genessuited for normalization, applied to bladder andcolon cancer data sets. Cancer Res. 64:5245-5250.
Arias-Palomo, E., Yamashita, A., Fernandez, IS.,Nunez-Ramırez, R., Bamba, Y., Izumi, N.,Ohno, S., and Llorca, O. 2011. The nonsense-mediated mRNA decay SMG-1 kinase is reg-ulated by large-scale conformational changescontrolled by SMG-8. Genes Dev. 25:153-164.
Bardwell, V.J. and Wickens, M. 1990. Purificationof RNA and RNA-protein complexes by an R17coat protein affinity method. Nucleic Acids Res.18:6587-6594.
Bartel, D.P. 2009. MicroRNAs: Target recognitionand regulatory functions. Cell 136:215-233.
Battaglia, M., Pedrazzoli, P., Palermo, B., Lanza,A., Bertolini, F., Gibelli, N., Da Prada, G.A.,Zambelli, A., Perotti, C., and Robustelli dellaCuna, G. 1998. Epithelial tumour cell detectionand the unsolved problems of nested RT-PCR: Anew sensitive one step method without false pos-itive results. Bone Marrow Transplant. 22:693-698.
Beach, D.L., Salmon, E.D., and Bloom, K. 1999.Localization and anchoring of mRNA in bud-ding yeast. Curr. Biol. 9:569-578.
Bernstein, E., Caudy, A.A., Hammond, S.M., andHannon, G.J. 2001. Role for a bidentate ribonu-clease in the initiation step of RNA interference.Nature 409:363-366.
Bertrand, E., Chartrand, P., Schaefer, M., Shenoy,S.M., Singer, R.H., and Long, R.M. 1998. Lo-calization of ASH1 mRNA particles in livingyeast. Mol. Cell 2:437-445.

RNA-BasedMethods in CellBiology
27.4.57
Current Protocols in Cell Biology Supplement 55
Bhattacharya, A., Czaplinski, K., Trifillis, P., He,F., Jacobson, A., and Peltz, S.W. 2000. Charac-terization of the biochemical properties of thehuman Upf1 gene product that is involved innonsense-mediated mRNA decay. RNA 6:1226-1235.
Brogna, S. and Wen, J. 2009. Nonsense-mediatedmRNA decay (NMD) mechanisms. Nat. Struct.Mol. Biol. 16:107-113.
Brummelkamp, T.R., Bernards, R., and Agami, R.2002. A system for stable expression of shortinterfering RNAs in mammalian cells. Science296:550-553.
Buchwald, G., Ebert, J., Basquin, C., Sauliere, J.,Jayachandran, U., Bono, F., Le Hir, H., andConti, E. 2010. Insights into the recruitment ofthe NMD machinery from the crystal structureof a core EJC-UPF3b complex. Proc. Natl. Acad.Sci. U.S.A. 107:10050-100555.
Buhler, M., Paillusson, A., and Muhlemann, O.2004. Efficient downregulation of immunoglob-ulin mu mRNA with premature translation-termination codons requires the 5′-half of theVDJ exon. Nucleic Acids Res. 32:3304-3315.
Bustin, S.A. 2000. Absolute quantification ofmRNA using real-time reverse transcriptionpolymerase chain reaction assays. J. Mol. En-docrinol. 25:169-193.
Bustin, S.A. 2005. Real-time, fluorescence-basedquantitative PCR: A snapshot of current proce-dures and preferences. Expert Rev. Mol. Diagn.5:493-498.
Carter, M.S., Doskow, J., Morris, P., Li, S., Nhim,R.P., Sandstedt, S., and Wilkinson, M.F. 1995.A regulatory mechanism that detects prematurenonsense codons in T-cell receptor transcripts invivo is reversed by protein synthesis inhibitorsin vitro. J. Biol. Chem. 270:28995-29003.
Chang, J.C. and Kan, Y.W. 1979. Beta 0 tha-lassemia, a nonsense mutation in man. Proc.Natl. Acad. Sci. U.S.A. 76:2886-2889.
Chang, Y.F., Imam, J.S., and Wilkinson, M.F. 2007.The nonsense-mediated decay RNA surveil-lance pathway. Annu. Rev. Biochem. 76:51-74.
Cho, H., Kim, K.M., and Kim, Y.K. 2009. Humanproline-rich nuclear receptor coregulatory pro-tein 2 mediates an interaction between mRNAsurveillance machinery and decapping complex.Mol. Cell 33:75-86.
Choe, J., Cho, H., Lee, H.C., and Kim, Y.K. 2010.microRNA/Argonaute 2 regulates nonsense-mediated messenger RNA decay. EMBO Rep.11:380-386.
Choe, J., Cho, H., Chi, S.G., and Kim, Y.K.2011. Ago2/miRISC-mediated inhibition ofCBP80/20-dependent translation and therebyabrogation of nonsense-mediated mRNA decayrequire the cap-associating activity of Ago2.FEBS Lett. 585:2682-2687.
Chomczynski, P. and Sacchi, N. 1987. Single-step method of RNA isolation by acid guani-dinium thiocyanate-phenol-chloroform extrac-tion. Anal. Biochem. 162:156-159.
Chomczynski, P. and Sacchi, N. 2006. The single-step method of RNA isolation by acid guani-dinium thiocyanate-phenol-chloroform extrac-tion: Twenty-something years on. Nat. Protoc.1:581-585.
Clerici, M., Mourao, A., Gutsche, I., Gehring, N.H.,Hentze, M.W., Kulozik, A., Kadlec, J., Sat-tler, M., and Cusack, S. 2009. Unusual bipar-tite mode of interaction between the nonsense-mediated decay factors, UPF1 and UPF2. EMBOJ. 28:2293-2306.
Coller, J. and Wickens, M. 2002. Tethered functionassays using 3′ untranslated regions. Methods26:142-150.
Coller, J. and Wickens, M. 2007. Tethered functionassays: An adaptable approach to study RNAregulatory proteins. Methods Enzymol. 429:299-321.
Coller, J.M., Gray, N.K., and Wickens, M.P. 1998.mRNA stabilization by poly(A) binding proteinis independent of poly(A) and requires transla-tion. Genes Dev. 12:3226-3235.
Darzacq, X., Shav-Tal, Y., de Turris, V., Brody, Y.,Shenoy, S.M., Phair, R.D., and Singer, R.H.2007. In vivo dynamics of RNA polymeraseII transcription. Nat. Struct. Mol. Biol. 14:796-806.
De Gregorio, E., Preiss, T., and Hentze, M.W. 1999.Translation driven by an eIF4G core domain invivo. EMBO J. 18:4865-4874.
Denning, G., Jamieson, L., Maquat, L.E.,Thompson, E.A., and Fields, A.P. 2001.Cloning of a novel phosphatidylinositol kinase-related kinase: characterization of the humanSMG-1 RNA surveillance protein. J. Biol.Chem. 276:22709-22714.
de Turris, V., Nicholson, P., Orozco, R.Z., Singer,R.H., and Muhlemann, O. 2011. Cotranscrip-tional effect of a premature termination codonrevealed by live-cell imaging. RNA 17:2094-2107.
Doma, M.K. and Parker, R. 2007. RNA quality con-trol in eukaryotes. Cell 131:660-668.
Eberle, A.B., Stalder, L., Mathys, H., Orozco, R.Z.,and Muhlemann, O. 2008. Posttranscriptionalgene regulation by spatial rearrangement of the3′ untranslated region. PLoS Biol. 6:e92.
Eberle, A.B., Lykke-Andersen, S., Muhlemann, O.,and Jensen, T.H. 2009. SMG6 promotes endonu-cleolytic cleavage of nonsense mRNA in humancells. Nat. Struct. Mol. Biol. 16:49-55.
Echeverri, C.J. and Perrimon, N. 2006. High-throughput RNAi screening in cultured cells: Auser’s guide. Nat. Rev. Genet. 7:373-384.
Elbashir, S.M., Lendeckel, W., and Tuschl, T. 2001.RNA interference is mediated by 21- and 22-nucleotide RNAs. Genes Dev. 15:188-200.
Fernandez, I.S., Yamashita, A., Arias-Palomo, E.,Bamba, Y., Bartolome, R.A., Canales, M.A.,Teixido, J., Ohno, S., Llorca, O. 2011. Charac-terization of SMG-9, an essential component ofthe nonsense-mediated mRNA decay SMG1Ccomplex. Nucleic Acids Res. 39:347-358.

Analysis ofNonsense-
Mediated mRNADecay
27.4.58
Supplement 55 Current Protocols in Cell Biology
Finoux, A.L. and Seraphin, B. 2006. In vivo tar-geting of the yeast Pop2 deadenylase subunit toreporter transcripts induces their rapid degrada-tion and generates new decay intermediates. J.Biol. Chem. 281:25940-25947.
Fire, A., Xu, S., Montgomery, M.K., Kostas, S.A.,Driver, S.E., and Mello, C.C. 1998. Potentand specific genetic interference by double-stranded RNA in Caenorhabditis elegans. Na-ture 391:806-811.
Fisher, C.L. and Pei, G.K. 1997. Modification ofa PCR-based site-directed mutagenesis method.BioTechniques 23:570-574.
Fleige, S. and Pfaffl, M.W. 2006. RNA integrityand the effect on the real-time qRT-PCR perfor-mance. Mol. Aspects Med. 27:126-139.
Freshney, R.I. 2010. Culture of Animal Cells: AManual of Basic Technique and Specialized Ap-plications" 6th ed. Wiley-Blackwell, Hoboken,New Jersey.
Fribourg, S., Gatfield, D., Izaurralde, E., and Conti,E. 2003. A novel mode of RBD-protein recog-nition in the Y14-Mago complex. Nat. Struct.Biol. 10:433-439.
Frischmeyer, P.A. and Dietz, H.C. 1999. Nonsense-mediated mRNA decay in health and disease.Hum. Mol. Genet. 8:1893-1900.
Fukuhara, N., Ebert, J., Unterholzner, L., Lindner,D.,Izaurralde, E., and Conti, E. 2005. SMG7 isa 14-3-3-like adaptor in the nonsense-mediatedmRNA decay pathway. Mol. Cell 17:537-547.
Gehring, N.H., Neu-Yilik, G., Schell, T. Hentze,M.W., and Kulozik, A.E. 2003. Y14 and hUpf3bform an NMD-activating complex. Mol. Cell11:939-949.
Gehring, N.H., Kunz, J.B., Neu-Yilik, G., Breit, S.,Viegas, M.H., Hentze, M.W. , and Kulozik, A.E.2005. Exon-junction complex components spec-ify distinct routes of nonsense-mediated mRNAdecay with differential cofactor requirements.Mol. Cell 20:65-75.
Gibson, U.E., Heid, C.A., and Williams, P.M. 1996.A novel method for real time quantitative RT-PCR. Genome Res. 6:995-1001.
Glavan, F., Behm-Ansmant, I., Izaurralde, E., andConti, E. 2006. Structures of the PIN domainsof SMG6 and SMG5 reveal a nuclease withinthe mRNA surveillance complex. EMBO J.25:5117-5125.
Graveley, B.R. and Maniatis, T. 1998.Arginine/serine-rich domains of SR pro-teins can function as activators of pre-mRNAsplicing. Mol. Cell 1:765-771.
Gray, N.K., Coller, J.M., Dickson, K.S., and Wick-ens, M. 2000. Multiple portions of poly(A)-binding protein stimulate translation in vivo.EMBO J. 19:4723-4733.
Grskovic, M., Hentze, M.W., and Gebauer, F.2003. A co-repressor assembly nucleated bySex-lethal in the 3′UTR mediates translationalcontrol of Drosophila msl-2 mRNA. EMBO J.22:5571-5581.
Haley, B. and Zamore, P.D. 2004. Kinetic analysisof the RNAi enzyme complex. Nat. Struct. Mol.Biol. 11:599-606.
Heid, C.A., Stevens, J., Livak, K.J., and Williams,P.M. 1996. Real time quantitative PCR. GenomeRes. 6:986-994.
Hock, J. and Meister, G. 2008. The Argonaute pro-tein family. Genome Biol. 9:210.
Holbrook, J.A., Neu-Yilik, G., Hentze, M.W., andKulozik, A.E. 2004. Nonsense-mediated decayapproaches the clinic. Nat. Genet. 36:801-808.
Holland, P.M., Abramson, R.D., Watson, R., andGelfand, D.H. 1991. Detection of specific poly-merase chain reaction product by utilizing the5′→3′ exonuclease activity of Thermus aquati-cus DNA polymerase. Proc. Natl. Acad. Sci.U.S.A. 88:7276-7280.
Hosoda, N., Kim, Y.K., Lejeune, F., and Maquat,L.E. 2005. CBP80 promotes interaction of Upf1with Upf2 during nonsense-mediated mRNA de-cay in mammalian cells. Nat. Struct. Mol. Biol.12:893-901.
Huggett, J., Dheda, K., Bustin, S., and Zumla, A.2005. Real-time RT-PCR normalisation: Strate-gies and considerations. Genes Immun. 6:279-284.
Huntzinger, E., Kashima, I., Fauser, M., Sauliere,J., Izaurralde, E. 2008. SMG6 is the catalyticendonuclease that cleaves mRNAs containingnonsense codons in metazoan. RNA 14:2609-2617.
Hutchison, C.A., 3rd, Phillips, S., Edgell, M.H.,Gillam, S., Jahnke, P., and Smith, M. 1978. Mu-tagenesis at a specific position in a DNA se-quence. J. Biol. Chem. 253:6551-6560.
Isken, O. and Maquat, L.E. 2007. Quality controlof eukaryotic mRNA: Safeguarding cells fromabnormal mRNA function. Genes Dev. 21:1833-1856.
Isken, O., Kim, Y.K, Hosoda, N., Mayeur, G.L.,Hershey, J.W., and Maquat, L.E. 2008. Upf1phosphorylation triggers translational repres-sion during nonsense-mediated mRNA decay.Cell 133:314-327.
Ivanov, P.V., Gehring, N.H., Kunz, J.B., Hentze,M.W., and Kulozik, A.E. 2008. Interactions be-tween UPF1, eRFs, PABP and the exon junctioncomplex suggest an integrated model for mam-malian NMD pathways. EMBO J. 27:736-747.
Jinek, M. and Doudna, J.A. 2009. A three-dimensional view of the molecular machineryof RNA interference. Nature 457:405-412.
Kadlec, J., Izaurralde, E., and Cusack, S.2004. source asis for the interaction betweennonsense-mediated mRNA decay factors UPF2and UPF3. Nat. Struct. Mol. Biol. 11:330-337.
Kashima, I., Yamashita, A., Izumi, N., Kataoka,N., Morishita, R., Hoshino, S., Ohno, M., Drey-fuss, G., and Ohno, S. 2006. Binding of a novelSMG-1-Upf1-eRF1-eRF3 complex (SURF) tothe exon junction complex triggers Upf1 phos-phorylation and nonsense-mediated mRNA de-cay. Genes Dev. 20:355-367.

RNA-BasedMethods in CellBiology
27.4.59
Current Protocols in Cell Biology Supplement 55
Kashima, I., Jonas, S., Jayachandran, U., Buchwald,G., Conti, E., Lupas, A.N., and Izaurralde, E.2010. SMG6 interacts with the exon junctioncomplex via two conserved EJC-binding motifs(EBMs) required for nonsense-mediated mRNAdecay. Genes Dev. 24:2440-2450.
Keryer-Bibens, C., Barreau, C., and Osborne, H.B.2008. Tethering of proteins to RNAs by bacte-riophage proteins. Biol. Cell. 100:125-138.
Khajavi, M., Inoue, K., and Lupski, J.R. 2006.Nonsense-mediated mRNA decay modulatesclinical outcome of genetic disease. Eur. J. Hum.Genet. 14:1074-1081.
Kubista, M., Andrade, J.M., Bengtsson, M., Fo-rootan, A., Jonak, J., Lind, K., Sindelka,R., Sjoback, R., Sjogreen, B., Strombom, L.,Stahlberg, A., and Zoric, N. 2006. The real-timepolymerase chain reaction. Mol. Aspects Med.27:95-125.
Kunz, J.B., Neu-Yilik, G., Hentze, M.W., Ku-lozik, A.E., and Gehring, N.H. 2006. Functionsof hUpf3a and hUpf3b in nonsense-mediatedmRNA decay and translation. RNA 12:1015-1022.
Kuzmiak, H.A. and Maquat, L.E. 2006. Apply-ing nonsense-mediated mRNA decay researchto the clinic: Progress and challenges. TrendsMol. Med. 12:306-316.
Larson, D.R., Zenklusen, D. , Wu, B., Chao, J.A.,and Singer, R.H. 2011. Real-time observationof transcription initiation and elongation on anendogenous yeast gene. Science 332:475-478.
Lee, S.K. and Kumar, P. 2009. Conditional RNAi:Towards a silent gene therapy. Adv. Drug Deliv.Rev. 61:650-664.
Lewis, B.P., Green, R.E., and Brenner, S.E. 2003.Evidence for the widespread coupling of alter-native splicing and nonsense-mediated mRNAdecay in humans. Proc. Natl. Acad. Sci. U.S.A.100:189-192.
Liss, B. 2002. Improved quantitative real-time RT-PCR for expression profiling of individual cells.Nucleic Acids Res. 30:e89.
Livak, K.J. 1997. Comparative Ct method. ABIPrism 7700 Sequence Detection System. UserBulletin no. 2. PE Applied Biosystems.
Livak, K.J. and Schmittgen, T.D. 2001. Analysisof relative gene expression data using real-timequantitative PCR and the 2(-Delta Delta C(T))Method. Methods 25:402-408.
Losson, R. and Lacroute, F. 1979. Interference ofnonsense mutations with eukaryotic messengerRNA stability. Proc. Natl. Acad. Sci. U.S.A.76:5134-5137.
Lykke-Andersen, J., Shu, M.D., and Steitz, J.A.2000. Human Upf proteins target an mRNA fornonsense-mediated decay when bound down-stream of a termination codon. Cell 103:1121-1131.
Lykke-Andersen, J., Shu, M.D., and Steitz, J.A.2001. Communication of the position of exon-exon junctions to the mRNA surveillancemachinery by the protein RNPS1. Science293:1836-1839.
Mackay, I.M., Arden, K.E., and Nitsche, A. 2002.Real-time PCR in virology. Nucleic Acids Res.30:1292-1305.
Maquat, L.E. 1995. When cells stop making sense:Effects of nonsense codons on RNA metabolismin vertebrate cells. RNA 1:453-465.
Maquat, L.E., Kinniburgh, A.J., Rachmilewitz,E.A., and Ross, J. 1981. Unstable beta-globinmRNA in mRNA-deficient beta o thalassemia.Cell 27:543-553.
Minshall, N., Thom, G., and Standart, N. 2001.A conserved role of a DEAD box helicase inmRNA masking. RNA 7:1728-1742.
Muller, P.Y., Janovjak, H., Miserez, A.R., and Dob-bie, Z. 2002. Processing of gene expression datagenerated by quantitative real-time RT-PCR.BioTechniques 32:1372-1379.
Nicholson, P., Yepiskoposyan, H., Metze, S., Zamu-dio Orozco, R., Kleinschmidt, N., and Muhle-mann, O. 2009. Nonsense-mediated mRNA de-cay in human cells: Mechanistic insights, func-tions beyond quality control and the double-lifeof NMD factors. Cell Mol. Life Sci. 67:677-700.
Nott, A., Le Hir, H., and Moore, M.J. 2004. Splicingenhances translation in mammalian cells: An ad-ditional function of the exon junction complex.Genes Dev. 18:210-222.
Nowotny, M. and Yang, W. 2009. Structural andfunctional modules in RNA interference. Curr.Opin. Struct. Biol. 19:286-293.
Ochi, A., Hawley, R.G., Hawley, T., Shulman, M.J.,Traunecker, A., Kohler, G., and Hozumi, N.1983. Functional immunoglobulin M produc-tion after transfection of cloned immunoglobu-lin heavy and light chain genes into lymphoidcells. Proc. Natl. Acad. Sci. U.S.A. 80:6351-6355.
Ohnishi, T., Yamashita, A., Kashima, I., Schell,T., Anders, K.R., Grimson, A., Hachiya, T.,Hentze, M.W., Anderson, P., and Ohno, S. 2003.Phosphorylation of hUPF1 induces formationof mRNA surveillance complexes containinghSMG-5 and hSMG-7. Mol. Cell 12:1187-1200.
Paillusson, A., Hirschi, N., Vallan, C., Azzalin,C.M., and Muhlemann, O. 2005. A GFP-basedreporter system to monitor nonsense-mediatedmRNA decay. Nucleic Acids Res. 33:e54.
Pfaffl, M.W. 2001. A new mathematical model forrelative quantification in real-time RT-PCR. Nu-cleic Acids Res. 29:e45.
Pfaffl, M.W., Tichopad, A., Prgomet, C., andNeuvians, T.P. 2004. Determination of stablehousekeeping genes, differentially regulated tar-get genes and sample integrity: BestKeeper—Excel-based tool using pair-wise correlations.Biotechnol. Lett. 26:509-515.
Rasmussen, R., Meuer, S., Wittwer, C., and Naka-gawara, K. (eds.) 2001. Quantification on theLightCycler, Springer-Verlag, Berlin. pp. 21-342.
Rebbapragada, I. and Lykke-Andersen, J. 2009.Execution of nonsense-mediated mRNA decay:What defines a substrate? Curr. Opin. Cell Biol.21:394-402.

Analysis ofNonsense-
Mediated mRNADecay
27.4.60
Supplement 55 Current Protocols in Cell Biology
Redon, S., Reichenbach, P., and Lingner, J. 2007.Protein RNA and protein protein interactionsmediate association of human EST1A/SMG6with telomerase. Nucleic Acids Res. 35:7011-7022.
Rehwinkel, J., Raes, J., and Izaurralde, E. 2006.Nonsense-mediated mRNA decay: Target genesand functional diversification of effectors.Trends Biochem. Sci. 31:639-646.
Ruiz-Echevarria, M.J. and Peltz, S.W. 2000. TheRNA binding protein Pub1 modulates the sta-bility of transcripts containing upstream openreading frames. Cell 101:741-751.
Sambrook, J. and Russell, D. 2000. MolecularCloning: A Laboratory Manual. 3rd Revisededition. Cold Spring Harbor Laboratory, NewYork.
Serin, G., Gersappe, A., Black, J.D., Aronoff, R.,Maquat, L.E. 2001. Identification and char-acterization of human orthologues to Saccha-romyces cerevisiae Upf2 protein and Upf3 pro-tein (Caenorhabditis elegans SMG-4). Mol. CellBiol. 21:209-223.
Silva, A.L., Ribeiro, P., Inacio, A., Liebhaber,S.A., and Romao, L. 2008. Proximity of thepoly(A)-binding protein to a premature termi-nation codon inhibits mammalian nonsense-mediated mRNA decay. RNA 14:563-576.
Simpson, D.A., Feeney, S., Boyle, C., and Stitt,A.W. 2000. Retinal VEGF mRNA measuredby SYBR green I fluorescence: A versatile ap-proach to quantitative PCR. Mol. Vision 6:178-183.
Singer, R.H., Lawrence, D.S., Ovryn, B., and Con-deelis, J. 2005. Imaging of gene expressionin living cells and tissues. J. Biomed. Optics10:051406.
Siomi, H. and Siomi, M.C. 2009. On the roadto reading the RNA-interference code. Nature457:396-404.
Stripecke, R., Oliveira, C.C., McCarthy, J.E., andHentze, M.W. 1994. Proteins binding to 5′ un-translated region sites: A general mechanismfor translational regulation of mRNAs in hu-man and yeast cells. Mol. Cell Biol. 14:5898-5909.
Sun, X., Perlick, H.A., Dietz, H.C., and Maquat,L.E. 1998. A mutated human homologue toyeast Upf1 protein has a dominant-negative ef-fect on the decay of nonsense-containing mR-NAs in mammalian cells. Proc. Natl. Acad. Sci.U.S.A. 95:10009-10014.
Tichopad, A., Didier, A., and Pfaffl, M.W. 2004.Inhibition of real-time RT-PCR quantificationdue to tissue-specific contaminants. Mol. CellProbes 18:45-50.
Unterholzner, L. and Izaurralde, E. 2004. SMG7acts as a molecular link between mRNA surveil-lance and mRNA decay. Mol. Cell 16:587-596.
Valegard, K., Murray, J.B., Stockley, P.G., Stone-house, N.J., and Liljas, L. 1994. Crystal structure
of an RNA bacteriophage coat protein-operatorcomplex. Nature 371:623-626.
Vandesompele, J., De Preter, K., Pattyn, F., Poppe,B., Van Roy, N., De Paepe, A., and Speleman, F.2002. Accurate normalization of real-time quan-titative RT-PCR data by geometric averaging ofmultiple internal control genes. Genome Biol.3:RESEARCH0034.
Wang, W. and Malcolm, B.A. 1999. Two-stagePCR protocol allowing introduction of mul-tiple mutations, deletions and insertions us-ing QuikChange Site-Directed Mutagenesis.BioTechniques 26:680-682.
Wilusz, J. 2009. RNA stability: Is it the endo’ theworld as we know it? Nat. Struct. Mol. Biol.16:9-10.
Witherell, G.W., Wu, H.N., and Uhlenbeck, O.C.1990. Cooperative binding of R17 coat proteinto RNA. Biochemistry 29:11051-11057.
Wong, M.L. and Medrano, J.F. 2005. Real-timePCR for mRNA quantitation. BioTechniques39:75-85.
Yamashita, A., Ohnishi, T., Kashima, I., Taya,Y., and Ohno, S. 2001. Human SMG-1, anovel phosphatidylinositol 3-kinase-related pro-tein kinase, associates with components of themRNA surveillance complex and is involved inthe regulation of nonsense-mediated mRNA de-cay. Genes Dev. 15:2215-2228.
Zheng, L., Baumann, U., and Reymond, J.L. 2004.An efficient one-step site-directed and site-saturation mutagenesis protocol. Nucleic AcidsRes. 32:e115.
Zipper, H., Brunner, H., Bernhagen, J., andVitzthum, F. 2004. Investigations on DNA in-tercalation and surface binding by SYBR GreenI., its structure determination and methodolog-ical implications. Nucleic Acids Res. 32:e103.
INTERNET RESOURCES
Basic Protocol 1: Creation of PTC+ mRNAs andmutant NMD proteins by site-directed mutage-nesis
For designing all types of primers:
http://www.geneinfinity.org/sp/sp oligo.htmlFor creating mutagenic primers:
http://www.bioinformatics.org/primerx/Codon usage table:
http://www.my-whiteboard.com/the-human-codon-usage-table/
Basic Protocol 2: pSUPuro-based RNAi to knockdown NMD factors
To design shRNA oligonucleotides:
http://www.dharmacon.com/designcenter/design-centerpage.aspx
http://www.eu.idtdna.com/Scitools/Applications/shRNA/default.aspx
http://www.oligoengine.com

RNA-BasedMethods in CellBiology
27.4.61
Current Protocols in Cell Biology Supplement 55
Basic Protocols 4 to 6: Extraction of RNA andanalysis of RNA levels by reverse transcription–
quantitative PCRFor designing qPCR primers/probes:
http://www.eu.idtdna.com/scitools/Applications/RealTimePCR/
http://www.primer3.sourceforge.netTo BLAST designed primers/probes againstdatabases to check their specificity:
http://www.ncbi.nlm.nih.gov/tools/primer-blast/A Web site that offers software products and ser-vices that are desirable for aiding with qPCRprimer/probe design (as well as for many other tech-niques such as mutagenesis, cloning, PCR, etc.):
http://www.PremierBiosoft.comSoftware’s to help find the best normalizer for yourexperiment:
geNorm software (Vandesompele et al., 2002)
BestKeeper software (Pfaffl et al., 2004)
Norm-Finder software (Andersen et al., 2004)