Embed Size (px)
Citation preview

IntroductionT helper cells have classically been divided into two dominant effector subsets named Th1 and Th2 cells. Th1 cells activate macrophages and are highly effective in clearing intracellular pathogens. They are coupled to the sequential actions of IFN-g and IL-12. Th2 cells, whose differentiation is driven by IL-4, are important for the production of immunoglobulin E and the clearance of extracellular organisms (Kimura and Kishimoto 2011). T helper cells producing IL-17 (Th17) are a new subset of T helper cells found to be associated with autoimmune diseases, such as rheumatoid arthritis, multiple sclerosis, psoriasis, and lupus (Di Cesare et al. 2009, Garrett-Sinha et al. 2008, Kebir et al. 2007, Shahrara et al. 2008, Sospedra and Martin 2008). In mice, Th17 differentiation and expansion is regulated by various cytokines, such as TGF-b, IL-6, IL-1b, TNF-a, and IL-23. The development of Th17 cells is negatively regulated by IFN-g and IL-27 (Harrington et al. 2005, Stumhofer et al. 2006). The IL-17 family is composed of IL-17A, IL-17B, IL-17C, IL-17D, IL-17E (IL-25), and IL-17F (Kimura and Kishimoto 2011).
Using Luminex xMAP technology (Dale et al. 2008) and bulletin 5405, Bio-Rad has developed 32 mouse cytokine assays. These are configured into a mouse group I 23-plex and a mouse group II 9-plex (Table 1). To further expand our Bio-Plex Pro Mouse Cytokine Assay menu for Th17 studies, a mouse Th17 cytokine panel that includes ten new assays plus ICAM-1 was created (Table 1). These markers were selected because of their direct relevance to the mouse Th17 pathway. Including the six existing assays in mouse cytokine group I (green dots), a total of 17 mouse assays are available for the study of the mouse Th17 pathway (Table 1).
The validation studies described in this tech note cover the ten markers in the mouse Th17 panel. The assays were validated with mouse serum, plasma, and cell culture matrices. Validation criteria include assay working range lower and upper limit of quantification (LLOQ/ULOQ), sensitivity (limit of detection [LOD]), intra- and inter-assay precision, specificity and cross-reactivity, linearity of dilution, and parallelism to evaluate robustness in the key sample matrices mentioned above.
Table 1. Bio-Plex Pro Mouse Cytokine Assay menu.
Mouse Mouse Mouse Group I Group II Th17
Mouse Assay 1-Plex 23-Plex 9-Plex 10-Plex
IL-1b • • IL-6 • • IL-10 • • IL-17A • • IFN-g • • TNF-a • • IL-1a • • IL-2 • • IL-3 • • IL-4 • • IL-5 • • IL-9 • • IL-12 (p40) • • IL-12 (p70) • • IL-13 • • Eotaxin • • G-CSF • • GM-CSF • • KC • • MCP-1 • • MIP-1a • • MIP-1b • • RANTES • • IL-17F • • IL-21 • • IL-22 • • IL-23 • • IL-25 • • IL-27 • • IL-31 • • IL-33 • • CD40L • • MIP-3a • • ICAM-1 • • IL-15 • • IL-18 • Basic FGF • • LIF • • M-CSF • • MIG • • MIP-2 • • PDGF-BB • • VEGF • •
(•) refers to the cytokines not related to Th17. (•) refers to a subset of Th17 relevant mouse cytokines available as 6-plex and 10-plex panels. (•) ICAM-1 is a mouse Th17 singleplex assay that cannot be multiplexed.
Bio-Plex Pro Multiplex Assays
David Peretz, Life Science Group, Bio-Rad Laboratories, Inc., 2000 Alfred Nobel Drive, Hercules, CA 94547 USA
Analysis of Murine Th17 Cytokine Profiles Using Bio-Plex Pro Mouse Th17 Panel
Bulletin 6118

© 2020 Bio-Rad Laboratories, Inc. 2 Bulletin 6118
Analysis of Murine Th17 Cytokine Profiles Using Bio-Plex Pro Mouse Th17 Panel
MethodsThe mouse cytokine assays were designed according to a capture sandwich immunoassay format (Figure 1). The capture antibody–coupled beads were first incubated with antigen standards or samples followed by incubation with biotinylated detection antibodies. After washing away the unbound biotinylated antibodies, the beads were incubated with a reporter streptavidin-phycoerythrin (SA-PE) conjugate. Following removal of excess SA-PE, the beads were passed through the Bio-Plex Array Reader, which measures the fluorescence of the bead and of the bound SA-PE. Incubations were performed at room temperature for durations shown in Table 2. All washes were performed using a Bio-Plex Pro Wash Station. Data acquisition was performed using Bio-Plex Manager Software 6.2 at low photomultiplier tube setting.
ResultsAssay Performance and Quality
Performance characteristics of the Th17 assays were examined according to the following parameters: assay sensitivity, precision, accuracy, assay working range, cross-reactivity, matrix effects, and validation with biological samples. Assay sensitivity, defined as LOD, was evaluated by adding two standard deviations to the mean median fluorescence intensity (MFI) of 11 zero standard replicates. Of the 11 assays investigated, three (IL-22, IL-27, and MIP-3a) were detected in serum at ≤1 pg/ml, four (IL-17F, IL-21, IL-25, and CD40L) at ≤10 pg/ml, and four (IL-23, IL-31, IL-33, and ICAM-1) at ≤40 pg/ml (Table 3). The results in cell culture media showed comparable performance, with the exception of IL-21 and IL-23, which recorded greater than 10 pg/ml difference and higher and lower LOD, respectively.
Table 2. Bio-Plex Pro Mouse Cytokine Assay incubation and detection guidelines.
Incubation Time, min
Samples + Beads Detection Antibody SA-PE
All panels 30 30 10
Table 3. Limit of detection (pg/ml) in serum and cell culture media.
Matrix IL-1
7F
IL-2
1
IL-2
2
IL-2
3
IL-2
5
IL-2
7
IL-3
1
IL-3
3
CD
40L
MIP
-3a
ICA
M-1
*
Serum 8 7 0.5 32 3 1 36 22 4 1 14
Cell culture media
3 41 1 20 4 3 38 28 4 1 16
* Values derived from singleplex format.
Fig. 1. Schematic representation of a sandwich-based Bio-Plex Pro Assay workflow.
Step One: Dispense capture beads Wash plate 2 times
Step Four: Add reporter dye Incubate Wash plate 3 times
Step Two: Add samples Incubate Wash plate 3 times
Step Three: Add detection antibody Incubate Wash plate 3 times
Step Five: Resuspend beads
Classify and quantify using fluorescence Analyze data
Classification laserReporter laser
© 2020 Bio-Rad Laboratories, Inc. 3 Bulletin 6118
Analysis of Murine Th17 Cytokine Profiles Using Bio-Plex Pro Mouse Th17 Panel
Assay accuracy (also defined as recovery) was calculated as the percentage of the observed concentration value of a target antigen relative to the expected value. This parameter was evaluated using standard points and spiked controls in both multiplex and singleplex configurations, and in both serum and cell culture media. Overall, the standard recovery is comparable in both matrices, with most targets recovering 80–120% (Table 6).
Assay specificity was examined by performing single-antigen and single-detection cross-reactivity studies. The single-antigen study evaluates the specificity of a capture antibody. This was conducted by testing an individual antigen in the presence of multiplexed capture beads and detection antibody. The single-detection study evaluates the specificity of the detection antibody. This was conducted by testing the individual detection antibody in the presence of multiplexed antigens and capture beads. In this study cross-reactivity was performed specifically on the relevant Th17 markers in the 6-plex and 10-plex panels. Data analysis was weighted on the second highest standard concentration point. The results showed that the degree of cross-reactivity within each panel is well below 1% (data not shown).
Linearity of dilution was assessed by spiking known quantities of recombinant antigens into native serum and plasma matrices. A series of seven serially diluted spiked samples was prepared for each matrix. ICAM-1 was evaluated by using mouse serum or plasma with high endogenous levels. The observed and expected sample concentrations within assay working range were plotted for each analyte in the multiplex. The correlation coefficient (R²) value generated by linear regression analysis reflects the linearity of dilution for that assay (Table 7).
Evidence of reproducibility was reported in both intra- and inter-assay precision in serum matrix (Table 4). Intra-assay precision was calculated as the coefficient of variation (%CV) among fluorescence values of within-plate replicate wells. The precision values reflect a mean of eight standard points from three plates and two operators. Overall, these assays demonstrated a mean intra-assay %CV of ≤10%. Inter-assay precision was calculated as the mean %CV of the observed concentrations of two levels of spike controls. The precision reflects two independent assays, in which a mean inter-assay %CV of ≤10% was achieved. The precision in cell culture media was comparable or better (data not shown).
Assay working range is defined as the range between LLOQ and ULOQ in which an assay is both precise and accurate. The ranges of these assays were determined for both serum and cell culture media (Table 5). Assay working ranges were also investigated in the singleplex format using the same serum matrix. The results are generally comparable to the values obtained using the multiplex format (data not shown). The consistency of these ranges is often dictated by the overall precision in preparing the assay reagents.
Table 4. Precision profile — intra- and inter-assay %CV.
Target Standard Control
Intra-Assay %CV Intra-Assay %CV Inter-Assay 10-Plex Singleplex %CV
IL-17F 5.9 3.9 1.7 IL-21 4.4 9.1 3.2 IL-22 4.7 3.9 1.4 IL-23 4.5 4.1 1.7 IL-25 2.8 7.8 1.4 IL-27 2.7 3.9 0.4 IL-31 3.0 4.8 2.0 IL-33 3.9 7.4 2.7 CD40L 2.8 4.4 1.9 MIP-3a 2.7 4.5 2.9 ICAM-1* – 3.0 5.0
* Values derived from singleplex format.
Table 6. Percentage standard recovery.
Target S1 S2 S3 S4 S5 S6 S7 S8
IL-17F 76 126 95 99 104 99 98 101 IL-21 – 104 98 101 98 103 96 – IL-22 80 109 99 99 102 99 100 100 IL-23 101 98 102 99 100 100 100 98 IL-25 – 100 100 100 101 98 103 99 IL-27 96 107 95 101 104 97 100 101 IL-31 99 102 97 104 97 99 114 71 IL-33 105 99 99 101 99 100 99 – CD40L – 104 99 102 97 99 110 88 MIP-3a – 89 116 95 99 103 98 101 ICAM-1 – 103 98 102 96 106 95 –
Table 5. Multiplex assay working ranges in serum and cell culture media matrices.
Serum Cell Culture Media
Target LLOQ ULOQ LLOQ ULOQ
IL-17F 25 86,159 6 99,280 IL-21 30 31,793 56 56,917 IL-22 1 21,071 1 20,770 IL-23* 14 273,553 14 272,946 IL-25 5 71,463 7 74,008 IL-27 4 60,530 4 60,297 IL-31* 85 – 67 – IL-33 43 170,779 39 159,751 CD40L 8 136,300 10 106,461 MIP-3α 1 5,499 2 6,486 ICAM-1* 81 90,319 20 82,750
* Values derived from singleplex format.

© 2020 Bio-Rad Laboratories, Inc. 4 Bulletin 6118
Analysis of Murine Th17 Cytokine Profiles Using Bio-Plex Pro Mouse Th17 Panel
Analysis of Mouse Serum and Plasma Samples
The mouse Th17 assays were further validated by collecting sample measurements in various biological samples, such as mouse plasma and cell culture samples.
To study the production of cytokines related to Th17 cells, we injected mice with lipopolysaccharide (LPS), a toxin derived from the outer membrane of gram-negative bacteria, and measured cytokine concentration using the Bio-Plex Pro Mouse Th17 Cytokine 10-Plex Panel (Zambrano-Zaragoza et al. 2014, Copeland et al. 2005). Briefly, increasing concentrations of LPS solutions were prepared in phosphate buffered saline (PBS) and animals were dosed with 0.2 ml of LPS or PBS by single intraperitoneal injection. Plasma K2 ethylenediaminetetraacetic acid (EDTA) was collected 2 hr after injection and was diluted 4-fold for testing with the Bio-Plex Pro Mouse Th17 10-Plex Panel and 100-fold for testing with the ICAM-1 singleplex assay. These data clearly demonstrate the dose response increase in IL-17F, IL-22, IL-23, IL-27, MIP-3a, and ICAM-1 to LPS and the utility of these Bio-Plex Pro Assays in studying Th17 cytokines related to immunoresponse to pathogens (Figure 2). Of note is the more than 1,000-fold increase in IL-22 and IL-27.
To investigate the utility of Bio-Plex Pro Panels in detecting Th17 cytokines in cell culture growth media, EL4B5, a CD40L-expressing mouse thymoma cell line, and RAW 264.7, a commonly used model of mouse macrophages, were activated (Werner-Favre et al. 1994, Raschke et al. 1978). Growth medium was collected from EL4B5 cultures treated for 48 hr with three conditions, no compounds or combinations of two or four compounds known to stimulate T cells (Table 9), and from RAW 264.7 treated with no LPS and 10 µg/ml LPS for 16 and 48 hr (Table 10). For ease of use, the Bio-Plex Pro Mouse Th17 6-Plex, Th17 10-Plex, and ICAM-1 were blended to a 17-plex panel, and 50 µl of growth medium was tested undiluted. We observed the strongest production of IL-17A, IL-17F, IL-21, IL-22, IL-10, and IFN-γ after 48 hr treatment of condition 3 with IL-6, LPS, phorbol 12-myristate 13-acetate (PMA), and ionomycin (Figure 3). Treatment of RAW 264.7 with 10 µg/ml LPS for 48 hr led to the strongest production of IL-23, IL-25, IL-27, IL-31, IL-33, ICAM-1, IL-1b, IL-6, and TNF-a. CD40L (Figure 3) and MIP-3a (Figure 4) were generated consistently regardless of stimuli.
To support the assumption that the antibody-binding characteristics are similar between the standard reference matrix and the diluted serum or plasma sample matrices, assay parallelism was investigated by comparing the slope of the spike concentration response curve in mouse serum or plasma with that of the serum-based standard diluent.
The percentage difference is summarized in Table 8. In the serum, the level of difference ranges between 0.3 and 26%. In plasma, the difference ranges between 0.3 and 31.7%. This demonstrates assay parallelism between the standard reference matrix and the mouse serum and plasma tested.
Table 7. Dilution linearity in serum and plasma matrices.
Target
R2
Serum Plasma
IL-17F 1.00 1.00
IL-21 1.00 1.00
IL-22 0.99 1.00
IL-23 1.00 1.00
IL-25 1.00 1.00
IL-27 1.03 1.00
IL-31 1.01 1.00
IL-33 1.00 1.00
CD40L 0.99 0.99
MIP-3a 0.99 0.99
Note: ICAM-1 cannot be spiked at high concentration.
Table 8. Assay parallelism in mouse serum and plasma matrices.
Target
Slope Difference, %
Mouse Serum vs. Standard Diluent
Mouse Plasma vs. Standard Diluent
IL-17F 26.0 31.7
IL-21 –4.7 –4.0
IL-22 0.3 –2.5
IL-23 –9.3 –3.3
IL-25 4.0 2.5
IL-27 –2.2 0.3
IL-31 –0.6 –3.2
IL-33 –0.3 –4.0
CD40L –0.6 –5.9
MIP-3a 5.1 –5.4

© 2020 Bio-Rad Laboratories, Inc. 5 Bulletin 6118
Analysis of Murine Th17 Cytokine Profiles Using Bio-Plex Pro Mouse Th17 Panel
Fig. 2. Plasma from normal mice and mice treated with increasing concentrations of LPS.
Con
cent
ratio
n, p
g/m
l
LPS, mg/ml
LPS, mg/ml LPS, mg/ml LPS, mg/ml
LPS, mg/ml LPS, mg/ml
100
10
1
IL-17F
0 0.
0001
0.00
1
0.01 0.1 1 10
0 0.
0001
0.00
1
0.01 0.1 1 10 0
0.00
01
0.00
1
0.01 0.1 1 10 0
0.00
01
0.00
1
0.01 0.1 1 10
0 0.
0001
0.00
1
0.01 0.1 1 10 0
0.00
01
0.00
1
0.01 0.1 1 10
Con
cent
ratio
n, p
g/m
l 10.000
1,000
100
10
1
IL-22
Con
cent
ratio
n, p
g/m
l 1,000
100
10
1
IL-23
Con
cent
ratio
n, p
g/m
l 100,000
10,000
1,000
100
10
1
IL-27
Con
cent
ratio
n, p
g/m
l 10.000
1,000
100
10
1
MIP-3α
Con
cent
ratio
n, p
g/m
l 1,000,000
100,000
ICAM-1
Fig 3. EL4B5 cell line Th17 cytokine expression after 48 hr of no treatment and treatment with different combinations of IL-6, LPS, PMA, and ionomycin.
IL-17A
CD40L IL-10 IFN-g
Con
cent
ratio
n, p
g/m
lC
once
ntra
tion,
pg/
ml
IL-21IL-17F
10,000
1,000
100
10
1 1 2 3
Condition
10,000
1,000
100
10
1 1 2 3
Condition
IL-22
10,000
1,000
100
10
1 1 2 3
Condition
10,000
1,000
100
10
1 1 2 3
Condition
100
10
1 1 2 3
Condition
1,000
100
10
1 1 2 3
Condition
100
10
1 1 2 3
Condition
Table 9. Three different treatment conditions of the EL4B5 cell line.
Compound
48 hr Treatment, µg/ml
1 2 3
IL-6 0 0.05 0.05
LPS 0 0 1
PMA 0 0 1
Ionomycin 0 0 1
© 2020 Bio-Rad Laboratories, Inc. 6 Bulletin 6118
Analysis of Murine Th17 Cytokine Profiles Using Bio-Plex Pro Mouse Th17 Panel
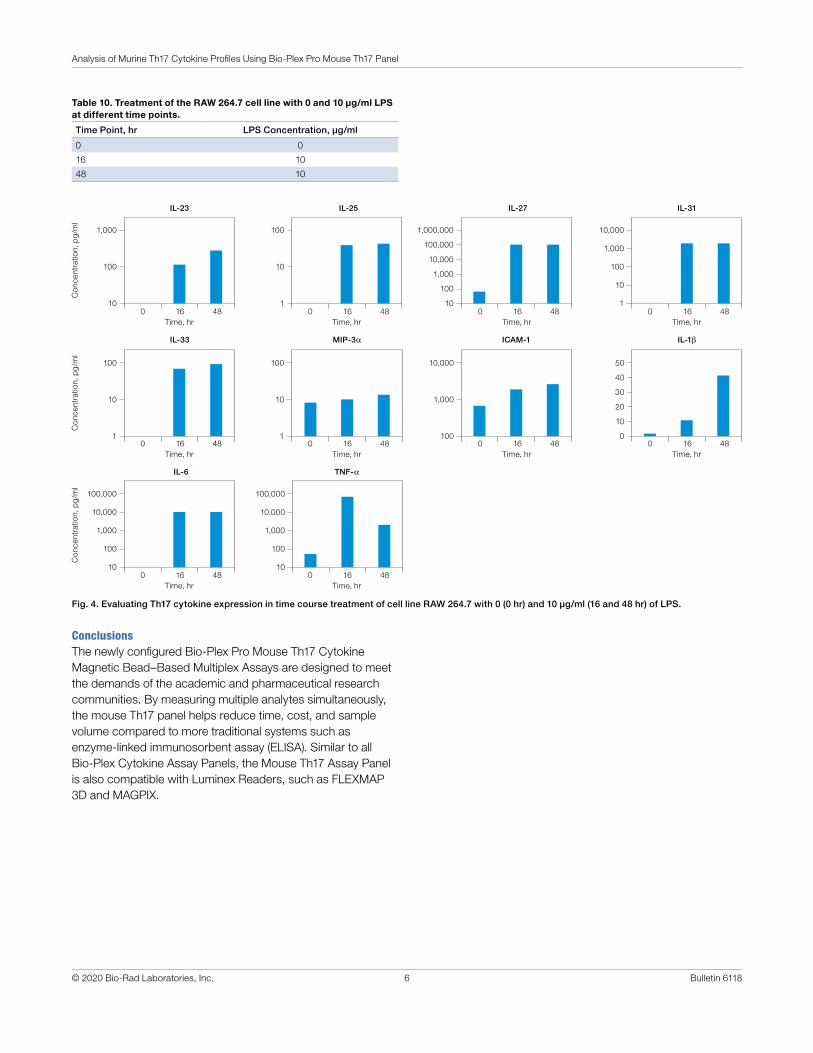
Conclusions The newly configured Bio-Plex Pro Mouse Th17 Cytokine Magnetic Bead–Based Multiplex Assays are designed to meet the demands of the academic and pharmaceutical research communities. By measuring multiple analytes simultaneously, the mouse Th17 panel helps reduce time, cost, and sample volume compared to more traditional systems such as enzyme-linked immunosorbent assay (ELISA). Similar to all Bio-Plex Cytokine Assay Panels, the Mouse Th17 Assay Panel is also compatible with Luminex Readers, such as FLEXMAP 3D and MAGPIX.
Fig. 4. Evaluating Th17 cytokine expression in time course treatment of cell line RAW 264.7 with 0 (0 hr) and 10 μg/ml (16 and 48 hr) of LPS.
Table 10. Treatment of the RAW 264.7 cell line with 0 and 10 µg/ml LPS at different time points.
Time Point, hr LPS Concentration, µg/ml
0 0
16 10
48 10
ICAM-1
Con
cent
ratio
n, p
g/m
lC
once
ntra
tion,
pg/
ml
Con
cent
ratio
n, p
g/m
l
IL-31
10,000
1,000
100
10
1
IL-23
1,000
100
10 0 16 48
Time, hr
10,000
1,000
100
IL-25
100
10
1
IL-27
1,000,000
100,000
10,000
1,000
100
10
IL-33
100
10
1
MIP-3a
100
10
1
IL-1b
50
40
30
20
10
0
IL-6
100,000
10,000
1,000
100
10
TNF-a
100,000
10,000
1,000
100
10
0 16 48Time, hr
0 16 48Time, hr
0 16 48Time, hr
0 16 48Time, hr
0 16 48Time, hr
0 16 48Time, hr
0 16 48Time, hr
0 16 48Time, hr
0 16 48Time, hr

© 2020 Bio-Rad Laboratories, Inc. 7 Bulletin 6118
Analysis of Murine Th17 Cytokine Profiles Using Bio-Plex Pro Mouse Th17 Panel
ReferencesCopeland S et al. (2005). Acute inflammatory response to endotoxin in mice and humans. Clin Diagn Lab Immunol 12, 60–67.
Dale E et al. (2008). Second generation multiplex immunoassays. BioRadiations 125, 16–21.
Di Cesare A et al. (2009). The IL-23/Th17 axis in the immunopathogenesis of psoriasis. J Invest Dermatol 129, 1,339–1,350.
Garrett-Sinha LA et al. (2008). IL-17 and the Th17 lineage in systemic lupus erythematosus. Curr Opin Rheumatol 20, 519–525.
Harrington LE et al. (2005). Interleukin 17-producing CD4+ effector T cells develop via a lineage distinct from the T helper type 1 and 2 lineages. Nat Immunol 6, 1,123–1,132.
Kebir H et al. (2007). Human Th17 lymphocytes promote blood-brain barrier disruption and central nervous system inflammation. Nat Med 13, 1,173–1,175.
Kimura A and Kishimoto T (2011). Th17 cells in inflammation. Int Immunopharmacol 11, 319–322.
Raschke WC et al. (1978). Functional macrophage cell lines transformed by Abelson leukemia virus. Cell 15, 261–267.
Shahrara S et al. (2008). Th17 cells in rheumatoid arthritis. Arthritis Res Ther 10, R93.
Sospedra M and Martin K (2008). Immunology of multiple sclerosis. In Multiple Sclerosis: A Comprehensive Text, C.S. Raine, H.F. McFarland, R. Hohlfeld, eds. (Saunders Elsevier), pp. 192–213.
Stumhofer JS et al. (2006). Interleukin 27 negatively regulates the development of interleukin 17-producing T helper cells during chronic inflammation of the central nervous system. Nat Immunol 7, 937–945.
Werner-Favre C et al. (1994). Similar CD40 ligand expression on EL-4 thymoma cell lines with widely different helper activity for B lymphocytes. Immunology 81, 111–114.
Zambrano-Zaragoza JF et al. (2014). Th17 cells in autoimmune and infectious diseases. Int J Inflam 2014, 651503.

Bulletin 6118 Ver B US/EG 19-0821 0220 Sig 0220
Website bio-rad.com USA 1 800 424 6723 Australia 61 2 9914 2800 Austria 00 800 00 24 67 23 Belgium 00 800 00 24 67 23 Brazil 4003 0399 Canada 1 905 364 3435 China 86 21 6169 8500 Czech Republic 00 800 00 24 67 23 Denmark 00 800 00 24 67 23 Finland 00 800 00 24 67 23 France 00 800 00 24 67 23 Germany 00 800 00 24 67 23 Hong Kong 852 2789 3300 Hungary 00 800 00 24 67 23 India 91 124 4029300 Israel 0 3 9636050 Italy 00 800 00 24 67 23 Japan 81 3 6361 7000 Korea 82 2 3473 4460 Luxembourg 00 800 00 24 67 23 Mexico 52 555 488 7670 The Netherlands 00 800 00 24 67 23 New Zealand 64 9 415 2280 Norway 00 800 00 24 67 23 Poland 00 800 00 24 67 23 Portugal 00 800 00 24 67 23 Russian Federation 00 800 00 24 67 23 Singapore 65 6415 3188 South Africa 00 800 00 24 67 23 Spain 00 800 00 24 67 23 Sweden 00 800 00 24 67 23 Switzerland 00 800 00 24 67 23 Taiwan 886 2 2578 7189 Thailand 66 2 651 8311 United Arab Emirates 36 1 459 6150 United Kingdom 00 800 00 24 67 23
Bio-Rad Laboratories, Inc.
Life ScienceGroup
BIO-RAD and BIO-PLEX are trademarks of Bio-Rad Laboratories, Inc. in certain jurisdictions.
The Bio-Plex Suspension Array System includes fluorescently labeled microspheres and instrumentation licensed to Bio-Rad Laboratories, Inc. by the Luminex Corporation.
Luminex and xMAP are trademarks of Luminex Corporation.
All trademarks used herein are the property of their respective owner.
Visit bio-rad.com/MouseTh17Cytokine for more information.


![AIIMS PUBLICATIONS (November, 2013) [Source: … · 12. J Med Virol. 2013 Nov 19. doi: 10.1002/jmv.23810. [Epub ahead of print] Cellular interplay among Th17, Th1, and Treg cells](https://img.pdfslide.us/doc/110x75/5fda5e583416fb37aa35a961/aiims-publications-november-2013-source-12-j-med-virol-2013-nov-19-doi.jpg)


![Review Extracellular vesicles in Inflammatory Skin Disorders ...MiRNAs Help discriminate between EV subpopulations [127] MiR-381-3p CD4+ T cells Induce Th1/Th17 polarization in psoriasis](https://img.pdfslide.us/doc/110x75/6001046ada2b32234b3be391/review-extracellular-vesicles-in-inflammatory-skin-disorders-mirnas-help-discriminate.jpg)