Embed Size (px)
Citation preview

Part 1: Introduction & Motivation

Goal of this lecture
Goal of this lecture
Description of the most common surface analytical techniques
To help you later in your carrier to identify surface-related problems and to discuss with an expert about possible ways of characterization

AEAPS Auger Electron Appearance Potential Spectroscopy
AES Auger Electron Spectroscopy
AFM AtomicForce Microscopy
APECS Auger Photoelectron Coincidence Spectroscopy
APFIM Atom Probe Field Ion Microscopy
APS Appearance Potential Spectroscopy
ARPES Angle Resolved Photoelectron Spectroscopy
ARUPS Angle Resolved Ultraviolet Photoelectron Spectroscopy
ATR Attenuated Total Reflection
BEEM Ballistic Electron Emission Microscopy
BIS Bremsstrahlung Isochromat Spectroscopy
CFM Chemical Force Microscopy
CHA Concentric Hemispherical Analyser
CMA Cylindrical Mirror Analyser
CPD Contact Potential Difference
DAFS Diffraction Anomalous Fine Structure
DAPS Disappearance Potential Spectroscopy
DRIFT Diffuse Reflectance Infra-Red Fourier Transform
EAPFS Extended Appearance Potential Fine Structure
EDX Energy Dispersive X-ray Analysis
EELS Electron Energy Loss Spectroscopy
Ellipsometry, see RDS
EMS Electron Momentum Spectroscopy
EPMA Electron Probe Micro-Analysis
ESCA Electron Spectroscopy for Chemical Analysis
ESD Electron Stimulated Desorption
ESDIAD Electron Stimulated Desorption Ion Angle Distributions
EXAFS Extended X-ray Absorption Fine Structure
FEM Field Emission Microscopy
FIM Field Ion Microscopy
FTIR Fourier Transform Infra Red
FT RA-IR Fourier Transform Reflectance-Absorbtion Infra Red
HAS Helium Atom Scattering
HDA Hemispherica l Deflection Analyser
HEIS High Energy Ion Scattering
HREELS High Reso lu tion Electron Energy Loss Spectroscopy
IETS Ine lastic e lectron tunneling spectroscopy
KRIPES k-Reso lved Inverse Photoemission Spectroscopy
ILS Ion isation Loss Spectroscopy
INS Ion Neutra lisa tion Spectroscopy
IPES Inverse Photoemission Spectroscopy
IRAS In fra-Red Absorbtion Spectroscopy
ISS Ion Scattering Spectroscopy
LEED Low Energy Electron Diffraction
LEEM Low Energy Electron Microscopy
LEIS Low Energy Ion Scattering
LFM Latera l Force Microscopy
MBE Molecu lar Beam Epitaxy
MBS Molecu lar Beam Scattering
MCXD Magnetic Circu lar X-ray Dichro ism
MEIS Medium Energy Ion Scattering
MFM Magnetic Force Microscopy
MIES Metastab le Impact Electron Spectroscopy
MIR Multip le In terna l Reflection
MO CVD Meta l O rgan ic Chemica l Vapour Deposition
MO KE Magneto-O ptic Kerr Effect
NIXSW Normal Incidence X-ray Stand ing W ave
NEXAFS Near-Edge X -ray Absorption Fine Structure
NSO M Near Fie ld Scanning O ptica l Microscopy
PAES Positron ann ih ila tion Auger Electron Spectroscopy
PECVD Plasma Enhanced Chemica l Vapour Deposition
PEEM Photo Emission Electron Microscopy
Ph.D. Photoe lectron Diffraction
PIXE Proton Induced X-ray Emission
PSD Photon Stimula ted Desorption
TPRS Temperature Programmed Reaction Spectroscopy
TXRF Tota l Reflection X-ray Fluorescence
UHV Ultra High Vacuum
UPS Ultravio le t Photoemission Spectroscopy
XANES X-ray Absorption Near-Edge Structure
XPD X -ray Photoe lectron Diffraction
XPS X -ray Photoemission Spectroscopy
XRR X -ray Reflectometry
XSW X -ray Stand ing W ave
RAIRS Reflection Absorbtion In fra-Red Spectroscopy
RAS Reflectance Anisotropy Spectroscopy
RBS Rutherford Back Scattering
RDS Reflectance Diffe rence Spectroscopy
REFLEXAFS Reflection Extended X-ray Absorption Fine Structure
RFA Retard ing Fie ld Analyser
RHEED Reflection High Energy Electron Diffraction
RIfS Reflectometric In terference Spectroscopy
SAM Scanning Auger Microscopy
SEM Scanning Electron Microscopy
SEMPA Scanning Electron Microscopy with Po larisa tion Analysis
SERS Surface Enhanced Raman Scattering
SEXAFS Surface Extended X-ray Absorption Spectroscopy
SHG Second Harmonic G eneration
SH-MO KE Second Harmonic Magneto-O ptic Kerr Effect
SIMS Secondary Ion Mass Spectrometry
SKS Scanning Kinetic Spectroscopy
SMO KE Surface Magneto-O ptic Kerr Effect
SNMS Sputtered Neutra l Mass Spectrometry
SNO M Scanning Near Fie ld O ptica l Microscopy
SPIPES Spin Po larised Inverse Photoemission Spectroscopy
SPEELS Spin Po larised Electron Energy Loss Spectroscopy
SPLEED Spin Po larised Low Energy Electron Diffraction
SPM Scanning Probe Microscopy
SPR Surface Plasmon Resonance
SPUPS Spin Po larised Ultravio le t Photoe lectron Spectroscopy
SPXPS Spin Po larised X-ray Photoe lectron Spectroscopy
STM Scanning Tunnelling Microscopy
SXAPS Soft X-ray Appearance Potentia l Spectroscopy
SXRD Surface X-ray Diffraction
TDS Thermal Desorption Spectroscopy
TEAS Thermal Energy Atom Scattering
TIRF Tota l In terna l Reflectance Fluorescence
TPD Temperature Programmed Desorption

What do we really want to know about our surfaces ?
And how do we decide which technique to use ?

1. Chemical CompositionFT Infrared spectroscopy (GIR & ATR)XPS, SIMS
2. Thickness of a coatingEllipsometry, Surface Plasmon Spectroscopy, X-ray reflectometry
3. Surface Roughness / Homogeneity / TopologyAFM, X-ray reflectometry, microscopies
4. Wetting PropertiesContact angle measurements
5. Swelling of surfaces / coatingsEllipsometry, neutron reflectometry
6. Orientation of moleculesFTIR spectroscopy & others

Kanten 1 x 1 cm 5 x 5 nmVolumen 1 cm3 1 cm3
Oberfläche 0,0006 m2 2400 m2
Beispiel:Würfel

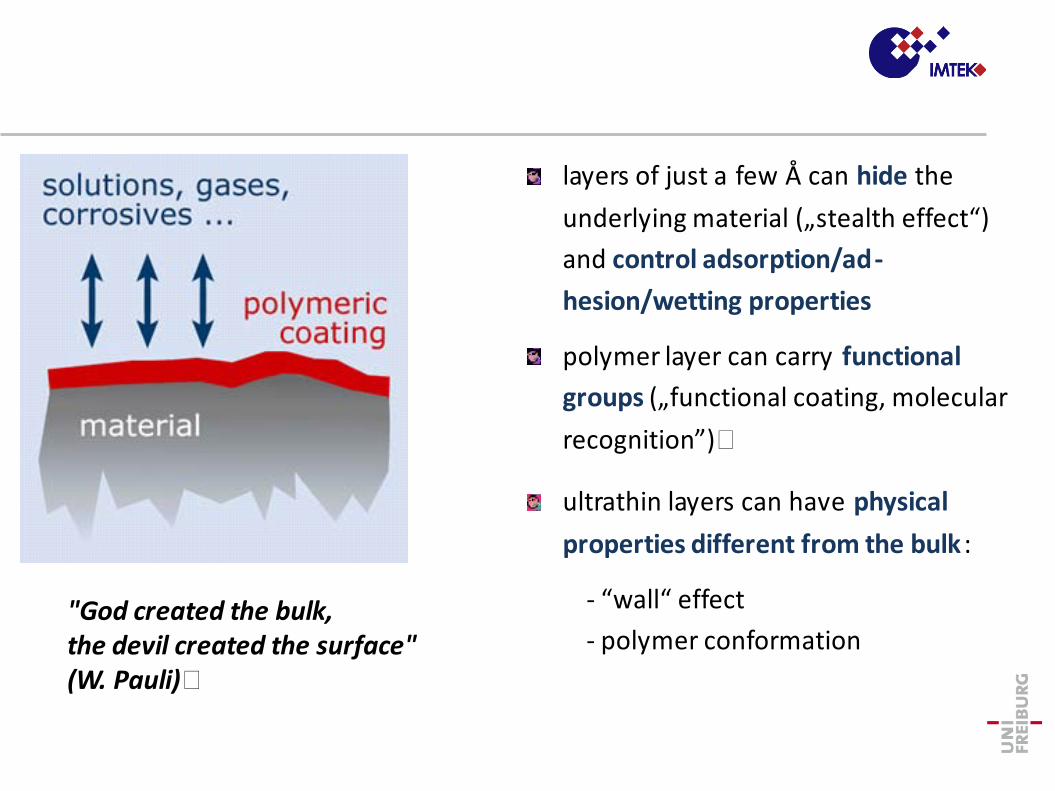
ultrathin layers can have physical properties different from the bulk :
- “wall“ effect- polymer conformation
layers of just a few Å can hide the underlying material („stealth effect“) and control adsorption/ad-hesion/wetting properties
polymer layer can carry functional groups („functional coating, molecular recognition”)�
"God created the bulk, the devil created the surface" (W. Pauli)�


Example 2: Surfaces & Biofouling
Protein adsorption / cell adhesion a function of contact angle?
Principles of Tissue Engineering, 2nd ed., R.P. Lanza, R. Langer, J. Vacanti, Academic Press 1997, page 225

Example 2: Surfaces & Biofouling
Protein adsorption / cell adhesion a function of contact angle?
Principles of Tissue Engineering, 2nd ed., R.P. Lanza, R. Langer, J. Vacanti, Academic Press 1997, page 225
NOT REALLY

Example 3: Learning from nature
What the stenocara beetle can teach us
Stenocara sp.
• tenebrionid beetle (avoids light)• habitat: Namib desert• uses fog for water supply (drop size1-40µm)
survival due to clever use of wetting properties

dry surface water starts to be collected
entire spot is wetted; contact line rests at “hydrophilic”/super-hydrophobic boundary.
more water is collected. meniscus remains pinned
on the downhill side, the advancing angle on the superhydro-phobic surface is reached
on the uphill side, the drop exhibits the receding angle on the “hydrophilic spot -drop rolls off

Part 2: Surface Forces
Surface phenomena are the result of forces between molecules or atoms

The origin of intermolecular forces
Forces between atoms are largely electrostatic and best described by quantummechanics >> Hellma-Feynman theorem
Schrödinger equation describes geometric dimensions of electrons
Exact solutions are rarebut classical electrostatics often sufficient
( ) ( ) ( )tx,ψtx,H=tx,ψt
i∂∂
Classification Ionic bonds Metallic bonds Van der Waals interactions Hydrophilicity / hydrophobicity Hydrogen bonding Solvation

Classification
Entirely electrostatic (Coulomb): Interactions between charged species, dipoles etc.
Polarization forces >> induced dipols
Quantum mechanics: covalent bonds steric interactions
Van der Waals forces
Hydrogen bonding
Hydrophobic /hydrophilic interactions

Covalent vs. metallic bonds
H H H2
H
HO H2O
• complex • Short ranged (0.1-0.2 nm),• Direction dependent, i.e.
characterized by valence structure
Moleucles: Neighboring atoms share electrons Binding energies:
100-300 kT (200-800 kJ/mol)
Metals: All atoms share electrons (electron gas)

Physical forces (vdW, electrostatic)
Non specific
Do not depend on stoichiometry
Not directed
Can be as strong as covalent bonds
But are long ranged

Coulombic forces
Forces between charges (same/opposite sign)
e = 1.602 x 10⁻¹⁹ C (uni charge)z = charge numberε = dielectric constant
Energie:r
ezzr
QQ)r(w
0
221
0
2144
==επεεπε
rezz
rQQ
dr)r(dw
F0
221
20
21
44==−=
επεεπε
Coulombic forces II
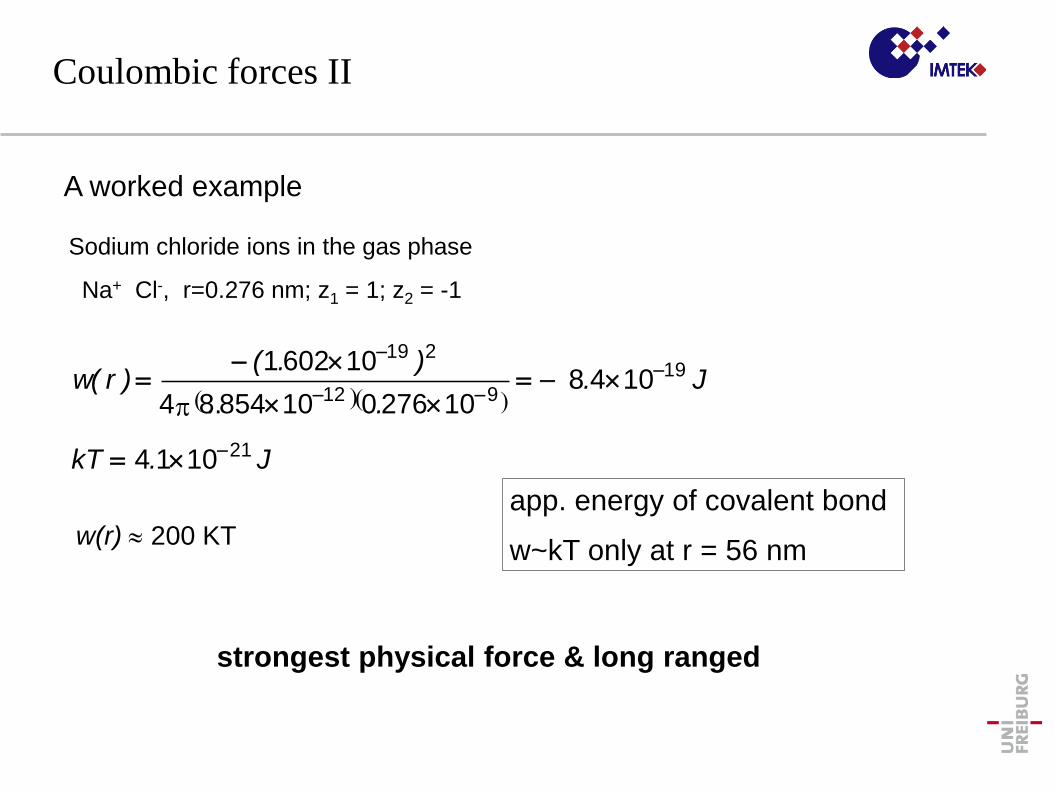
A worked example
12−( )( )
J.kT
J...
).()r(w
21
199
219
1014
1048102760108548.4
106021
−
−−
−
×=
×−=××
×−=
π
Sodium chloride ions in the gas phase
Na+ Cl-, r=0.276 nm; z1 = 1; z2 = -1
app. energy of covalent bond
w~kT only at r = 56 nmw(r) ≈ 200 KT
strongest physical force & long ranged

H2O
Interaction of polar molecules
H-Clpermanent distortion of the shape of the orbitals caused by strong differencies in electronegativity
polar molecules → electric dipoles
u ~ q l dipole moment of polar molecule
1 Debye = 1 D = 3.336 10-30 Cm
____________________________
alkanes 0CO2 0chloroform 1.06water 1.85ethanol 1.7acetone 2.9
____________________________

Strength of interaction
uθ Q
r
u2
charge - dipole
u1θ1
r
θ2
A worked example: Na+ (z=1, a=0.095 nm) near a water molecule (a=0.14 nm, u=1.85 D)
dipole - dipole
w (r, Θ=0) = 1.6 10-19 J
96 kJ/mol or 39 kT
relatively weak:
u ~ 1D, r = 0.35 nm, w ~ kT

Interaction via induced polarization
Induced dipoles are generated by electrical fields imposed by nearby permanent dipoles
All atoms and molecules can be polarized; polarizibility α is defined as the dipole moment Uind induced by a field of strength E
α describes how easily the electrons can be repositioned
Uind = α E e+ e-
e-e+
Electrical field
R
uind=0 uind=α0E=4πε0R3E~1D

Interaction ion vs. induced dipole
+
-q +q
Epolarizingfield
unpolarmolecule
Ion
ze
E field resulting from induced dipoleEr
( )( ) 4042
2 1~3422
1rkT
u+αrεπε
ze=αE=w(r)0
2
−−

Interaction between dipoles
-q +q
Epolarizing field
unpolar molecule
Permanent Dipole
field resulting from induced dipole
Er
u
( ) 62
21 1~
4 rkTrεπεαu=w(r)
60
−

Summary of interactions
Jacob IsraelachviliIntermolecular & Surface ForcesAcademic Press

What if two completely unpolar molecules interact? Can they?

Van der Waals dispersion forces
• active between any atom or molecule• quantum mechanic description needed :-(• intuitive explanation:
– electron densities in atoms (molecules) fluctuate
– only the time averaged dipol moment of an unpolar species is zero
– at a given time an instantaneous dipole might and will induce another dipole
( ) ( )electron theoffrequency orbiting theis
~1~42
36
1
262
0201
i
2
1
0
ν
kTfewarν+ν
νhνrπε
αα=w(r) −

Van der Waals dispersion forces
• VdW are always long ranged and are active at distances above 10 nm (wetting phenomena, disjoining pressures) but also down to 0.2 nm (interatomic distances)
• Usually attractive forces (repulsive at very short distancies)
• Weak orientational dependence
• Dispersion forces between two bodies are usually influenced by the presence of other species

Summary
interaction range dependence Typ. Energy (kJ/mol)
Ion-ion 1/r 250
Ion-dipole 1/r2 15
Dipole-dipole 1/r3 2
Dipole-induced dipole 1/r6 0.3
van der Waals (London dispersion)
1/r6 2

Wholistic view on intermolecular potentials
Lennard-Jones-Potential
612 rB
rA=w(r) −
4612 σσ
εrr
)r(w
−
=
repulsive attractive
ε = depth of minimum (water: 0.65 kJ/mol)
σ = molecular diameter (water: 0.32 nm)

vdW vs. Coulomb
• van der Waals:
interaction energy between neighboring atoms is 64 times higher than to next neighbor
• Coulomb:
but faster decrease in media of high dielectric constant (screening)
1/r 6
1/r

→ From molecules to ....
... macroscopic objects

From molecules to macroscopic surfaces
• same fundamental forces are involved: Coulomb, vdW
• pair potentials must be summed up (integration)
→ high energies even at large distances
→ very slow decay: > kT even at d > 100 nm !!
→ kinetic effects

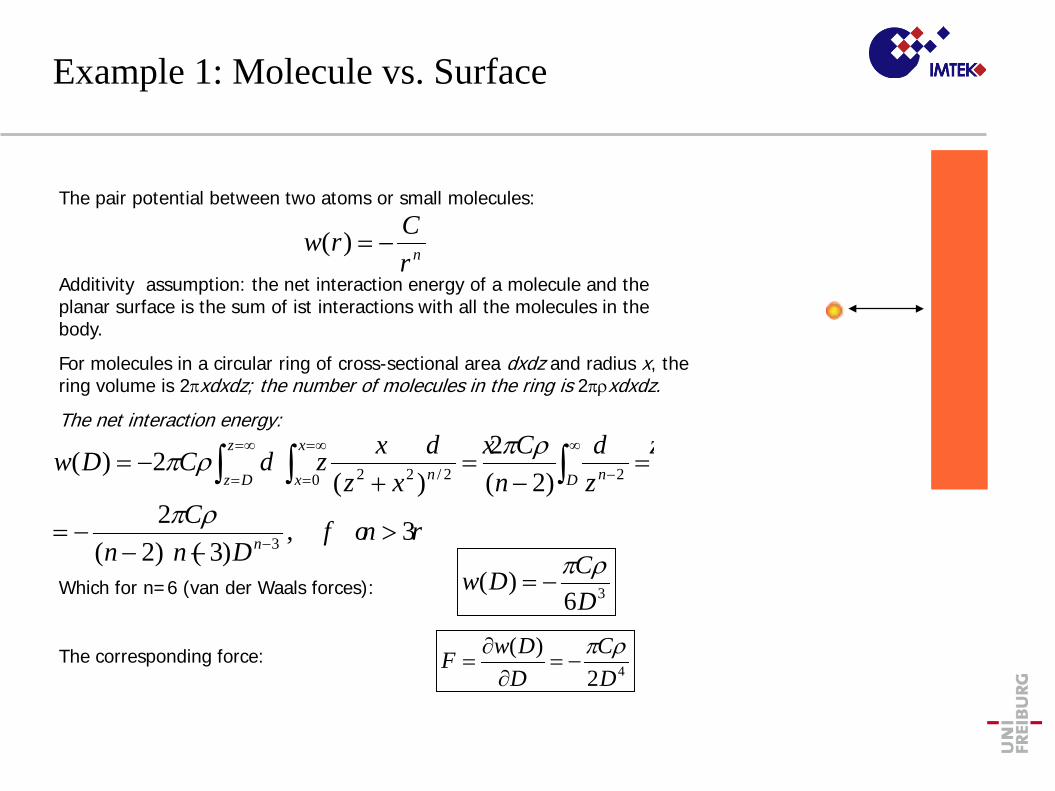
Example 1: Molecule vs. Surface
The pair potential between two atoms or small molecules:
nrCrw −=)(
Additivity assumption: the net interaction energy of a molecule and the planar surface is the sum of ist interactions with all the molecules in the body.
For molecules in a circular ring of cross-sectional area dxdz and radius x, the ring volume is 2πxdxdz; the number of molecules in the ring is 2πρxdxdz.
The net interaction energy:
3,)3) (2(
2)2(
2)(
2)(
3
20 2/22
>−−
−=
=−
=+
−=
−
∞
−
∞=
=
∞=
= ∫∫∫nf o r
DnnC
zd z
nC
xzx d xd zCDw
n
D n
x
x n
z
Dz
ρπ
ρπρπ
Which for n=6 (van der Waals forces):
The corresponding force:
36)(
DCDw ρπ
−=
42)(
DC
DDwF ρπ
−=∂
∂=

Example 2: Sphere vs. Surface
From the chord theorem:
The volume of a thin circular section of area and thickness dz:
The number of molecules contained within this section is
Since all these molecules are at a distance (D+z) from the planar surface, the net interaction energy is:
z)z(=x −2R2
πx 2
z)zdzπ(=dzπx2 −2R
z)zπρ( −2R
∫=
= −+−
−−−=
Rz
z nzDzzR
nnCDw
2
0 3
22
)()2(
)3) (2(2)( ρπ
For D<<R, only small values of z(z~D) contribute to the integral:
DRC
DnnnnRc
zDR z d z
nncDw
n
n
6)5) (4) (3) (2(4
)(2
)3) (2(2)(
22
5
22
0 3
22
ρπρπ
ρπ
−=−−−−
−=
=+−−
−=
−
∞
−∫


Hamaker constant
The Hamaker constant A is defined as:
A=π2Cρ1ρ2
Typical values are of the order of 10-19 J ((0.4-4)10-19 J)
Medium C, 10-79 Jm6 ρ, 1028 m-3A, 10-19 J
Hydrocarbon 50 3.3 0.5
CCl4 1500 0.6 0.5
H2O 140 3.3 1.5
C is a combined constant from vdW equation and ρ are the number of atoms in a unit volume
Hamaker, 1937


![Recent Progress on Liquid Biopsy Analysis using Surface ... · biomedical applications of SERS: labelfree detection - and indirect detection using SERS tags [20]. In label-free SERS](https://img.pdfslide.us/doc/110x75/5f48e596b982e00d4625f82d/recent-progress-on-liquid-biopsy-analysis-using-surface-biomedical-applications.jpg)