Embed Size (px)
Citation preview
Analysis of Library Data at the State & Local Level
2013 SDC ConferenceSt. Louis, MO
December 12, 2013
Deanne W. Swan, PhDIMLS / [email protected]
Frank NelsonIdaho Public Libraries
Why data analysis?
We analyze data…
… to discover useful information.… to answer questions.… to solve problems.… to make better decisions.
… to tell a story.
What is data analysis?
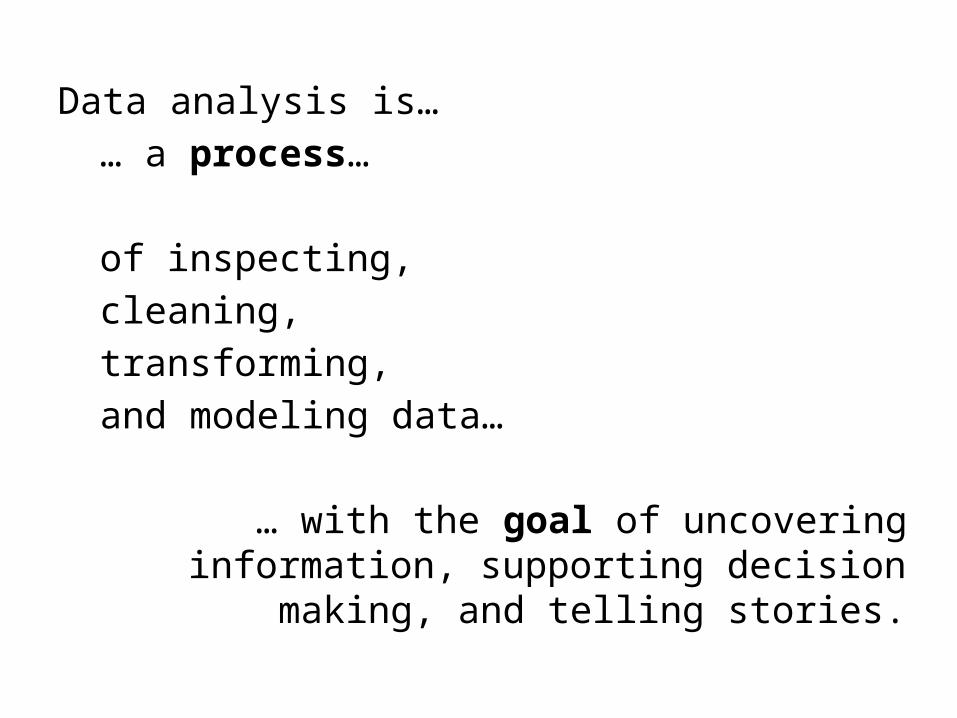
Data analysis is…… a process…
of inspecting, cleaning,
transforming, and modeling data…
… with the goal of uncovering information, supporting decision making, and telling stories.
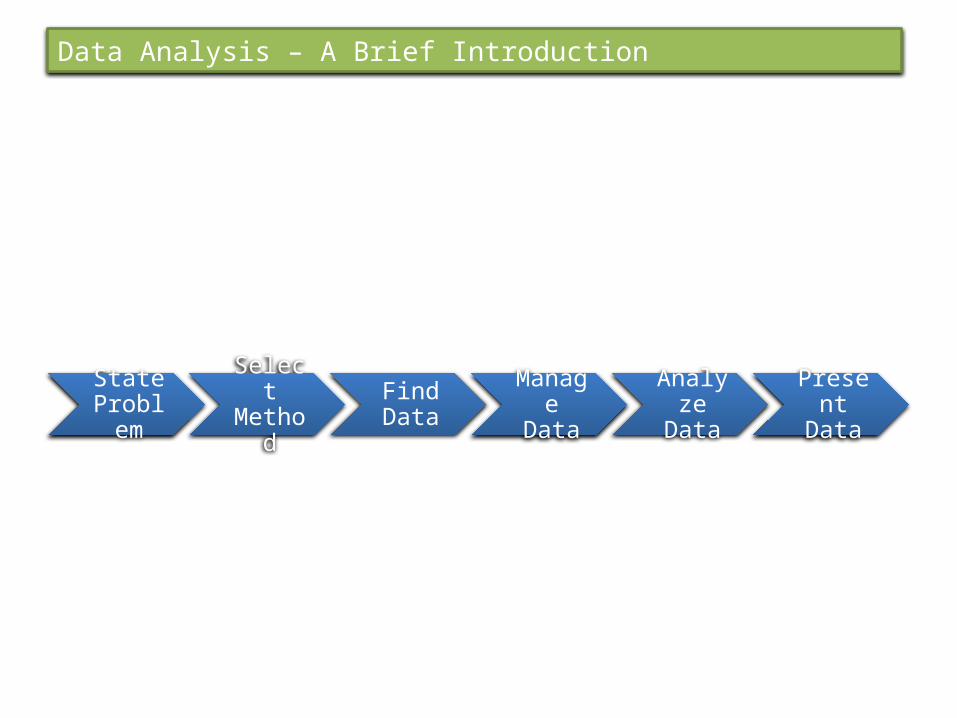
State Problem
Select Method
Find Data
Manage Data
Analyze Data
Present Data
Data Analysis – A Brief Introduction

Let’s start with an example…
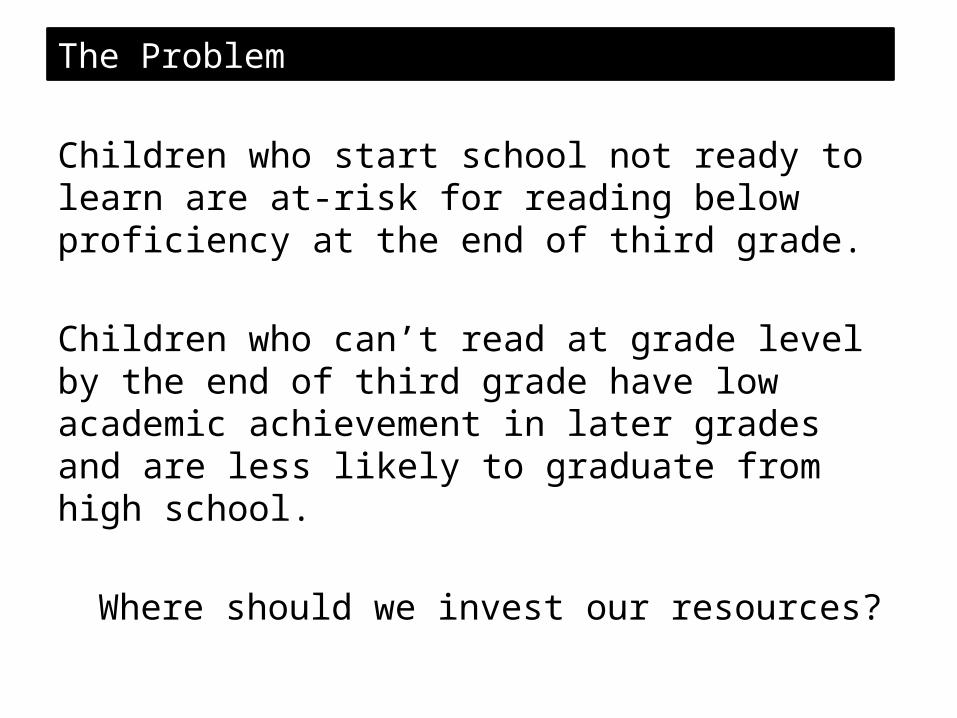
Children who start school not ready to learn are at-risk for reading below proficiency at the end of third grade.
Children who can’t read at grade level by the end of third grade have low academic achievement in later grades and are less likely to graduate from high school.
Where should we invest our resources?
The Problem
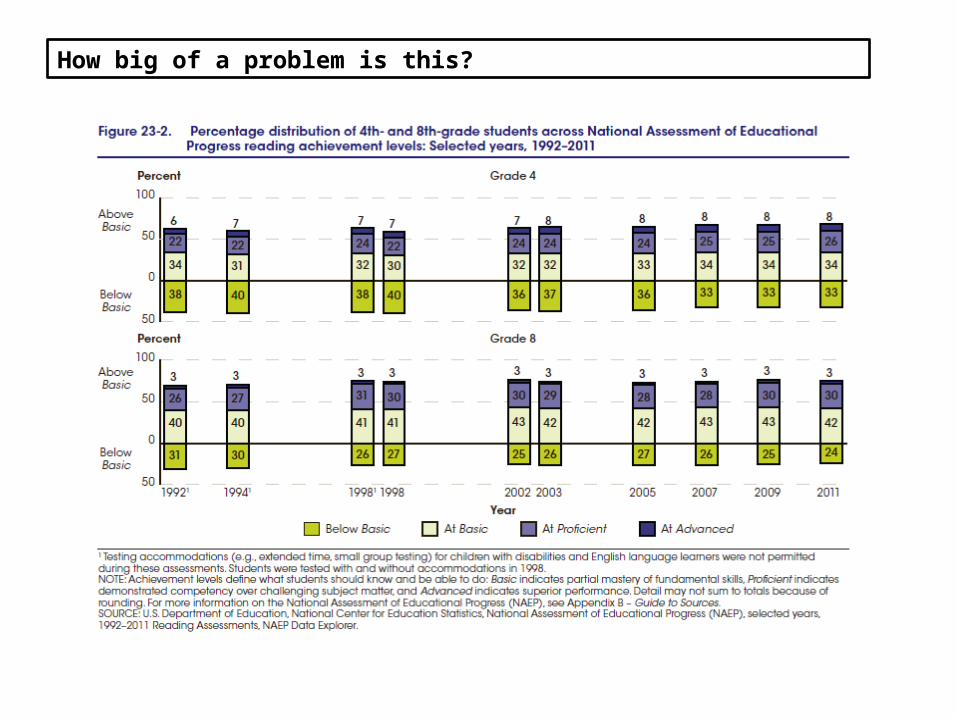
How big of a problem is this?
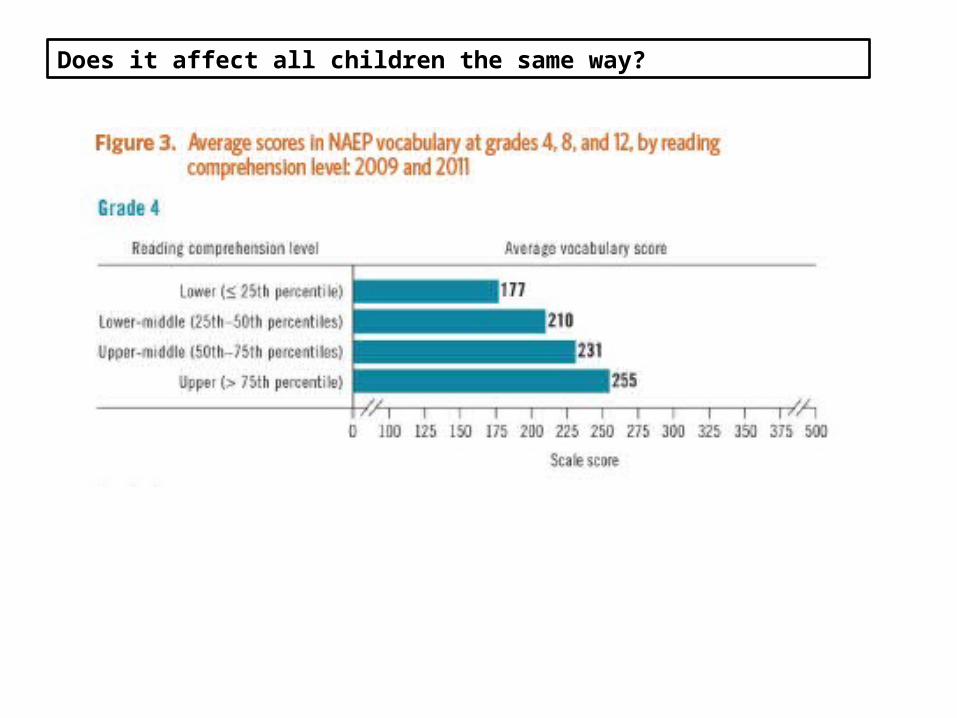
Does it affect all children the same way?
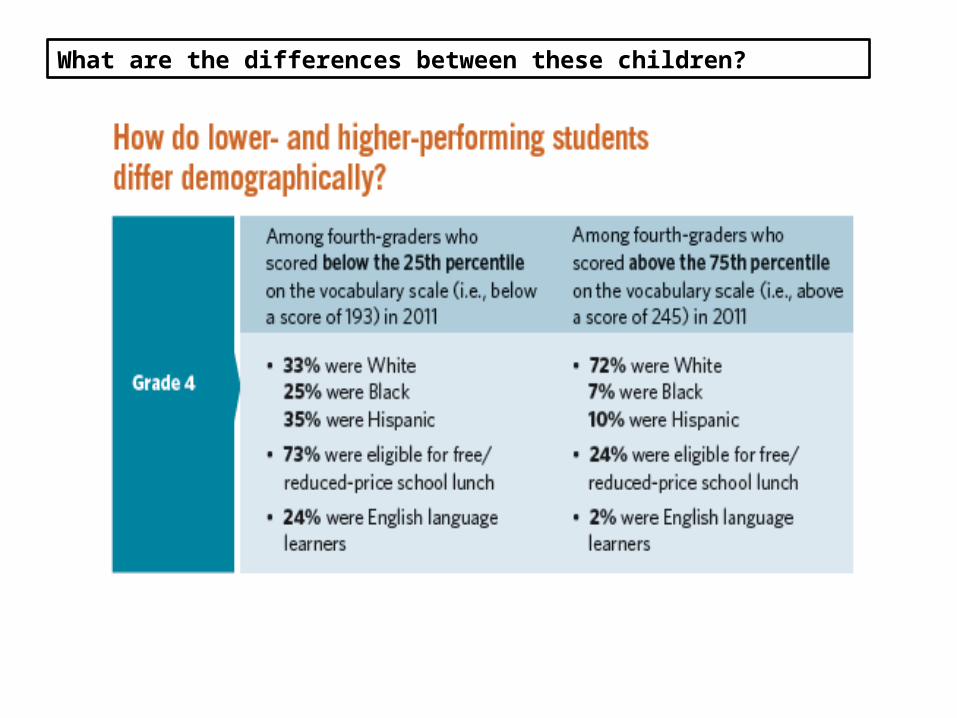
What are the differences between these children?
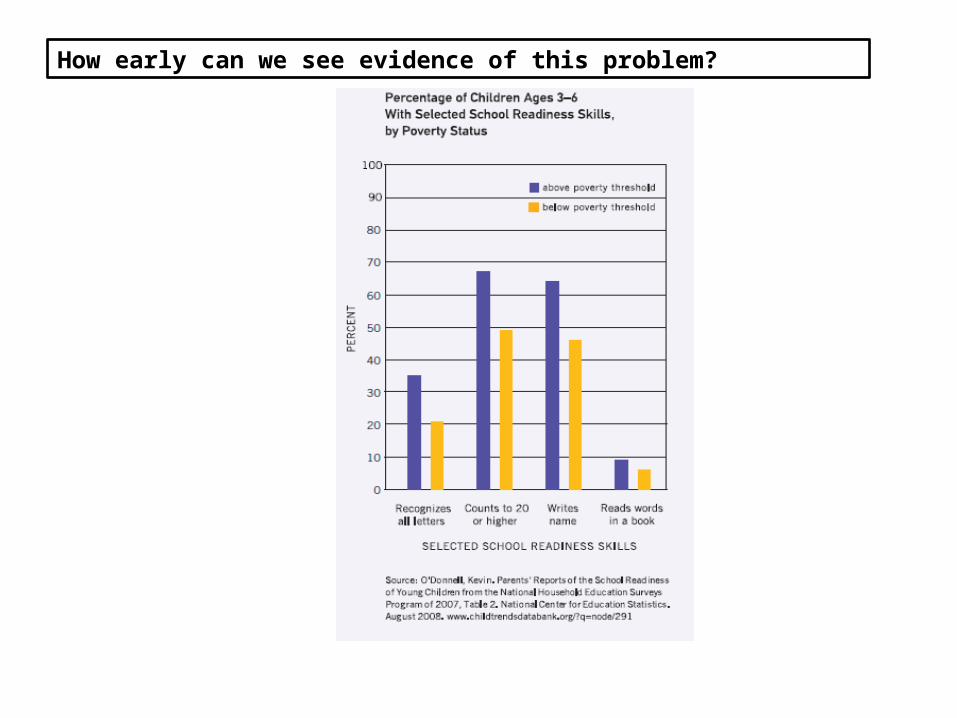
How early can we see evidence of this problem?
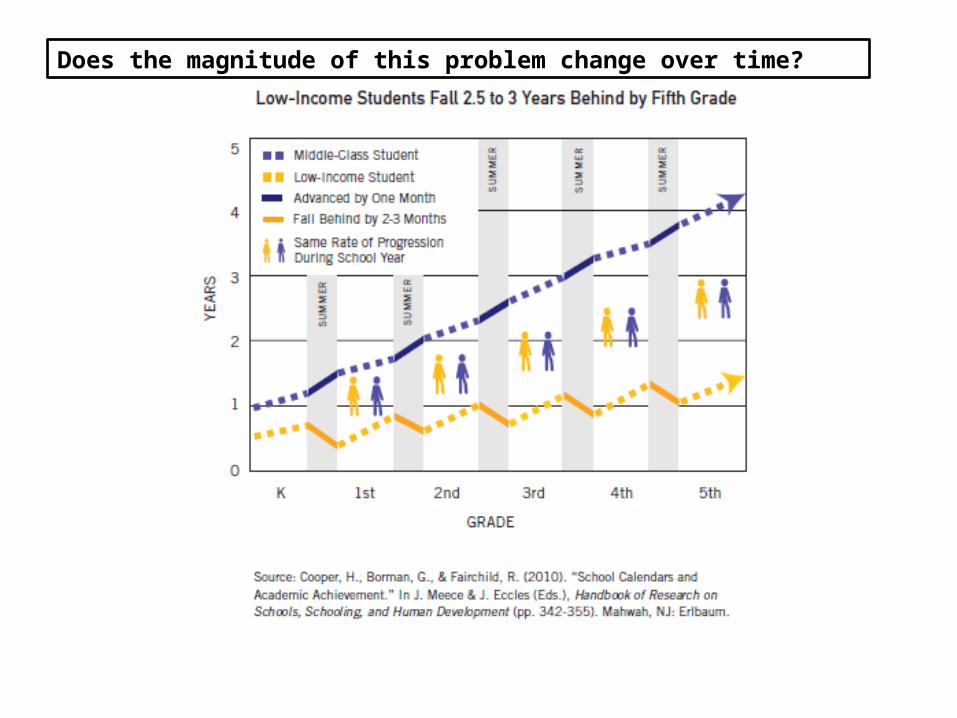
Does the magnitude of this problem change over time?
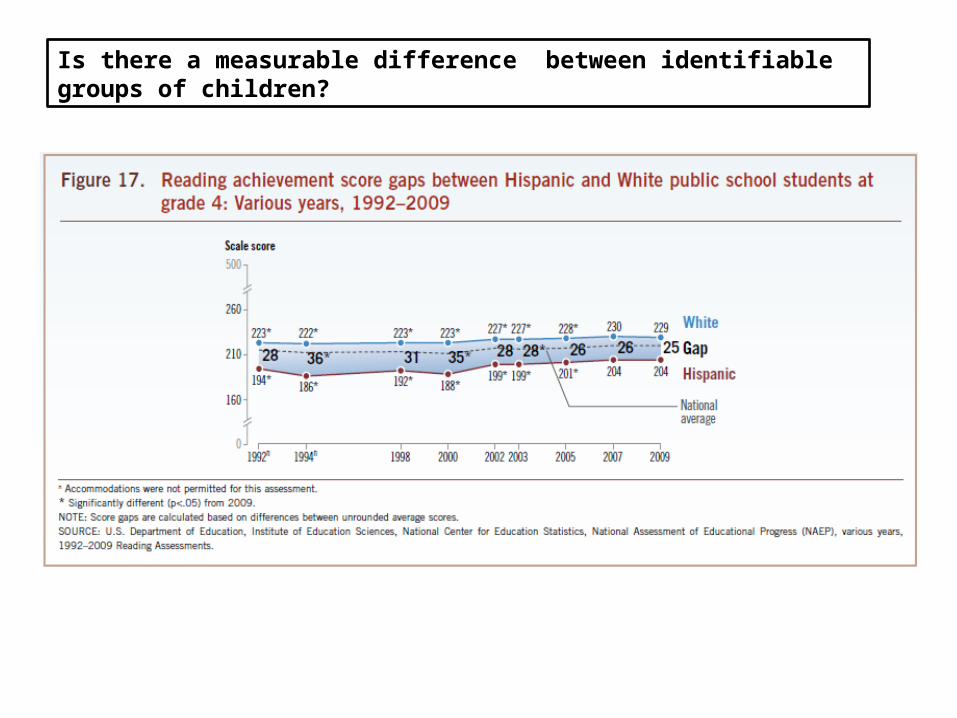
Is there a measurable difference between identifiable groups of children?
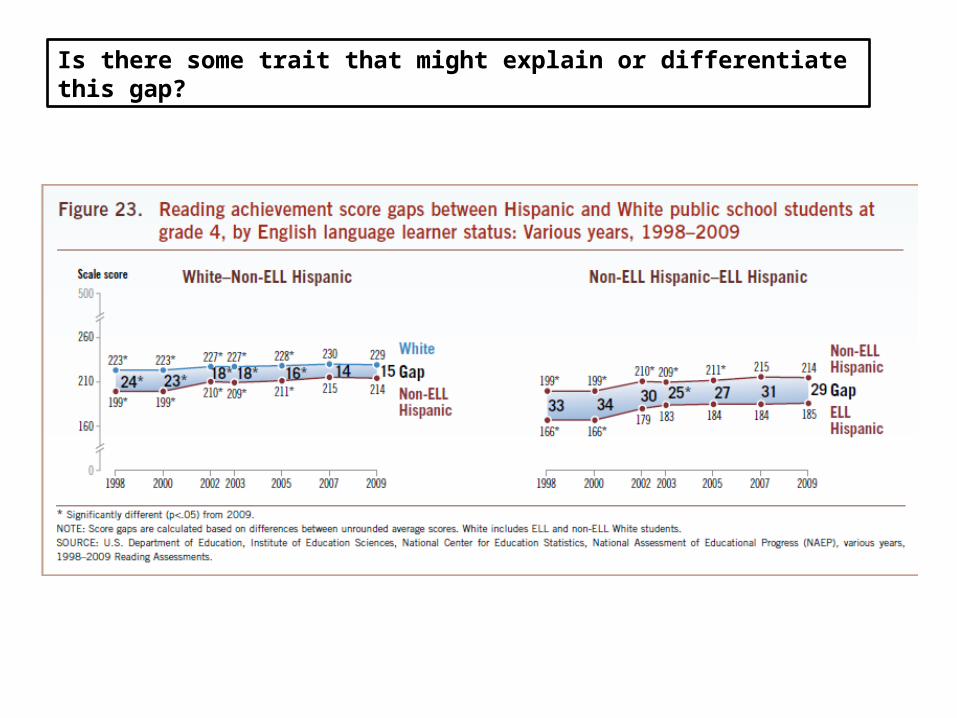
Is there some trait that might explain or differentiate this gap?
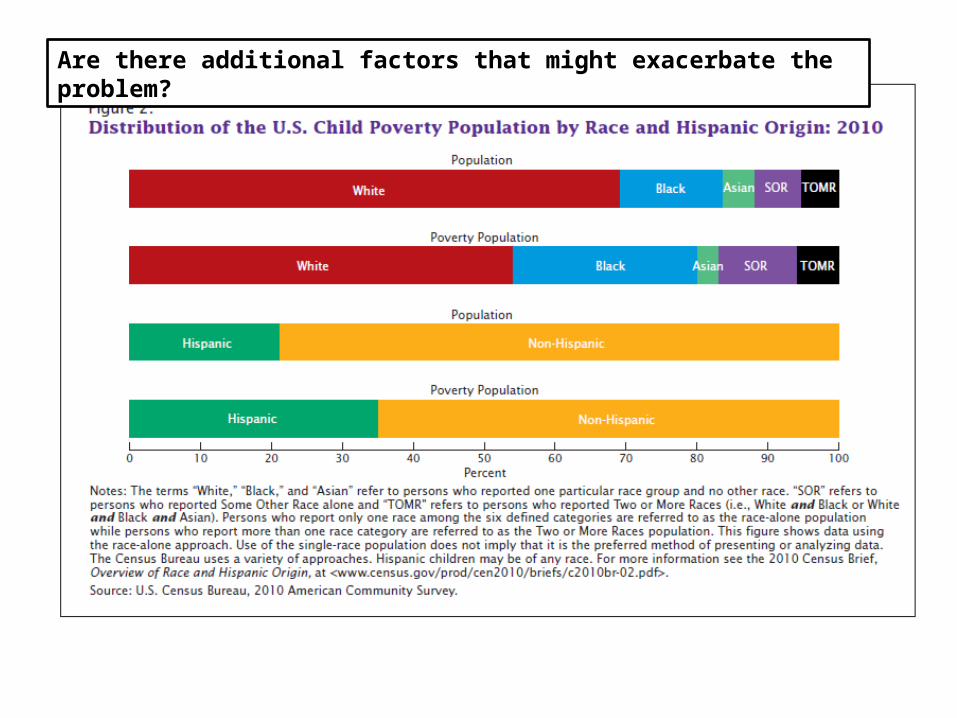
Are there additional factors that might exacerbate the problem?
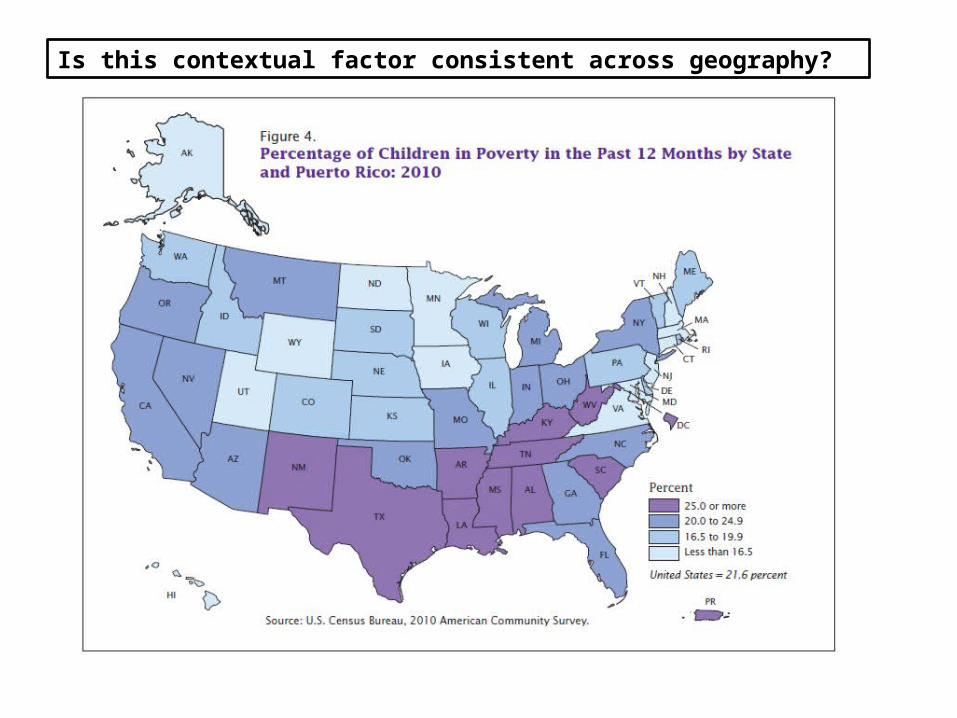
Is this contextual factor consistent across geography?
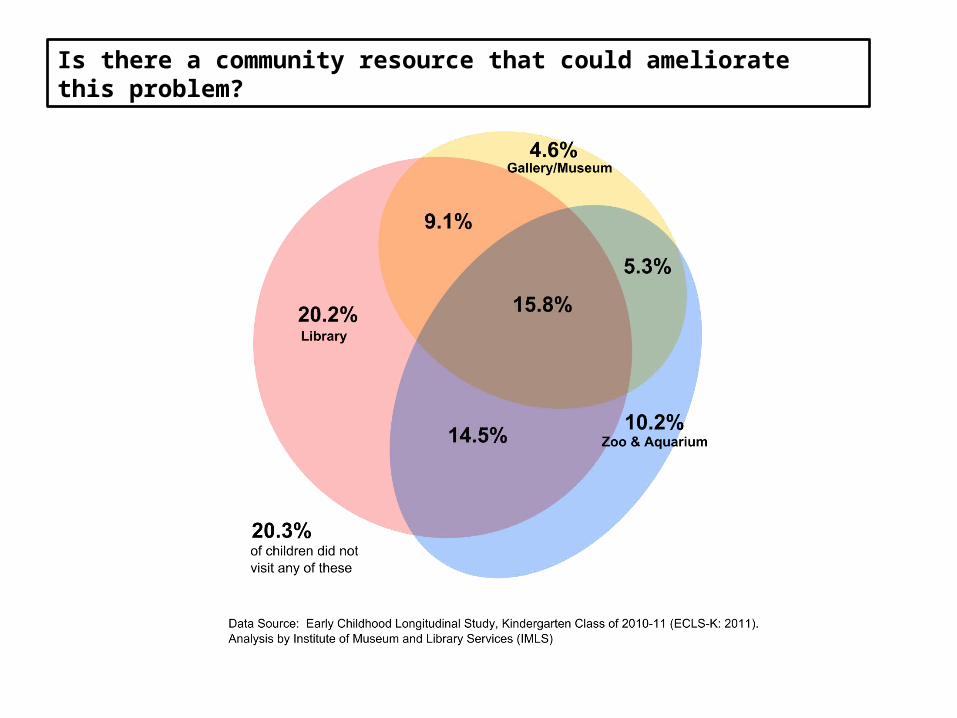
Is there a community resource that could ameliorate this problem?
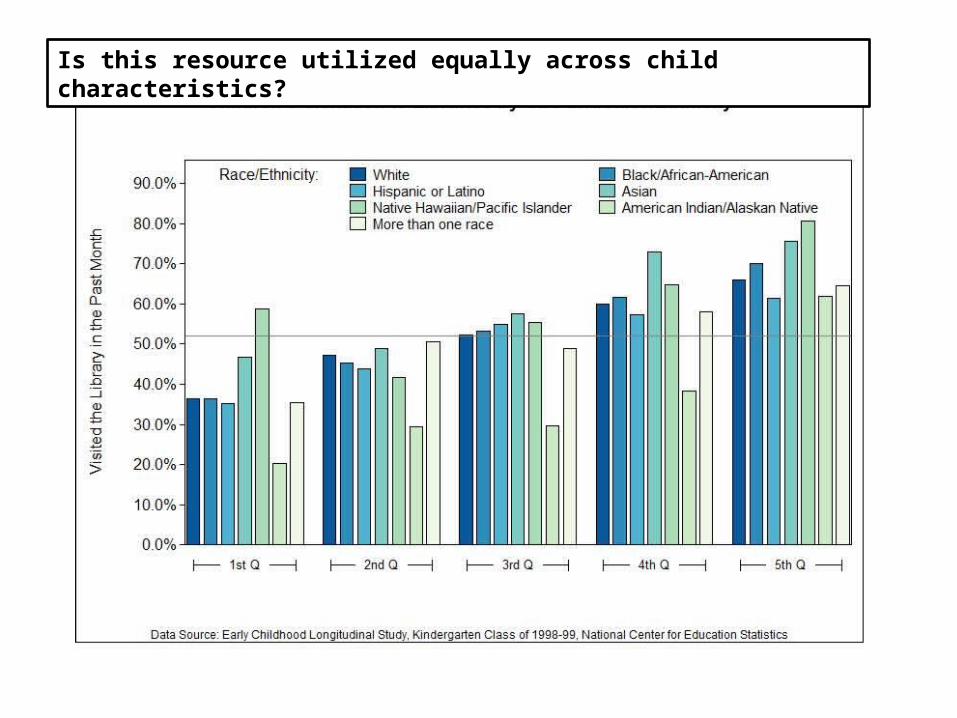
Is this resource utilized equally across child characteristics?
The Problem restated
• In order to succeed in school, children need to be ready to learn, including having fundamental early literacy skills, when they enter school.
• There is an opportunity gap. Certain children are at-risk for entering school not ready to learn.
• These children include children who are Hispanic, children of immigrant parents, and children living in poverty.
• These children are often not enrolled in early education programs that help prepare children for entry to school, leaving these children and their families underserved.
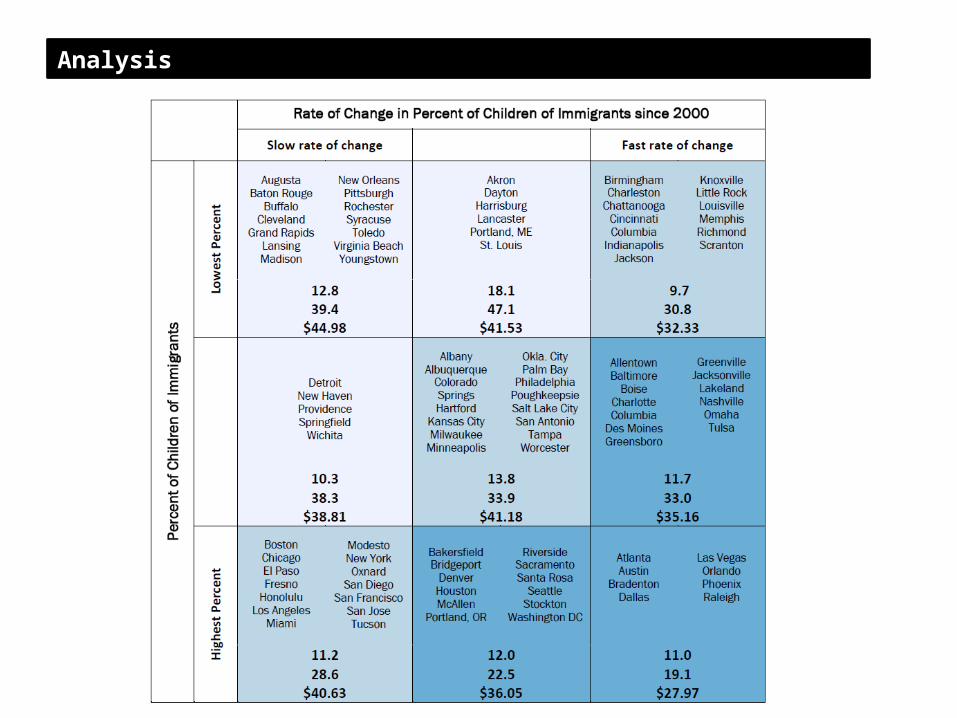
Question:What is the status of children’s programs in public libraries in areas of high concentration of child poverty and immigrant families?
The Problem restated
Analysis
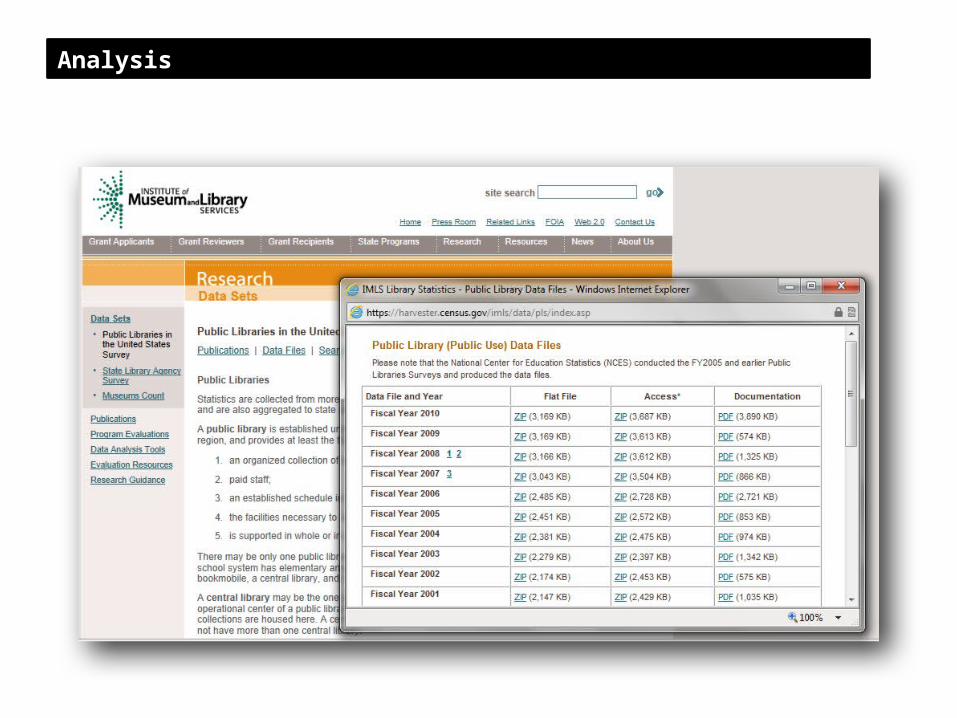
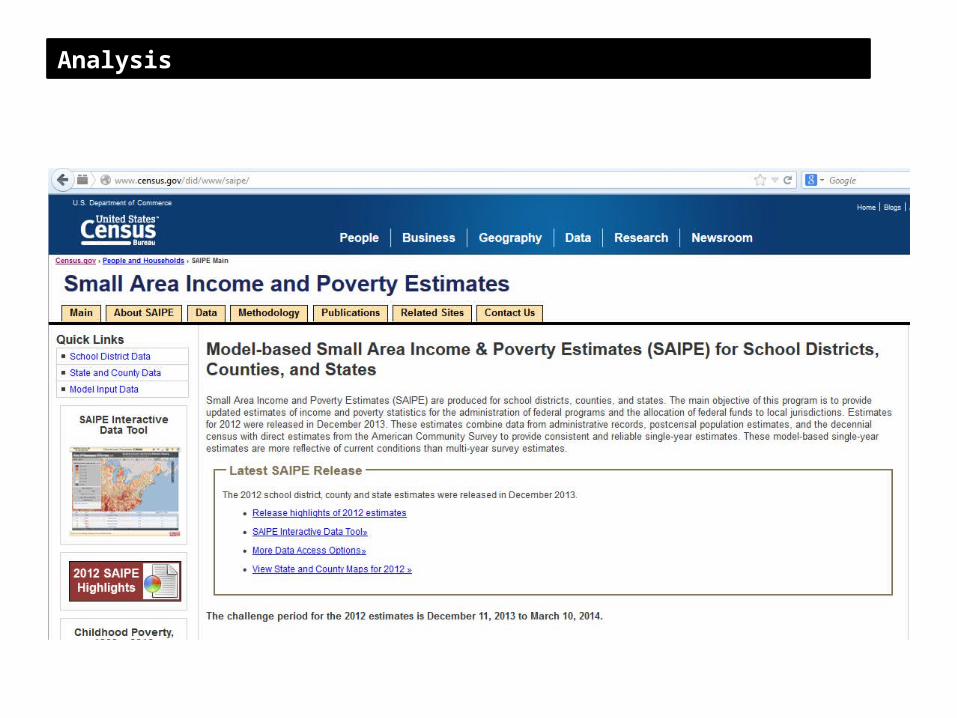
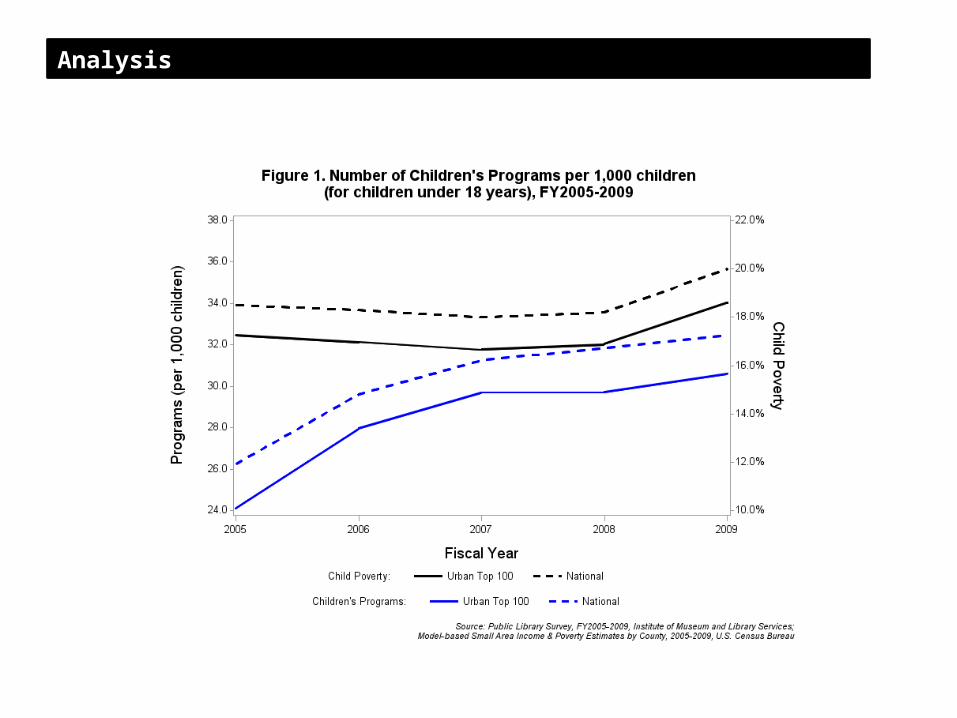
What is the relationship between attendance at public library children’s programs to high levels of child poverty and immigrant status for the top 100 metropolitan areas?Data:
PLS (IMLS)SAIPE and CPS (Census)Crosswalk of Top 100 MSAs
Analysis
Analysis
Analysis
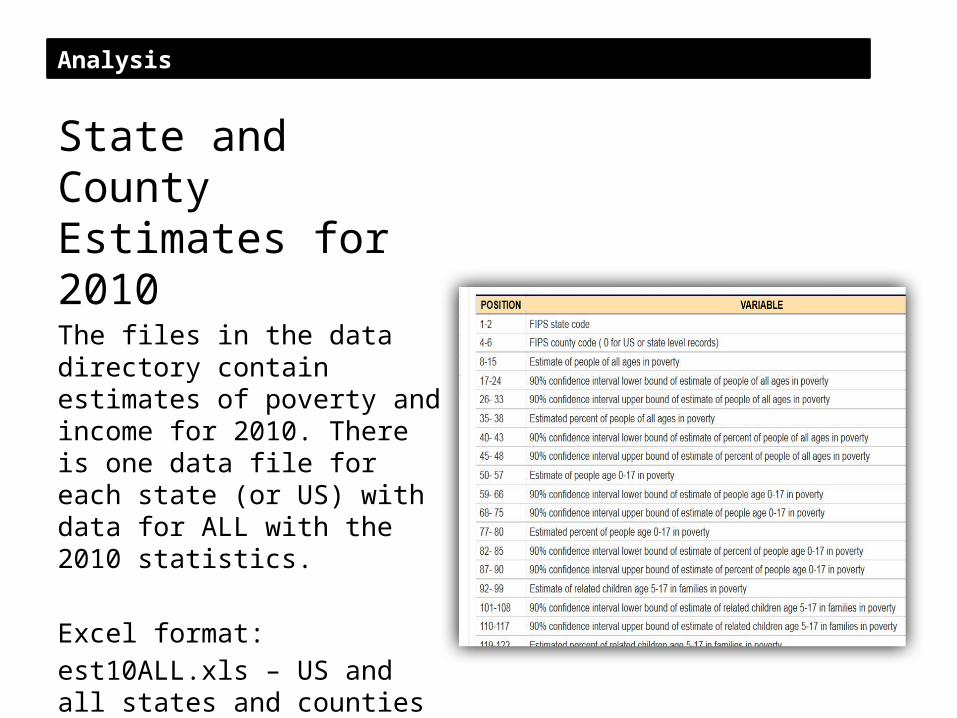
State and County Estimates for 2010The files in the data directory contain estimates of poverty and income for 2010. There is one data file for each state (or US) with data for ALL with the 2010 statistics.
Excel format:est10ALL.xls – US and all states and countiesest10US.xls – US and states data
Analysis
Analysis
Analysis
Analysis
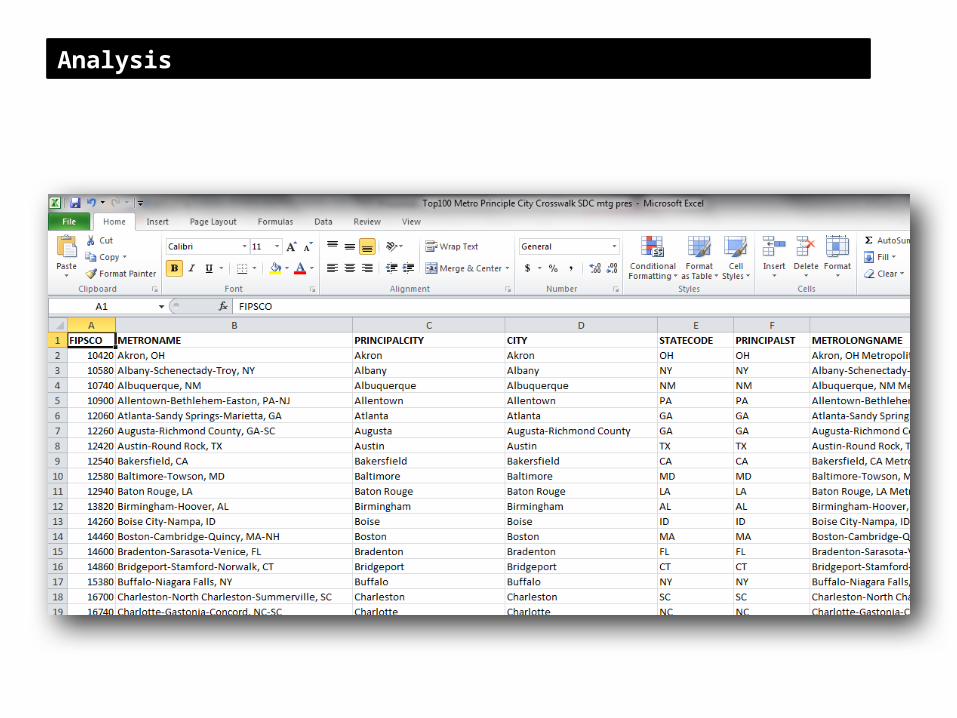
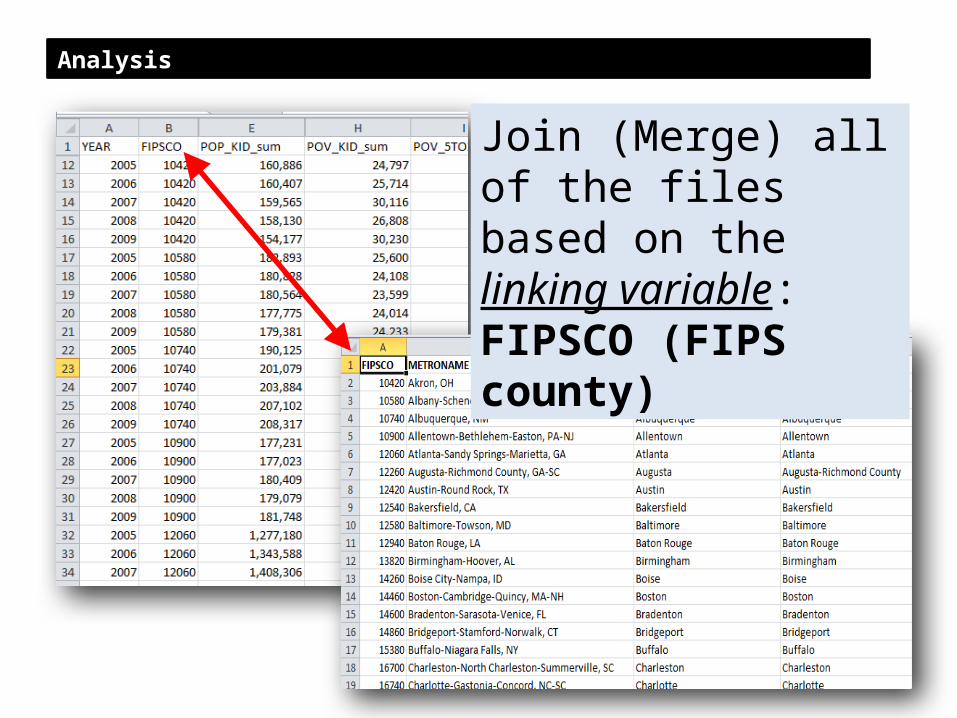
Join (Merge) all of the files based on the linking variable:FIPSCO (FIPS county)
Analysis
Analysis
Analysis
Analysis
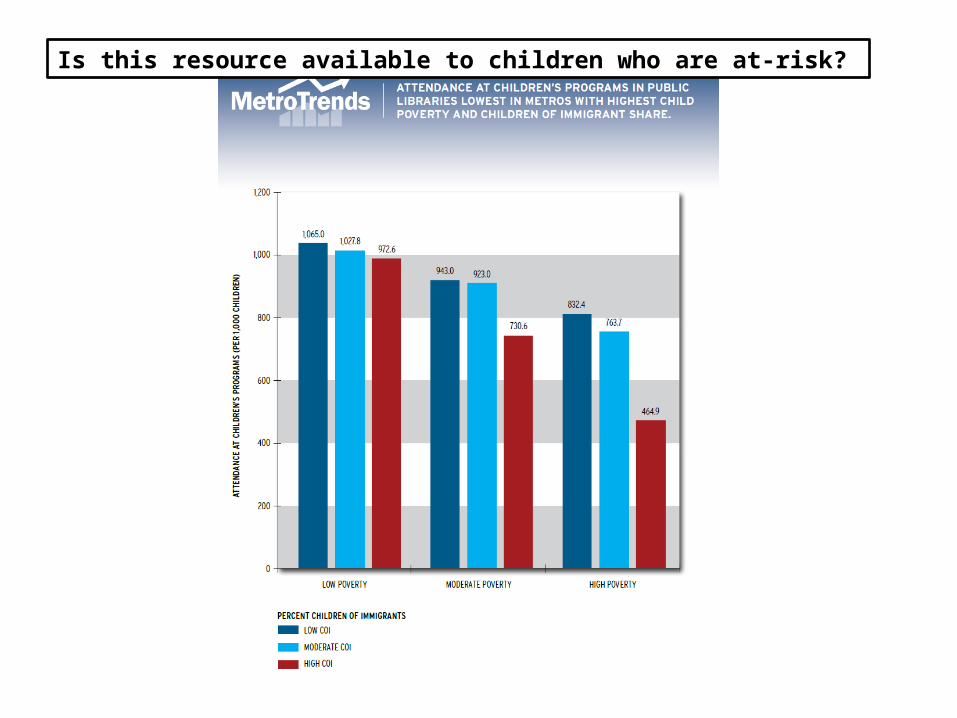
Is this resource available to children who are at-risk?
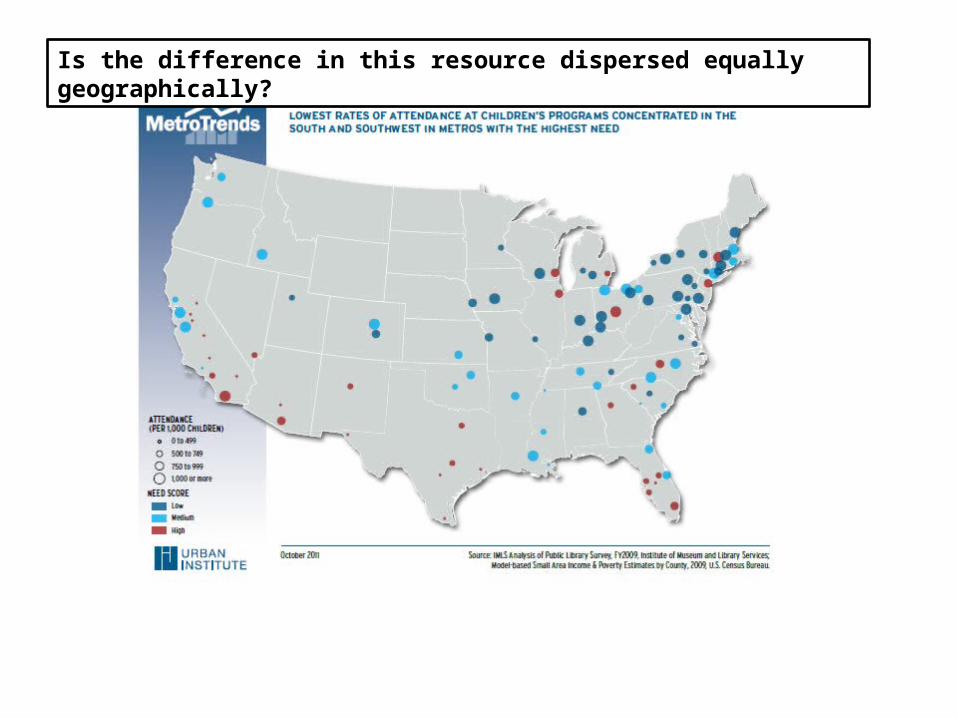
Is the difference in this resource dispersed equally geographically?
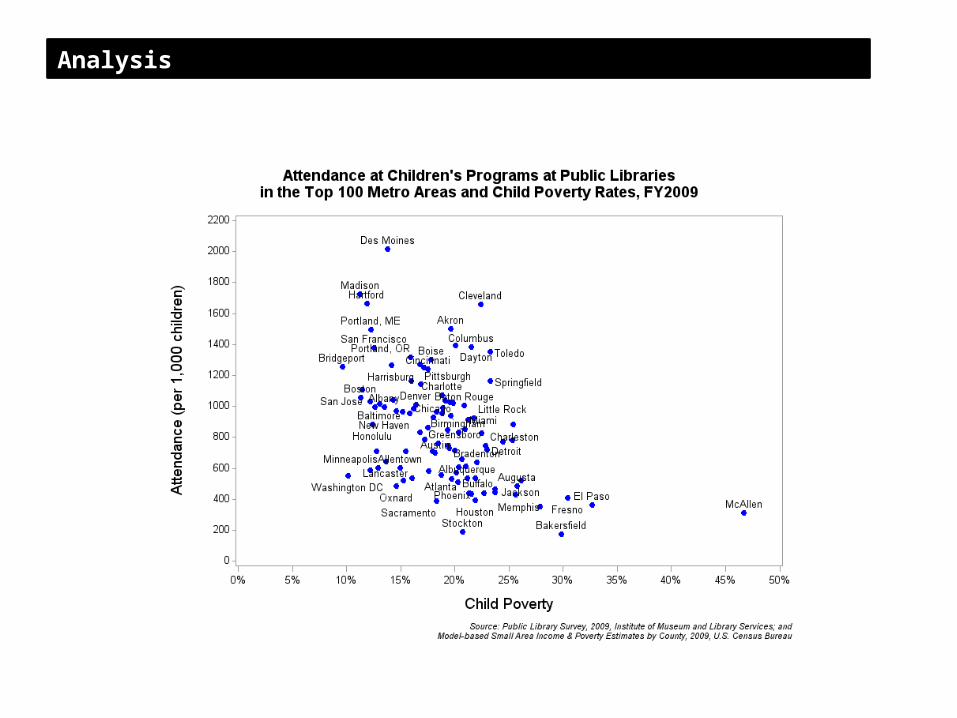
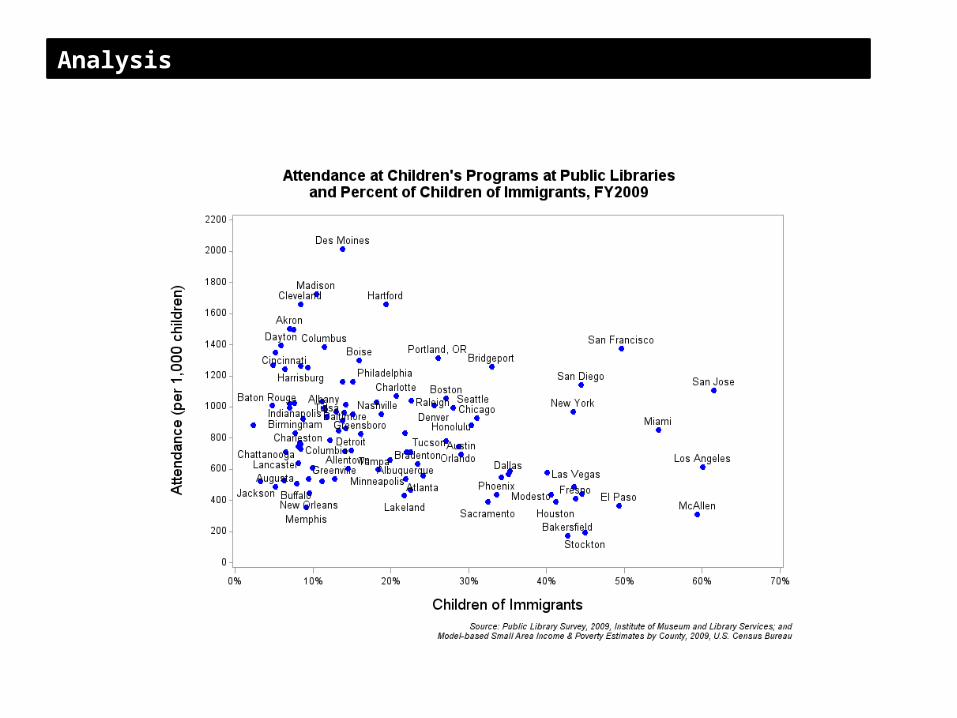
• In some areas with high concentrations of children with highest risk (poverty and COI status), there is lower attendance at children’s programs in public libraries.
Result
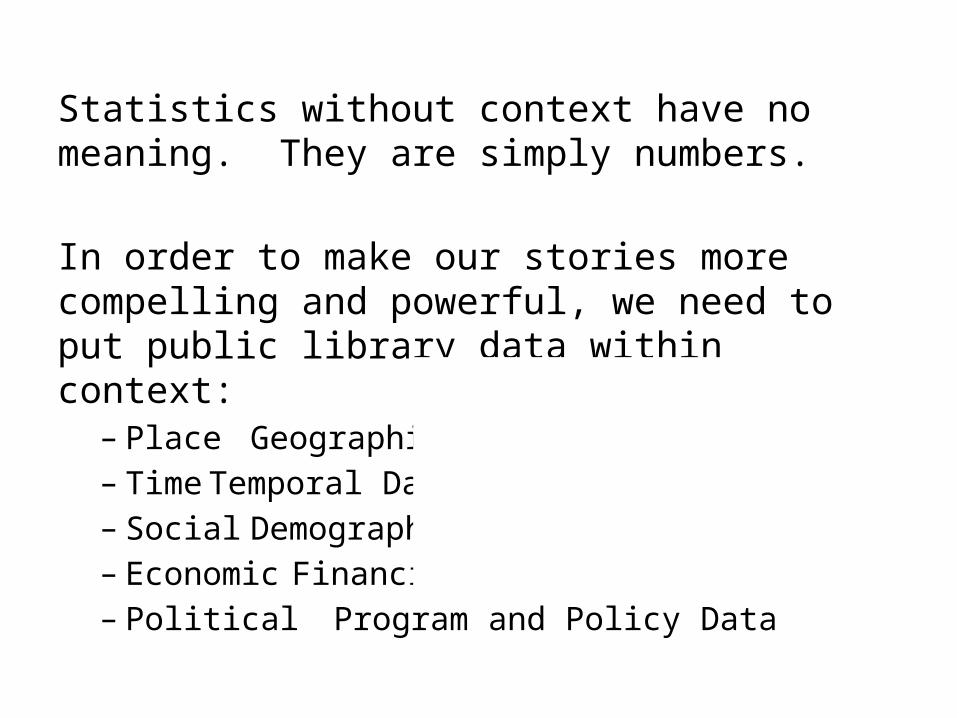
Statistics without context have no meaning. They are simply numbers.
In order to make our stories more compelling and powerful, we need to put public library data within context:
– Place Geographic, Spatial Data– Time Temporal Data– Social Demographic Data– Economic Financial / Labor Data– Political Program and Policy Data
Data Analysis
Data analysis is a process…
… of inspecting, cleaning, transforming, and modeling data…
… with the goal of uncovering information, supporting decision making, and telling stories.
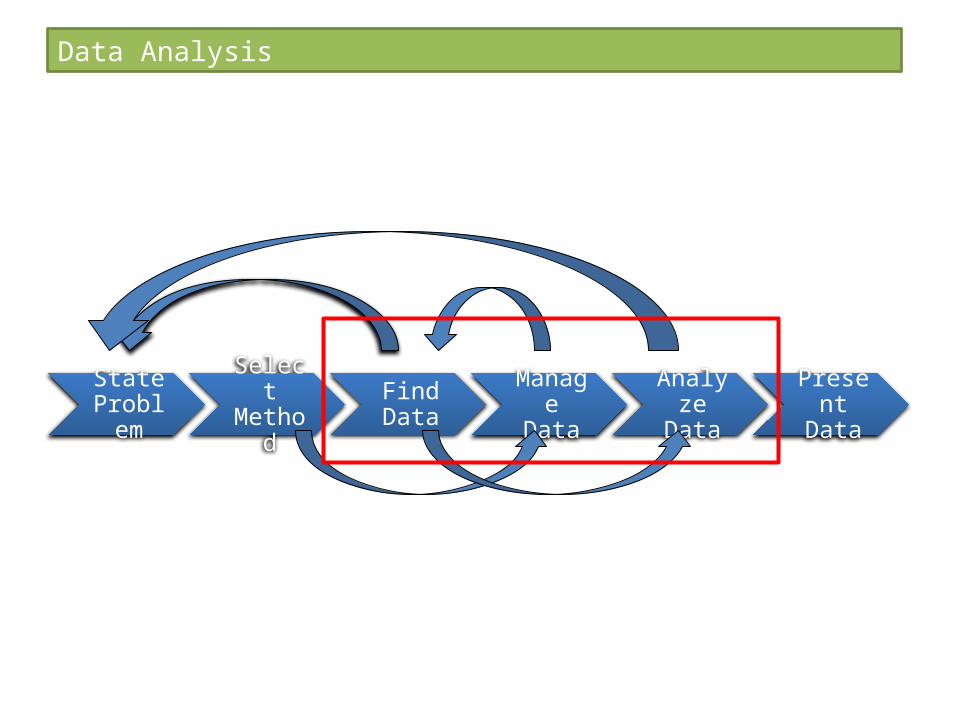
State Problem
Select Method
Find Data
Manage Data
Analyze Data
Present Data
Data Analysis
Find Data
Where can I get data to analyze?
Collect your own dataOR
Use data someone else collected.
Find Data
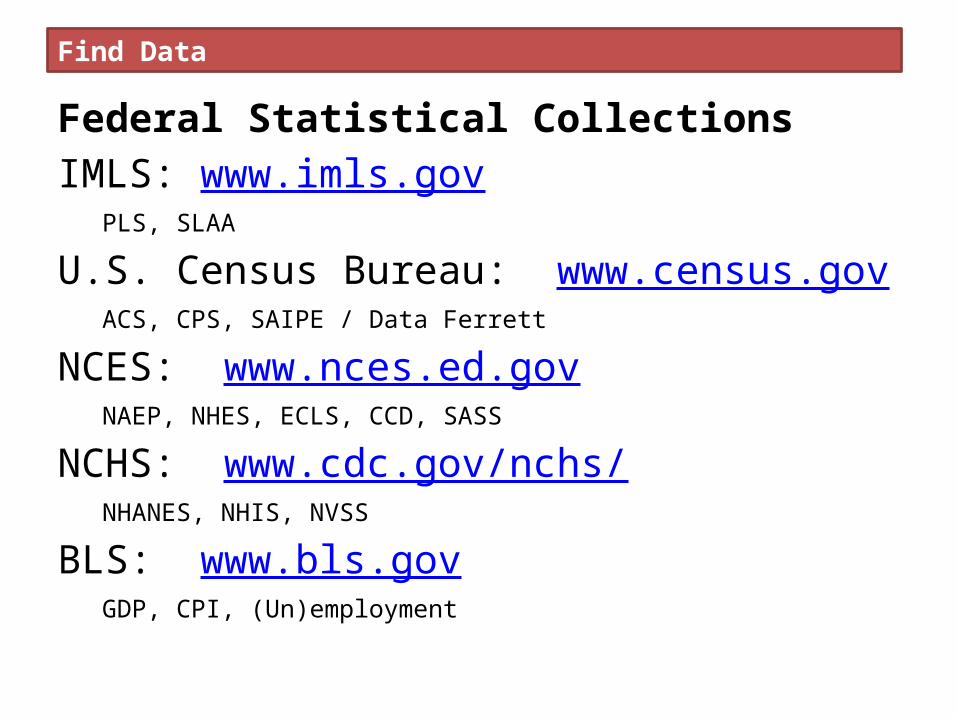
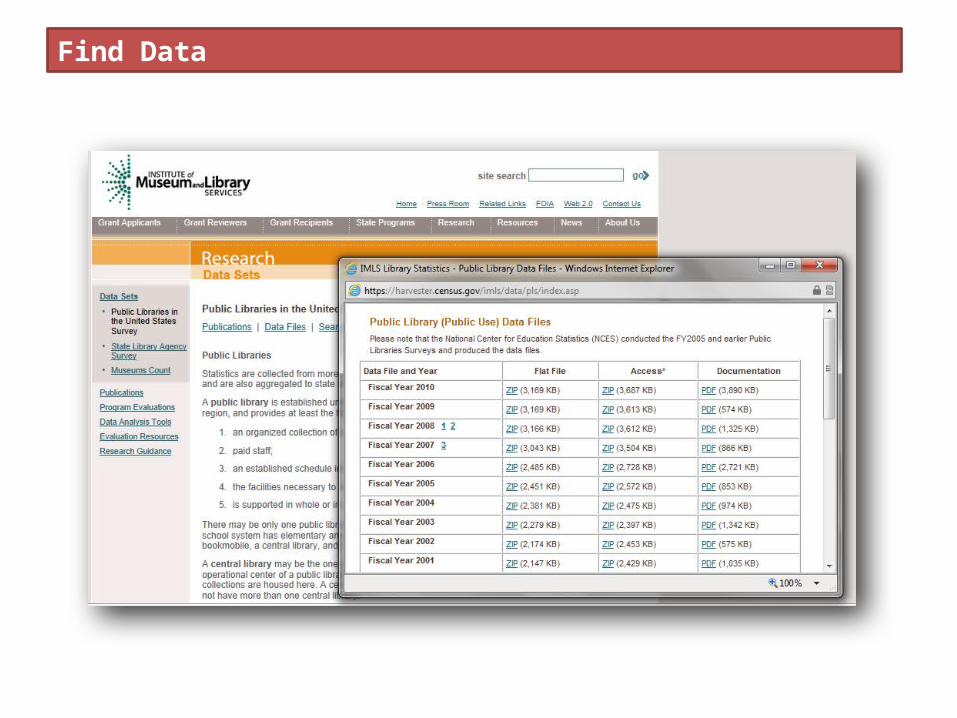
Federal Statistical CollectionsIMLS: www.imls.gov
PLS, SLAA
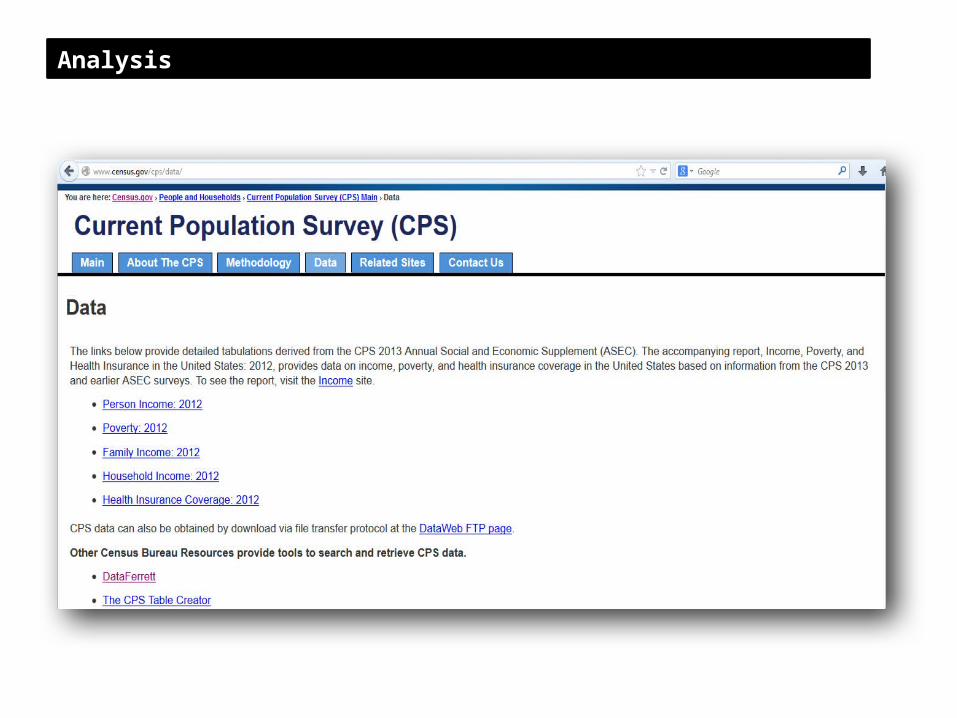
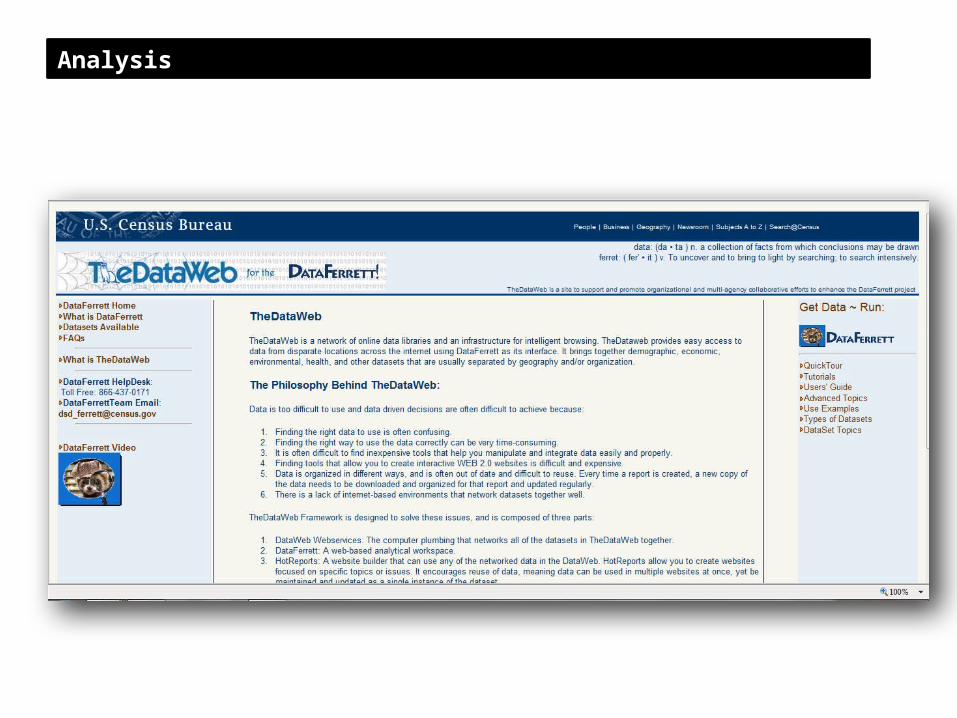
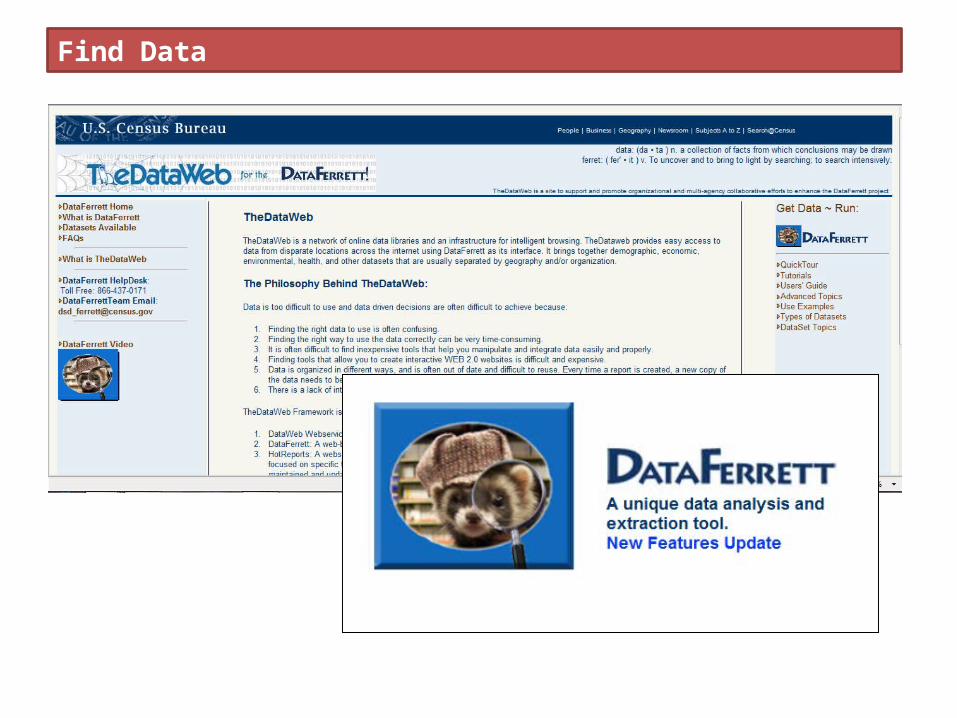
U.S. Census Bureau: www.census.gov ACS, CPS, SAIPE / Data Ferrett
NCES: www.nces.ed.gov NAEP, NHES, ECLS, CCD, SASS
NCHS: www.cdc.gov/nchs/ NHANES, NHIS, NVSS
BLS: www.bls.gov GDP, CPI, (Un)employment
Find Data
Find Data
Find Data
First rule of analysis club:Read the data documentation.
Second rule of analysis club:Read the data documentation.
Manage Data
Managing data includes all of the activities needed to
obtain, inspect,
clean, scrub,
transform, andmanipulate data.
Manage Data
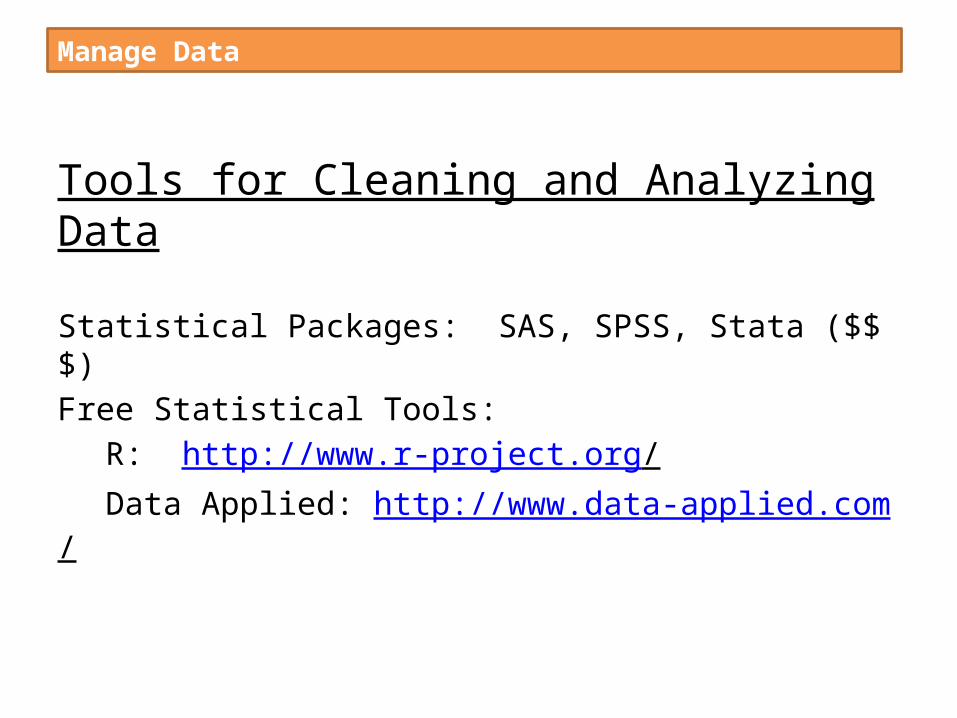
Tools for Cleaning and Analyzing Data
Statistical Packages: SAS, SPSS, Stata ($$$)Free Statistical Tools:
R: http://www.r-project.org/ Data Applied: http://www.data-applied.com/
Manage Data
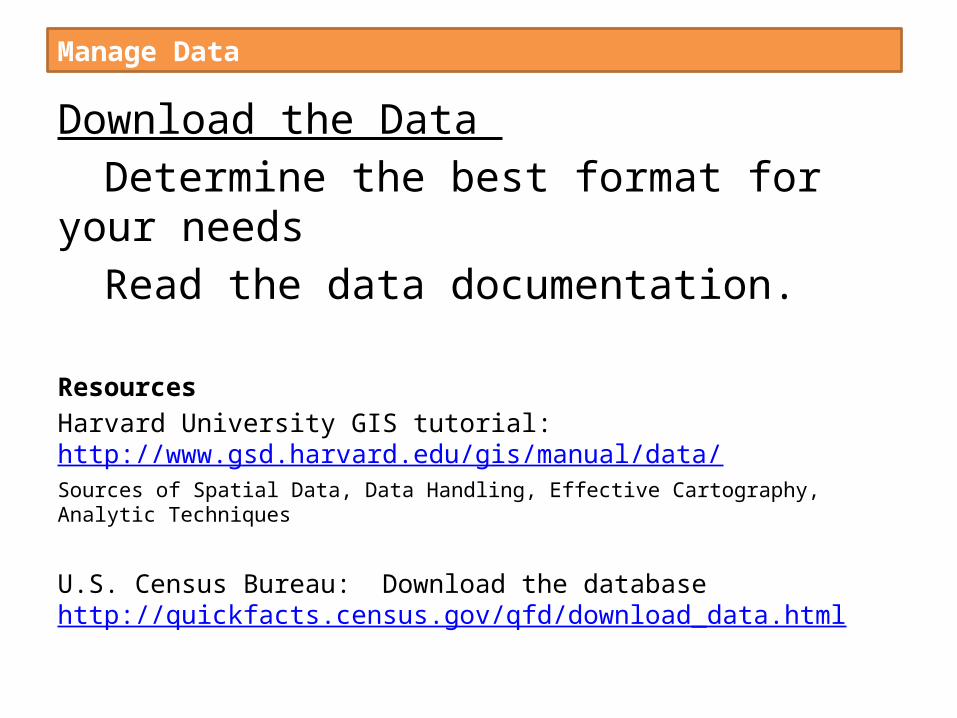
Download the Data Determine the best format for your needsRead the data documentation.
ResourcesHarvard University GIS tutorial: http://www.gsd.harvard.edu/gis/manual/data/ Sources of Spatial Data, Data Handling, Effective Cartography, Analytic Techniques
U.S. Census Bureau: Download the database http://quickfacts.census.gov/qfd/download_data.html
Manage Data
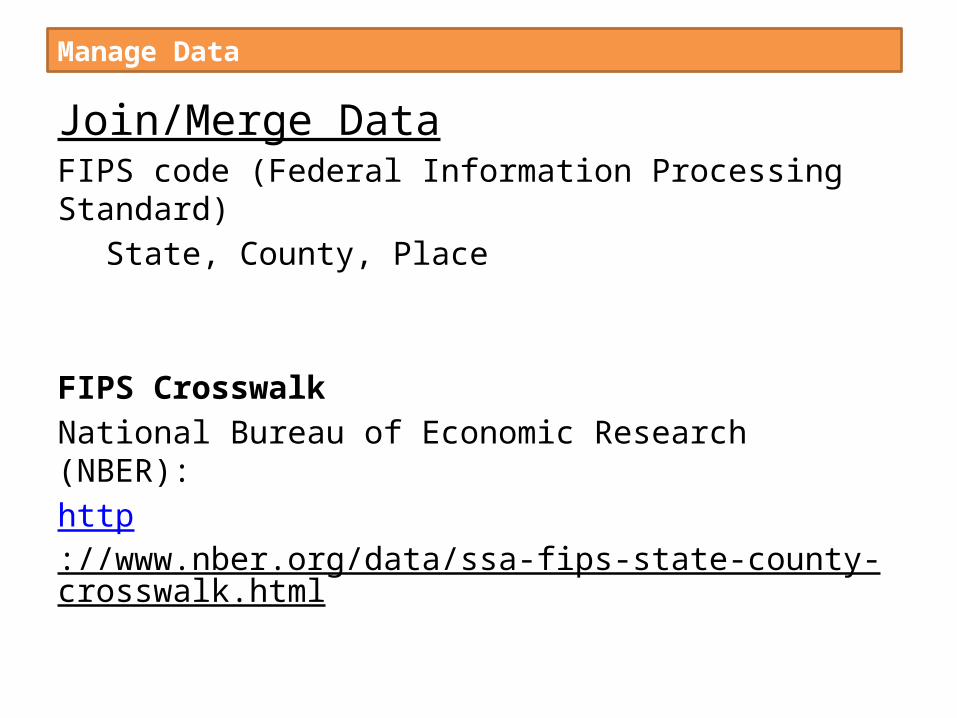
Join/Merge DataFIPS code (Federal Information Processing Standard)
State, County, Place
FIPS CrosswalkNational Bureau of Economic Research (NBER):http://www.nber.org/data/ssa-fips-state-county-crosswalk.html
Manage Data
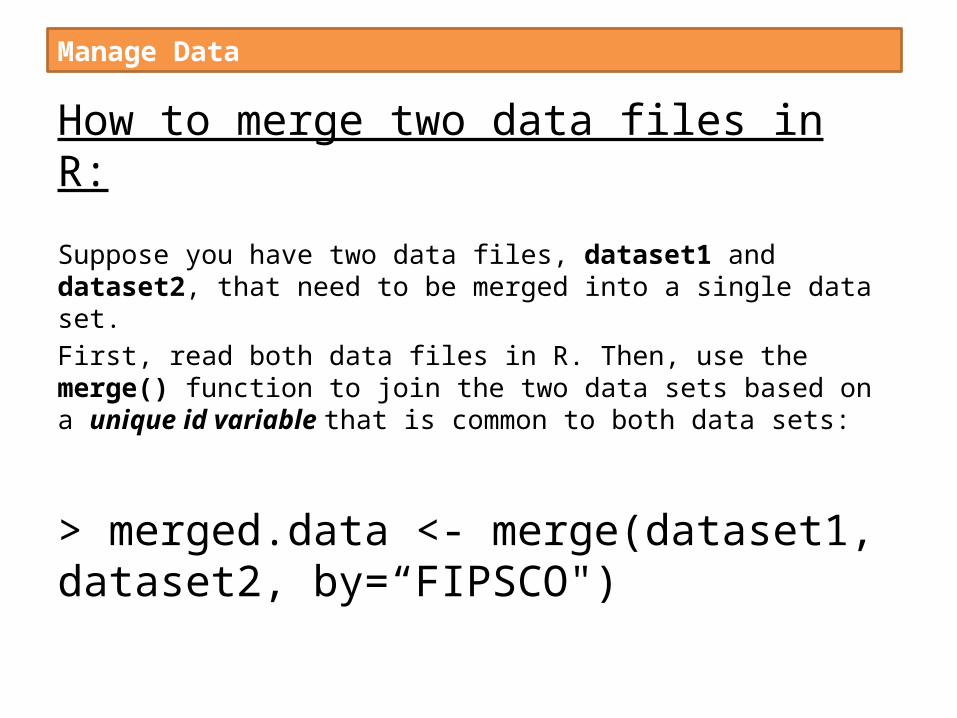
How to merge two data files in R:
Suppose you have two data files, dataset1 and dataset2, that need to be merged into a single data set. First, read both data files in R. Then, use the merge() function to join the two data sets based on a unique id variable that is common to both data sets:
> merged.data <- merge(dataset1, dataset2, by=“FIPSCO")
Manage Data
Explore/Clean Data
Manage Data
“…seeing may be believing or disbelieving, but above all, data analysis involves visual, as well as statistical, understanding.”
~ John W. Tukey
Exploratory Data Analysis
Manage Data
Exploratory Data Analysis is…
… a type of statistical analysis.… an attitude about looking at data.… a state of mind.
Traditional statistics = numerical summariesEDA = numerical summaries + graphical displays
Manage Data
Data = smooth + rough
Manage Data
The goal of EDAto discover patterns in the data.
The role of the analystto listen to the data
in as many ways as possibleuntil the data tell a story.
Manage Data
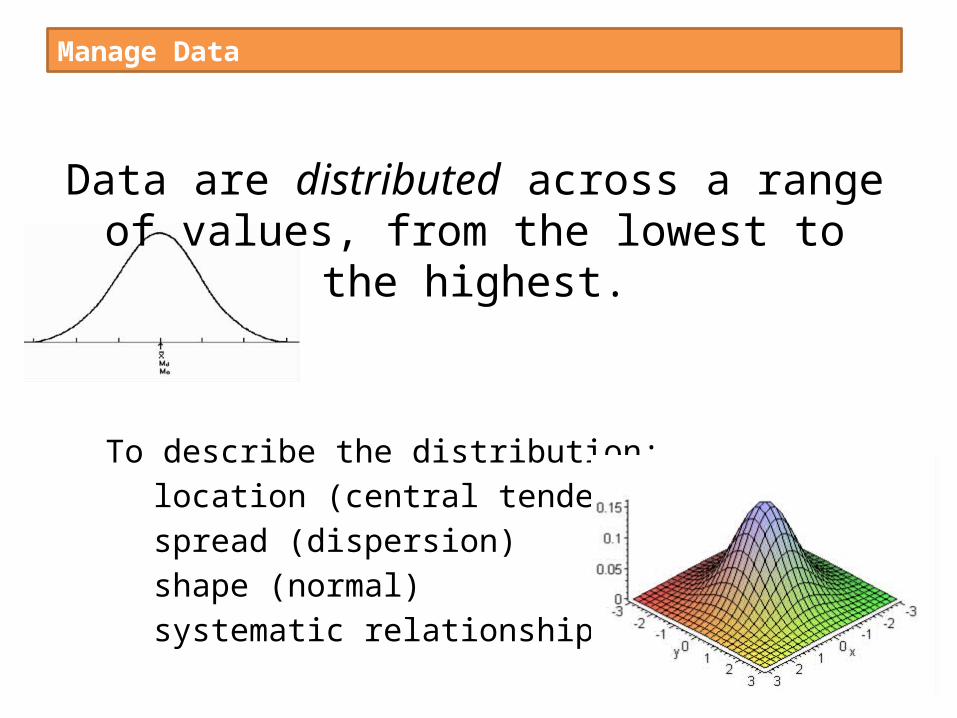
Data are distributed across a range of values, from the lowest to the highest.
To describe the distribution:location (central tendency)spread (dispersion)shape (normal)systematic relationships
Manage Data
Transform Data
Creating new variables based on original variables, such as…
Visitation per capita:
Adjusting financial data for inflation:
Manage Data
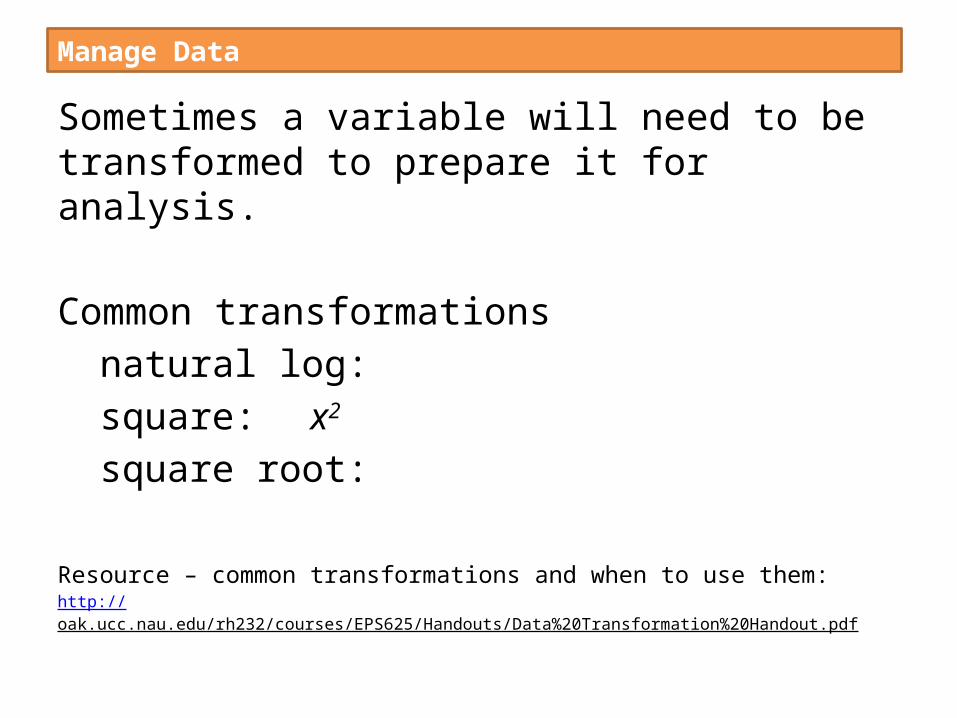
Sometimes a variable will need to be transformed to prepare it for analysis.
Common transformationsnatural log: square: x2
square root:
Resource – common transformations and when to use them:http://oak.ucc.nau.edu/rh232/courses/EPS625/Handouts/Data%20Transformation%20Handout.pdf
Analyze Data
Types of Data AnalysisDescriptiveExploratoryPredictive
Analyze Data
Data = smooth + rough
Analyze Data
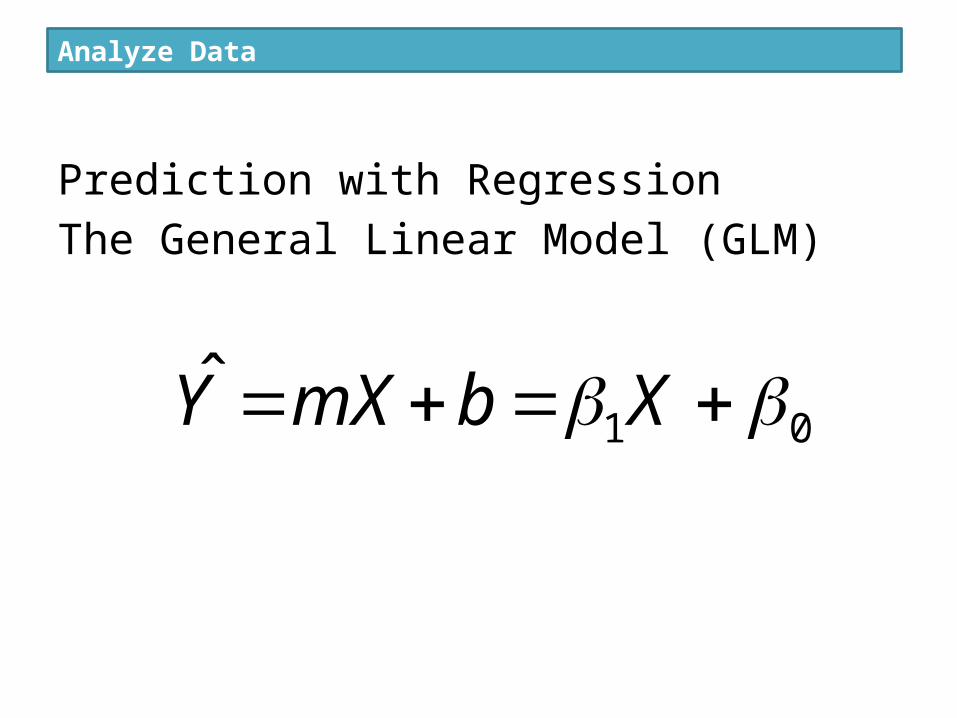
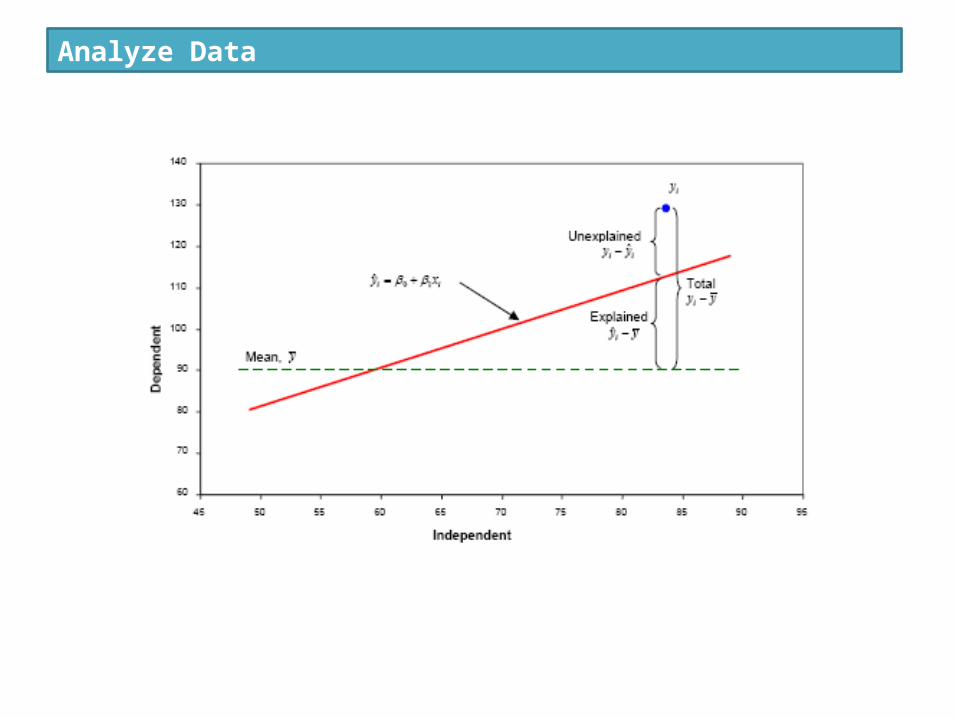
Prediction with RegressionThe General Linear Model (GLM)
01ˆ XbmXY
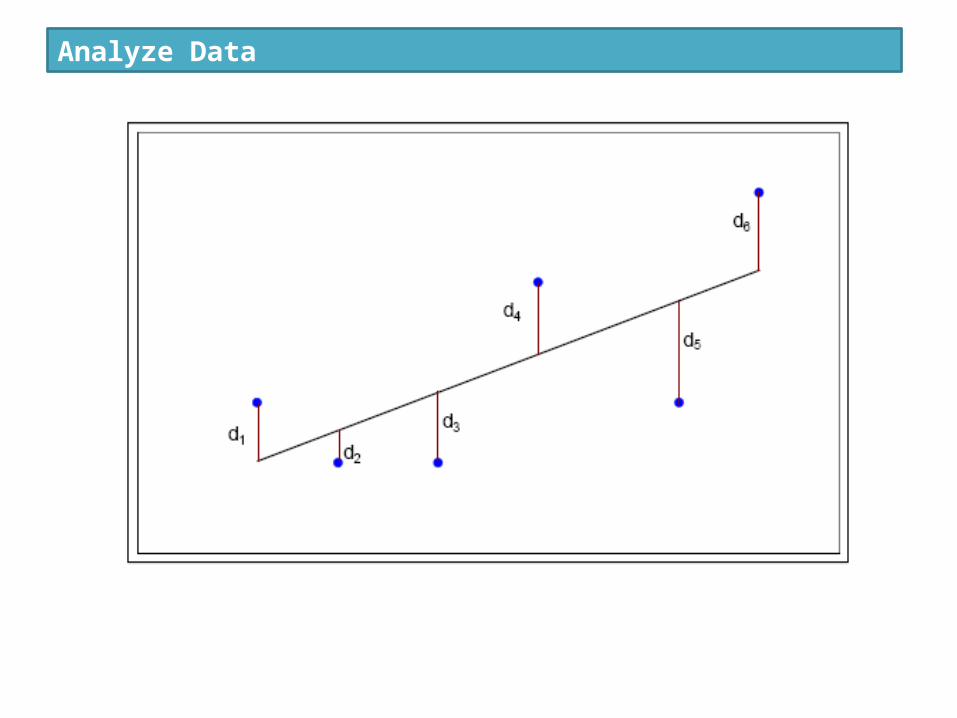
Analyze Data
Analyze Data
Analyze Data
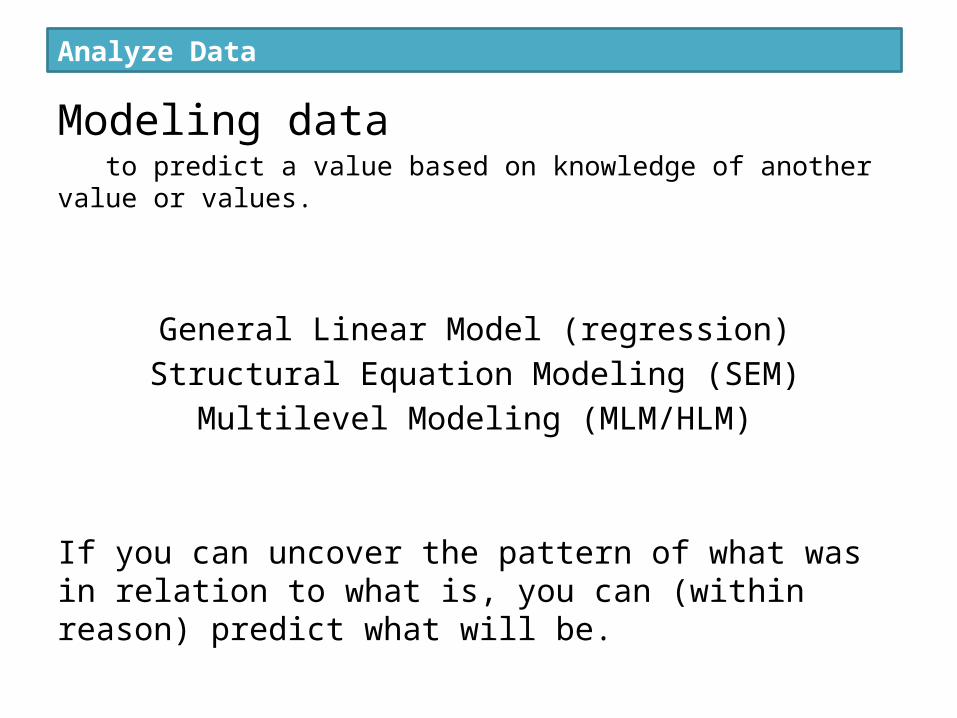
Modeling datato predict a value based on knowledge of another value or values.
General Linear Model (regression)Structural Equation Modeling (SEM)
Multilevel Modeling (MLM/HLM)
If you can uncover the pattern of what was in relation to what is, you can (within reason) predict what will be.
Present Data
“The greatest value of a picture is when it forces us to notice what we never expected to see.”
~ Tukey (1977, p. vi)
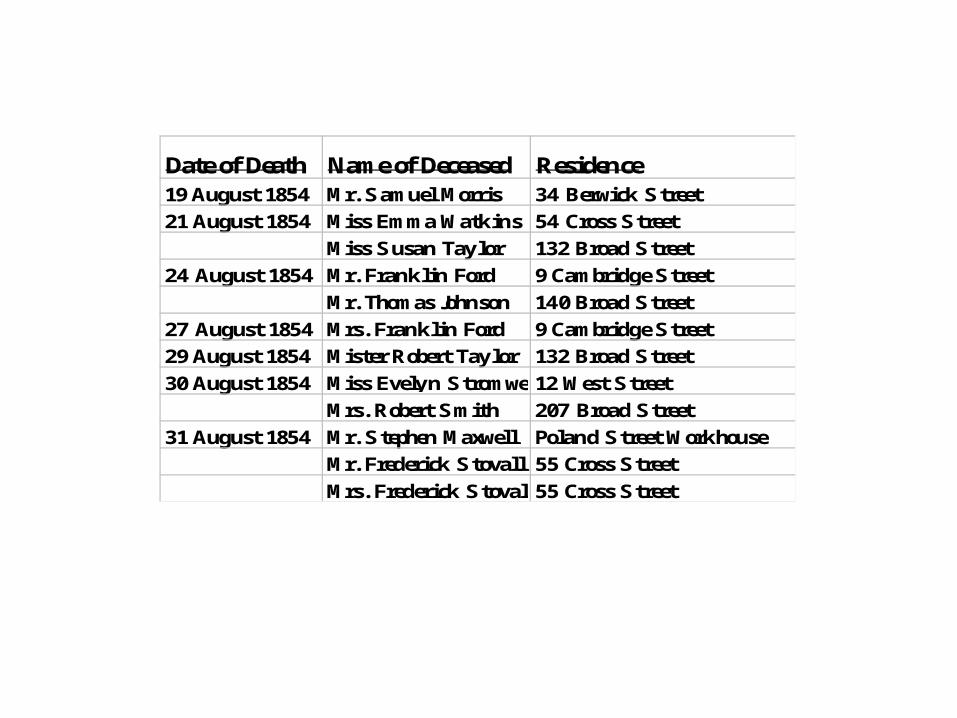
Date of Death Name of Deceased Residence19 August 1854 Mr. Samuel Morris 34 Berwick Street21 August 1854 Miss Emma Watkins 54 Cross Street
Miss Susan Taylor 132 Broad Street24 August 1854 Mr. Franklin Ford 9 Cambridge Street
Mr. Thomas Johnson 140 Broad Street27 August 1854 Mrs. Franklin Ford 9 Cambridge Street29 August 1854 Mister Robert Taylor 132 Broad Street30 August 1854 Miss Evelyn Stromwell12 West Street
Mrs. Robert Smith 207 Broad Street31 August 1854 Mr. Stephen Maxwell Poland Street Workhouse
Mr. Frederick Stovall 55 Cross StreetMrs. Frederick Stovall55 Cross Street
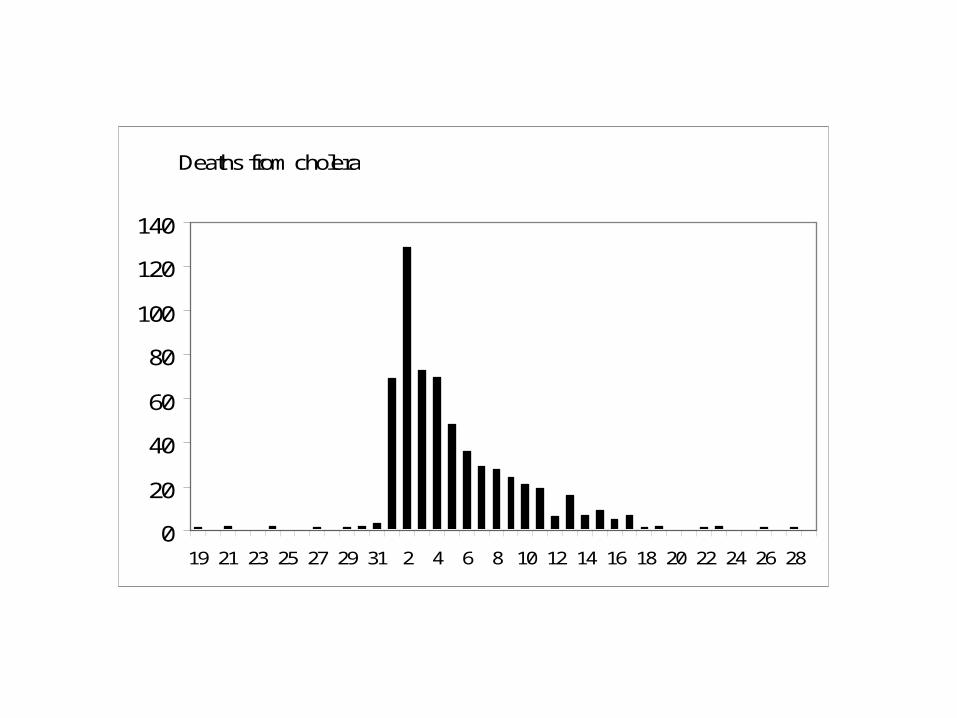
Deaths from cholera
0
20
40
60
80
100
120
140
19 21 23 25 27 29 31 2 4 6 8 10 12 14 16 18 20 22 24 26 28
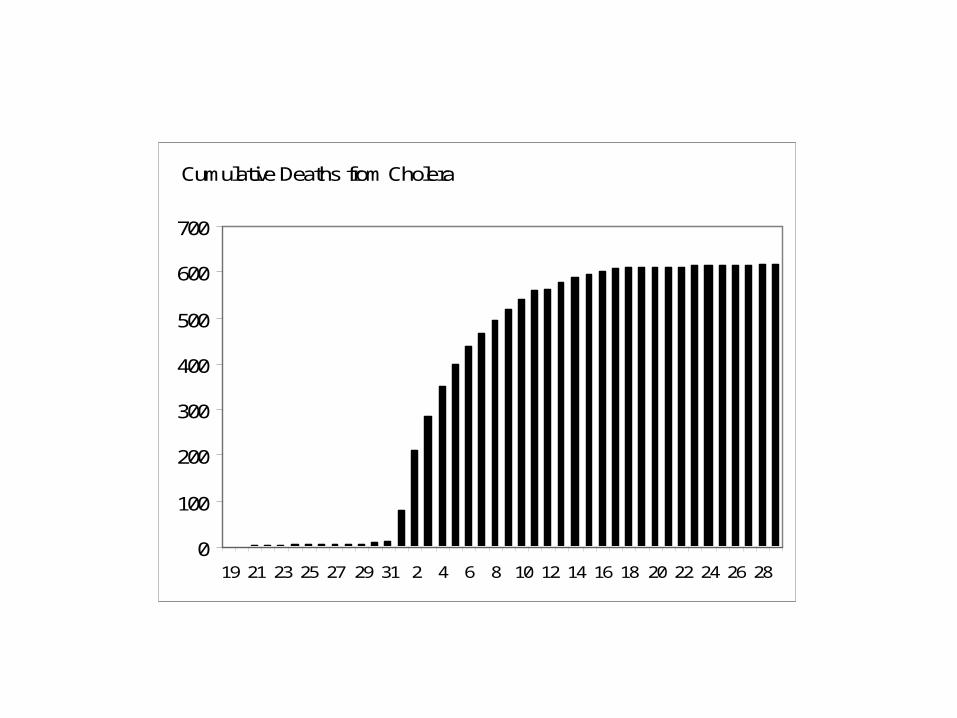
Cumulative Deaths from Cholera
0
100
200
300
400
500
600
700
19 21 23 25 27 29 31 2 4 6 8 10 12 14 16 18 20 22 24 26 28
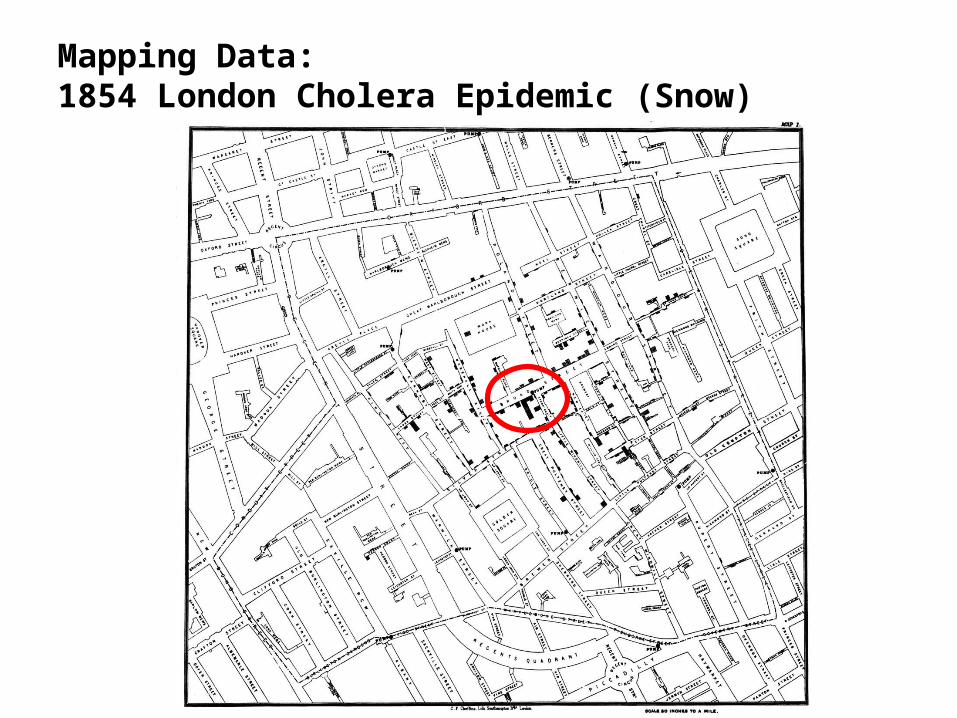
Mapping Data: 1854 London Cholera Epidemic (Snow)
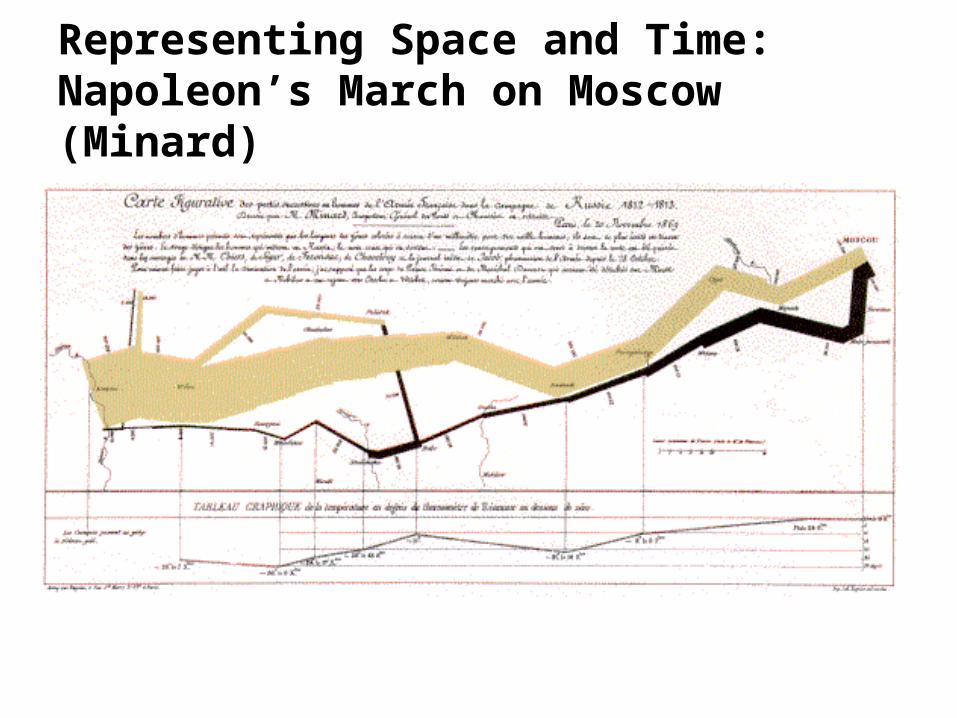
Representing Space and Time: Napoleon’s March on Moscow (Minard)
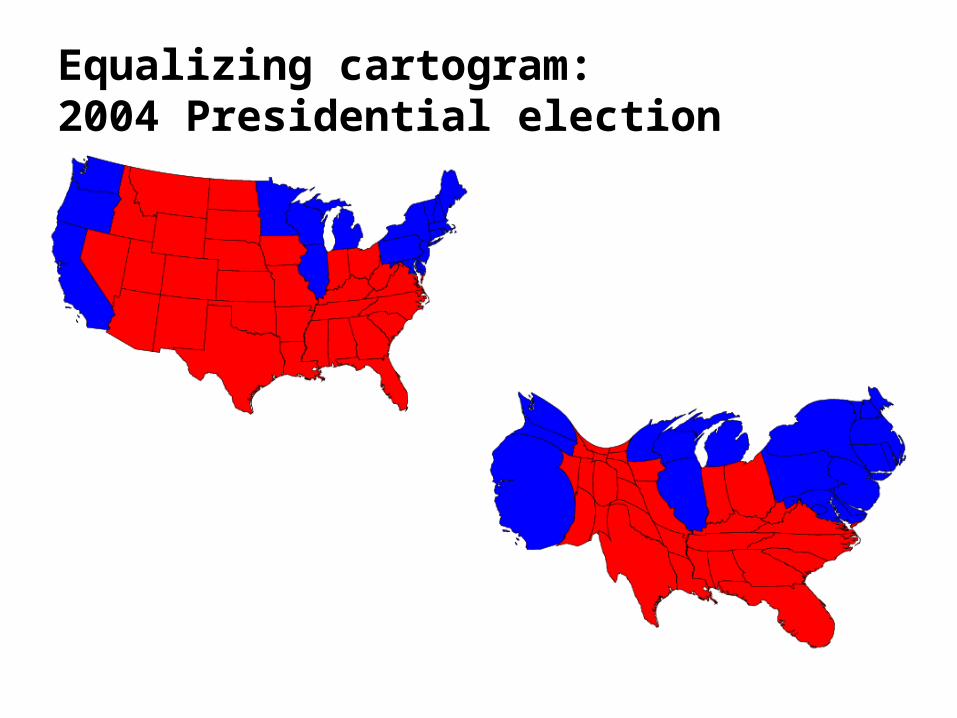
Equalizing cartogram: 2004 Presidential election
Merry Analysis and a Happy Data Year!
Thank you!Deanne SwanSr. StatisticianIMLS / OPRE
Frank NelsonIdaho Public Libraries