Embed Size (px)
Citation preview
ANALYSIS OF LEBANON’S MEDIA AND ADVERTISING
SECTOR
BankMed - Market & Economic Research Division

Global Media and Advertising Sector 3
Global Media and Advertising Market Size 3
Global Advertising Spending 5
Global Consumer Spending 9
Lebanon’s Media and Advertising Sector 12
Media and Advertising Industry Overview 12
Media and Advertising Sub-Sectors 14
Advertising 14
Television Broadcasting 18
Audiovisual Production 19
Digital and Social Media 19
Print Media 21
Lebanon’s Media and Advertising Rankings 22
Media Sustainability Index 22
Press Freedom Index 23
SPECIAL REPORT
BankMed - Market & Economic Research Division 2
Analysis of Lebanon’s Media and Advertising Sector - May 2014
TABLE OF CONTENTS
3
GLOBAL MEDIA AND ADVERTISING MARKET SIZE
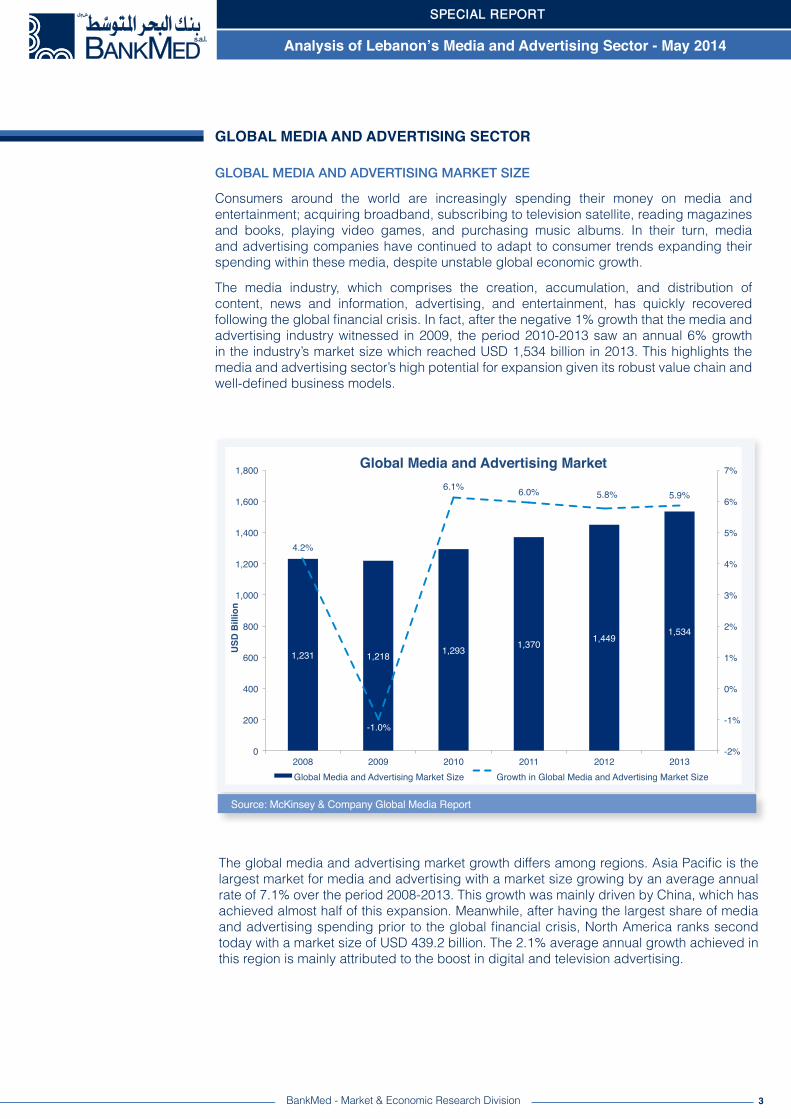
Consumers around the world are increasingly spending their money on media and entertainment; acquiring broadband, subscribing to television satellite, reading magazines and books, playing video games, and purchasing music albums. In their turn, media and advertising companies have continued to adapt to consumer trends expanding their spending within these media, despite unstable global economic growth.
The media industry, which comprises the creation, accumulation, and distribution of content, news and information, advertising, and entertainment, has quickly recovered following the global financial crisis. In fact, after the negative 1% growth that the media and advertising industry witnessed in 2009, the period 2010-2013 saw an annual 6% growth in the industry’s market size which reached USD 1,534 billion in 2013. This highlights the media and advertising sector’s high potential for expansion given its robust value chain and well-defined business models.
GLOBAL MEDIA AND ADVERTISING SECTOR
Source: McKinsey & Company Global Media Report
BankMed - Market & Economic Research Division
The global media and advertising market growth differs among regions. Asia Pacific is the largest market for media and advertising with a market size growing by an average annual rate of 7.1% over the period 2008-2013. This growth was mainly driven by China, which has achieved almost half of this expansion. Meanwhile, after having the largest share of media and advertising spending prior to the global financial crisis, North America ranks second today with a market size of USD 439.2 billion. The 2.1% average annual growth achieved in this region is mainly attributed to the boost in digital and television advertising.
SPECIAL REPORT
Analysis of Lebanon’s Media and Advertising Sector - May 2014
4
Source: McKinsey & Company Global Media Report
BankMed - Market & Economic Research Division
GLOBAL MEDIA AND ADVERTISING SECTOR
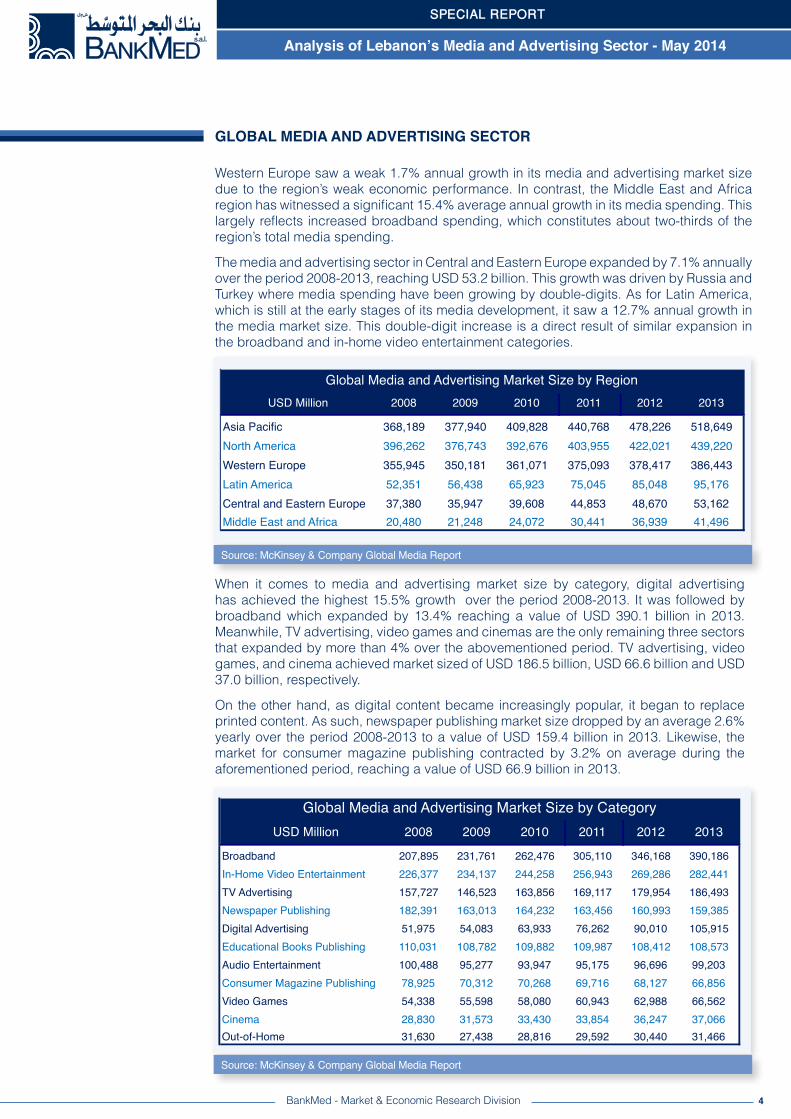
Western Europe saw a weak 1.7% annual growth in its media and advertising market size due to the region’s weak economic performance. In contrast, the Middle East and Africa region has witnessed a significant 15.4% average annual growth in its media spending. This largely reflects increased broadband spending, which constitutes about two-thirds of the region’s total media spending.
The media and advertising sector in Central and Eastern Europe expanded by 7.1% annually over the period 2008-2013, reaching USD 53.2 billion. This growth was driven by Russia and Turkey where media spending have been growing by double-digits. As for Latin America, which is still at the early stages of its media development, it saw a 12.7% annual growth in the media market size. This double-digit increase is a direct result of similar expansion in the broadband and in-home video entertainment categories.
USD Million 2008 2009 2010 2011 2012 2013
Asia Pacific 368,189 377,940 409,828 440,768 478,226 518,649North America 396,262 376,743 392,676 403,955 422,021 439,220Western Europe 355,945 350,181 361,071 375,093 378,417 386,443Latin America 52,351 56,438 65,923 75,045 85,048 95,176Central and Eastern Europe 37,380 35,947 39,608 44,853 48,670 53,162Middle East and Africa 20,480 21,248 24,072 30,441 36,939 41,496
Global Media and Advertising Market Size by Region
When it comes to media and advertising market size by category, digital advertising has achieved the highest 15.5% growth over the period 2008-2013. It was followed by broadband which expanded by 13.4% reaching a value of USD 390.1 billion in 2013. Meanwhile, TV advertising, video games and cinemas are the only remaining three sectors that expanded by more than 4% over the abovementioned period. TV advertising, video games, and cinema achieved market sized of USD 186.5 billion, USD 66.6 billion and USD 37.0 billion, respectively.
On the other hand, as digital content became increasingly popular, it began to replace printed content. As such, newspaper publishing market size dropped by an average 2.6% yearly over the period 2008-2013 to a value of USD 159.4 billion in 2013. Likewise, the market for consumer magazine publishing contracted by 3.2% on average during the aforementioned period, reaching a value of USD 66.9 billion in 2013.
USD Million 2008 2009 2010 2011 2012 2013
Broadband 207,895 231,761 262,476 305,110 346,168 390,186In-Home Video Entertainment 226,377 234,137 244,258 256,943 269,286 282,441TV Advertising 157,727 146,523 163,856 169,117 179,954 186,493Newspaper Publishing 182,391 163,013 164,232 163,456 160,993 159,385Digital Advertising 51,975 54,083 63,933 76,262 90,010 105,915Educational Books Publishing 110,031 108,782 109,882 109,987 108,412 108,573Audio Entertainment 100,488 95,277 93,947 95,175 96,696 99,203Consumer Magazine Publishing 78,925 70,312 70,268 69,716 68,127 66,856Video Games 54,338 55,598 58,080 60,943 62,988 66,562Cinema 28,830 31,573 33,430 33,854 36,247 37,066Out-of-Home 31,630 27,438 28,816 29,592 30,440 31,466
Global Media and Advertising Market Size by Category
Source: McKinsey & Company Global Media Report
SPECIAL REPORT
Analysis of Lebanon’s Media and Advertising Sector - May 2014
5
GLOBAL ADVERTISING SPENDING
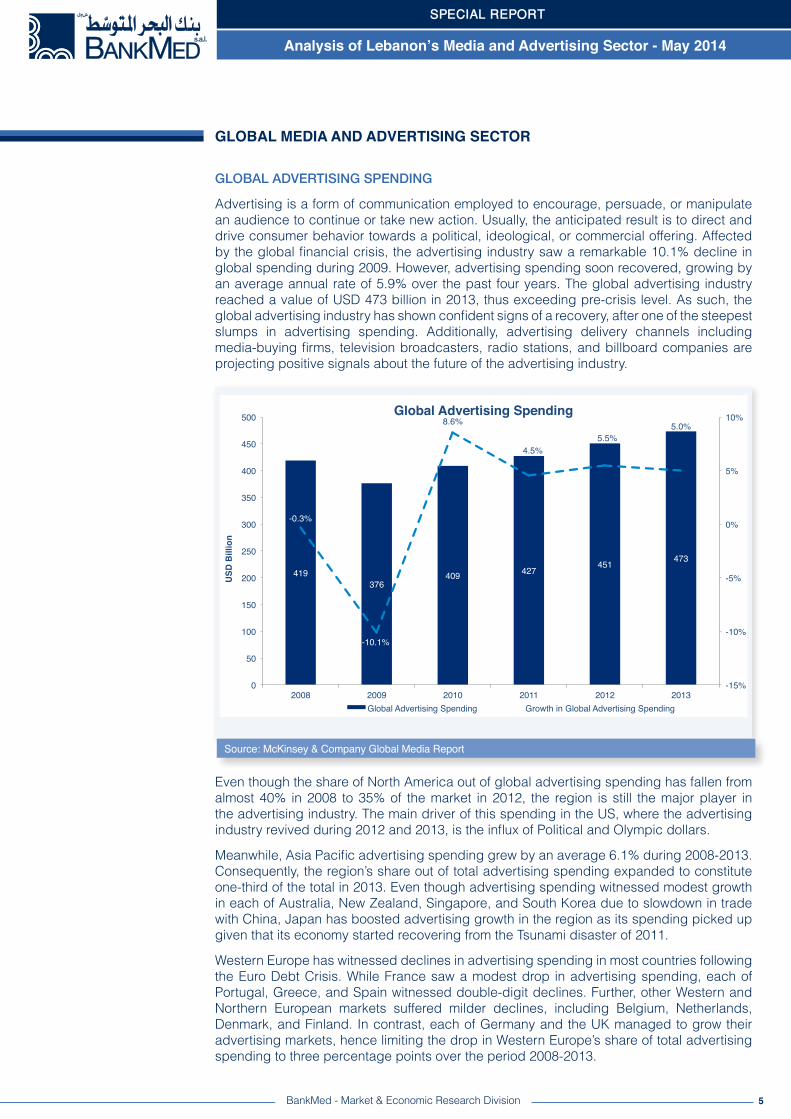
Advertising is a form of communication employed to encourage, persuade, or manipulate an audience to continue or take new action. Usually, the anticipated result is to direct and drive consumer behavior towards a political, ideological, or commercial offering. Affected by the global financial crisis, the advertising industry saw a remarkable 10.1% decline in global spending during 2009. However, advertising spending soon recovered, growing by an average annual rate of 5.9% over the past four years. The global advertising industry reached a value of USD 473 billion in 2013, thus exceeding pre-crisis level. As such, the global advertising industry has shown confident signs of a recovery, after one of the steepest slumps in advertising spending. Additionally, advertising delivery channels including media-buying firms, television broadcasters, radio stations, and billboard companies are projecting positive signals about the future of the advertising industry.
Source: McKinsey & Company Global Media Report
BankMed - Market & Economic Research Division
GLOBAL MEDIA AND ADVERTISING SECTOR
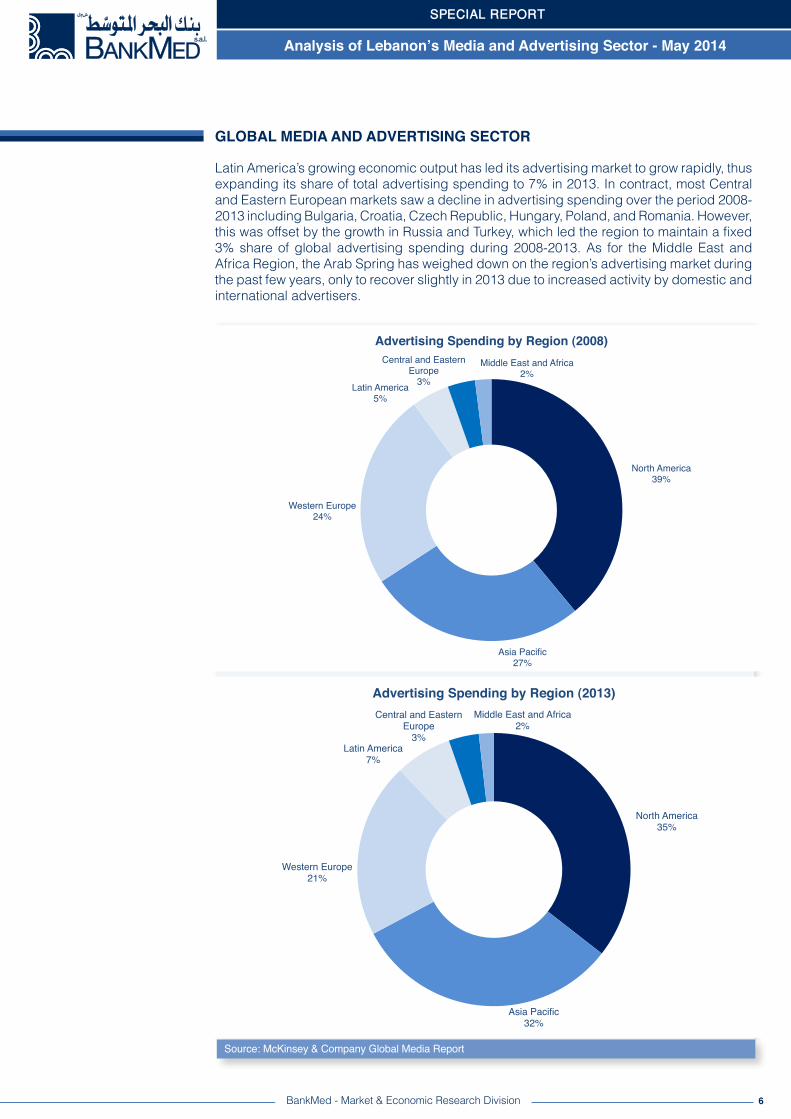
Even though the share of North America out of global advertising spending has fallen from almost 40% in 2008 to 35% of the market in 2012, the region is still the major player in the advertising industry. The main driver of this spending in the US, where the advertising industry revived during 2012 and 2013, is the influx of Political and Olympic dollars.
Meanwhile, Asia Pacific advertising spending grew by an average 6.1% during 2008-2013. Consequently, the region’s share out of total advertising spending expanded to constitute one-third of the total in 2013. Even though advertising spending witnessed modest growth in each of Australia, New Zealand, Singapore, and South Korea due to slowdown in trade with China, Japan has boosted advertising growth in the region as its spending picked up given that its economy started recovering from the Tsunami disaster of 2011.
Western Europe has witnessed declines in advertising spending in most countries following the Euro Debt Crisis. While France saw a modest drop in advertising spending, each of Portugal, Greece, and Spain witnessed double-digit declines. Further, other Western and Northern European markets suffered milder declines, including Belgium, Netherlands, Denmark, and Finland. In contrast, each of Germany and the UK managed to grow their advertising markets, hence limiting the drop in Western Europe’s share of total advertising spending to three percentage points over the period 2008-2013.
SPECIAL REPORT
Analysis of Lebanon’s Media and Advertising Sector - May 2014
6
Source: McKinsey & Company Global Media Report
Latin America’s growing economic output has led its advertising market to grow rapidly, thus expanding its share of total advertising spending to 7% in 2013. In contract, most Central and Eastern European markets saw a decline in advertising spending over the period 2008-2013 including Bulgaria, Croatia, Czech Republic, Hungary, Poland, and Romania. However, this was offset by the growth in Russia and Turkey, which led the region to maintain a fixed 3% share of global advertising spending during 2008-2013. As for the Middle East and Africa Region, the Arab Spring has weighed down on the region’s advertising market during the past few years, only to recover slightly in 2013 due to increased activity by domestic and international advertisers.
BankMed - Market & Economic Research Division
GLOBAL MEDIA AND ADVERTISING SECTOR
North America!39%!
Asia Pacific!27%!
Western Europe!24%!
Latin America!5%!
Central and Eastern Europe!
3%!
Middle East and Africa!2%!
Advertising Spending by Region (2008)!
North America!35%!
Asia Pacific!32%!
Western Europe!21%!
Latin America!7%!
Central and Eastern Europe!
3%!
Middle East and Africa!2%!
Advertising Spending by Region (2013)!
SPECIAL REPORT
Analysis of Lebanon’s Media and Advertising Sector - May 2014
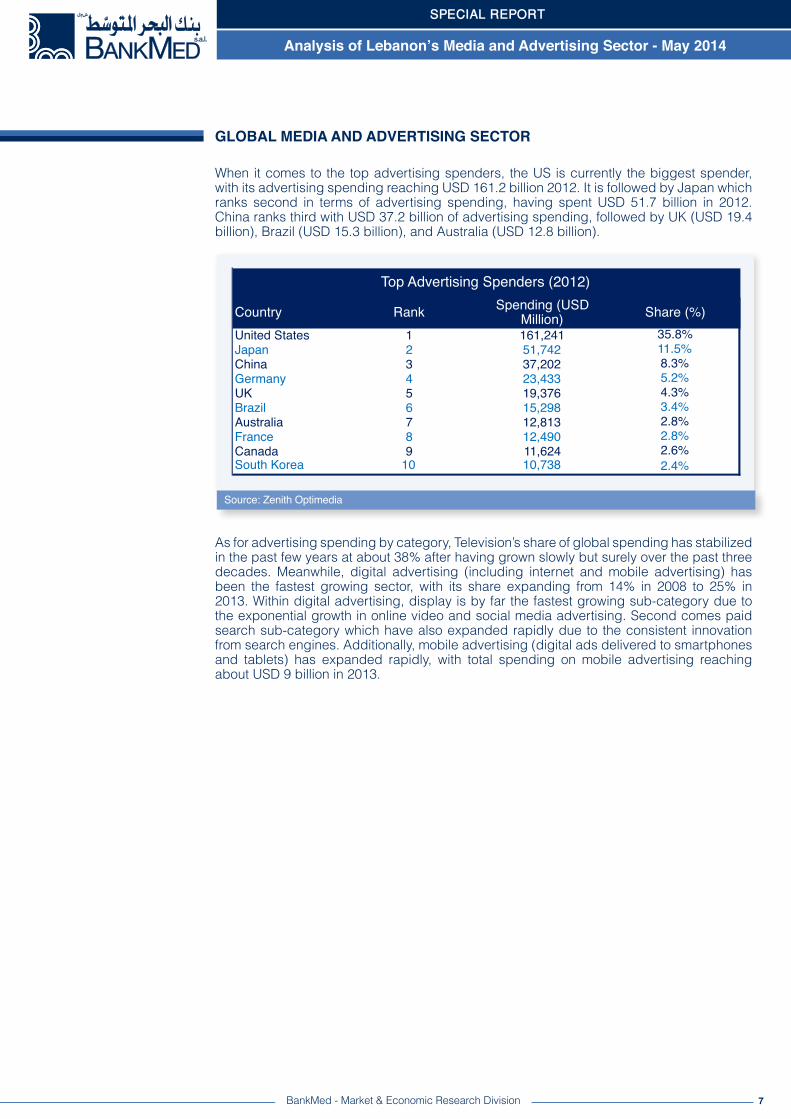
When it comes to the top advertising spenders, the US is currently the biggest spender, with its advertising spending reaching USD 161.2 billion 2012. It is followed by Japan which ranks second in terms of advertising spending, having spent USD 51.7 billion in 2012. China ranks third with USD 37.2 billion of advertising spending, followed by UK (USD 19.4 billion), Brazil (USD 15.3 billion), and Australia (USD 12.8 billion).
7
Source: Zenith Optimedia
BankMed - Market & Economic Research Division
GLOBAL MEDIA AND ADVERTISING SECTOR
Country Rank Spending (USD Million) Share (%)
United States 1 161,241 35.8%Japan 2 51,742 11.5%China 3 37,202 8.3%Germany 4 23,433 5.2%UK 5 19,376 4.3%Brazil 6 15,298 3.4%Australia 7 12,813 2.8%France 8 12,490 2.8%Canada 9 11,624 2.6%South Korea 10 10,738 2.4%
Top Advertising Spenders (2012)
As for advertising spending by category, Television’s share of global spending has stabilized in the past few years at about 38% after having grown slowly but surely over the past three decades. Meanwhile, digital advertising (including internet and mobile advertising) has been the fastest growing sector, with its share expanding from 14% in 2008 to 25% in 2013. Within digital advertising, display is by far the fastest growing sub-category due to the exponential growth in online video and social media advertising. Second comes paid search sub-category which have also expanded rapidly due to the consistent innovation from search engines. Additionally, mobile advertising (digital ads delivered to smartphones and tablets) has expanded rapidly, with total spending on mobile advertising reaching about USD 9 billion in 2013.
SPECIAL REPORT
Analysis of Lebanon’s Media and Advertising Sector - May 2014

8
Source: McKinsey & Company Global Media Report
GLOBAL MEDIA AND ADVERTISING SECTOR
BankMed - Market & Economic Research Division
Television!37%!
Digital!14%!
Newspapers!25%!
Audio!8%!
Out-of-Home!7%!
Consumer Magazines!8%!
Video Games!0%!
Cinema!1%!
Advertising Spending by Category (2008)!
Television!38%!
Digital!25%!
Newspapers!17%!
Audio!7%!
Out-of-Home!6%!
Consumer Magazines!5%!
Video Games!1%!
Cinema!1%!
Advertising Spending by Category (2013)!
With digital advertising growing quickly, other advertising categories have lost shares in recent years. In fact, internet and mobile advertising have principally risen at the expense of print. As such, the share of newspaper advertising dropped from 25% in 2008 to 17% of total spending in 2013. As for consumer magazines advertising, its share fell by three percentage points over the period 2008-2013 to only 5%.
SPECIAL REPORT
Analysis of Lebanon’s Media and Advertising Sector - May 2014
9
Source: McKinsey & Company Global Media Report
BankMed - Market & Economic Research Division
GLOBAL CONSUMER SPENDING
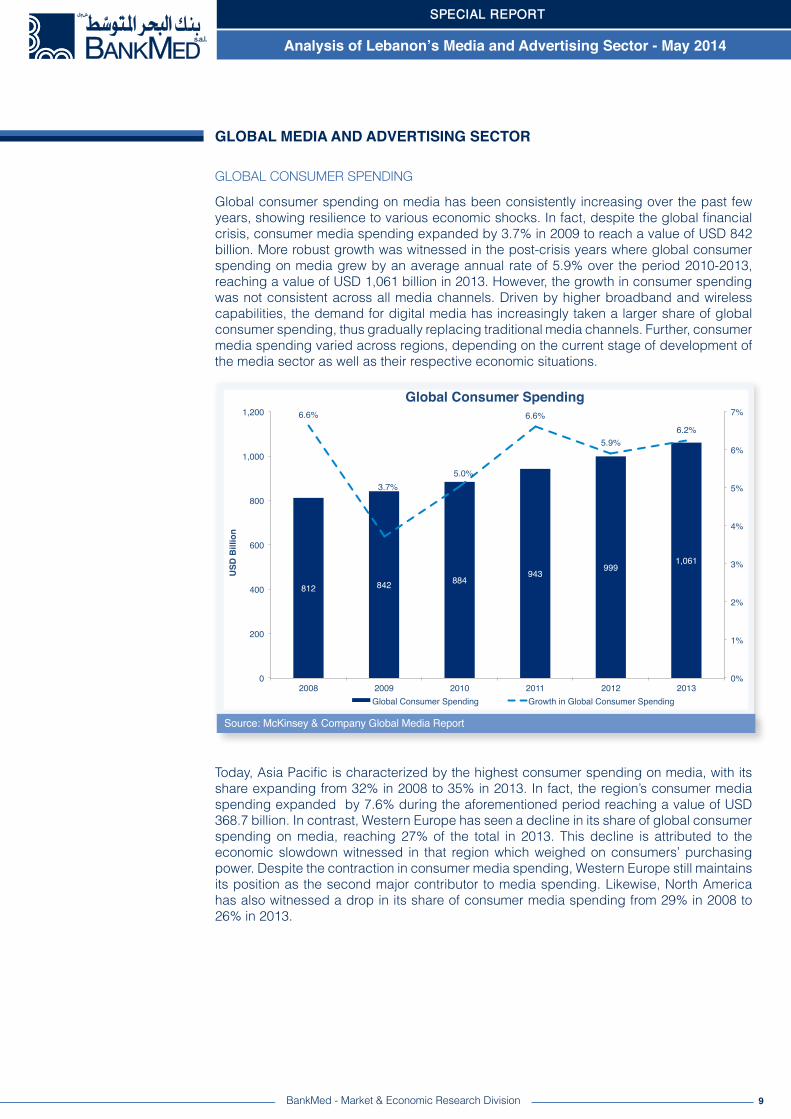
Global consumer spending on media has been consistently increasing over the past few years, showing resilience to various economic shocks. In fact, despite the global financial crisis, consumer media spending expanded by 3.7% in 2009 to reach a value of USD 842 billion. More robust growth was witnessed in the post-crisis years where global consumer spending on media grew by an average annual rate of 5.9% over the period 2010-2013, reaching a value of USD 1,061 billion in 2013. However, the growth in consumer spending was not consistent across all media channels. Driven by higher broadband and wireless capabilities, the demand for digital media has increasingly taken a larger share of global consumer spending, thus gradually replacing traditional media channels. Further, consumer media spending varied across regions, depending on the current stage of development of the media sector as well as their respective economic situations.
GLOBAL MEDIA AND ADVERTISING SECTOR
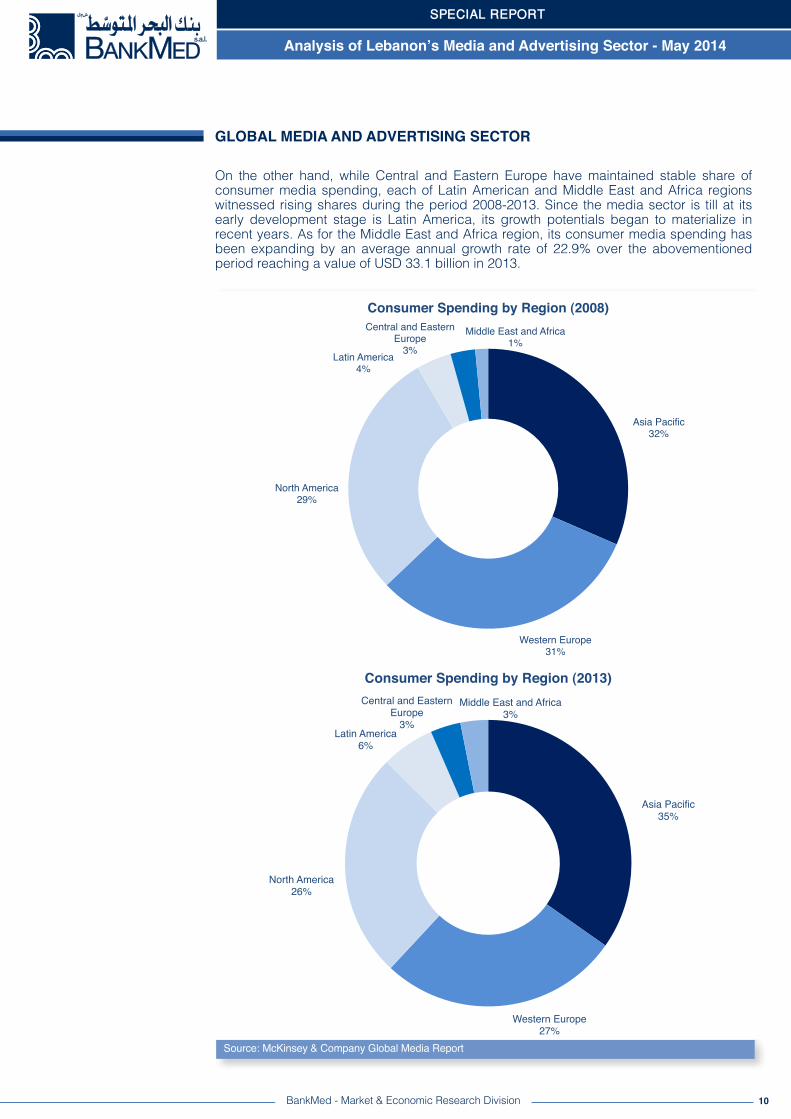
Today, Asia Pacific is characterized by the highest consumer spending on media, with its share expanding from 32% in 2008 to 35% in 2013. In fact, the region’s consumer media spending expanded by 7.6% during the aforementioned period reaching a value of USD 368.7 billion. In contrast, Western Europe has seen a decline in its share of global consumer spending on media, reaching 27% of the total in 2013. This decline is attributed to the economic slowdown witnessed in that region which weighed on consumers’ purchasing power. Despite the contraction in consumer media spending, Western Europe still maintains its position as the second major contributor to media spending. Likewise, North America has also witnessed a drop in its share of consumer media spending from 29% in 2008 to 26% in 2013.
SPECIAL REPORT
Analysis of Lebanon’s Media and Advertising Sector - May 2014
10
On the other hand, while Central and Eastern Europe have maintained stable share of consumer media spending, each of Latin American and Middle East and Africa regions witnessed rising shares during the period 2008-2013. Since the media sector is till at its early development stage is Latin America, its growth potentials began to materialize in recent years. As for the Middle East and Africa region, its consumer media spending has been expanding by an average annual growth rate of 22.9% over the abovementioned period reaching a value of USD 33.1 billion in 2013.
Source: McKinsey & Company Global Media Report
BankMed - Market & Economic Research Division
GLOBAL MEDIA AND ADVERTISING SECTOR
Asia Pacific!32%!
Western Europe!31%!
North America!29%!
Latin America!4%!
Central and Eastern Europe!
3%!
Middle East and Africa!1%!
Consumer Spending by Region (2008)!
Asia Pacific!35%!
Western Europe!27%!
North America!26%!
Latin America!6%!
Central and Eastern Europe!
3%!
Middle East and Africa!3%!
Consumer Spending by Region (2013)!
SPECIAL REPORT
Analysis of Lebanon’s Media and Advertising Sector - May 2014
11
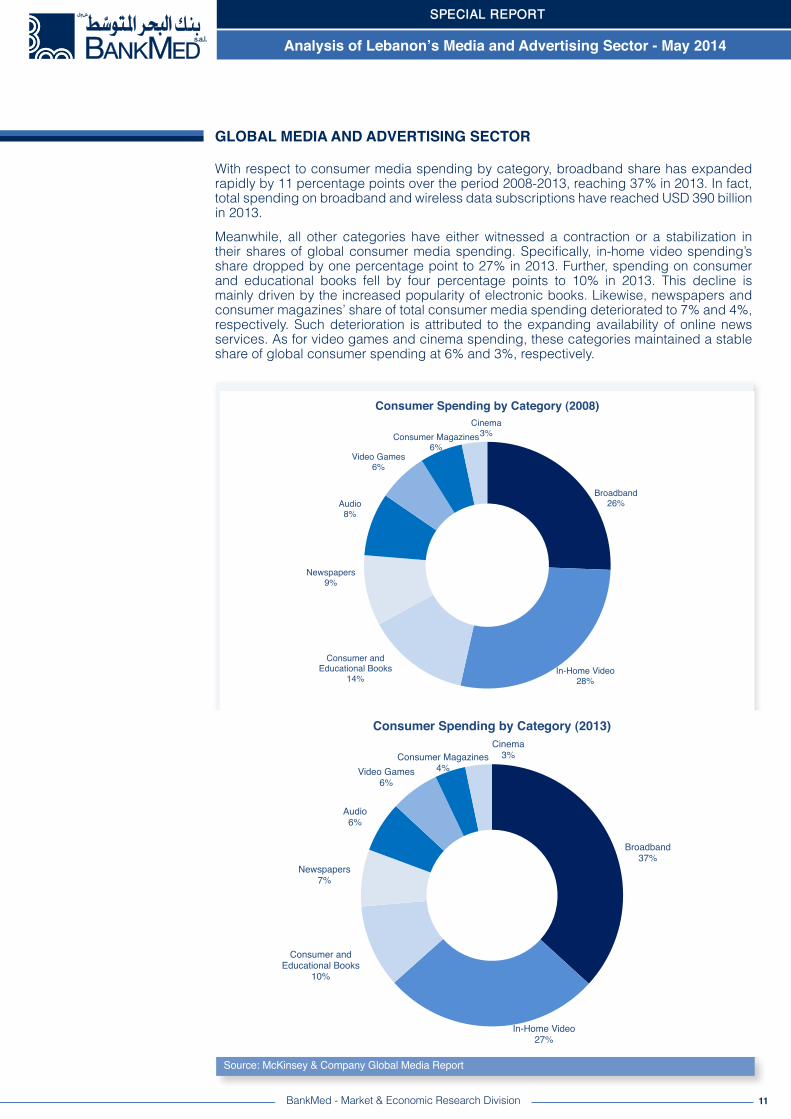
With respect to consumer media spending by category, broadband share has expanded rapidly by 11 percentage points over the period 2008-2013, reaching 37% in 2013. In fact, total spending on broadband and wireless data subscriptions have reached USD 390 billion in 2013.
Meanwhile, all other categories have either witnessed a contraction or a stabilization in their shares of global consumer media spending. Specifically, in-home video spending’s share dropped by one percentage point to 27% in 2013. Further, spending on consumer and educational books fell by four percentage points to 10% in 2013. This decline is mainly driven by the increased popularity of electronic books. Likewise, newspapers and consumer magazines’ share of total consumer media spending deteriorated to 7% and 4%, respectively. Such deterioration is attributed to the expanding availability of online news services. As for video games and cinema spending, these categories maintained a stable share of global consumer spending at 6% and 3%, respectively.
BankMed - Market & Economic Research Division
GLOBAL MEDIA AND ADVERTISING SECTOR
Source: McKinsey & Company Global Media Report
Broadband!26%!
In-Home Video!28%!
Consumer and Educational Books!
14%!
Newspapers!9%!
Audio!8%!
Video Games!6%!
Consumer Magazines!6%!
Cinema!3%!
Consumer Spending by Category (2008)!
Broadband!37%!
In-Home Video!27%!
Consumer and Educational Books!
10%!
Newspapers!7%!
Audio!6%!
Video Games!6%!
Consumer Magazines!4%!
Cinema!3%!
Consumer Spending by Category (2013)!
SPECIAL REPORT
Analysis of Lebanon’s Media and Advertising Sector - May 2014
12BankMed - Market & Economic Research Division
LEBANON’S MEDIA AND ADVERTISING SECTOR
MEDIA AND ADVERTISING INDUSTRY OVERVIEW
Over the past decades, Lebanon has developed one of the most prominent media sectors in the Middle East. As such, the media industry increasingly became an important contributor to the economy, accounting for about at least 2.5% of Lebanon’s GDP, according to the World Intellectual Property Organization. Furthermore, with about 400 companies operating in the media sector employing about 2% of Lebanon’s labor force, the sector serves as major employer.
Lebanon’s media sector is well known for its varied viewpoints and its upholding of freedom of speech. Moreover, the industry has consistently found innovative ways to thrive and develop despite economic challenges. Lebanon’s media sector consists of several sub-sectors including: television broadcasting, advertising services, audiovisual production, digital and social media, as well as print media.
Lebanon’s media industry went through several phases before it developed to its current status. These phases can be summarized as follows:
• Pre-War Period (1950 – 1973): During this period, Lebanon’s media and advertising industry had been the most developed in the region. This is attributed to several competitive advantages including: the concentration of multi-national corporations in Beirut, the open and liberal Lebanese society, as well as the talented and educated labor force.
• Civil War Period (1974 – 1990): During this period, the local media industry had witnessed a sharp contraction where media and advertising expenditures were shifted to oil-rich countries in the region. Additionally, several multinational media and advertising agencies, which previously operated in Beirut, relocated to other cities, mainly Dubai which started to emerge as the region’s services hub during that period. Moreover, Lebanese media and advertising companies relocated to the Gulf region, thus retaining control over the industry. These Lebanese agencies have created job opportunities to Lebanese skilled media graduates, hence positively affecting the country’s balance of payments.
• Post-War Period (1990 – 1999): As political stability was restored in Lebanon, the Lebanese media and advertising sector witnessed a healthy growth during the period 1990-1999. As such, the media industry accounted for about 10.5% of the total Arab media market, yet failed to recover its pre-war share, which had reached 24.6% of the market. This is a direct result of the fact that media and advertising companies had already established themselves in other Arab marketing, reducing Beirut’s chances of becoming a regional media and advertising hub during that period.
• Recent Period (2000 – Today): During the period 2000-2003, low economic growth rates negatively affected media and advertising budgets, which proved highly elastic to the economic conditions. Furthermore, the decision of the media regie to lower media commissions by five percentage points (to 15%) has resulted in a series of closures and mergers among advertising agencies. In the following period, although the year 2004 witnessed an expansion in the media industry, the following two years saw a negative reversal given the political developments and the July war. Since then, Lebanon’s media and advertising industry has been thriving in a challenging economic environment. The development in the sector is greatly attributed to the expansion of digital media along with the boost in advertising services which was started in 2010.
SPECIAL REPORT
Analysis of Lebanon’s Media and Advertising Sector - May 2014
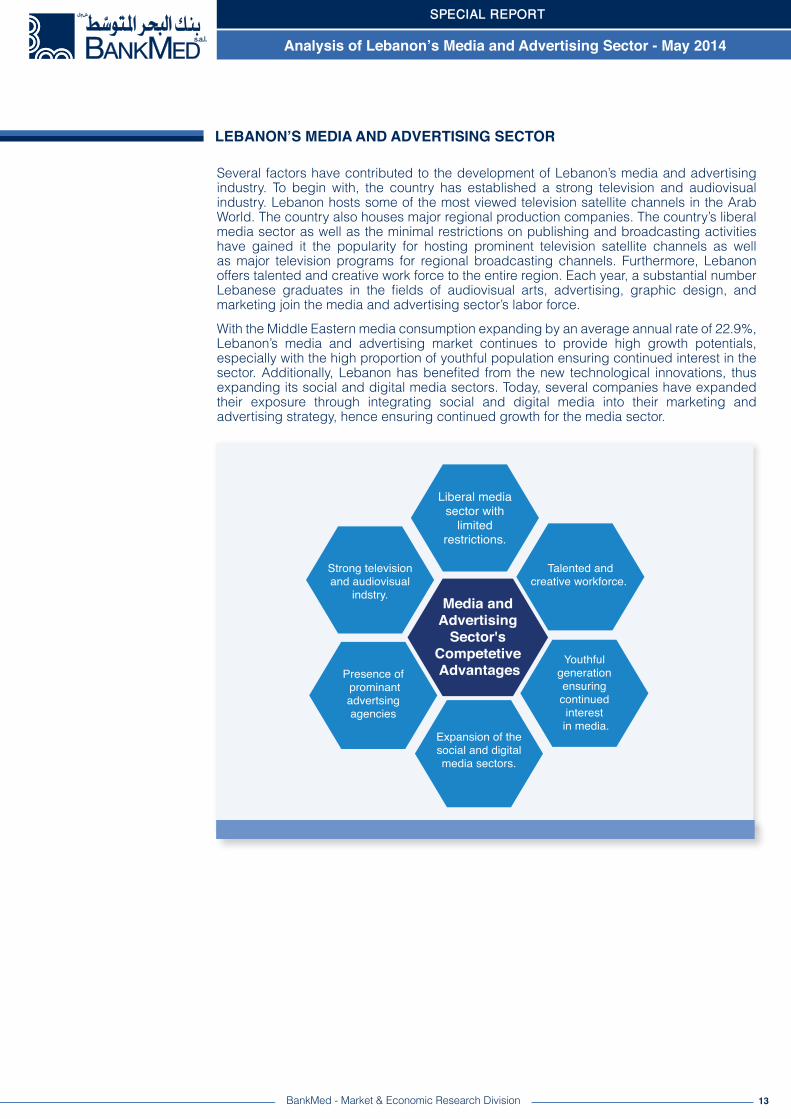
Several factors have contributed to the development of Lebanon’s media and advertising industry. To begin with, the country has established a strong television and audiovisual industry. Lebanon hosts some of the most viewed television satellite channels in the Arab World. The country also houses major regional production companies. The country’s liberal media sector as well as the minimal restrictions on publishing and broadcasting activities have gained it the popularity for hosting prominent television satellite channels as well as major television programs for regional broadcasting channels. Furthermore, Lebanon offers talented and creative work force to the entire region. Each year, a substantial number Lebanese graduates in the fields of audiovisual arts, advertising, graphic design, and marketing join the media and advertising sector’s labor force.
With the Middle Eastern media consumption expanding by an average annual rate of 22.9%, Lebanon’s media and advertising market continues to provide high growth potentials, especially with the high proportion of youthful population ensuring continued interest in the sector. Additionally, Lebanon has benefited from the new technological innovations, thus expanding its social and digital media sectors. Today, several companies have expanded their exposure through integrating social and digital media into their marketing and advertising strategy, hence ensuring continued growth for the media sector.
13BankMed - Market & Economic Research Division
LEBANON’S MEDIA AND ADVERTISING SECTOR
SPECIAL REPORT
Analysis of Lebanon’s Media and Advertising Sector - May 2014
14
Source: Zenith Optimedia
BankMed - Market & Economic Research Division
LEBANON’S MEDIA AND ADVERTISING SECTOR
MEDIA AND ADVERTISING SUB-SECTORS
Lebanon’s media and advertising sector consists of several sub-sectors including: advertising, television broadcasting, audiovisual production, digital and social media, as well as print media.
ADVERTISING
Advertising is a form of either direct-to-consumer communication or mass communication intended to appeal to Lebanese or regional audience so as to creatively inform, influence, or establish a local or a global brand. Advertising involves the conception and the implementation of the message content while choosing the right media for effective targeting.
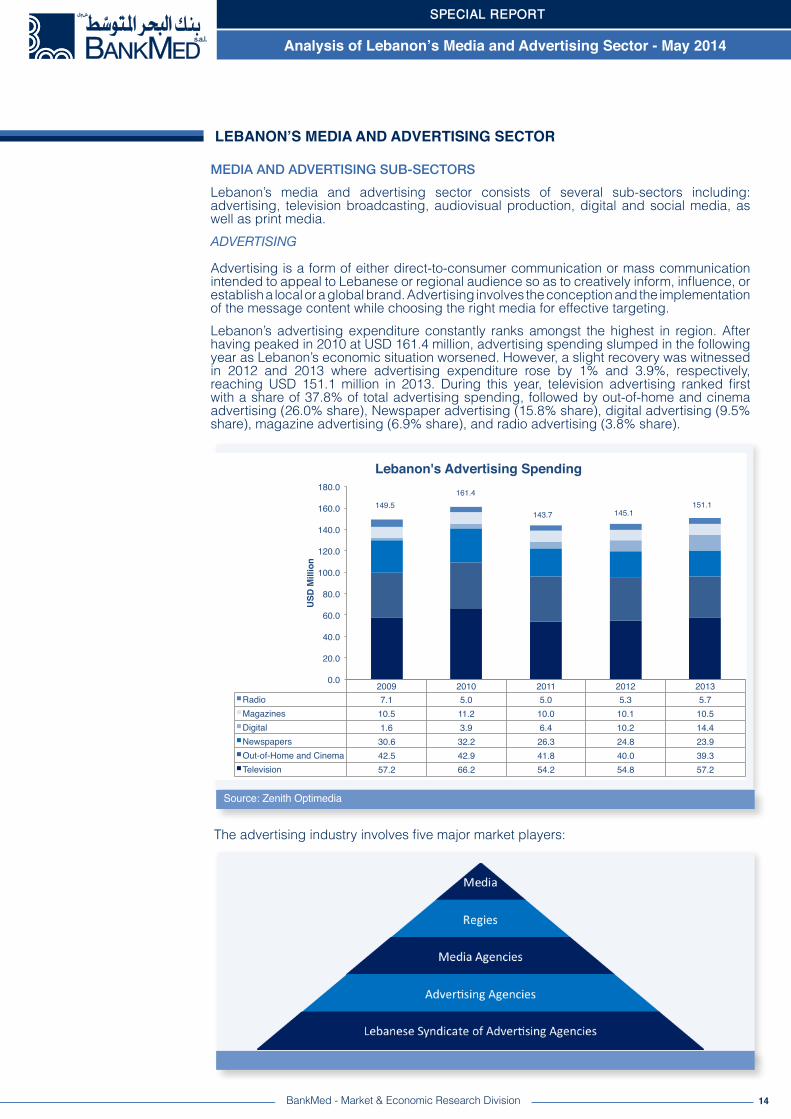
Lebanon’s advertising expenditure constantly ranks amongst the highest in region. After having peaked in 2010 at USD 161.4 million, advertising spending slumped in the following year as Lebanon’s economic situation worsened. However, a slight recovery was witnessed in 2012 and 2013 where advertising expenditure rose by 1% and 3.9%, respectively, reaching USD 151.1 million in 2013. During this year, television advertising ranked first with a share of 37.8% of total advertising spending, followed by out-of-home and cinema advertising (26.0% share), Newspaper advertising (15.8% share), digital advertising (9.5% share), magazine advertising (6.9% share), and radio advertising (3.8% share).
The advertising industry involves five major market players:
SPECIAL REPORT
Analysis of Lebanon’s Media and Advertising Sector - May 2014
2009! 2010! 2011! 2012! 2013!Radio! 7.1! 5.0! 5.0! 5.3! 5.7!Magazines! 10.5! 11.2! 10.0! 10.1! 10.5!Digital! 1.6! 3.9! 6.4! 10.2! 14.4!Newspapers! 30.6! 32.2! 26.3! 24.8! 23.9!Out-of-Home and Cinema! 42.5! 42.9! 41.8! 40.0! 39.3!Television! 57.2! 66.2! 54.2! 54.8! 57.2!
0.0!
20.0!
40.0!
60.0!
80.0!
100.0!
120.0!
140.0!
160.0!
180.0!
USD
Mill
ion!
Lebanon's Advertising Spending!
149.5!161.4!
143.7! 145.1!151.1!
15
1. Lebanese Syndicate of Advertising Agencies (LSAA): The syndicate aims at protecting the joint interests of advertising agencies and discouraging individual agencies from actions which could negatively affect the whole industry.
2. Advertising Agencies: The number of advertising agencies in Lebanon exceed 150 agencies.
3. Media Agencies: They are mergers and partnerships established by advertising agencies with the aim of planning and booking media space. Lebanon has more than 140 media booking agencies, and most of these media buying units are owned by advertising agencies.
4. Regies: They are advertising acquisition companies established to book advertising space for various media. Regies pay a minimum guarantee fee to media in order to be its sole representative, whether or not it succeeds at selling the advertising space. As such, the Regie acts as an intermediary, handling the advertising space while various media focus on content without worrying about sales of space.
5. Media: Various media are available for advertising; however, the choice of the medium usually depends on the budget of the campaign:
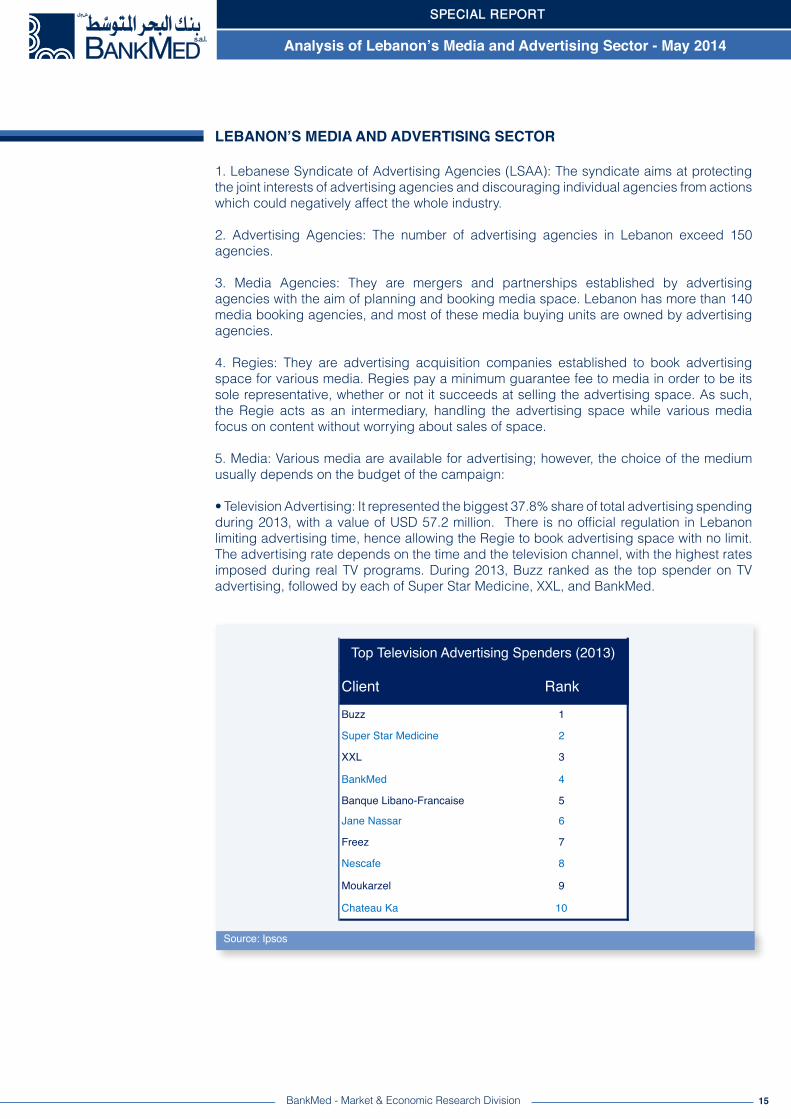
• Television Advertising: It represented the biggest 37.8% share of total advertising spending during 2013, with a value of USD 57.2 million. There is no official regulation in Lebanon limiting advertising time, hence allowing the Regie to book advertising space with no limit. The advertising rate depends on the time and the television channel, with the highest rates imposed during real TV programs. During 2013, Buzz ranked as the top spender on TV advertising, followed by each of Super Star Medicine, XXL, and BankMed.
Source: Ipsos
BankMed - Market & Economic Research Division
LEBANON’S MEDIA AND ADVERTISING SECTOR
Client RankBuzz 1
Super Star Medicine 2
XXL 3
BankMed 4
Banque Libano-Francaise 5
Jane Nassar 6
Freez 7
Nescafe 8
Moukarzel 9
Chateau Ka 10
Top Television Advertising Spenders (2013)
SPECIAL REPORT
Analysis of Lebanon’s Media and Advertising Sector - May 2014

16
• Out-of-Home and Cinema Advertising: They represented the second largest 26.0% share of total advertising spending during 2013, with a value of USD 39.3 million. When it comes to billboard advertising, there are more than 30 billboard suppliers. The growing competition among these suppliers resulted in a reduction in the rental rate during the past years. In a survey by Ipsos, Samsung ranked as the top outdoor advertiser in Lebanon during 2013, followed by Touch, and Nissan. As for Cinema advertising, it remains low due to the fact that cinema attendance is still low in Lebanon due to high cable penetration. Hence, cinema advertising expenditure did not exceed USD 1 million in 2013, with Samsung as the top spender on cinema advertising, followed by Nescafe, Red Bull, and Les Roches Kfardebian.
BankMed - Market & Economic Research Division
LEBANON’S MEDIA AND ADVERTISING SECTOR
Source: Ipsos
Client Rank
Samsung 1Touch 2Nissan 3Jammal Trust Bank 4Hyundai 5Alfa 6Khoury Home 7KFC 8Byblos Bank 9Bank Audi 10
Top Outdoor Advertising Spenders (2013)
SPECIAL REPORT
Analysis of Lebanon’s Media and Advertising Sector - May 2014
Client RankSamsung 1Nescafe 2Red Bull 3Les Roches Kfardebian 4Bank Audi 5Alfa 6Maggi 7Jammal Trust Bank 8Porsche 9Puck 10
Top Cinema Advertising Spenders (2013)
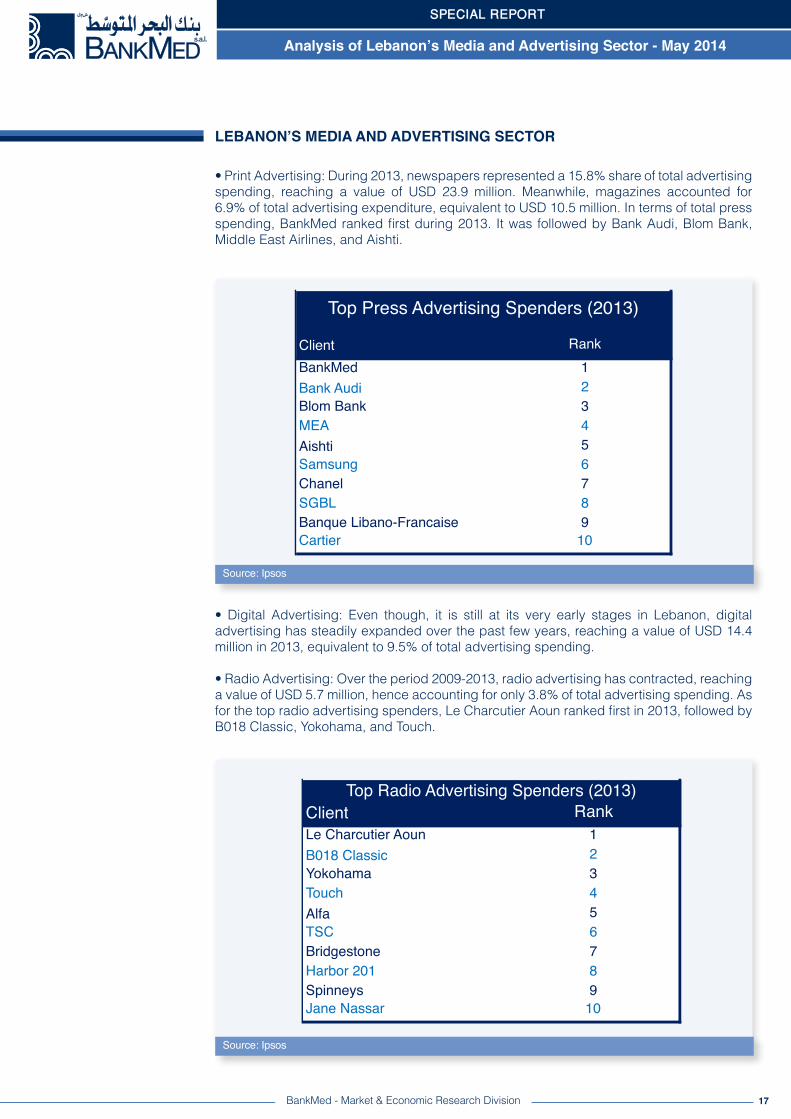
• Print Advertising: During 2013, newspapers represented a 15.8% share of total advertising spending, reaching a value of USD 23.9 million. Meanwhile, magazines accounted for 6.9% of total advertising expenditure, equivalent to USD 10.5 million. In terms of total press spending, BankMed ranked first during 2013. It was followed by Bank Audi, Blom Bank, Middle East Airlines, and Aishti.
Source: Ipsos
17BankMed - Market & Economic Research Division
LEBANON’S MEDIA AND ADVERTISING SECTOR
Client RankBankMed 1Bank Audi 2Blom Bank 3MEA 4Aishti 5Samsung 6Chanel 7SGBL 8Banque Libano-Francaise 9Cartier 10
Top Press Advertising Spenders (2013)
• Digital Advertising: Even though, it is still at its very early stages in Lebanon, digital advertising has steadily expanded over the past few years, reaching a value of USD 14.4 million in 2013, equivalent to 9.5% of total advertising spending.
• Radio Advertising: Over the period 2009-2013, radio advertising has contracted, reaching a value of USD 5.7 million, hence accounting for only 3.8% of total advertising spending. As for the top radio advertising spenders, Le Charcutier Aoun ranked first in 2013, followed by B018 Classic, Yokohama, and Touch.
Source: Ipsos
Client RankLe Charcutier Aoun 1B018 Classic 2Yokohama 3Touch 4Alfa 5TSC 6Bridgestone 7Harbor 201 8Spinneys 9Jane Nassar 10
Top Radio Advertising Spenders (2013)
SPECIAL REPORT
Analysis of Lebanon’s Media and Advertising Sector - May 2014
TELEVISION BROADCASTING
The Lebanese Television market is dominated by two main platforms: analog terrestrial which constitutes a 14% share, and free satellite which accounts for 83% share. Furthermore, the Lebanese market is characterized by a high penetration rate of cable TV, compared to the region. Yet, this high penetration is attributed to the high prevalence of illegal cable connections, implying low official cable penetration rate. As such, Pay-TV penetration remains low at around 5% of households due to widespread piracy in the country.
Lebanon’s domestic broadcasting scene is well developed; 22 free-to-air (FTA) regional channels are headquartered in the country along with one government-owned channel. This government-owned channel is the first Lebanese public television network established in 1959. Afterwards, the first private TV network was launched in Lebanon in 1985. Since then, other private channels have been established.
When it comes to audience measurement, it is noteworthy that Lebanon was the only country in the region to measure the audience view from terrestrial TV households before the implementation of this service in UAE. According to these statistics, domestic channels in Lebanon have historically been the most-viewed locally unlike in other countries where pan-Arab channels are dominant.
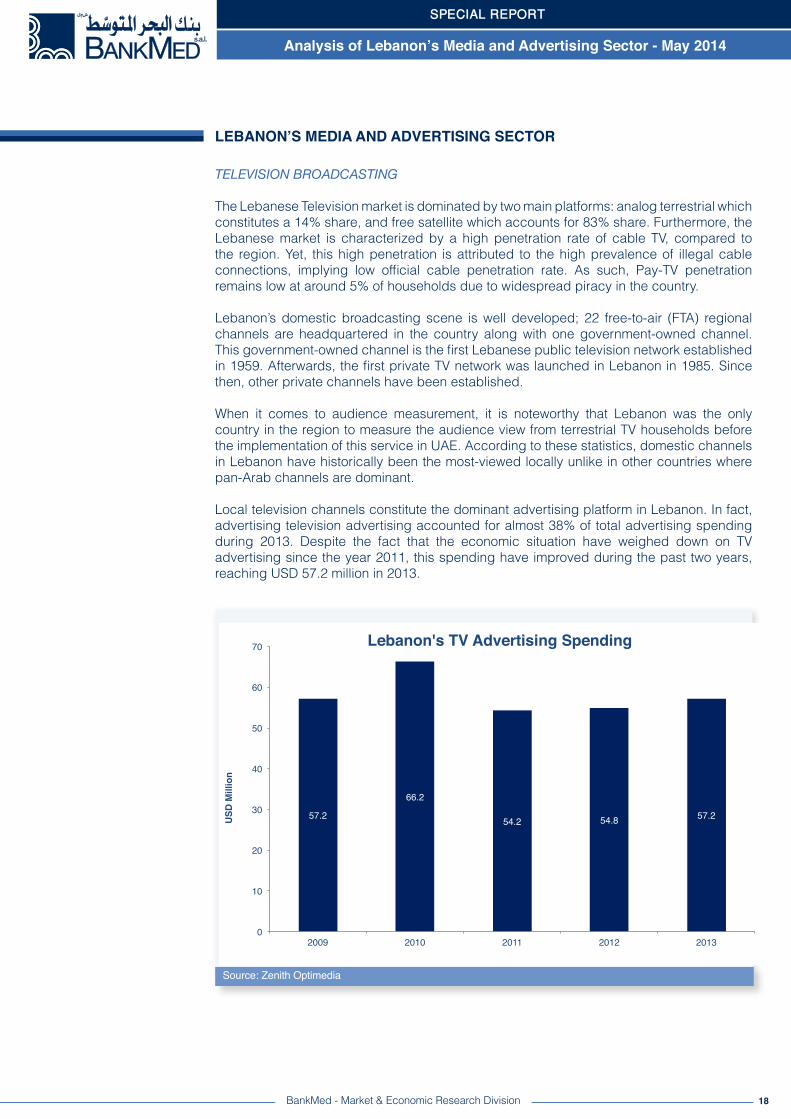
Local television channels constitute the dominant advertising platform in Lebanon. In fact, advertising television advertising accounted for almost 38% of total advertising spending during 2013. Despite the fact that the economic situation have weighed down on TV advertising since the year 2011, this spending have improved during the past two years, reaching USD 57.2 million in 2013.
18
Source: Zenith Optimedia
BankMed - Market & Economic Research Division
LEBANON’S MEDIA AND ADVERTISING SECTOR
57.2!
66.2!
54.2! 54.8! 57.2!
0!
10!
20!
30!
40!
50!
60!
70!
2009! 2010! 2011! 2012! 2013!
USD
Mill
ion!
Lebanon's TV Advertising Spending!
SPECIAL REPORT
Analysis of Lebanon’s Media and Advertising Sector - May 2014
19BankMed - Market & Economic Research Division
AUDIOVISUAL PRODUCTION
During the past decade, Lebanon’s audiovisual production has advanced to encompass about 70 production companies working an average of 1,000 shooting days every year. Production services include the production of television programs and television commercials, as well as filmmaking.
Lebanon’s large television broadcasting hub has provided the base for the development of a significant TV production industry. Companies, which specialize in television production services, operate both locally and regionally, creating content for television programs. The services mainly encompass the fields of entertainment, drama series, talk shows as well as the recent addition of reality shows. Specifically, several entertainment television programs produced by Lebanese companies achieved record audience-view, thus positioning Lebanon as a regional market leader in the entertainment shows business.
Given its substantial local media talent as well as the low productive cost relative to the region, Lebanon’s television production industry has gained a unique position locally and regionally. More than three-quarters of the content displayed in Lebanese television channels is produced in the country. Further, domestic production companies have also gained popularity among pan-Arab TV channels. As such, much of the content production done in Lebanese companies services the Gulf region. This is mainly due to the relatively cheap cost as well as sophisticated and high quality execution that characterized Lebanon’s production services. Additionally, it is noteworthy that several locally produced television shows, which air on Lebanese television channels, have gained popularity regionally and were thus also aired by regional television channels to reach a wider audience.
Production services are also heavily directed towards the production of television commercials, which account for the bulk of the revenues of local companies. Additionally, the production of music videos has heavily expanded during the past decade, as Lebanon became regarded as the region’s market leader is the music clips market. As in the advertising market, production of television commercials and music clips is influenced by the factors that affect the whole industry. Hence, economic and political instability reduce incomes and result in production drop down.
DIGITAL AND SOCIAL MEDIA
Despite the fact that it has not yet fully developed, Lebanon’s digital media sector is presently witnessing the fastest expansion within the Media Industry. The digital media sector employs information and communication technologies to deliver media content. The sector includes the production of animation and visual effects, digital publications, interactive designs, as well as audio and video content.
Several factors have contributed to the growth in Lebanon’s digital media. In fact, the sector was propelled by the upsurge in internet and mobile penetration rates. The country’s broadband market has seen a number of changes between 2011 and 2012, in particular with the introduction of wireless broadband, where wireless broadband penetration went up from 11% in 2011 to 26% in 2012. Furthermore, the proportion of individuals with access to internet increased by three percentage points to 64%, while the proportion of individuals using the Internet climbed by nine percentage points to 61% in 2012. Concurrently, mobile-cellular telephone subscriptions expanded to 93.2%.
LEBANON’S MEDIA AND ADVERTISING SECTOR
SPECIAL REPORT
Analysis of Lebanon’s Media and Advertising Sector - May 2014
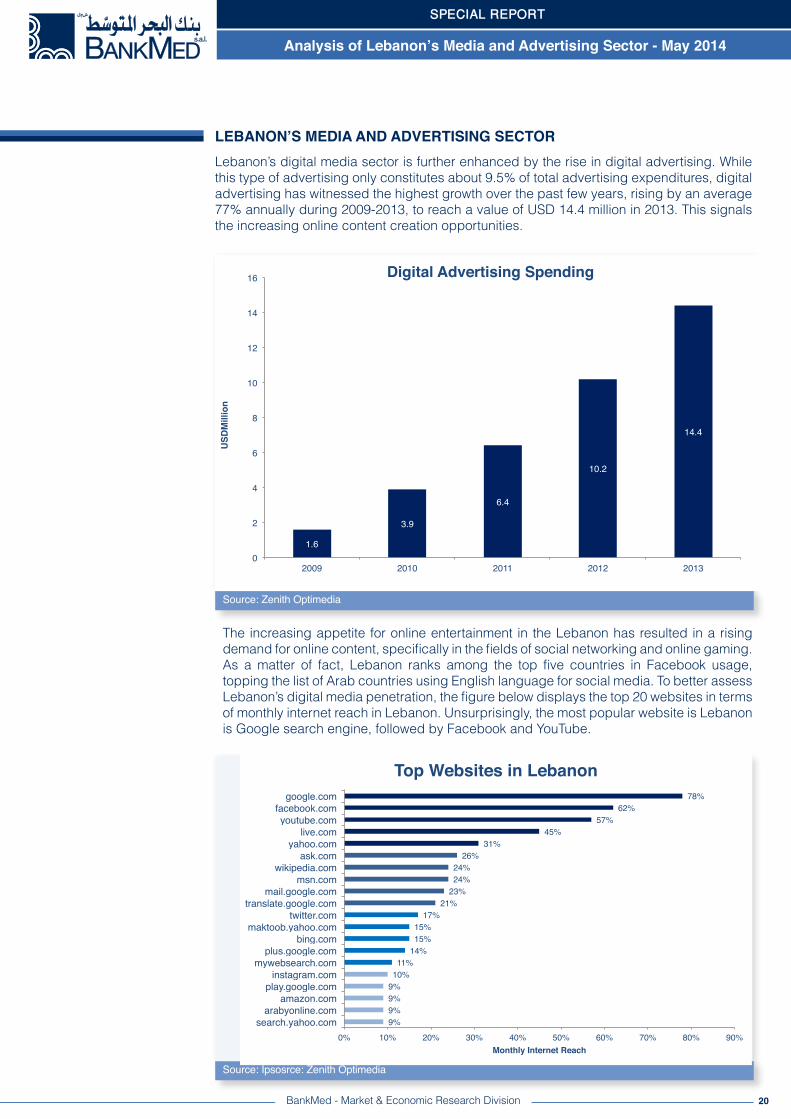
Lebanon’s digital media sector is further enhanced by the rise in digital advertising. While this type of advertising only constitutes about 9.5% of total advertising expenditures, digital advertising has witnessed the highest growth over the past few years, rising by an average 77% annually during 2009-2013, to reach a value of USD 14.4 million in 2013. This signals the increasing online content creation opportunities.
20
Source: Zenith Optimedia
BankMed - Market & Economic Research Division
LEBANON’S MEDIA AND ADVERTISING SECTOR
1.6!
3.9!
6.4!
10.2!
14.4!
0!
2!
4!
6!
8!
10!
12!
14!
16!
2009! 2010! 2011! 2012! 2013!
USD
Mill
ion!
Digital Advertising Spending!
The increasing appetite for online entertainment in the Lebanon has resulted in a rising demand for online content, specifically in the fields of social networking and online gaming. As a matter of fact, Lebanon ranks among the top five countries in Facebook usage, topping the list of Arab countries using English language for social media. To better assess Lebanon’s digital media penetration, the figure below displays the top 20 websites in terms of monthly internet reach in Lebanon. Unsurprisingly, the most popular website is Lebanon is Google search engine, followed by Facebook and YouTube.
Source: Ipsosrce: Zenith Optimedia
9%!9%!9%!9%!10%!11%!
14%!15%!15%!17%!
21%!23%!24%!24%!26%!
31%!45%!
57%!62%!
78%!
0%! 10%! 20%! 30%! 40%! 50%! 60%! 70%! 80%! 90%!search.yahoo.com!arabyonline.com!
amazon.com!play.google.com!instagram.com!
mywebsearch.com!plus.google.com!
bing.com!maktoob.yahoo.com!
twitter.com!translate.google.com!
mail.google.com!msn.com!
wikipedia.com!ask.com!
yahoo.com!live.com!
youtube.com!facebook.com!google.com!
Monthly Internet Reach!
Top Websites in Lebanon!
SPECIAL REPORT
Analysis of Lebanon’s Media and Advertising Sector - May 2014

Traditional media in Lebanon is increasing its exposure to the public using digital platforms as an alternative means of engagement with audiences. Today, most Lebanese broadcasting channels offer live-streaming on their portals. Additionally, some of these broadcasters expanded their digital platform by launching free mobile applications enabling news alerts with photos and videos, live streaming, as well as archived bulletins and shows.
PRINT MEDIA
Lebanon’s liberal political system along with its educated population, have contributed to the development of one of the most vibrant publishing sectors in the region. Today, Lebanon encompasses around 200 active publishing houses, thus surpassing the number of publishing houses in all Arab countries. The country mostly publishes Islam and children’s books, followed by literature and politics books. Further, Arabic publications constitute the biggest share of books, given that more than half of Lebanon’s publishing output is exported to the region.
Lebanon is an active publisher of newspapers and magazines. There are currently 12 Arabic dailies, three Armenian dailies, one major English daily, and one leading French daily. As such, Lebanon’s newspaper industry is quite active with about half of prints produced in Beirut circulated to the Middle East region. Recently, specialized magazines have gained popularity. Specifically, sports, technology, fashion and finance magazines have emerged in the past decade. However, celebrity and fashion magazines are still main attractors of readership.
Despite the fact that newspaper advertising dropped by an average 6% over the period 2009-2013, it still accounts for about 15.8% of total advertising spending. Major advertisements in newspapers include bank products, automobiles, real estate, and other consumer goods. Meanwhile, magazine advertising spending has expanded by a slight 0.2% annually over the period 2009-2013, thus constituting 6.9% of total advertising spending today. Major advertisements in magazines include jewelry brands, clothing, and other beauty products.
21BankMed - Market & Economic Research Division
LEBANON’S MEDIA AND ADVERTISING SECTOR
Source: Zenith Optimedia
SPECIAL REPORT
Analysis of Lebanon’s Media and Advertising Sector - May 2014
30.6!32.2!
26.3! 24.8! 23.9!
10.5! 11.2! 10.0! 10.1! 10.5!
0!
5!
10!
15!
20!
25!
30!
35!
2009! 2010! 2011! 2012! 2013!
USDM
illio
n!
Print Advertising Spending!
Newspapers! Magazines!
MEDIA SUSTAINABILITY INDEX
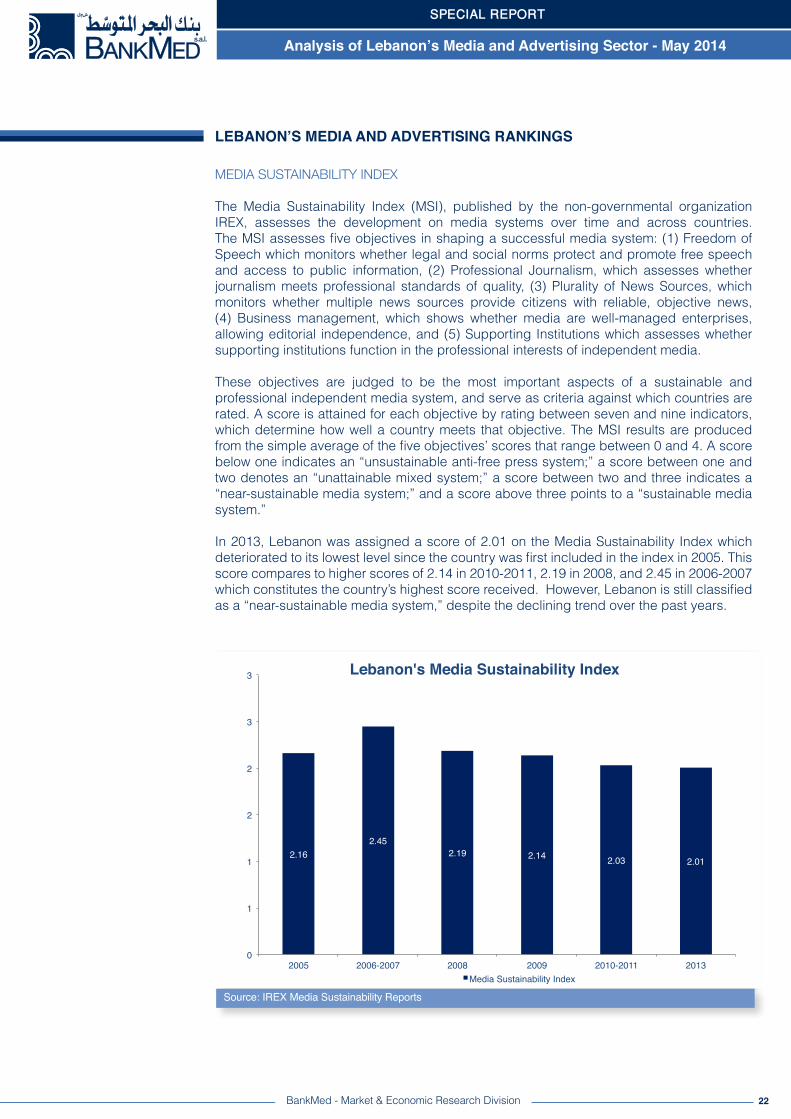
The Media Sustainability Index (MSI), published by the non-governmental organization IREX, assesses the development on media systems over time and across countries. The MSI assesses five objectives in shaping a successful media system: (1) Freedom of Speech which monitors whether legal and social norms protect and promote free speech and access to public information, (2) Professional Journalism, which assesses whether journalism meets professional standards of quality, (3) Plurality of News Sources, which monitors whether multiple news sources provide citizens with reliable, objective news, (4) Business management, which shows whether media are well-managed enterprises, allowing editorial independence, and (5) Supporting Institutions which assesses whether supporting institutions function in the professional interests of independent media.
These objectives are judged to be the most important aspects of a sustainable and professional independent media system, and serve as criteria against which countries are rated. A score is attained for each objective by rating between seven and nine indicators, which determine how well a country meets that objective. The MSI results are produced from the simple average of the five objectives’ scores that range between 0 and 4. A score below one indicates an “unsustainable anti-free press system;” a score between one and two denotes an “unattainable mixed system;” a score between two and three indicates a “near-sustainable media system;” and a score above three points to a “sustainable media system.”
In 2013, Lebanon was assigned a score of 2.01 on the Media Sustainability Index which deteriorated to its lowest level since the country was first included in the index in 2005. This score compares to higher scores of 2.14 in 2010-2011, 2.19 in 2008, and 2.45 in 2006-2007 which constitutes the country’s highest score received. However, Lebanon is still classified as a “near-sustainable media system,” despite the declining trend over the past years.
22
Source: IREX Media Sustainability Reports
BankMed - Market & Economic Research Division
LEBANON’S MEDIA AND ADVERTISING RANKINGS
2.16!2.45!
2.19! 2.14! 2.03! 2.01!
0!
1!
1!
2!
2!
3!
3!
2005! 2006-2007! 2008! 2009! 2010-2011! 2013!
Lebanon's Media Sustainability Index!
Media Sustainability Index!
SPECIAL REPORT
Analysis of Lebanon’s Media and Advertising Sector - May 2014
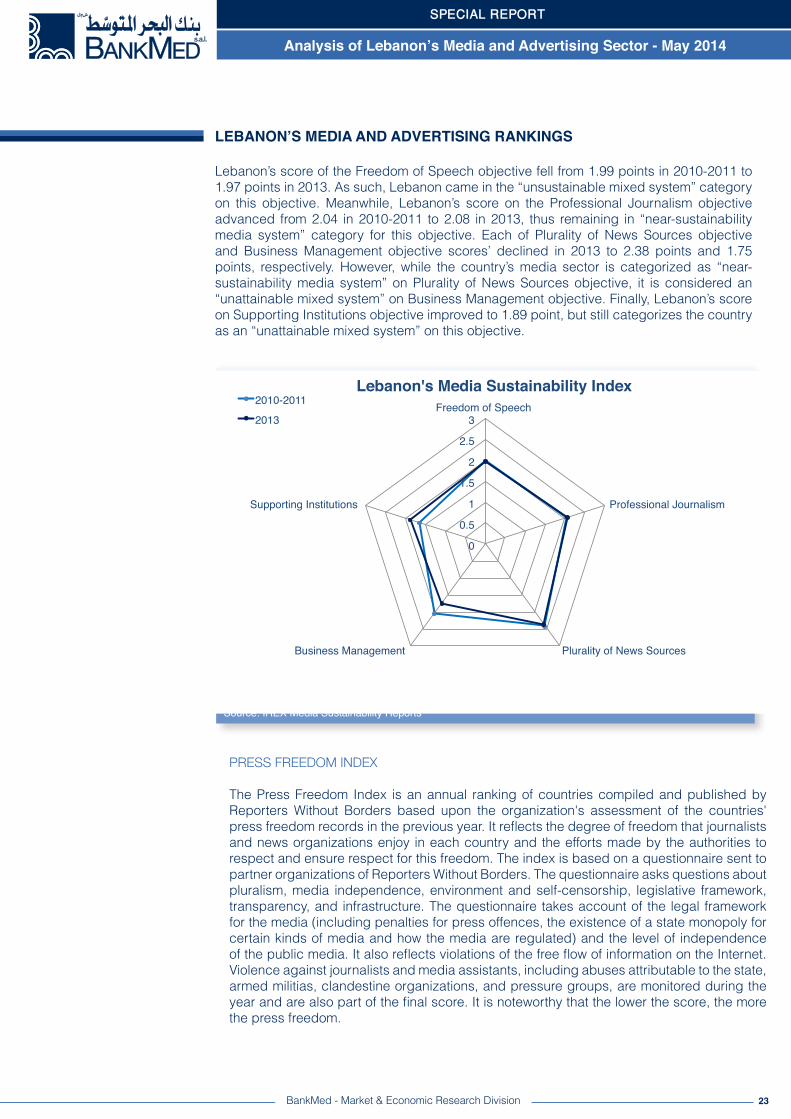
Lebanon’s score of the Freedom of Speech objective fell from 1.99 points in 2010-2011 to 1.97 points in 2013. As such, Lebanon came in the “unsustainable mixed system” category on this objective. Meanwhile, Lebanon’s score on the Professional Journalism objective advanced from 2.04 in 2010-2011 to 2.08 in 2013, thus remaining in “near-sustainability media system” category for this objective. Each of Plurality of News Sources objective and Business Management objective scores’ declined in 2013 to 2.38 points and 1.75 points, respectively. However, while the country’s media sector is categorized as “near-sustainability media system” on Plurality of News Sources objective, it is considered an “unattainable mixed system” on Business Management objective. Finally, Lebanon’s score on Supporting Institutions objective improved to 1.89 point, but still categorizes the country as an “unattainable mixed system” on this objective.
23BankMed - Market & Economic Research Division
LEBANON’S MEDIA AND ADVERTISING RANKINGS
Source: IREX Media Sustainability Reports
0!
0.5!
1!
1.5!
2!
2.5!
3!Freedom of Speech !
Professional Journalism !
Plurality of News Sources !Business Management !
Supporting Institutions !
Lebanon's Media Sustainability Index!2010-2011!2013!
PRESS FREEDOM INDEX
The Press Freedom Index is an annual ranking of countries compiled and published by Reporters Without Borders based upon the organization's assessment of the countries' press freedom records in the previous year. It reflects the degree of freedom that journalists and news organizations enjoy in each country and the efforts made by the authorities to respect and ensure respect for this freedom. The index is based on a questionnaire sent to partner organizations of Reporters Without Borders. The questionnaire asks questions about pluralism, media independence, environment and self-censorship, legislative framework, transparency, and infrastructure. The questionnaire takes account of the legal framework for the media (including penalties for press offences, the existence of a state monopoly for certain kinds of media and how the media are regulated) and the level of independence of the public media. It also reflects violations of the free flow of information on the Internet. Violence against journalists and media assistants, including abuses attributable to the state, armed militias, clandestine organizations, and pressure groups, are monitored during the year and are also part of the final score. It is noteworthy that the lower the score, the more the press freedom.
SPECIAL REPORT
Analysis of Lebanon’s Media and Advertising Sector - May 2014
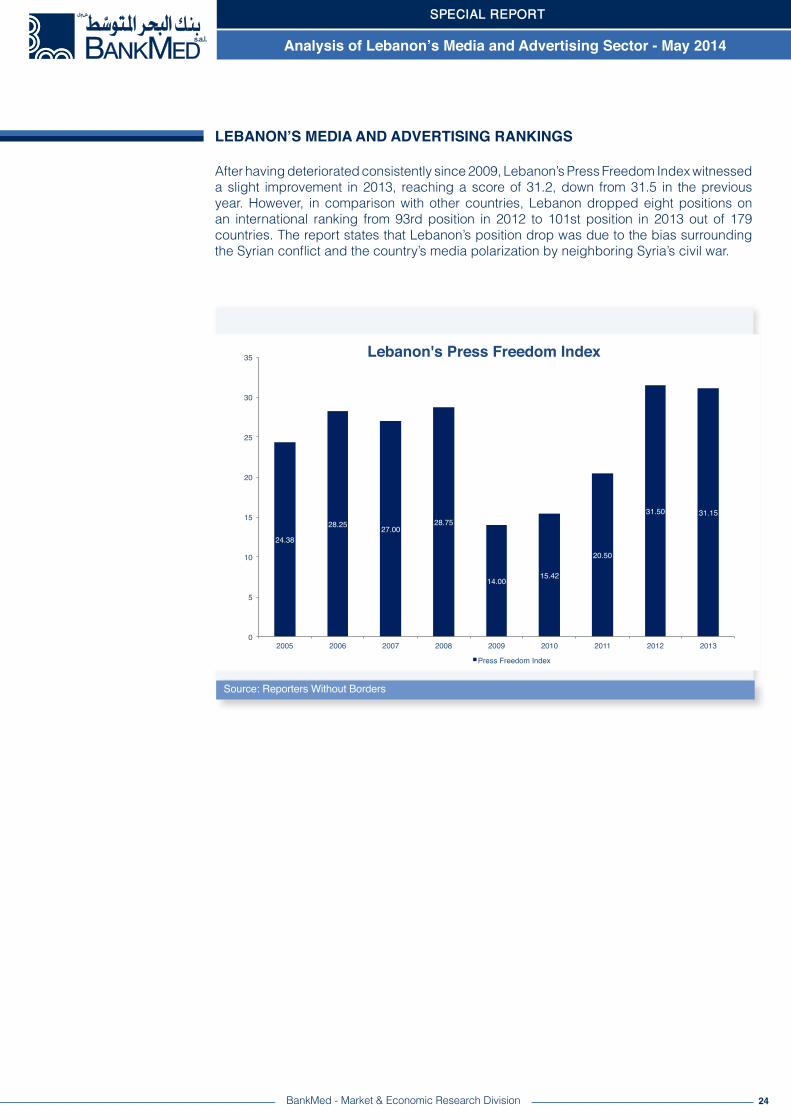
After having deteriorated consistently since 2009, Lebanon’s Press Freedom Index witnessed a slight improvement in 2013, reaching a score of 31.2, down from 31.5 in the previous year. However, in comparison with other countries, Lebanon dropped eight positions on an international ranking from 93rd position in 2012 to 101st position in 2013 out of 179 countries. The report states that Lebanon’s position drop was due to the bias surrounding the Syrian conflict and the country’s media polarization by neighboring Syria’s civil war.
LEBANON’S MEDIA AND ADVERTISING RANKINGS
Source: Reporters Without Borders
24.38!
28.25! 27.00!28.75!
14.00!15.42!
20.50!
31.50! 31.15!
0!
5!
10!
15!
20!
25!
30!
35!
2005! 2006! 2007! 2008! 2009! 2010! 2011! 2012! 2013!
Lebanon's Press Freedom Index!
Press Freedom Index!
24BankMed - Market & Economic Research Division
SPECIAL REPORT
Analysis of Lebanon’s Media and Advertising Sector - May 2014

25
Disclaimer:This material has been prepared by BankMed sal based on publicly available information and personal analysis. It is provided for information purposes only. It is not intended to be used as a research tool nor as a basis or reference for any decision. The information contained herein including any opinion, news and analysis, is based on various publicly available sources believed to be reliable but its accuracy cannot be guaranteed and may be subject to change without notice. BankMed, sal does not guarantee the accuracy, timeliness, continued availability or completeness of such information. All data contained herein are indicative. Neither the information provided nor any opinion expressed therein, constitutes a solicitation, offer, personal recommendation or advice. BankMed, sal does not assume any liability for direct, indirect, incidental or consequential damages resulting from any use of the information contained herein.
Mazen Soueid, Stephanie Ghanem, Ziad Hariri, Nadine Yamout, Rita Nehme
Yet, when compared with other countries in the region, Lebanon ranked in the second position in the Arab World on the Press Freedom Index 2013, right after Mauritania which ranked first in the region (67th worldwide). Lebanon was followed by Qatar (110th worldwide), UAE (114th worldwide), and Sudan (124th worldwide). This reveals that despite the deterioration that Lebanon witnessed in the past years, the country is still characterized as having one of the most free press in the Arab world.
Source: Reporters Without Borders
Country Rank 2013 Score 2013 Rank 2012 Score 2012
Mauritania 67 26.76 67 22.20Lebanon 101 30.20 93 31.50Qatar 110 32.86 114 46.00UAE 114 33.49 112 45.00Sudan 124 36.20 111 41.25Algeria 125 36.54 122 56.00Jordan 134 38.47 128 56.80Morocco 136 39.04 138 63.29Tunisia 138 39.93 134 60.25Oman 141 41.51 117 55.00Egypt 158 48.66 166 97.50Saudi Arabia 163 56.88 158 83.25Bahrain 165 62.75 173 125.00Yemen 169 69.22 171 101.00Syria 176 78.53 176 138.00
Press Freedom Index
LEBANON’S MEDIA AND ADVERTISING RANKINGS
SPECIAL REPORT
Analysis of Lebanon’s Media and Advertising Sector - May 2014