Embed Size (px)
Citation preview
52 TRANSPORTATION RESEARCH RECORD 1419
Analysis of Guardrail-End Accidents Oklahoma
• ID
J. L. GATTIS, }OHN P. VARGHESE, AND LARRY E. TOOTHAKER
Researchers at the University of Oklahoma documented attributes associated with accidents in which vehicles struck guardrail ends. The data base included accidents at a variety of guardrailend types, but most ends were either exposed or turned down. The severity of exposed and of turned-down guardrail-end accidents in relation to lateral location of the guardrail, and to vehicle rolling and vaulting, was investigated. Individual accident reports were read carefully to obtain information for the analyses. The results showed that on divided roads, vehicles struck median guardrail ends about as often as right-side ends. On undivided roadways, right-side ends were struck about 60 percent of the time. Approximately a sixth of the accidents were fatal or incapacitating-injury accidents. In most of them, the vehicle did not vault or roll. The research did indicate that turned-down guardrail ends were associated with more vehicle rolling and vaulting than the exposed ends. Roughly a third of all guardrail end accidents involved an inattentive driver striking a guardrail end. Most guardrail-end accidents on the state system occurred on a small portion of the system, namely the higher-volume roadways. The researchers suggested that accident reporting methods be enhanced, and that rumble strips be tested as a means to reduce guardrail end strike accidents. If newer, more expensive end treatments were installed, concentrating efforts on a small portion of the system could address a majority of the end accident sites.
Exposed ends and turned-down ends are the two predominant end types currently used on Oklahoma highway guardrails. Researchers studied reports of guardrail-end accidents which occurred on highways maintained by the Oklahoma Department of Transportation (ODOT) from 1988 through 1991 to evaluate the performance of the guardrail-end treatments when struck by vehicles.
BACKGROUND
Accumulated experience and technological changes have led to changed perspectives about roadside safety. Years ago, observers noted that errant vehicles were sometimes impaled on the commonly used exposed guardrail ends. Researchers developed the turned-down-twist guardrail end as a remedy; however, these designs caused some vehicles striking the end to go out of control. In response, designers modified the ends in hopes that vehicles would "ride down the rail" and not roll or vault.
J. L. Gattis, Oklahoma Transportation and Infrastructure Center, University of Oklahoma, 202 West Boyd, Room 334, Norman, Okla. 73109. J. P. Varghese, School of Civil Engineering and Environmental Science, University of Oklahoma, 202 West Boyd, Room 334, Norman, Okla. 73109. L. E. Toothaker, Department of Psychology, University of Oklahoma, 455 West Lindsey, Room 705, Norman, Okla. 73109.
Now, changes in the composite vehicle fleet have resulted in a higher proportion of smaller, lightweight vehicles being on the road. Because some vehicles, especially lightweight vehicles, have flipped when they ride up on a turned-down guardrail end, and because newer end types with better reported performance are on the market, there is a move to replace the turned-down ends with newer guardrail-end designs. A recent FHW A memorandum contained the following statements:
• Turned-down terminals should not be used on new installations of guardrails for freeway, expressway, or other high-speed, high-volume facilities.
• Safety improvement projects, hazard elimination projects, or 3R/4R projects on high-speed, high-volume facilities should require replacement of turned-down end terminals with approved terminals.
• Use of turned-down terminals on low-speed or- any lowvolume facility may be allowed based on reasonable risk management considerations.
FHW A has asked states to act on this policy. Thousands of turned-down ends were installed and are still
in use. State transportation departments are understandably reluctant to incur the cost of replacing existing turned-down ends unless they can be assured that the existing ends are in fact causing problems. Some states have shown interest in investigating the performance of their present guardrail end designs. Two related publications have recently been prepared by the Texas Transportation Institute (1,2).
RESEARCH OBJECTIVES
ODOT wanted to evaluate recent guardrail-end accidents on state highways. An initial study objective was to determine whether, and to what degree, the turned-down guardrail ends used on state highways were associated with
• Vehicle overturning, •Vehicle vaulting, or •Accidental death and injury.
The original plans called for a study of accidents occurring between June·1, 1987, and May 31, 1990. It was assumed that not all police would describe a certain type of accident with the same terms, and guardrail-end accidents possibly could be found in more than one "Object Struck First" category. Therefore, the initial study pool was to have included acci-
Gattis et al.
dents in the "Object Struck First" categories of barrier, bridge rail, and guard post, as well as guardrail. However, ODOT decided that the study would consider only the "guardrail" category, but added an extra year of data to cover accidents between 1988 and 1991 on ODOT Interstate (excluding turnpikes), U.S., and State highways. The study utilized a state accident data base, accident reports, video highway logs, traffic volume maps, as well as other reference materials.
Computerized Accident Data Base
When police investigate an accident, they fill out an "Official Police Traffic Collision Report." Information from these reports is encoded into a state accident data base. ODOT furnished a computer file containing details of guardrail accidents.
Accident Reports
Reports were retrieved for accidents that had been encoded as "guardrail." The research team gleaned information from these reports.
Videotapes
ODOT had more videotapes of Oklahoma highways during that general period, from 1988 through 1991, when the accidents under review occurred. It was assumed that conditions at the accident sites had not changed between the time the video was taken and the time the accidents occurred. Although the videotapes permitted the viewing of many roadway features without visiting the site, tape viewing did not always allow the researchers to find needed information. Viewing impediments included roadside vegetation at the accident location, or an unclear video. At a few accident locations, the
-guardrail was not in the field of vision in the videotape; guardrails located in the median on sharp horizontal curves were especially susceptible to this problem. A few telephone calls and field visits were needed to gather some details.
Average Daily Traffic Volumes
Accident sites were spotted on ODOT average daily traffic (ADT) maps. The ADT nearest to the accident site was taken as the volume for that accident location.
BUILDING AND ANALYZING THE DATA BASE
The overall study goal was to define certain charac;teristics of guardrail-end accidents. A guardrail accident data base was created and analysis was performed so the researchers could gain insight into certain issues.
Location and Direction
The initial data base included all accidents which had been encoded with "guardrail" being the first object struck. The
53
researchers had to separate the end hits from others, and they exercised judgment as to whether each accident involved an actual guardrail-end strike. If the accident report led the researchers to presume that the vehicle struck the guardrail end, then the accident was coded as a "presumed end hit." If the report indicated that the impact was possibly but not likely near the end, then the accident was coded as a "questionable end hit."
The accidents were coded initially with respect to the direction in which the vehicle was travelling. If a vehicle crossed over into the oncoming side and hit the oncoming trailing end, it was considered head-on from the perspective of the vehicle. Later, sorting routines were used to identify vehicles that crossed over the median or centerline and hit. a trailing end head-on.
When the accidents were grouped later, the terms "approach end" and "trailing end" were used with respect to the normal or intended direction of travel in a lane or lanes. The "approach end" is the guardrail end initially encountered at the beginning on the right side of an undivided road; on a divided road, it is the end on the right or left of the lanes intended for one direction of travel. A "trailing end" is the one last encountered at the end of a guardrail installation. When a driver crossed the centerline or the median, the vehicle was said to have struck the trailing end. Accidents were categorized as follows:
•End hits-all guardrail-end accidents, and •Approach end/same side and trailing end/cross over/un
divided accidents-only those in which a vehicle hit the approach end, or crossed over the centerline of an undivided roadway and struck the trailing end on the driver's left side, excluding ends struck from behind.
ODOT reported that, on undivided roads, trailing ends and approach ends are the same type. On divided roads, the trailing end may not be the standard turned-down terminal. To reflect the possible levels of uncertainty about what was actually struck, the data sets eventually created were as follows:
•End hits-presumed (P); •End hits-presumed plus questionable (P + Q); • Approach end/same side and trailing end/cross over/un
divided-presumed; • Approach end/same side and trailing end/cross over/un
divided-presumed plus questionable;
If the vehicle hit more than one guardrail end, then each end hit was treated as a separate accident by entering it twice. To keep the project scope under control, some analyses were not performed on all data sets.
Some accidents were not- classified due to the absence of a collision diagram, or a duplicate accident report. If the vehicle struck the connecting point of the guardrail and bridge parapet wall, then the accident was placed under the "connection with fixed object" category. If the vehicle had struck a concrete bridge barrier or concrete guardrail, then the accident was placed under the "not a guardrail accident" category. A few vehicles approached the guardrail from behind and struck the end; these were placed in the "end hit from behind" category.
54
The researchers also coded the guardrail lateral location with respect to the direction in which the vehicle was traveling. Codes were given for accidents on ramps, frontage roads, and cross streets.
Type of End Struck
The researchers assigned codes to reflect the end type which had been hit. Few accident reports furnished this information, so usually the researchers obtained this from videotapes. On the videos, it was not possible to differentiate breakaway cable terminals (BCTs) with rounded ends from "normal" rounded exposed ends; both were classified as rounded ends. Some BCTs may have been categorized as "exposed" ends. Although the size of any misclassification error is unknown, it is expected to be small.
The researchers used judgment to determine whether guardrail ends were flared. If the end appeared in the video to be significantly set back, they called it flared. In the subsequent analysis, flared ends were not analyzed separately because of their small number.
Vehicle Rolling and Vaulting
The researchers found many of the accident reports contained wording which did not indicate clearly whether the vehicle vaulted. After reviewing the police accident report, the researchers concluded that the vehicle had vaulted in conjunction with striking the guardrail end if the vehicle went airborne, went over the guardrail, or slid on top of the guardrail. If the language in the report was such that the researchers were not sure whether the vehicle vaulted, then the accident was classified as "not sure to have vaulted." If the vehicle did not do any of the preceding actions, then a "vehicle did not vault" classification was made.
If after hitting the guardrail end, the vehicle immediately turned on its side or top, then it was said to have rolled. Sometimes researchers categorized an accident as "rolling was not sure to have occurred," such as when an embankment was close to the end and the researchers could not determine from the report whether the guardrail end or the embankment caused the rolling. If no roll occurred, then the accident was classified as "did not roll."
Injury Accident Severity
The existing data base categorized accidents as fatal, injury, or property damage only (PDO). To further define the severity of injury accidents, the researchers added codes for the three injury severities. Injury A is incapacitating, Injury B is non-incapacitating, and Injury C is a complaint of injury.
Driver Alertness
The researcher added a code to the data base if the wording led them to conclude that driver inattention or drowsiness
TRANSPORTATION RESEARCH RECORD 1419
contributed to the accident. The code was not added when ~eizures or driving under the influence was mentioned, except m a few cases in which the accident report wording led the researchers to conclude that the driver was not severely impaired.
Data Analysis
After building the data base, the researchers performed a number of analyses. Some classification categories were combined to obtain a sufficient number of occurrences per cell.
The researchers found total numbers of guardrail-end accidents exhibiting various types of attributes, such as the number involving a median-end hit. A regression equation was derived to relate the percentage of accidents with the percentage of vehicle miles of travel.
The researchers investigated the effects of combinations of certain factors. Contingency tables were formulated from the "presumed" data sets to investigate the relationship of end type, severity, and rolling and vaulting. The following statistical tests were performed:
•The chi-square test of independence, to determine whether, for a number of data groups combined, the frequency of occurrence of an event (e.g., roll/vault) for a data group differed from that of another data group (e.g., exposed versus turneddown ends);
•The Games-Howell (GH) multiple comparison statistic on cell means, to determine whether the means of two groups of data were statistically different; and
•The binomial proportions test, to determine whether the proportions of two specific data groups were statistically different.
The chi-square and binomial tests are well known. The lesser known GH procedure is especially suited for data groups with unequal sample sizes. It uses the test statistic
tik = (Yi - Yk)!J(sJ!nJ + (s~lnk) (1)
where
Y = sample mean, s2 = unbiased sample variance, and n = sample size for each pair of means, j = k (3).
Because a is chosen to be controlled for each comparison, the null hypothesis H 0 is rejected if
(2)
Otherwise, one does not reject H 0 • The degrees-of-freedom dfik for the observed tik is
dfik = (sJ!ni + s~lnk)2/[(sJ!n)2/(ni - 1)]
+ [(s~/nk)2/(nk - 1)] (3)
Gattis et al.
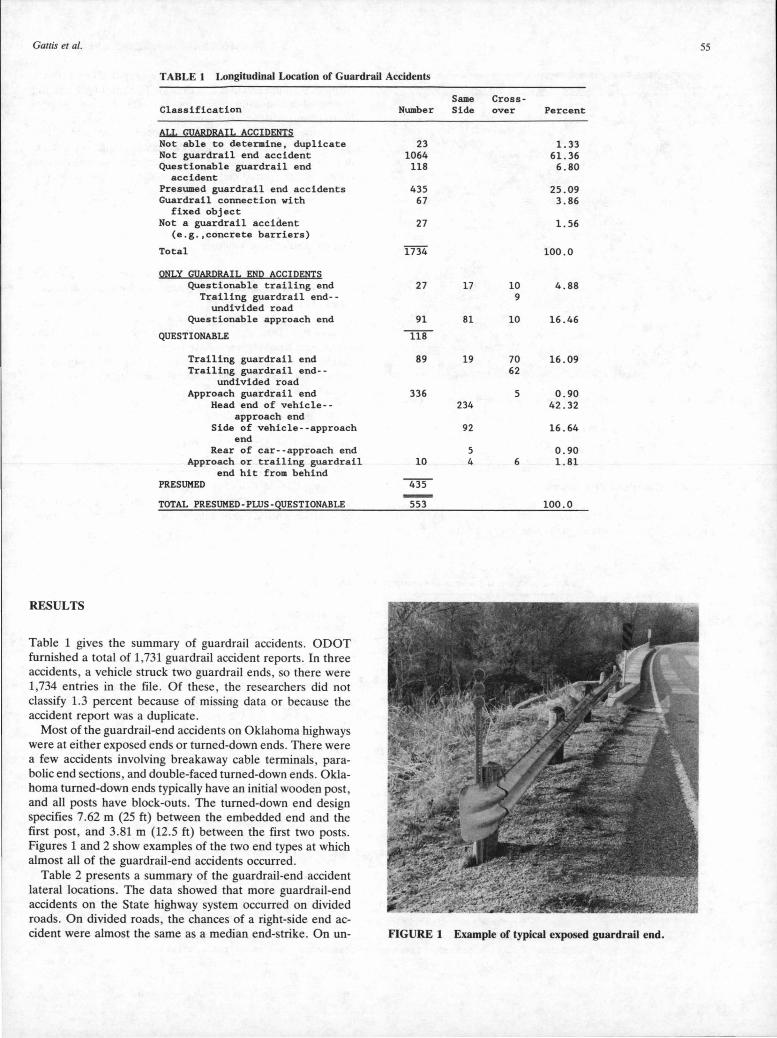
TABLE 1 Longitudinal Location of Guardrail Accidents
Classification
ALL GUARDRAIL ACCIPENIS Not able to determine, duplicate Not guardrail end accident Questionable guardrail end
accident Presumed guardrail end accidents Guardrail connection with
fixed object Not a guardrail accident
(e.g.,concrete barriers)
Total
ONLY GUARPRAIL END ACCIDENTS Questionable trailing end
Trailing guardrail end--undivided road
Questionable approach end
QUESTIONABLE
Trailing guardrail end Trailing guardrail end--
undivided road Approach guardrail end
Head end of vehicle--approach end
Side of vehicle--approach end
Rear of car--approach end Approach or trailing guardrail
end hit from behind PRESUMED
TOTAL PRESUMED-PLUS-gUESTIONABLE
RESULTS
Table 1 gives the summary of guardrail accidents. ODOT furnished a total of 1,731 guardrail accident reports. In three accidents , a vehicle struck two guardrail ends , so there were 1,734 entries in the file . Of these , the researchers did not classify 1.3 percent because of missing data or because the accident report was a duplicate.
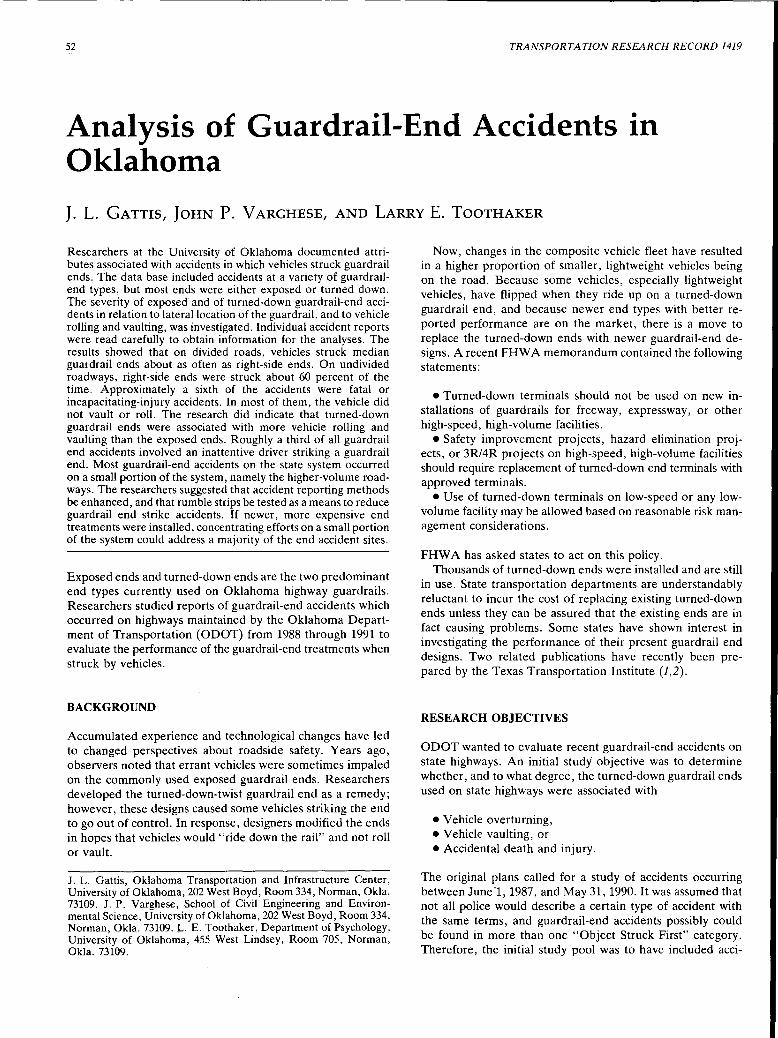
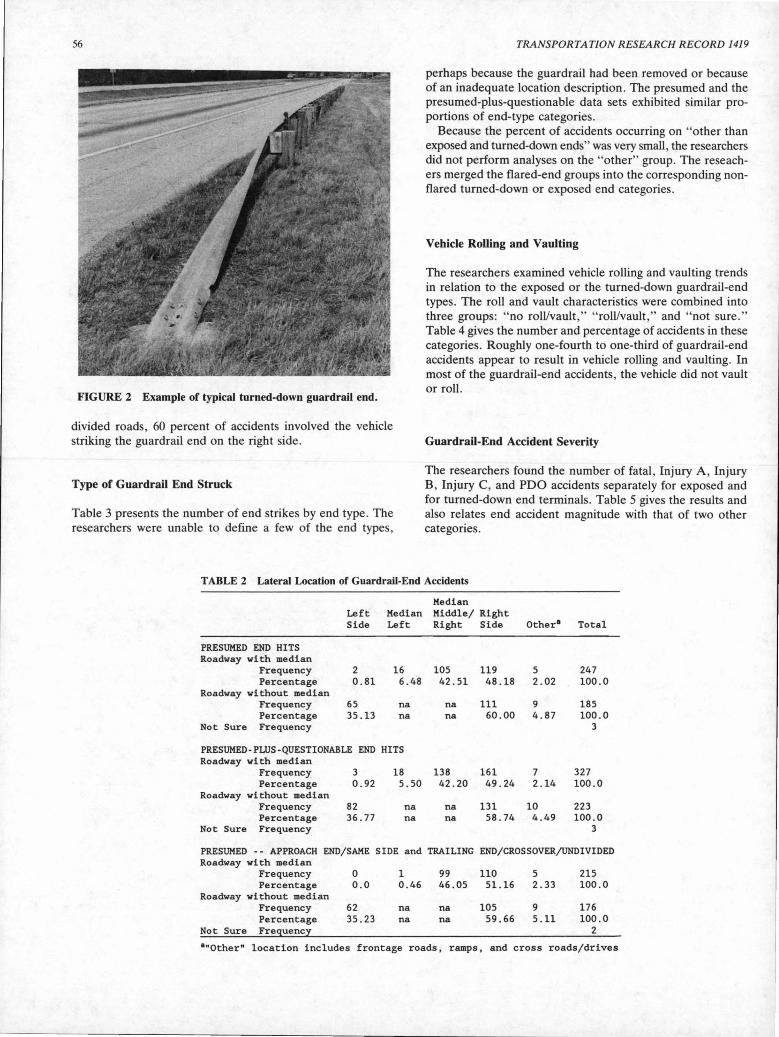
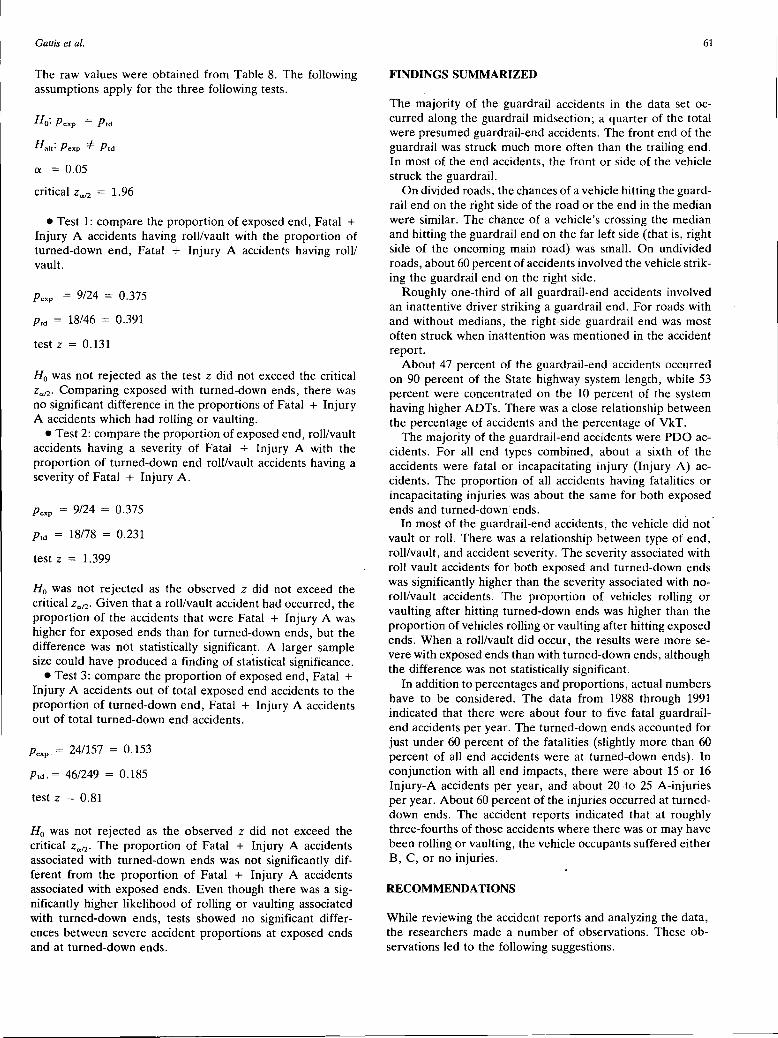
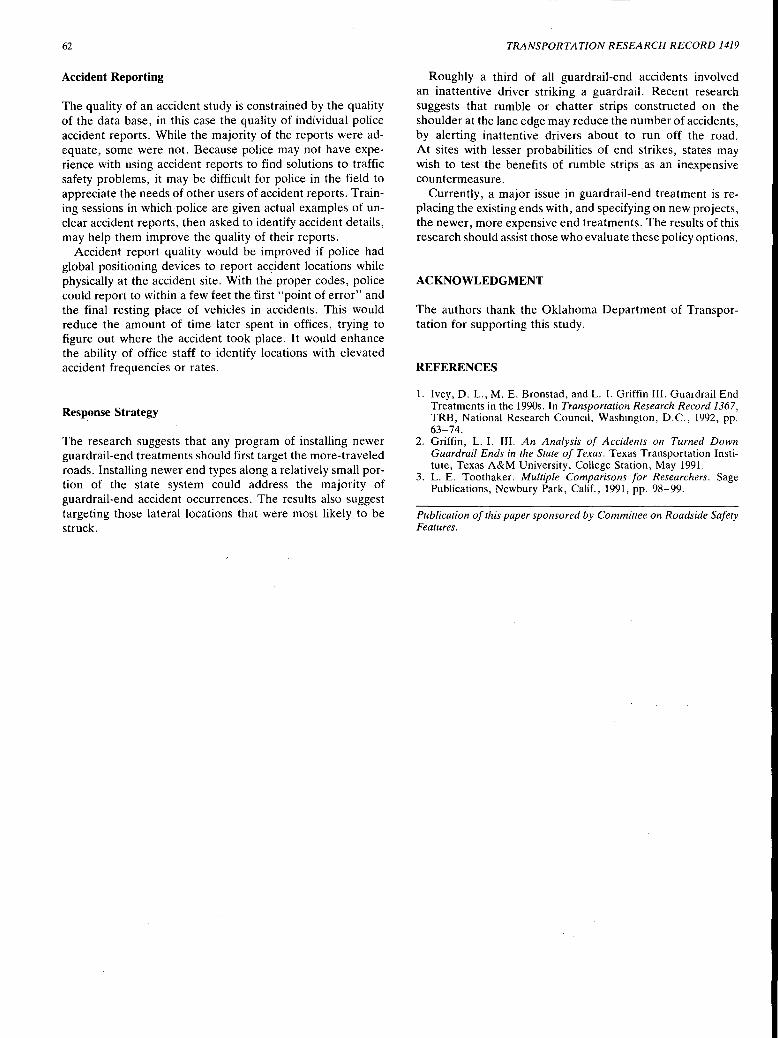
Most of the guardrail-end accidents on Oklahoma highways were at either exposed ends or turned-down ends. There were a few accidents involving breakaway cable terminals , parabolic end sections , and double-faced turned-down ends. Oklahoma turned-down ends typically have an initial wooden post , and all posts have block-outs. The turned-down end design specifies 7.62 m (25 ft) between the embedded end and the first post, and 3.81 m (12.5 ft) between the first two posts. Figures 1 and 2 show examples of the two end types at which almost all of the guardrail-end accidents occurred.
Table 2 presents a summary of the guardrail-end accident lateral locations. The data showed that more guardrail-end accidents on the State highway system occurred on divided roads. On divided roads, the chances of a right-side end accident were almost the same as a median end-strike . On un-
Same Cross-Number Side over Percent
23 1.33 1064 61.36
118 6.80
435 25.09 67 3.86
27 1.56
1734 100.0
27 17 10 4.88 9
91 81 10 16.46
ll8
89 19 70 16.09 62
336 5 0.90 234 42.32
92 16.64
5 0.90 10 4 6 1 . 81
4'35
553 100.0
FIGURE 1 Example of typical exposed guardrail end.
55
56
FIGURE 2 Example of typical turned-down guardrail end.
divided roads, 60 percent of accidents involved the vehicle striking the guardrail end on the right side.
Type of Guardrail End Struck
Table 3 presents the number of end strikes by end type. The researchers were unable to define a few of the end types,
TRANSPORTATION RESEARCH RECORD 1419
perhaps because the guardrail had been removed or because of an inadequate location description. The presumed and the presumed-plus-questionable data sets exhibited similar proportions of end-type categories.
Because the percent of accidents occurring on " other than exposed and turned-down ends" was very small, the researchers did not perform analyses on the "other" group. The reseachers merged the flared-end groups into the corresponding nonflared turned-down or exposed end categories.
Vehicle Rolling and Vaulting
The researchers examined vehicle rolling and vaulting trends in relation to the exposed or the turned-down guardrail-end types. The roll and vault characteristics were combined into three groups: "no roll/vault," "roll/vault," and "not sure." Table 4 gives the number and percentage of accidents in these categories. Roughly one-fourth to one-third of guardrail-end accidents appear to result in vehicle rolling and vaulting. In most of the guardrail-end accidents, the vehicle did not vault or roll.
Guardrail-End Accident Severity
The researchers found the number of fatal, Injury A, Injury B, Injury C, and PDO accidents separately for exposed and for turned-down end terminals. Table 5 gives the results and also relates end accident magnitude with that of two other categories.
TABLE 2 Lateral Location of Guardrail-End Accidents
Median Left Median Middle/ Right Side Left Right Side Other• Total
PRESUMED END HITS Roadway with median
Frequency 2 16 105 119 5 247 Percentage 0.81 6.48 42.51 48.18 2.02 100.0
Roadway without median Frequency 65 na na 111 9 185 Percentage 35.13 na na 60.00 4.87 100.0
Not Sure Frequency 3
PRESUMED-PLUS-QUESTIONABLE END HITS Roadway with median
Frequency 3 18 138 161 7 327 Percentage 0.92 5.50 42.20 49.24 2.14 100.0
Roadway without median Frequency 82 na na 131 10 223 Percentage 36. 77 na na 58.74 4.49 100.0
Not Sure Frequency 3
PRESUMED -- APPROACH END/SAME SIDE and TRAILING END/CROSSOVER/UNDIVIDED Roadway with median
Frequency 0 1 99 110 5 215 Percentage 0.0 0.46 46.05 51.16 2.33 100.0
Roadway without median Frequency 62 na na 105 9 176 Percentage 35.23 na na 59.66 5.11 100.0
Not Sure Fre9uency 2 8 "0ther" location includes frontage roads, ramps, and cross roads/drives
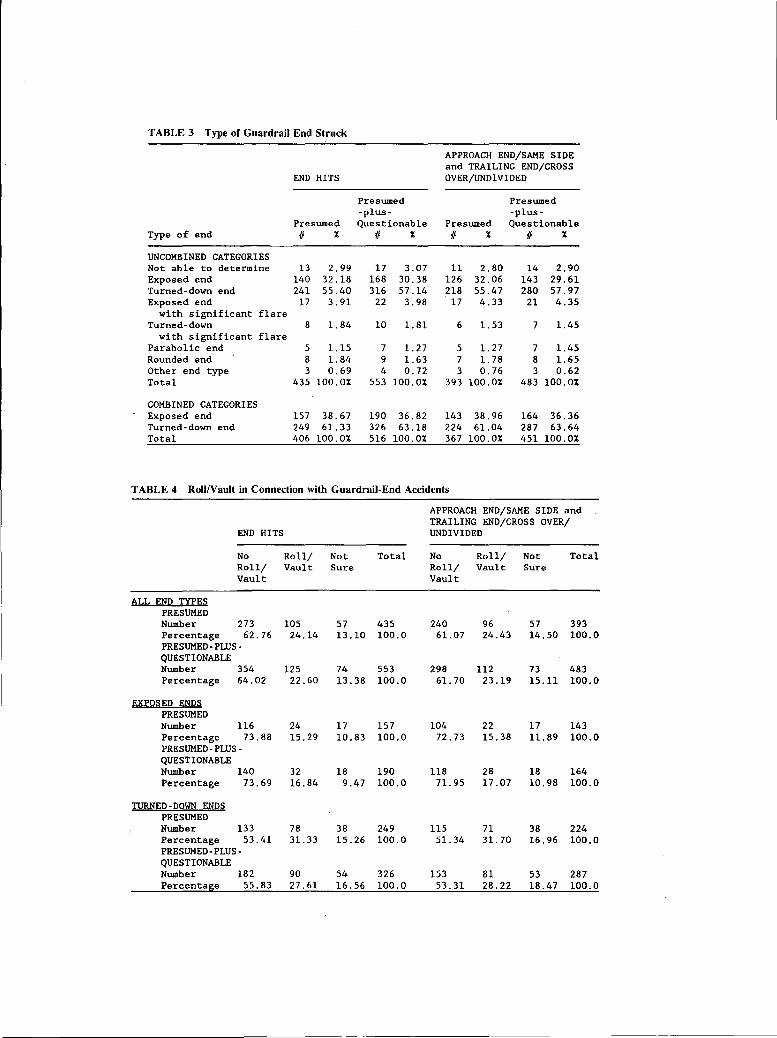
TABLE 3 Type of Guardrail End Struck
APPROACH END/SAME SIDE and TRAILING END/CROSS
END HITS OVER/UNDIVIDED
Presumed Presumed -plus- -plus-
Presumed Questionable Presumed Questionable Type of end II % II % II % II %
UNCOMBINED CATEGORIES Not able to determine 13 2.99 17 3.07 11 2.80 14 2.90 Exposed end 140 32.18 168 30.38 126 32.06 143 29.61 Turned-down end 241 55.40 316 57.14 218 55.47 280 57.97 Exposed end 17 3.91 22 3.98 17 4.33 21 4.35
with significant flare Turned-down 8 1.84 10 1.81 6 1. 53 7 1.45
with significant flare Parabolic end 5 1.15 7 1. 27 5 1. 27 7 1.45 Rounded end 8 1. 84 9 1.63 7 1. 78 8 1.65 Other end type 3 0.69 4 0. 72 3 0.76 3 0.62 Total 435 100.0% 553 100.0% 393 100.0% 483 100.0%
COMBINED CATEGORIES Exposed end 157 38.67 190 36.82 143 38.96 164 36.36 Turned-down end 249 61. 33 326 63.18 224 61.04 287 63.64 Total 406 100.0% 516 100.0% 367 100.0% 451 100.0%
TABLE 4 Roll/Vault in Connection with Guardrail-End Accidents
APPROACH END/SAME SIDE and TRAILING END/CROSS OVER/
END HITS UNDIVIDED
No Roll/ Not Total No Roll/ Not Total Roll/ Vault Sure Roll/ Vault Sure Vault Vault
ALL END TYPES PRESUMED Number 273 105 57 435 240 96 57 393 Percentage 62.76 24.14 13.10 100.0 61.07 24.43 14.50 100.0 PRESUMED-PLUS-QUESTIONABLE Number 354 125 74 553 298 ll2 73 483 Percentage 64.02 22.60 13.38 100.0 61. 70 23.19 15.11 100.0
EXPOSED ENDS PRESUMED Number 116 24 17 157 104 22 17 143 Percentage 73.88 15.29 10.83 100.0 72. 73 15.38 11.89 100.0 PRESUMED-PLUS-QUESTIONABLE Number 140 32 18 190 118 28 18 164 Percentage 73.69 16.84 9.47 100.0 71. 95 17.07 10.98 100.0
TURNED-DOWN ENDS PRESUMED Number 133 78 38 249 115 71 38 224 Percentage 53.41 31. 33 15.26 100.0 51.34 31. 70 16.96 100.0 PRESUMED-PLUS-QUESTIONABLE Number 182 90 54 326 153 81 53 287 Percentage 55.83 27.61 16.56 100.0 53.31 28.22 18.47 100.0
58 TRANSPORTATION RESEARCH RECORD 1419
TABLE 5 Severity of Accidents on State DOT System, 1988-1991
Presumed Approach End/Same Presumed- Fixed Fixed Side and plus- Object- Object-
Total II Trailing/ Presumed Question- Culvert Utility of ALL Crossover/ Guardrail able Acc. Pole Accidents Undivided End Hits End Hits Acc.
Severity 1988-1992 X of ALL X of ALL X of ALL x of ALL X of ALL
Fatal 1,315 1.05% 1.14% 1.45% 2.05% 1.22% Injury A 8,270 0.65% 0.69% 0.80% 1.81% 1.05% Injury B 9,048 0.74% 0.82% 1.07% 2.01% 1.24% Injury C 17 I 773 0.29% 0.32% 0.39% 0.74% 0.77% PDO 63,757 0.32% 0.37% 0.47% 0.51% 0.84% Total 100,163 0.39% 0.43% 0.55% 0.82% 0.89%
GUARDRAIL END ACCIDENTS
END HITS
Presumed
Presumed -plusQuestionable
Severity II x II x
ALL END TYPES COMBINED Fatal+A 72 16.55 85 15.37 Inj B+C 130 29.89 167 30.20 PDO 233 53.56 301 54.43 Total 435 100.0% 553 100.0X
EXPOSED ENDS Fatal+A 24 15.29 30 15.79 Inj B+C 52 33.12 61 32.11 PDO 81 51.59 99 52.10 Total 157 100.0X 190 100.0X
TURNED-~OYN ENDS ---Fatal+A Inj B+C PDO Total
46 18.47 70 28.12
133 53.41 249 100.0%
Driver Inattention and Guardrail-End Accidents
52 15.95 97 29.75
177 54. 30 326 100.0X
Table 6 indicates that roughly a fifth of all guardrail-end ac-: cidents involved an inattentive driver striking the right-side guardrail end. On divided roads, the chance of an 'unalert driver hitting a guardrail end on the right side was slightly more than that for hitting an end on the near side or center of the median. On undivided roads, the chance for hitting a right-side guardrail end was almost double that for hitting a left side end. The actual portion of inattentive drivers involved in guardrail-end accidents may be greater; this categorization was made only if the police mentioned a form of inattention in the report.
Accident Frequency and Travel
The researchers performed analyses to determine whether guardrail-end strike frequency was a function of the amount of travel on the roadway. ODOT provided a file containing the number of miles of State highways for each 1,000 vehicles per day (ADT) volume increment. Volume data for 1989 were used as representative of the period 1988 through 1991.
For each ADT volume increment, the midpoint of the volume range was multiplied by the kilometers of road in that
APPROACH END/SAME SIDE and TRAILING END/CROSS OVER/UNDIVIDED
Presumed II x
68 17.30 119 30.28 206 52.42 393 100.0X
22 15.38 48 33.57 73 51.05
143 100.0X
44 19.64 64 28.57
116 51. 79 224 100.0X
Presumed -plusQuestionable II x
78 16.15 147 30.43 258 53.42 483 100.0%
27 16.46 52 31. 71 85 51.83
164 100.0X
48 16.73 88 30.66
151 52.61 287 100.0%
range to arrive at the vehicle kilometers of travel (VkT). For instance, for the volume range 1,000 to 1,999, VkT were calculated as follows:
1,500 vehicles per day* 5016.9 km (3,117.37 mi.)
= 7 525 381 VkT (4)
The percentage of VkT for each of the ADT groups was also determined.
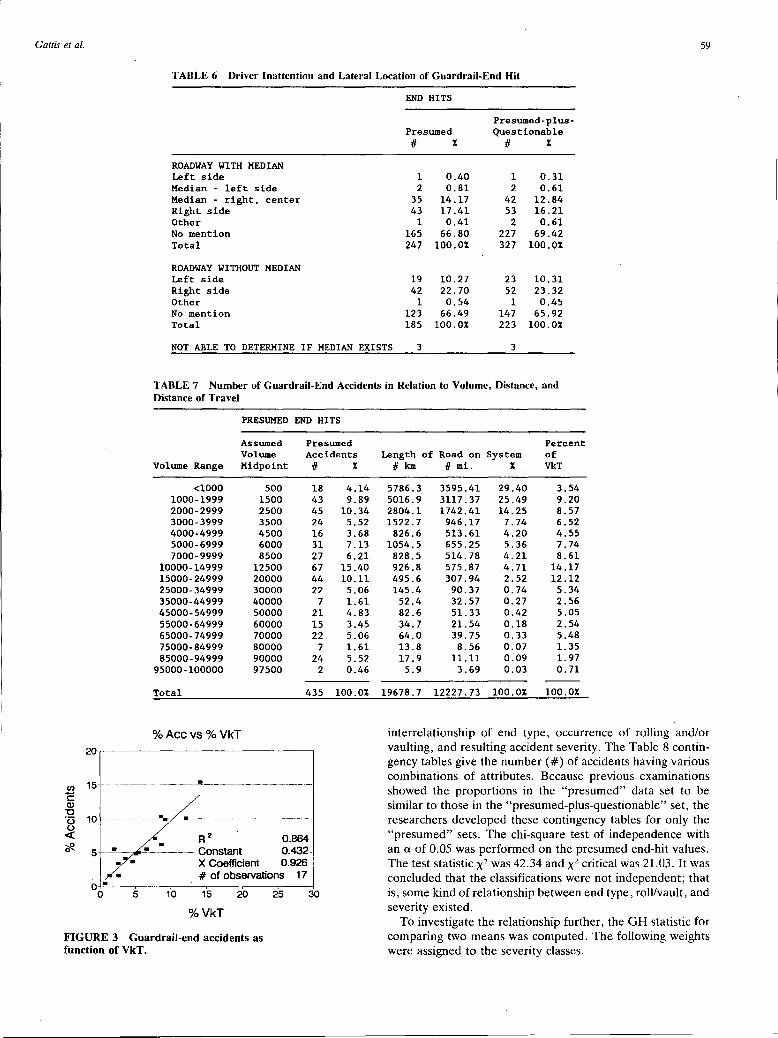
It can be concluded from Table 7 that about 47 percent of the guardrail-end accidents occurred on 17 840 km (11,085 mi) of roads having volumes less than 10,000 ADT. These lower-volume roads constituted more than 90 percent of the length of the state highway system. About 53 percent of guardrail-end accidents were concentrated on the 10 percent of the system length having the higher ADTs. Figure 3 shows that a close relationship exists between the proportion of accidents and the proportion of VkT.
Multiple Factors: End Type Versus Roll/Vault Versus Severity
In addition to investigating the individual attributes of the guardrail-end accident problem, the researchers studied the
Gattis et al.
TABLE 6 Driver Inattention and Lateral Location of Guardrail-End Hit
ROADWAY WITH MEDIAN Left side Median - left side Median - right, center Right side Other No mention Total
ROADWAY WITHOUT MEDIAN Left side Right side Other No mention Total
NOT ABLE TO DETERMINE IF MEDIAN EXISTS
END HITS
Presumed II x
1 0.40 2 0.81
35 14.17 43 17.41
1 0.41 165 66.80 247 100.0%
19 10.27 42 22.70
1 0.54 123 66.49 185 100.0%
3
Presumed-plusQuestionable
II x
1 0.31 2 0.61
42 12.84 53 16.21
2 0.61 227 69.42 327 100.0%
23 10.31 52 23.32 1 0.45
147 65.92 223 100.0%
3
TABLE 7 Number of Guardrail-End Accidents in Relation to Volume, Distance, and Distance of Travel
PRESUMED END HITS
Assumed Presumed Percent Volume Accidents Length of Road on System of
Volume Range Midpoint II % II km fl mi. % VkT
<1000 500 18 4.14 5786.3 3595.41 29.40 3.54 1000-1999 1500 43 9.89 5016.9 3117.37 25.49 9.20 2000-2999 2500 45 10.34 2804.l 1742.41 14.25 8.57 3000-3999 3500 24 5.52 1522.7 946.17 7.74 6.52 4000-4999 4500 16 3.68 826.6 513.61 4.20 4.55 5000-6999 6000 31 7 .13 1054.5 655.25 5.36 7.74 7000-9999 8500 27 6.21 828.5 514.78 4.21 8.61
10000-14999 12500 67 15.40 926.8 575.87 4.71 14.17 15000-24999 20000 44 10.11 495.6 307.94 2.52 12.12 25000-34999 30000 22 5.06 145.4 90.37 0.74 5.34 35000-44999 40000 7 1.61 52.4 32.57 0.27 2.56 45000-54999 50000 21 4.83 82.6 51.33 0.42 5.05 55000-64999 60000 15 3.45 34.7 21.54 0.18 2.54 65000-74999 70000 22 5.06 64.0 39.75 0.33 5.48 75000-84999 80000 7 1.61 13.8 8.56 0.07 1. 35 85000-94999 90000 24 5.52 17.9 11.11 0.09 1. 97
95000-100000 97500 2 0.46 5.9 3.69 0.03 0.71
Total 435 100.0% 19678.7 12227.73 100.0% 100.0%
%Accvs % VkT
59
en 15 -·-··----····--··--------··-·----!!.---··-·-·-···---··------·-·--··-·-----
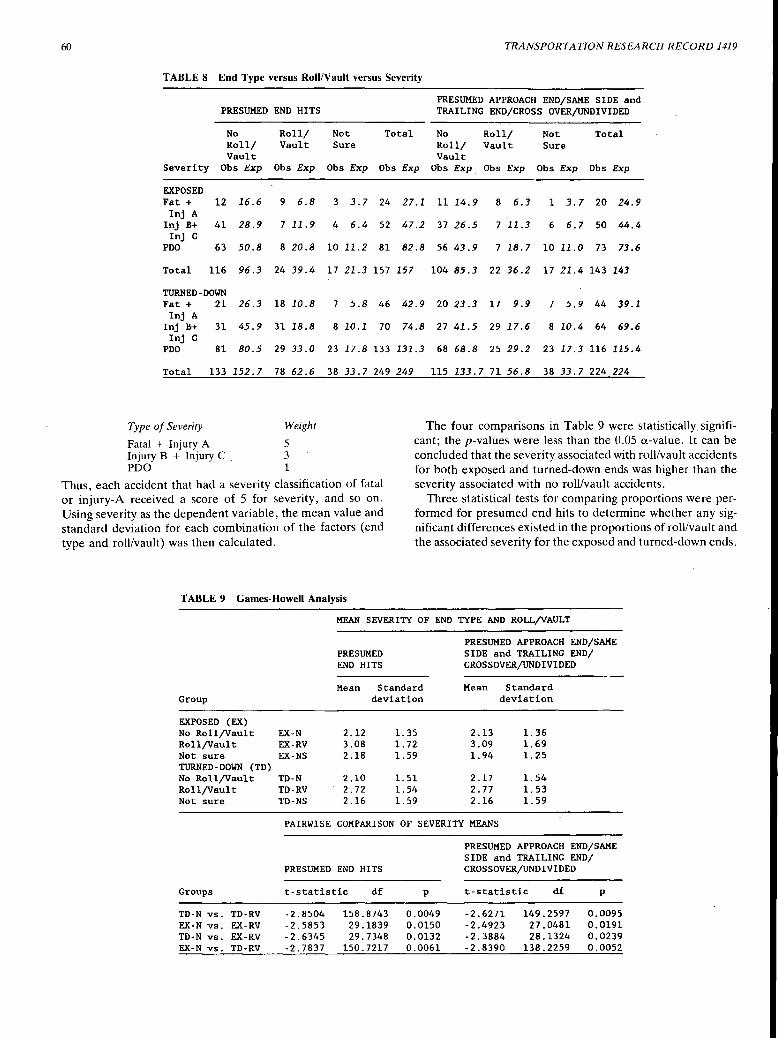
interrelationship of end type, occurrence of rolling and/or vaulting, and resulting accident severity. The Table 8 contingency tables give the number ( #) of accidents having various combinations of attributes. Because previous examinations showed the proportions in the "presumed" data set to be similar to those in the "presumed-plus-questionable" set, the researchers developed these contingency tables for only the "presumed" sets. The chi-square test of independence with an a of 0.05 was performed on the presumed end-hit values. The test statistic x2 was 42.34 and x2 critical was 21.03. It was concluded that the classifications were not independent; that is, some kind of relationship between end type, roll/vault, and severity existed.
E Q) "O ·5
~ ?fl.
10 -·-·-··-··-------~ -·-···---·-··-·---·--·---·-·----··--·-·---·-
R 2 0.864 5 ___ ., ___ ,.,__~-----·--Constant 0.432-
0 5 10
X Coefficient 0.926 # of observations 17
15
%VkT
20 25 30
FIGURE 3 Guardrail-end accidents as function of VkT.
To investigate the relationship further, the GH statistic for comparing two means was computed. The following weights were assigned to the severity classes.
60
TABLE 8 End Type versus Roll/Va ult versus Severity
PRESUMED
No Roll/ Vault
Severity Obs Exp
EXPOSED Fat + 12 16.6 Inj A
Inj B+ 41 28.9 Inj C
PDO 63 50.8
Total ll6 96.3
TURNED-DOWN Fat + 21 26.3 Inj A
Inj B+ 31 45.9 Inj C
PDO 81 80.5
Total 133 152.7
Type of Severity
Fatal + Injury A Injury B + Injury C . PDO
END HITS
Roll/ Vault
Obs Exp
9 6.8
7 11.9
8 20.8
24 39.4
18 10.8
31 18.8
29 33.0
78 62.6
Weight
5 3 1
Not Total Sure
Obs Exp Obs Exp
3 3.7 24 27.1
4 6.4 52 47.2
10 11.2 81 82.8
17 21.3 157 157
7 5.8 46 42.9
8 10.1 70 74.8
23 17.8 133 131.3
38 33.7 249 249
TRANSPORTATION RESEARCH RECORD 1419
PRESUMED APPROACH END/SAME SIDE and TRAILING END/CROSS OVER/UNDIVIDED
No Roll/ Not Total Roll/ Vault Sure Vault
Obs Exp. Obs Exp Obs Exp Obs Exp
ll 14. 9 8 6.3 1 3.7 20 24.9
37 26.5 7 11.3 6 6.7 50 44.4
56 43.9 7 18.7 10 11.0 73 73.6
104 85.3 22 36.2 17 21. 4 143 143
20 23.3 17 9.9 7 5.9 44 39.1
27 41.5 29 17.6 8 10.4 64 69.6
68 68.8 25 29.2 23 17.3 ll6 115.4
115 133.7 71 56.8 38 33.7 224 224
Thus, each accident that had a severity classification of fatal or injury-A received a score of 5 for severity, and so on. Using severity as the dependent variable, the mean value and standard deviation for each combination of the factors (end type and roll/vault) was then calculated.
The four comparisons in Table 9 were statistically significant; the p-values were less than the 0.05 a-value. It can be concluded that the severity associated with roll/vault accidents for both exposed and turned-down ends was higher than the severity associated with no roll/vault accidents.
Three statistical tests for comparing proportions were performed for presumed end hits to determine whether any significant differences existed in the proportions of roll/vault and the associated severity for the exposed and turned-down ends.
TABLE 9 Games-Howell Analysis
Group
EXPOSED (EX) No RollfVault Roll/Vault Not sure TURNED-DOWN (TD) No Roll/Vault Roll/Vault Not sure
Groups
TD-N vs. TD-RV EX-N vs. EX-RV TD-N vs. EX-RV EX-N vs. TD-RV
MEAN SEVERITY OF END TYPE AND ROLL/VAULT
PRESUMED APPROACH END/SAME PRESUMED SIDE and TRAILING END/ END HITS CROSSOVER/UNDIVIDED
Mean Standard Mean Standard deviation deviation
EX-N 2.12 1. 35 2.13 1. 36 EX-RV 3.08 1. 72 3.09 1.69 EX-NS 2.18 1.59 1. 94 1. 25
TD-N 2.10 1.51 2.17 1. 54 TD-RV 2. 72 1.54 2. 77 1. 53 TD-NS 2.16 1.59 2.16 1. 59
PAIRWISE COMPARISON OF SEVERITY MEANS
PRESUMED END HITS
t-statistic df p
-2.8504 158.8743 0.0049 -2.5853 29.1839 0.0150 -2.6345 29.7348 0. 0132 -2.7837 150.7217 0.0061
PRESUMED APPROACH END/SAME SIDE and TRAILING END/ CROSSOVER/UNDIVIDED
t-statistic df
-2.6271 -2.4923 -2.3884 -2.8390
149.2597 27.0481 28.1324
138. 2259
p
0.0095 0.0191 0.0239 0.0052
Gattis et al.
The raw values were obtained from Table 8. The following assumptions apply for the three following tests.
Ho: Pexp = Ptct
O'. = 0.05
critical Zan = 1. 96
•Test 1: compare the proportion of exposed end, Fatal + Injury A accidents having roll/vault with the proportion of turned-down end, Fatal + Injury A accidents having roll/ vault.
Pexp = 9/24 = 0.375
Pcct = 18/46 = 0.391
test z = 0.131
H 0 was not rejected as the test z did not exceed the critical Zan· Comparing exposed with turned-down ends, there was no significant difference in the proportions of Fatal + Injury A accidents which had rolling or vaulting.
•Test 2: compare the proportion of exposed end, roll/vault accidents having a severity of Fatal + Injury A with the proportion of turned-down end roll/vault accidents having a severity of Fatal + Injury A.
Pexp = 9/24 = 0.375
Pict = 18/78 = 0.231
test z = 1.399
H 0 was not rejected as the observed z did not exceed the critical Zan· Given that a roll/vault accident had occurred, the proportion of the accidents that were Fatal + Injury A was higher for exposed ends than for turned-down ends, but the difference was not statistically significant. A larger sample size could have produced a finding of statistical significance.
•Test 3: compare the proportion of exposed end, Fatal + Injury A accidents out of total exposed end accidents to the proportion of turned-down end, Fatal + Injury A accidents out of total turned-down end accidents.
Pexp: = 24/157 = 0.153
Pcct, = 46/249 = 0.185
test z = 0.81
H 0 was not rejected as the observed z did not exceed the critical Zan· The proportion of Fatal + Injury A accidents associated with turned-down ends was not significantly different from the proportion of Fatal + Injury A accidents associated with exposed ends. Even though there was a significantly higher likelihood of rolling or vaulting associated with turned-down ends, tests showed no significant differences between severe accident proportions at exposed ends and at turned-down ends.
61
FINDINGS SUMMARIZED
The majority of the guardrail accidents in the data set occurred along the guardrail midsection; a quarter of the total were presumed guardrail-end accidents. The front end of the guardrail was struck much more often than the trailing end. In most of the end accidents, the front or side of the vehicle struck the guardrail.
On divided roads, the chances of a vehicle hitting the guardrail end on the right side of the road or the end in the median were similar. The chance of a vehicle's crossing the median and hitting the guardrail end on the far left side (that is, right side of the oncoming main road) was small. On undivided roads, about 60 percent of accidents involved the vehicle striking the guardrail end on the right side.
Roughly one-third of all guardrail-end accidents involved an inattentive driver striking a guardrail end. For roads with and without medians, the right-side guardrail end was most often struck when inattention was mentioned in the accident report.
About 47 percent of the guardrail-end accidents occurred on 90 percent of the State highway system length, while 53 percent were concentrated on the 10 percent of the system having higher ADTs. There was a close relationship between the percentage of accidents and the percentage of VkT.
The majority of the guardrail-end accidents were PDQ accidents. For all end types combined, about a sixth of the accidents were fatal or incapacitating injury (Injury A) accidents. The proportion of all accidents having fatalities or incapacitating injuries was about the same for both exposed ends and turned-down· ends.
In most of the guardrail-end accidents, the vehicle did not· vault or roll. There was a relationship between type of end, roll/vault, and accident severity. The severity associated with roll vault accidents for both exposed and turned-down ends was significantly higher than the severity associated with noroll/vault accidents. The proportion of vehicles rolling or vaulting after hitting turned-down ends was higher than the proportion of vehicles rolling or vaulting after hitting exposed ends. When a roll/vault did occur, the results were more severe with exposed ends than with turned-down ends, although the difference was not statistically significant.
In addition to percentages and proportions, actual numbers have to be considered. The data from 1988 through 1991 indicated that there were about four to five fatal guardrailend accidents per year. The turned-down ends accounted for just under 60 percent of the fatalities (slightly more than 60 percent of all end accidents were at turned-down ends). In conjunction with all end impacts, there were about 15 or 16 Injury-A accidents per year, and about 20 -to 25 A-injuries per year. About 60 percent of the injuries occurred at turneddown ends. The accident reports indicated that at roughly three-fourths of those accidents where there was or may have been rolling or vaulting, the vehicle occupants suffered either B, C, or no injuries.
RECOMMENDATIONS
While reviewing the accident reports and analyzing the data, the researchers made a number of observations. These observations led to the following suggestions.
62
Accident Reporting
The quality of an accident study is constrained by the quality of the data base, in this case the quality of individual police accident reports. While the majority of the reports were adequate, some were not. Because police may not have experience with using accident reports to find solutions to traffic safety problems, it may be difficult for police in the field to appreciate the needs of other users of accident reports. Training sessions in which police are given actual examples of unclear accident reports, then asked to identify accident details, may help them improve the quality of their reports.
Accident report quality would be improved if police had global positioning devices to report accident locations while physically at the accident site. With the proper codes, police could report to within a few feet the first "point of error" and the final resting place of vehicles in accidents. This would reduce the amount of time later spent in offices, trying to figure out where the accident took place. It would enhance the ability of office staff to identify locations with elevated accident frequencies or rates.
Res~onse Strategy
The research suggests that any program of installing newer guardrail-end treatments should first target the more-traveled roads. Installing newer end types along a relatively small portion of the state system could address the majority of guardrail-end accident occurrences. The results also suggest targeting those lateral locations that were most likely to be struck.
TRANSPORTATION RESEARCH RECORD 1419
Roughly a third of all guardrail-end accidents involved an inattentive driver striking a guardrail. Recent research suggests that rumble or chatter strips constructed on the shoulder at the lane edge may reduce the number of accidents, by alerting inattentive drivers about to run off the road. At sites with lesser probabilities of end strikes, states may wish to test the benefits of rumble strips _as an inexpensive countermeasure.
Currently, a major issue in guardrail-end treatment is replacing the existing ends with, and specifying on new projects, the newer, more expensive end treatments. The results of this research should assist those who evaluate these policy options.
ACKNOWLEDGMENT
The authors thank the Oklahoma Department of Transportation for supporting this study.
REFERENCES
1. Ivey, D. L., M. E. Bronstad, and L. I. Griffin III. Guardrail End Treatments in the 1990s. In Transportation Research Record 1367, TRB, National Research Council, Washington, D.C., 1992, pp. 63-74.
2. Griffin, L. I. III. An Analysis of Accidents on Turned Down Guardrail Ends in the State of Texas. Texas Transportation Institute, Texas A&M University, College Station, May 1991.
3. L. E. Toothaker. Multiple Comparisons for Researchers. Sage Publications, Newbury Park, Calif., 1991, pp. 98-99.
Publication of this paper sponsored by Committee on Roadside Safety Features.