Embed Size (px)
Citation preview

___________________________
Corresponding author: Saida S. Sharifova, Genetic Resources Institute of Azerbaijan National
Academy of Sciences, Azadlig Ave 155, AZ1106, Baku, Azerbaijan, phone: (00994 50) 410 82
05,e-mail: [email protected]
UDC 575.630
https://doi.org/10.2298/GENSR1701031S Original scientific paper
ANALYSIS OF GENETIC DIVERSITY AMONG DIFFERENT TOMATO
GENOTYPES USING ISSR DNA MARKER
Saida S. SHARIFOVA, Sabina P. MEHDIYEVA, Mehraj A. ABBASOV
Genetic Resources Institute of Azerbaijan National Academy of Sciences,
AZ1106, Baku, Azerbaijan
Sharifova S.S., S. P. Mehdiyeva, M. A. Abbasov (2017): Analysis of genetic diversity
among different tomato genotypes using ISSR DNA marker.- Genetika, Vol 49, No. 1, 31 -
42.
Inter simple sequence repeat (ISSR) markers were used for variation analysis among 41
tomato accessions. A total of 50 scorable bands were obtained, where 32 were
polymorphic, representing 63.3% of all the amplified loci. Polymorphism percentage
ranged from 50 to 90% and an average number of polymorphic bands of 4.0 were
observed. An average genetic diversity index was 0.61. Primer UBC860 and UBC825
generated the greatest diversity index with a value of 0.89 and 0.85 respectively. The
smallest diversity identified by primer UBC808, with an index of 0.34. The genetic
similarity among studied genotypes ranged from 0.52 to 0.98. The cluster analysis based
on Jaccard’s similarity coefficient divided genotypes into 6 distinct clusters on a value of
0.74. The lowest genetic distance was found between ‘Gronastiy’ and ‘AG1224’ (0.52),
‘Orange’ and ‘AG1224’ (0.54), and ‘Evgeniya’ and ‘AG1224’ (0.55) accessions. The
highest similarity of 0.98 was determined between ‘Zafar’ and ‘Azerbaijan-94’,
‘Khachmaz-1’ and ‘Azerbaijan-94’, ‘Khachmaz-1’ and ‘Severyanka’, and ‘Shakar’ and
‘Absheron-1’ accessions.
Key words: allele, genetic diversity, markers, tomato
INTRODUCTION
Cultivated tomato (Solanum lycopersicum L.) is a significant vegetable crop of economic
importance and widely grown around the world (HE et al., 2003; WANG et. al., 2005; ELHAM et al.,
2010). The tomato core collection of the European Solanaceae database is consisted of about 7000
domesticated (S. lycopersicum L.) lines, along with many representatives of wild species provided
by international gene banks and by donations from private collections (https://www.eu-
sol.wur.nl/).
The cultivated tomato has limited variability mainly due to population bottlenecks
occurred though domestication and evolution of modern cultivars (FOOLAD et al., 2007).

32 GENETIKA, Vol. 49, No 1, 31-42, 2017
Therefore, sufficient information on the genetic diversity among tomato genotypes conserved in
the gene banks is necessary for the development of effective breeding strategies. On the other
hand, knowledge about genetic diversity is a prerequisite for elimination of suspected duplicates
for effective management in the germplasm collections.
Nowadays, numerous markers are being widely used for description of genetic resources
(SCHLÖTTERER, 2004). Exploring of genetic diversity using DNA markers is very important
strategy and much more cost effective than traditional or phenotypic approach. A numbers of DNA
markers, including restriction fragment length polymorphism (RFLP), random amplified
polymorphic DNA (RAPD), amplified fragment length polymorphism (AFLP), inter simple
sequence repeats (ISSR), simple sequence repeats (SSRs), cleaved amplified polymorphic
sequence (CAPS), sequence-tagged site (STS), sequenced characterized amplified region (SCAR)
and single nucleotide polymorphism (SNP), markers that are being widely used for genetic
diversity analysis of germplasm collections (SEMAGN et al., 2006). Despite of using different
molecular markers to study genetic diversity in cultivated tomatoes, many of them identify limited
level of polymorphism (MILLER and TANKSLEY, 1990; ALVAREZ et al., 2001; ARCHAK et al., 2002;
KOCHEIVA et al., 2002; TIKUNOV et al., 2003; PARK et al., 2004; FRARY et al., 2005; RUIZ et al.,
2005; BOJINOV and DANAILOV, 2008; TERZOPOULOS and BEBELI, 2008). Therefore, identification
of more polymorphic molecular markers is important for tomato research.
ISSR markers are considered very useful in studies of genetic diversity, phylogeny,
genomics and evolutionary biology (REDDY et al., 2002; HAVLICKOVÁ et al., 2014). The aim of
this study was to evaluate the genetic diversity among the tomato accessions conserved at the Gene
Bank of Genetic Resources Institute (AGRI) of Azerbaijan National Academy of Sciences
(ANAS) by using ISSR markers.
MATERIALS AND METHODS
Research material consisted of 34 tomato genotypes conserved at the gene bank and 7 new
obtained accessions from markets (Table 1).
Table 1. List of tomato genotypes used for genetic diversity analysis
No 1NI
code
Institute
code
Accession
number
Accession name Country
of origin
*Biol
Stat.
**Coll.
source
#Storage
1 AZE AZE015 AzGR-4675 Shalala AZE 500 40 12
2 AZE AZE015 AzGR-9468 Krasnodar RUS 500 40 12
3 AZE AZE015 nAzGR Atol POL 999 23 -
4 AZE AZE015 nAzGR Krakus POL 999 23 -
5 AZE AZE015 AzGR-9474 Shakar AZE 500 40 12
6 AZE AZE015 AzGR-10264 Zafar AZE 500 40 12
7 AZE AZE015 AzGR-7651 AG-1222 AZE 999 30 12
8 AZE AZE015 AzGR-7653 AG-1224 AZE 999 30 12
9 AZE AZE015 AzGR-8635 Saatly AZE 990 30 12
10 AZE AZE015 AzGR-9934 Absheron-3 AZE 999 30 12
11 AZE AZE015 AzGR-4679 Yablinka rozi UKR 500 40 12
12 AZE AZE015 AzGR-4677 Fakel RUS 500 40 12
13 AZE AZE015 AzGR-3893 Zarrabi AZE 500 40 12

S. SHARIFOVA et al. ISSR DNA MARKER DIVERSITY OF TOMATO 33
14 AZE AZE015 AzGR-3968 Garatag AZE 300 40 12
15 AZE AZE015 AzGR-9937 Absheron-1 AZE 999 30 12
16 AZE AZE015 AzGR-9936 Absheron-2 AZE 999 30 12
17 AZE AZE015 AzGR-8636 Sabirabad AZE 999 30 12
18 AZE AZE015 AzGR-10840 AG-2695 AZE 999 23 12
19 AZE AZE015 AzGR-11333 Azerbaijan-94 AZE 500 40 12
20 AZE AZE015 nAzGR Khachmaz-1 AZE 999 23 -
21 AZE AZE015 nAzGR Khachmaz-2 AZE 999 23 -
22 AZE AZE015 AzGR-7652 AG-1223 AZE 999 30 12
23 AZE AZE015 AzGR-9931 Severyanka RUS 500 40 12
24 AZE AZE015 AzGR-8159 Vkusniy-3 RUS 500 40 12
25 AZE AZE015 AzGR-9935 Charodey RUS 500 40 12
26 AZE AZE015 AzGR-8628 Gurman AZE 500 40 12
27 AZE AZE015 AzGR-3889 Volgograd 5/95 RUS 500 40 12
28 AZE AZE015 AzGR-9929 Evgeniya RUS 500 40 12
29 AZE AZE015 nAzGR Gronastiy POL 999 23 -
30 AZE AZE015 AzGR-9928 Chernomor RUS 500 40 12
31 AZE AZE015 AzGR-8631 Leningradskiy
krupniy rozoviy
RUS 500 40 12
32 AZE AZE015 AzGR-8157 Ronita FRA 500 40 12
33 AZE AZE015 AzGR-8158 Podarok KGZ 500 40 12
34 AZE AZE015 AzGR-8632 Tigris RUS 500 40 12
35 AZE AZE015 AzGR-8633 Banan krasniy RUS 500 40 12
36 AZE AZE015 AzGR-8634 Neoskiy RUS 500 40 12
37 AZE AZE015 nAzGR Orange POL 999 23 -
38 AZE AZE015 nAzGR Cherry POL 999 23 -
39 AZE AZE015 AzGR-3899 Leyla AZE 500 40 12
40 AZE AZE015 AzGR-3898 Ilkin AZE 500 40 12
41 AZE AZE015 AzGR-3967 Elnur AZE 500 40 12
(The descriptors are numbered according to the FAO/IPGRI multi-crop passport descriptors (http://www.ecpgr.cgiar.org)) 1NI code – National Inventory Code:
* Biol. Stat. (Biological status of accession)
100 - Wild; 300 - Traditional cultivar/landrace; 500 - Advanced/improved cultivar; 999 - (Others): unknown.
**Coll. source (Collecting/acquisition source)
23- Market or shop; 30- Backyard, kitchen or home garden (urban, peri-urban or rural); 40- Institute, Experimental station,
Research organization, Gene bank #Storage
12- Medium term nAzGR- these accessions have not been included gene bank yet.
Genomic DNA was extracted by PureLink DNA purification Kit (InvitrogenTM).
Nanodrop 2000 spectrophotometer was used for checking quality and concentration of isolated
DNA. A total of 11 ISSR primers synthesized by IDT (https://www.idtdna.com) were used for
PCR amplification (Table 2).

34 GENETIKA, Vol. 49, No 1, 31-42, 2017
Table 2. List of ISSR primers used for diversity analysis.
Primers Sequence 5'-3' Tm
UBC 808 (AG)8C 48.8
ISSR 814 (CT)8TG 47.6
UBC 825 (AC)8T 51.4
UBC 834 (AG)8CT 50.6
ISSR 857 (AC)8YT 53.1
UBC 860 (TG)8RA 53.1
HB8 (GA)6GG 41.9
HB9 (GT)6GG 46.6
HB13 (CAC)3GC 44.7
HB14 (CTC)3GC 41.8
HB15 (GTG)3GC 44.0
Amplification reactions were performed in a final volume of 20 µl, containing 1x AMS
PCR Buffer, 1.5 mM MgCl2, 25 mM of each deoxynucleotide (dATP, dTTP, dGTP and dCTP),
0.5 mM of primer, 0.6 units of Taq DNA polymerase enzyme and 50 ng of DNA using a Verity
Thermo Cycler (Applied Biosystem). All of the mentioned reagents for PCR reactions were
obtained from the company of Sinaclon (http://www.sinaclon.com/).
For ISSR amplification, after initial denaturation step for 4 min at 94°C, 38 cycles were
performed each consisting of a denaturation step at 94°C for 1 min, annealing step at primer-
dependent temperatures (5°C below Tm) for 1 min and extension step at 72°C for 2 min followed
by a final extension at 72°C for 7 minutes.
The PCR products were separated by agarose gel electrophoresis using a 1.2% (w/v)
agarose gel in TBE 1X buffer for 1.5 hrs. 100-bp DNA ladder (Sinaclon) was used for
approximate fragment size calculations. Gel stained with ethidium bromide solution, visualized
under UV light and recorded by “Molecular Imager® Gel DocTM XR system (Bio-Rad)”.
The generated DNA bands on agarose gels were analyzed by scoring as present (1) or
absent (0) of each alleles. The genetic similarity was obtained based on Jaccard coefficient using
Past3 statistic program package (HAMMER et al., 2001). Genetic diversity index for each primer
was calculated according to Nei (NEI, 1973).
H =1− ΣPi2
H –genetic diversity index
Pi – frequency of each pattern
RESULTS AND DISCUSSION
Tomato (Solanum lycopersicum L.) is the most important fruit crop in the world, as well as in
Azerbaijan. Tomato plants are grown at all the vegetable producing economical regions of
Azerbaijan (Figure 1). A total of 82 accessions of the cultivated tomato are maintained in the gene
bank of the AGRI. The collections comprised landraces, improved cultivar, breeding materials and
unknown materials that obtained from markets or shops or collected from home-gardens and etc.
Landraces and improved cultivars originated from different countries. Others accessions were
called by the name of those regions that they collected and registered as unknown local
populations in the gene bank, however there was no more information about their true status and
S. SHARIFOVA et al. ISSR DNA MARKER DIVERSITY OF TOMATO 35
origin. Several accessions with the name and origins, but lack of the biological status have bought
from the markets. Although, breeders and researchers have provided descriptions based on
pedigree information and morphological traits for most of local accessions, there is not enough
information about the genetic diversity of whole conserved materials. In addition, only
morphological characterization data does not provide accurate information necessary to distinguish
different genotypes. Therefore, further comprehensive assessment of conserved germplasms at the
molecular level is required. In present study we used ISSR markers for genetic diversity analysis
among 41 cultivated tomato accessions belonging to our germplasm bank.
Figure 1. Main economical regions of Azerbaijan with a grown area of tomatoes (ha) (http://www.stat.gov.az)
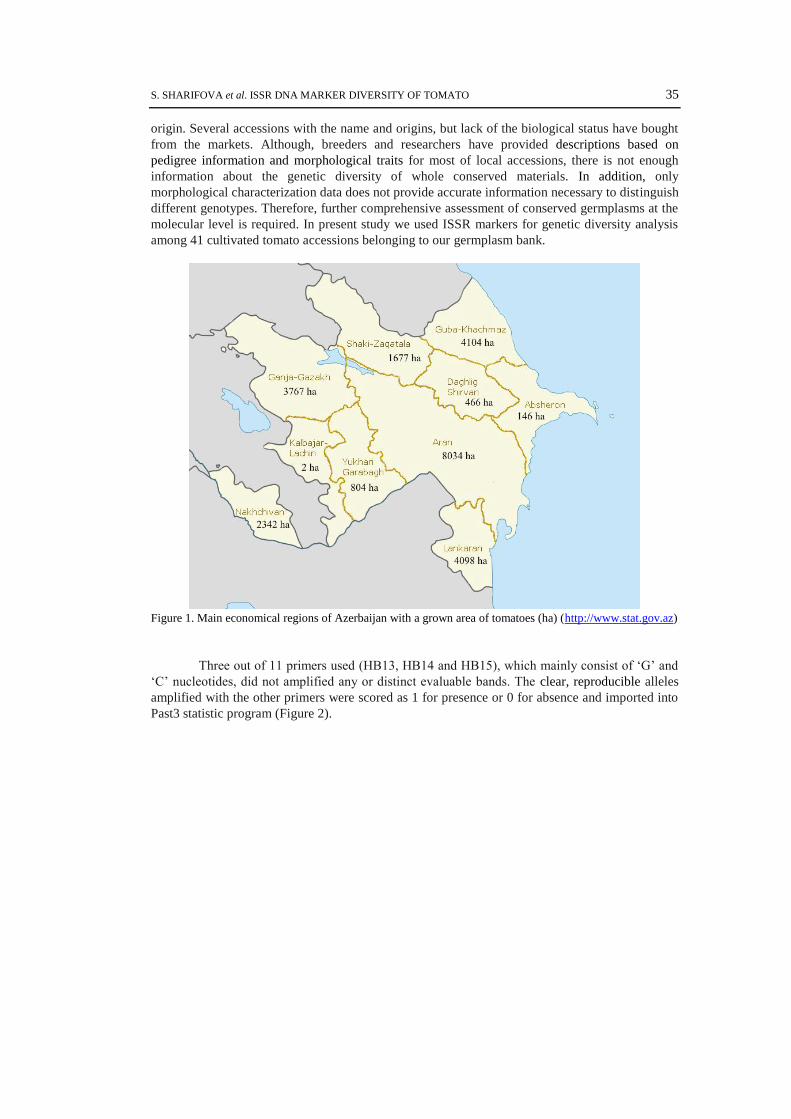
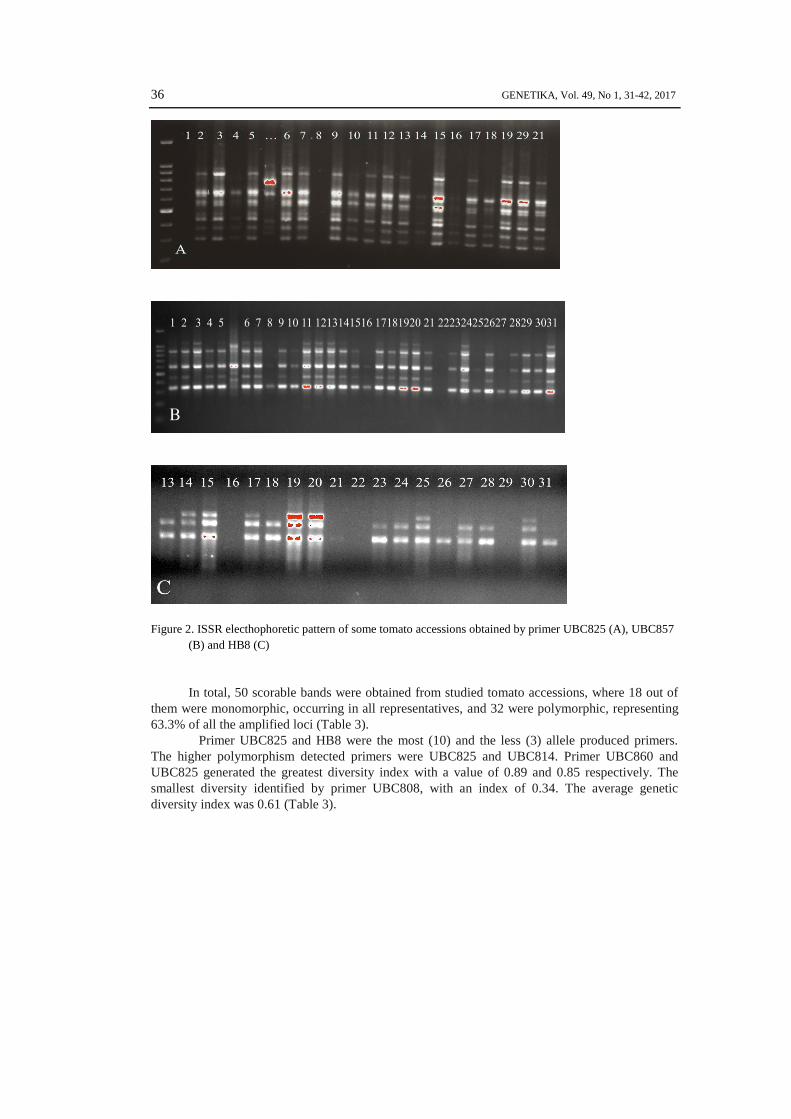
Three out of 11 primers used (HB13, HB14 and HB15), which mainly consist of ‘G’ and
‘C’ nucleotides, did not amplified any or distinct evaluable bands. The clear, reproducible alleles
amplified with the other primers were scored as 1 for presence or 0 for absence and imported into
Past3 statistic program (Figure 2).
36 GENETIKA, Vol. 49, No 1, 31-42, 2017
Figure 2. ISSR electhophoretic pattern of some tomato accessions obtained by primer UBC825 (A), UBC857
(B) and HB8 (C)
In total, 50 scorable bands were obtained from studied tomato accessions, where 18 out of
them were monomorphic, occurring in all representatives, and 32 were polymorphic, representing
63.3% of all the amplified loci (Table 3).
Primer UBC825 and HB8 were the most (10) and the less (3) allele produced primers.
The higher polymorphism detected primers were UBC825 and UBC814. Primer UBC860 and
UBC825 generated the greatest diversity index with a value of 0.89 and 0.85 respectively. The
smallest diversity identified by primer UBC808, with an index of 0.34. The average genetic
diversity index was 0.61 (Table 3).

S. SHARIFOVA et al. ISSR DNA MARKER DIVERSITY OF TOMATO 37
Table 3. Polymorphism and genetic diversity index exhibited by ISSR primers in tomato
Primers Sequence (5'-3') Number
of
alleles
Number of
polymorphic
alleles
Polymorphism
percentage (%)
Genetic
diversity
index
UBC 808 (AGAGAC)2AGA GC 4 2 50 0.34
ISSR 814 (CT)8TG 7 6 86 0.58
UBC 825 (ACACAC)2ACA CT 10 7 70 0.85
UBC 834 (AGAGAG)2AGA GYT 6 3 50 0.50
ISSR 857 (AC)8YT 6 4 67 0.71
UBC 860 (TGTGTG)2TGT GRA 9 5 56 0.89
ISSR HB8 (GA)6GG 3 2 67 0.50
ISSR HB9 (GT)6GG 5 3 60 0.52
Average 6.25 4.0 63.25 0.61
Experimental studies revealed different level of polymorphism for ISSR primers and
tomato genotypes. For instance, SHAHLAEI and colleagues (2014) have used 10 ISSR primers for
genetic diversity analysis of 10 tomato accessions and observed 86 bands with 20 (23.25%) being
polymorphic where, an average resolving power value of markers was 1.55. Mansour and
colleagues (MANSOUR et al., 2010) reported high polymorphism in ISSR analysis (100%). In other
research, the high level of polymorphism of 62% and an average number of polymorphic bands of
3.5 per primer were observed (EDRIS et al., 2014). Contrary, low level of polymorphism (34%) in
ISSR analysis of Brazilian tomato cultivars was reported (AGUILERA et al., 2011). ISSR markers
were used for genetic assessment of Greek tomato accessions and proved to be useful in describing
genetic diversity among Greek landraces (TERZOPOULOS and BEBELI, 2008).
In our study polymorphism percentage ranged from 50 to 90% and an average number of
polymorphic bands of 4.0 per primer were observed, which is high enough.
The similarity coefficient based on ISSR markers used ranged from 0.52 to 0.98 in our
research. According to Jaccard`s similarity index, the lowest genetic distance was found between
‘AG1224’ and ‘Gronastiy’ (0.52), ‘Orange’ and ‘AG1224’ (0.54), ‘Evgeniya’ and ‘AG1224’
(0.55), ‘Vkusniy 3’ and ‘AG2695’ (0.57), and ‘Gronastiy’ and ‘Yablinka rozi’ (0.57) accessions.
As it is shown by the dendrogram, one of the accessions of each pairs, except the last one, is local
unknown population, whereas other belongs to introduced materials. The last pairs include two
accessions form Ukraine and Poland.
Among several accessions studied the higher degree of similarity were found. The highest
similarity of 0.98 was determined between ‘Zafar’ and ‘Azerbaijan-94’, ‘Khachmaz-1’ and
‘Azerbaijan-94’, ‘Khachmaz-1’ and ‘Severyanka’, and ‘Shakar’ and ‘Absheron-1’. The value of
similarity was equal to 0.95 for ‘Azerbaijan-94’ and ‘Severyanka’ genotypes. This can be
explained by narrow genetic differences between those accessions.
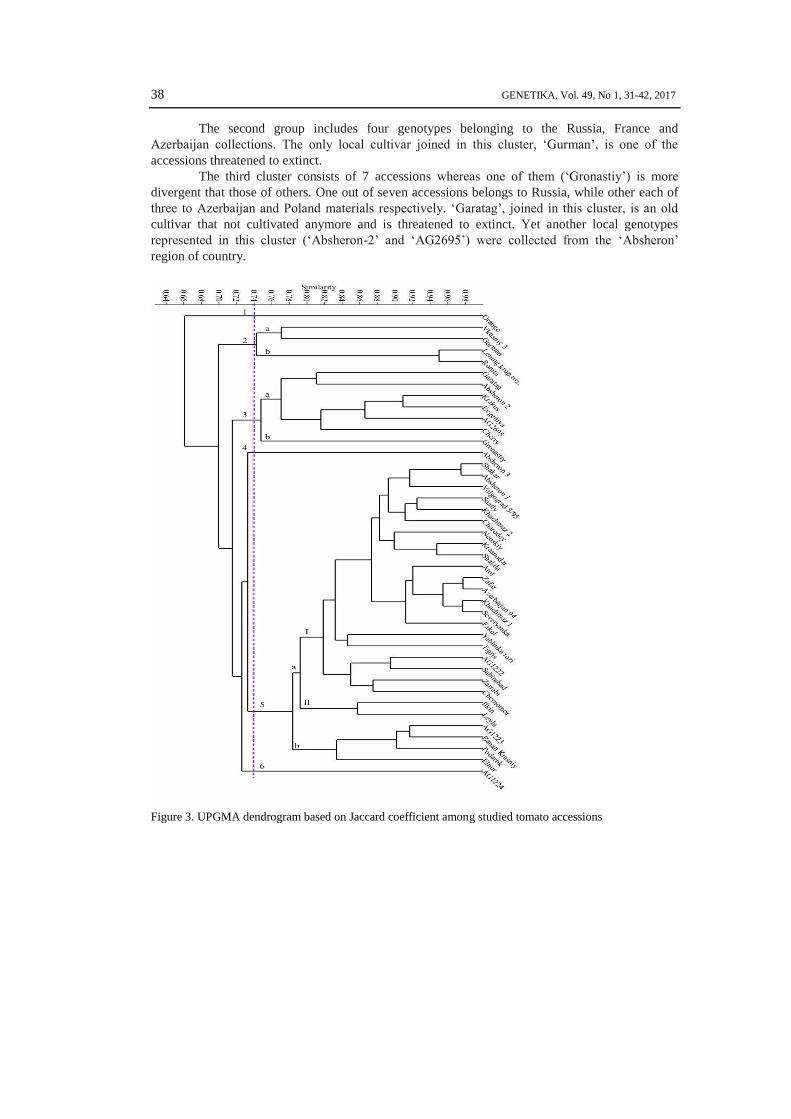
A dendrogram was generated based on UPGMA analysis, using Jaccard similarity
coefficients that can be divided into 6 distinct clusters on a value of 0.74 (Figure 3). The first,
fourth and the sixth clusters consisted of only one accession each. The only accession of the cluster
1, ‘Orange’ from Poland, was the most divergent among the other accessions. Accessions,
belonged to other two above-mentioned clusters, ‘Absheron 3’ and ‘AG1224’, were the accessions
with an unknown status.
38 GENETIKA, Vol. 49, No 1, 31-42, 2017
The second group includes four genotypes belonging to the Russia, France and
Azerbaijan collections. The only local cultivar joined in this cluster, ‘Gurman’, is one of the
accessions threatened to extinct.
The third cluster consists of 7 accessions whereas one of them (‘Gronastiy’) is more
divergent that those of others. One out of seven accessions belongs to Russia, while other each of
three to Azerbaijan and Poland materials respectively. ‘Garatag’, joined in this cluster, is an old
cultivar that not cultivated anymore and is threatened to extinct. Yet another local genotypes
represented in this cluster (‘Absheron-2’ and ‘AG2695’) were collected from the ‘Absheron’
region of country.
Figure 3. UPGMA dendrogram based on Jaccard coefficient among studied tomato accessions
S. SHARIFOVA et al. ISSR DNA MARKER DIVERSITY OF TOMATO 39
The fifth cluster was the most abundant and contained all other 27 studied accessions.
This cluster divided in detail into two sub-clusters, where the most representative sub-cluster ‘a’
was further separated into two groups. Sub-cluster ‘b’ contains four assorted accessions of several
countries. 11 accessions of main I group of sub-cluster ‘a’ are local materials, 8 belongs to Russian
materials, and two, one from Poland and another from Ukraine. II group of sub-cluster ‘a’
consists of two advanced cultivars from same breeder in Azerbaijan.
Local tomato accessions joined in fifth cluster are grown nearly at all the regions of
country (Figure 1). ‘Shalala’ is only greenhouse tomato cultivars among studied local accessions.
‘Shakar’, ‘Zafar’ and ‘Elnur’ cultivars are cultivated at the Lankaran and Guba-Khachmaz region.
‘Leyla’ and ‘Zarrabi’ are mainly grown at the Lankaran region. ‘Azerbaijan-94’ is a new released
cultivar that grown at the Ganja-Gazakh region, whereas ‘Ilkin’ can be found in all the vegetable
producing regions (SHARIFOVA et al., 2013). Concerning the local populations of mentioned
cluster, two were from Guba-Khachmaz (‘Khachmaz-1’ and ‘Khachmaz-2’), two from Aran
(‘Saatly’ and ‘Sabirabad’) and two from Absheron (‘Absheron-1’ and ‘Absheron-3’) regions
respectively, whereas other two (‘AG1222’ and ‘AG1223’) were totally unknown populations.
Thus, all main clusters includes accessions originated from different countries. Hence,
there was a tendency of together clustering for accessions from the same or adjacent geographic
origin, the accessions collected or originated from different geographic regions were also found
placed into the same cluster, or from same geographic area placed into different clusters. This
indicates that, the geographical origin of accessions has no influence on the clusters obtained. Such
results were also obtained in a number of studies and explained that the accessions from different
regions might have similar genetic background and those from the same origin might also have
different genetic background (KENENI et al., 2005; GASHAW et al., 2007; CELKA et al., 2010;
SHARIFOVA et al., 2013). All those results suggested that selection of parent genotypes based on
geographical origin only was not an accurate indicator of genetic diversity.
Consequently, although data obtained in our research were efficient for the discrimination
of genetic distance among genotypes, an accurate selection of parental genotypes based on more
detailed study of genetic diversity should be considered for successful breeding programmes.
Nevertheless, to distinguish the accessions with unknown origin and biological status, further
comprehensive assessment using of different types and more polymorphic molecular markers
could be necessary.
Received January 27th, 2016
Accepted September 22th, 2016
REFERENCES
AGUILERA, J.G., L.A. PESSONI, G.B. RODRIGUES, A.Y. ELSAYED, D. J. DA SILVA, E.G. DE BARROS (2011): Genetic variability by
ISSR markers in tomato (Solanum lycopersicon Mill.). Brazilian Journal of Agricultural Sciences/Revista
Brasileira de Ciências Agrárias, 6(2): 243-252.
ALVAREZ, A., C. VAN DE WIEL, M.SMULDERS, B. VOSMAN (2001): Use of microsatellites to evaluate genetic diversity and
species relationships in the genus Lycopersicon. Theoretical and Applied Genetics, 103(8): 1283-1292.
ARCHAK, S., J.L. KARIHALOO, A. JAIN (2002): RAPD markers reveal narrowing genetic base of Indian tomato. Current
Science, 82(9): 1139-1143.
BOJINOV, B.M., Z.P. DANAILOV (2008): Applicability of ISSRs for genotype identification in a tomato breeding collection. In
IV Balkan Symposium on Vegetables and Potatoes, 830: 63-70.

40 GENETIKA, Vol. 49, No 1, 31-42, 2017
CELKA, Z., K. BUCZKOWSKA, A. BĄCZKIEWICZ, M. DRAPIKOWSKA (2010): Genetic differentiation among geographically
close populations of Malva alcea. Acta Biologica Cracoviensia Series Botanica, 52(2): 32-41.
EDRIS, S., S. ABO-ABA, M.M. ALGANDABY, A.M. RAMADAN, N.O. GADALLA, M.A. AL-KORDY, J.S. SABIR, F.M. EL-DOMYATI,
A.M. ALZOHAIRY, A. BAHIELDIN (2014): Molecular characterization of tomato cultivars grown in Saudi Arabia and
differing in earliness of fruit development as revealed by AFLP and ISSR. Life Science Journal, 11: 602-612.
ELHAM A.A., E.A.A. EL-HADY, A.A. HAIBA, N.R.A. EL-HAMID, A.A. RIZKALLA (2010): Phylogenetic diversity and relationships
of some tomato varieties by electrophoretic protein and RAPD analysis. Journal of American Science, 6(11): 434-
441.
FOOLAD, M.R. (2007): Genome mapping and molecular breeding of tomato. International Journal of Plant Genomics, 52p.
FRARY, A., Y. XU, J. LIU, S. MITCHELL, E. TEDESCHI, S. TANKSLEY (2005): Development of a set of PCR-based anchor
markers encompassing the tomato genome and evaluation of their usefulness for genetics and breeding
experiments. Theoretical and Applied Genetics, 111(2): 291-312.
GASHAW, A., H. MOHAMMED, H. SINGH (2007): Genetic divergence in selected durum wheat genotypes of Ethiopian plasm.
African Crop Science Journal, 15(2): 67-72.
HAMMER, O., D.A.T. HARPER, P.D. RYAN (2001): PAST: Paleontological statistics software package for education and data
analysis. Palaeontologia Electronica, 4(1): 9pp.
HAVLÍČKOVÁ, L., E. JOZOVÁ, A. RYCHLÁ, M. KLIMA, V. KUČERA, V. ČURN (2014): Genetic diversity assessment in winter
oilseed rape (Brassica napus L.) collection using AFLP, ISSR and SSR markers. Czech Journal of Genetics and
Plant Breeding, 50(3): 216-225.
HE, C., V. POYSA, K. YU (2003): Development and characterization of simple sequence repeat (SSR) markers and their use in
determining relationship among Lycopersicon esculentum cultivars. Theor. Appl. Genet., 106: 363–373.
ISSHIKI, S., N. IWATA, M.M.R. KHAN (2008): ISSR variations in eggplant (Solanum melongena L.) and related Solanum
species. Scientia Horticulturae, 117(3): 186-190.
KENENI, G., M. JARSO, T. WOLABU, G. DINO (2005): Extent and pattern of genetic diversity for morpho-agronomic traits in
Ethiopian highland pulse landraces II. Faba bean (Vicia faba L.). Genetic Resources and Crop Evolution, 52(5):
551-561.
KOCHIEVA, E.Z., N.N. RYZHOVA, I.A. KHRAPALOVA, V.A. PUKHALSKYI (2002): Genetic diversity and phylogenetic
relationships in the genus Lycopersicon (Tourn.) Mill. as revealed by inter-simple sequence repeat (ISSR)
analysis. Russian Journal of Genetics, 38(8): 958-966.
MANSOUR, A., J. TEIXEIRA DA SILVA, S. EDRIS, R.A. YOUNIS (2010): Comparative assessment of genetic diversity in tomato
cultivars using IRAP, ISSR and RAPD molecular markers. Focus on Tree Genetics and Genomics. Genes,
Genomes and Genomics, 4: 41-47.
MILLER, J.C., S.D. TANKSLEY (1990): RFLP analysis of phylogenetic relationships and genetic variation in the genus
Lycopersicon. Theoretical and applied genetics, 80(4): 437-448.
NEI, M. (1973): Analysis of gene diversity in subdivided population. Proceed. Natl. Acad. Sci. USA. 70: 3321-3323.
PARK, Y.H., M.A. WEST, D.A. ST. CLAIR (2004): Evaluation of AFLPs for germplasm fingerprinting and assessment of
genetic diversity in cultivars of tomato (Lycopersicon esculentum L.). Genome, 47(3): 510-518.
REDDY, M.P., N. SARLA, E.A. SIDDIQ (2002): Inter simple sequence repeat (ISSR) polymorphism and its application in plant
breeding. Euphytica, 128(1): 9-17.
RUIZ, J.J., S. GARCÍA-MARTÍNEZ, B.PICÓ, M. GAO, C.F. QUIROS (2005): Genetic variability and relationship of closely related
Spanish traditional cultivars of tomato as detected by SRAP and SSR markers. Journal of the American Society for
Horticultural Science, 130(1): 88-94.
SCHLÖTTERER, C. (2004): The evolution of molecular markers – just a matter of fashion? Nature Reviews Genetics, 5: 63–
69.

S. SHARIFOVA et al. ISSR DNA MARKER DIVERSITY OF TOMATO 41
SEMAGN, K., Å. BJØRNSTAD, M.N. NDJIONDJOP (2006): An overview of molecular marker methods for plants. African
Journal of Biotechnology, 5(25): 2540-2568.
SHAHLAEI, A., S. TORAB, M. KHOSROSHAHLI (2014): Efficiacy of SCoT and ISSR marekers in assesment of tomato
(Lycopersicum esculentum Mill.) genetic diversity. International Journal of Biosciences, 5(2): 14-22.
SHARIFOVA, S., S. MEHDIYEVA, K. THEODORIKAS, K. ROUBOS (2013): Assessment of Genetic Diversity in Cultivated Tomato
(Solanum lycopersicum L.) Genotypes Using RAPD Primers. Journal of Horticultural Research, 21(1): 83-89.
TERZOPOULOS, P., P. BEBELI (2008): DNA and morphological diversity of selected Greek tomato (Solanum lycopersicum
L.) landraces. Scientia horticulturae, 116(4): 354-361.
TIKUNOV, Y.M., L. KHRUSTALEVA, G. KARLOV (2003): Application of ISSR markers in the genus Lycopersicon. Euphytica,
131(1): 71-81.
42 GENETIKA, Vol. 49, No 1, 31-42, 2017
ANALIZA GENETIČKOG DIVERZITETA RAZLIČITIH GENOTIPA PARADAJZA
POMOĆU ISSR DNK MARKERA
Saida S. SHARIFOVA, Sabina P. MEHDIYEVA, Mehraj A. ABBASOV
Institut za genetičke resurse Azerbedžijan Nacionlne Akademije nauka,
AZ1106, Baku, Azerbedžijan
Izvod ISSR marker su korišćeni za analizu variranja između 41 genotipa pradajza. Ukupno 50 traka je
dobijeno, gde su 32 bile polimorfne, što predstavlja 63.3% ukupno amplifikovnih lokusa. Procenat
polimorfizma varira između 50 do 90% a prosečan broj polimorfnih traka je 4.0. Prosečan indeks
genetičkog diverziteta je 0.61. Prajmeri UBC860 i UBC825 generišu najveći indeks diverziteta sa
vrednostima 0.89 I 0.85. Namanji diverzitet je identifikovan prajmerom UBC808, sa indeksom
0.34. Genetička sličnost između ispitivnaih genotipova varira od 0.52 do 0.98. Klaster analiza na
osnosu Jacardovog koeficijenta grupiše genotipove u 6 klastera na vrednosti 0.74. Najniža
genetička distance je dobijena između “Gronastiy” i “AG1224” (0.52), “Orange” i “AG1224”
(0.54), i “Evgeniya” i “AG1224” (0.55). Najveća sličnost od 0.98 je dobijena između “Zafar” i
“Azerbaijan-94”, “Khachmaz-1” i “Azerbaijan-94”, “Khachmaz-1” i “Severyanka”, i “Shakar” i
“Absheron-1” genotipova.
. Primljeno 27. I. 2016.
Odobreno 22. IX 2016.