Embed Size (px)
Citation preview
Analysis of Freight Rail Rates for U.S. Shippers
Prepared for American Chemistry Council
By Escalation Consultants, Inc.
March 2014
4 Professional Drive Ste. 129
Gaithersburg, MD 20879 (301)977-7459 EscalationConsultants.com
2
Analysis of Freight Rail Rates for U.S. Shippers
Methodology
For this study, Escalation Consultants examined Class I railroad rate data from the Surface
Transportation Board’s (STB) Public Use Waybill sample for all major commodity groups shipped by rail.
Data was analyzed for 2011, the most recent year available from STB, and for 2005. Escalation
Consultants calculated the railroad’s revenue-to-variable-cost ratio (RVC) for each shipment that
originated or terminated in the U.S. RVC is an important indicator for freight rail rates because a rate
greater than 180% RVC is subject to potential STB review for being unreasonably high.
For each group of related commodities, Escalation Consultants calculated the average rate for
shipments below 180% RVC (those assumed to be competitive) and the average rate for shipments
above 180% RVC (those potentially non-competitive and subject to STB jurisdiction). The difference
between these average rates is presented as the shipper’s rate ‘premium.’ Escalation Consultants
further broke down the potentially non-competitive rates by RVC ranges (180-240%, 240-300% and
above 300%) to show the impact of the highest rates on the total premium. Data are reported for all
commodities combined, as well as for major commodity groups (2-digit Standard Transportation
Commodity Code (STCC)) and individual products (5-digit STCC) within each group for traffic originating
in different geographic regions.
Further details on the methodology and the breakdown by geographic region are provided in the
appendix.
Key Findings
These findings are based on the Public Use Waybill sample provided by the railroads to the STB:
In 2011, more than half (57 percent) of all rail rates exceeded 180% RVC, the threshold for a
potential rate challenge before the STB.
The average rate for carloads above 180% RVC was $1,335 higher than the average rate for carloads
below 180% RVC, meaning that shippers paid a 53% premium for these shipments.
As a result, the total rate premium paid by commodity shippers in 2011 exceeded $16 billion.
The commodity groups with the largest total rate premiums were coal ($5.2 billion), chemicals and
plastics ($4.5 billion) and transportation equipment ($1.2 billion).
3
Many rates were far above the STB’s jurisdictional threshold of 180% RVC; for example, nearly one
quarter (23 percent) of rates exceeded 300% RVC, or three times the railroad’s variable cost.
From 2005 to 2011, the total rate premium paid by commodity shippers increased 90% while the
carload volume declined by 1.1%
Background: Current Landscape and Summary of Existing Rail Rate Data
American manufacturers rely on the nation’s freight railroads to move many of their products to their
customers. These materials and products serve as the foundation for the U.S. economy and ultimately
wind up in grocery stores, car dealerships, power plants, and people’s homes.
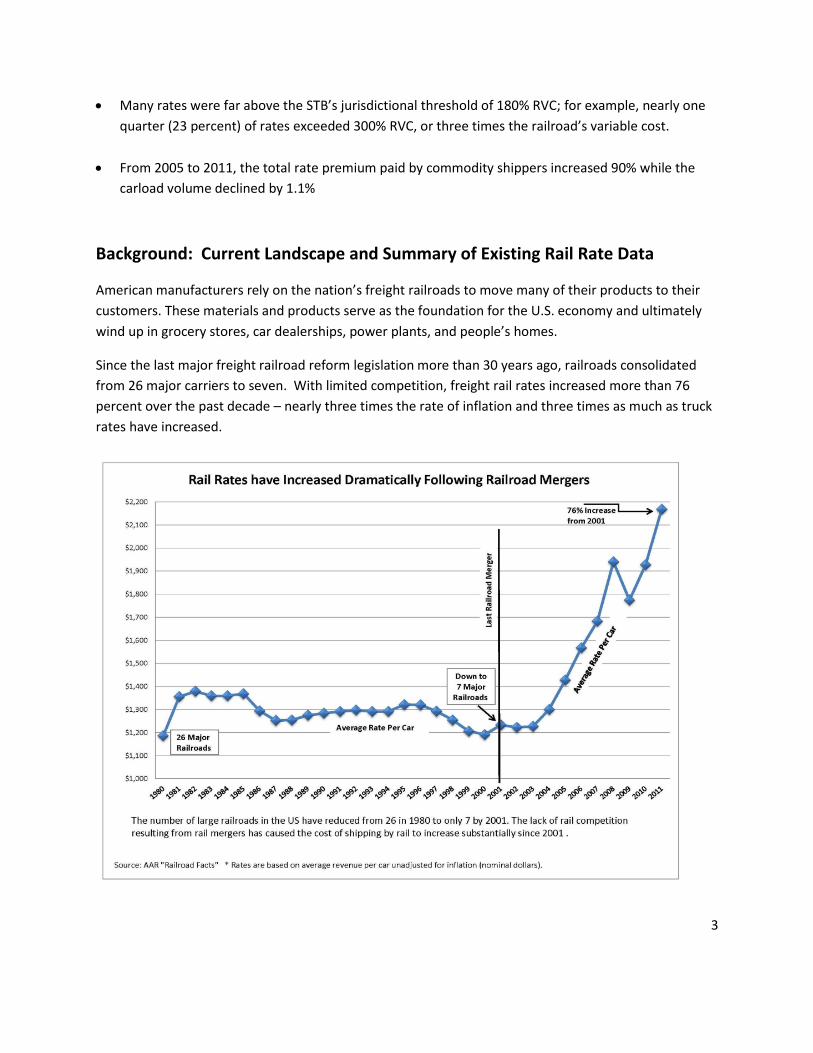
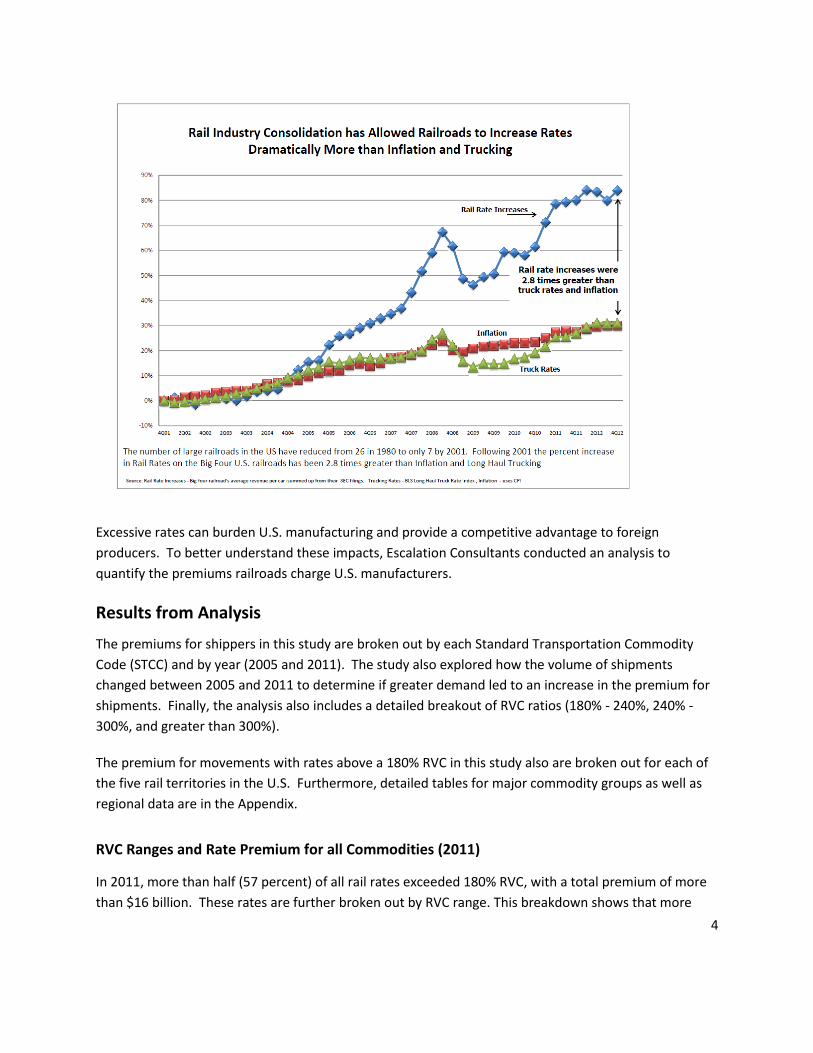
Since the last major freight railroad reform legislation more than 30 years ago, railroads consolidated
from 26 major carriers to seven. With limited competition, freight rail rates increased more than 76
percent over the past decade – nearly three times the rate of inflation and three times as much as truck
rates have increased.
4
Excessive rates can burden U.S. manufacturing and provide a competitive advantage to foreign
producers. To better understand these impacts, Escalation Consultants conducted an analysis to
quantify the premiums railroads charge U.S. manufacturers.
Results from Analysis
The premiums for shippers in this study are broken out by each Standard Transportation Commodity
Code (STCC) and by year (2005 and 2011). The study also explored how the volume of shipments
changed between 2005 and 2011 to determine if greater demand led to an increase in the premium for
shipments. Finally, the analysis also includes a detailed breakout of RVC ratios (180% - 240%, 240% -
300%, and greater than 300%).
The premium for movements with rates above a 180% RVC in this study also are broken out for each of
the five rail territories in the U.S. Furthermore, detailed tables for major commodity groups as well as
regional data are in the Appendix.
RVC Ranges and Rate Premium for all Commodities (2011)
In 2011, more than half (57 percent) of all rail rates exceeded 180% RVC, with a total premium of more
than $16 billion. These rates are further broken out by RVC range. This breakdown shows that more
5
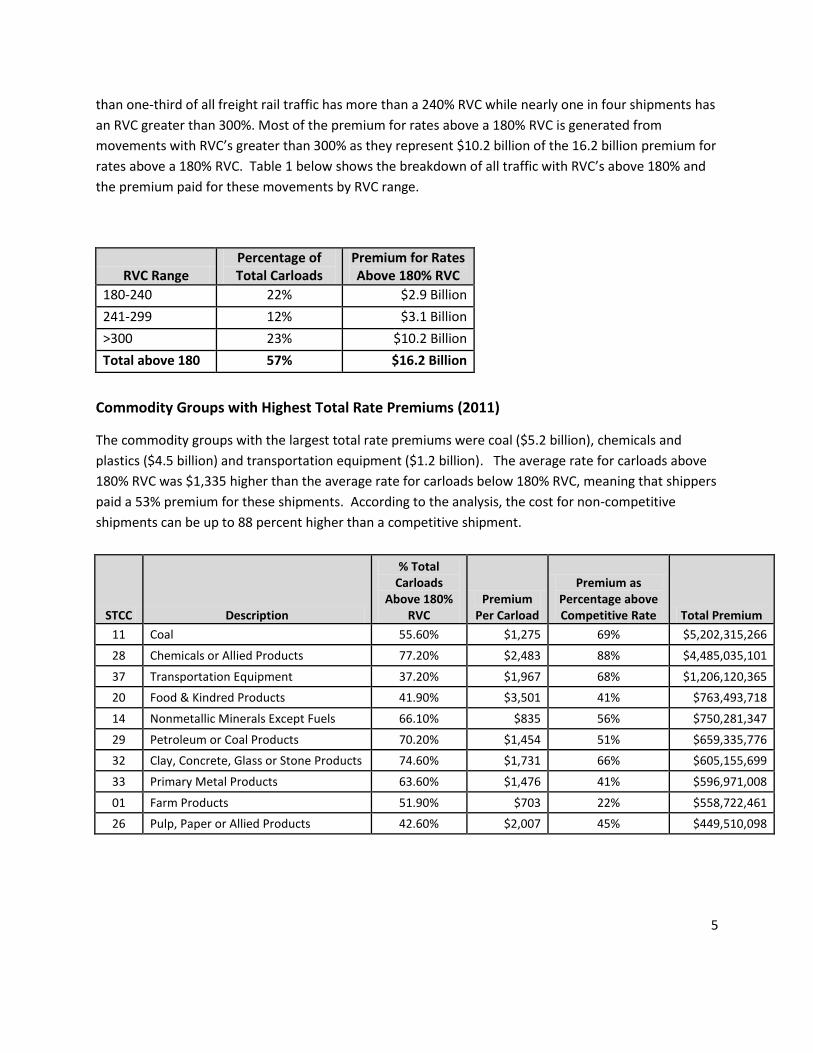
than one-third of all freight rail traffic has more than a 240% RVC while nearly one in four shipments has
an RVC greater than 300%. Most of the premium for rates above a 180% RVC is generated from
movements with RVC’s greater than 300% as they represent $10.2 billion of the 16.2 billion premium for
rates above a 180% RVC. Table 1 below shows the breakdown of all traffic with RVC’s above 180% and
the premium paid for these movements by RVC range.
RVC Range Percentage of Total Carloads
Premium for Rates Above 180% RVC
180-240 22% $2.9 Billion
241-299 12% $3.1 Billion
>300 23% $10.2 Billion
Total above 180 57% $16.2 Billion
Commodity Groups with Highest Total Rate Premiums (2011)
The commodity groups with the largest total rate premiums were coal ($5.2 billion), chemicals and
plastics ($4.5 billion) and transportation equipment ($1.2 billion). The average rate for carloads above
180% RVC was $1,335 higher than the average rate for carloads below 180% RVC, meaning that shippers
paid a 53% premium for these shipments. According to the analysis, the cost for non-competitive
shipments can be up to 88 percent higher than a competitive shipment.
STCC Description
% Total Carloads
Above 180% RVC
Premium Per Carload
Premium as Percentage above Competitive Rate Total Premium
11 Coal 55.60% $1,275 69% $5,202,315,266
28 Chemicals or Allied Products 77.20% $2,483 88% $4,485,035,101
37 Transportation Equipment 37.20% $1,967 68% $1,206,120,365
20 Food & Kindred Products 41.90% $3,501 41% $763,493,718
14 Nonmetallic Minerals Except Fuels 66.10% $835 56% $750,281,347
29 Petroleum or Coal Products 70.20% $1,454 51% $659,335,776
32 Clay, Concrete, Glass or Stone Products 74.60% $1,731 66% $605,155,699
33 Primary Metal Products 63.60% $1,476 41% $596,971,008
01 Farm Products 51.90% $703 22% $558,722,461
26 Pulp, Paper or Allied Products 42.60% $2,007 45% $449,510,098
6
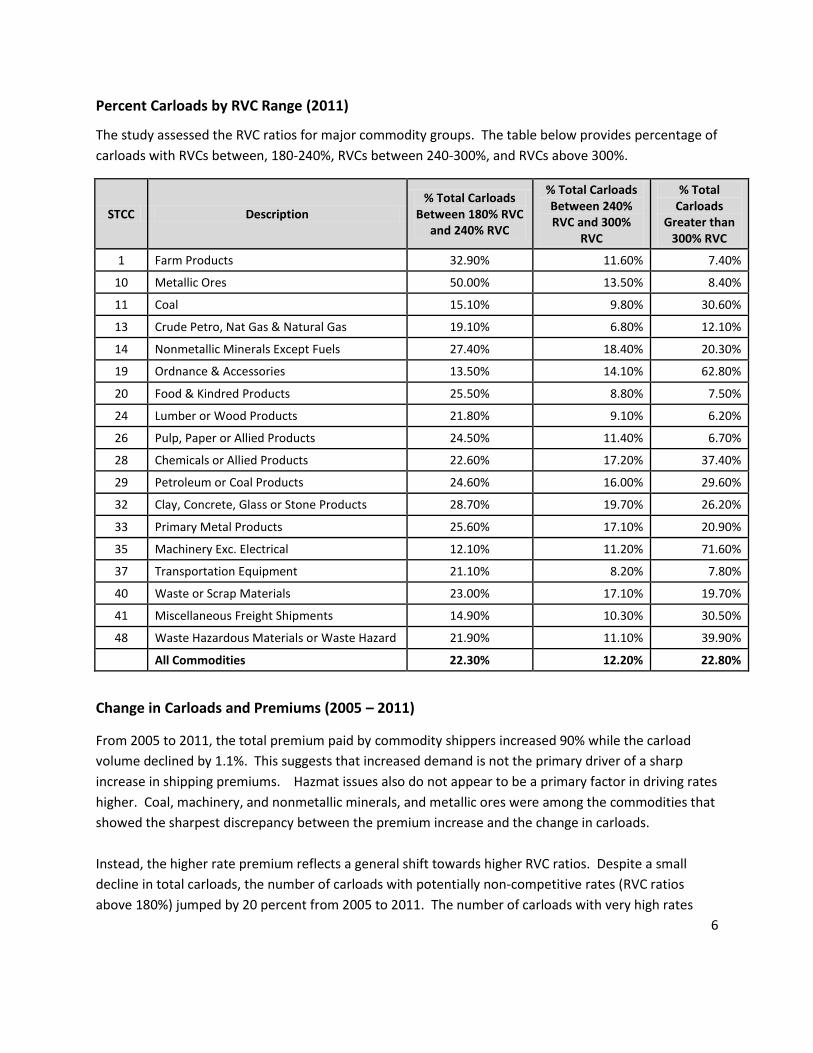
Percent Carloads by RVC Range (2011)
The study assessed the RVC ratios for major commodity groups. The table below provides percentage of
carloads with RVCs between, 180-240%, RVCs between 240-300%, and RVCs above 300%.
STCC Description % Total Carloads
Between 180% RVC and 240% RVC
% Total Carloads Between 240% RVC and 300%
RVC
% Total Carloads
Greater than 300% RVC
1 Farm Products 32.90% 11.60% 7.40%
10 Metallic Ores 50.00% 13.50% 8.40%
11 Coal 15.10% 9.80% 30.60%
13 Crude Petro, Nat Gas & Natural Gas 19.10% 6.80% 12.10%
14 Nonmetallic Minerals Except Fuels 27.40% 18.40% 20.30%
19 Ordnance & Accessories 13.50% 14.10% 62.80%
20 Food & Kindred Products 25.50% 8.80% 7.50%
24 Lumber or Wood Products 21.80% 9.10% 6.20%
26 Pulp, Paper or Allied Products 24.50% 11.40% 6.70%
28 Chemicals or Allied Products 22.60% 17.20% 37.40%
29 Petroleum or Coal Products 24.60% 16.00% 29.60%
32 Clay, Concrete, Glass or Stone Products 28.70% 19.70% 26.20%
33 Primary Metal Products 25.60% 17.10% 20.90%
35 Machinery Exc. Electrical 12.10% 11.20% 71.60%
37 Transportation Equipment 21.10% 8.20% 7.80%
40 Waste or Scrap Materials 23.00% 17.10% 19.70%
41 Miscellaneous Freight Shipments 14.90% 10.30% 30.50%
48 Waste Hazardous Materials or Waste Hazard 21.90% 11.10% 39.90%
All Commodities 22.30% 12.20% 22.80%
Change in Carloads and Premiums (2005 – 2011)
From 2005 to 2011, the total premium paid by commodity shippers increased 90% while the carload
volume declined by 1.1%. This suggests that increased demand is not the primary driver of a sharp
increase in shipping premiums. Hazmat issues also do not appear to be a primary factor in driving rates
higher. Coal, machinery, and nonmetallic minerals, and metallic ores were among the commodities that
showed the sharpest discrepancy between the premium increase and the change in carloads.
Instead, the higher rate premium reflects a general shift towards higher RVC ratios. Despite a small
decline in total carloads, the number of carloads with potentially non-competitive rates (RVC ratios
above 180%) jumped by 20 percent from 2005 to 2011. The number of carloads with very high rates
7
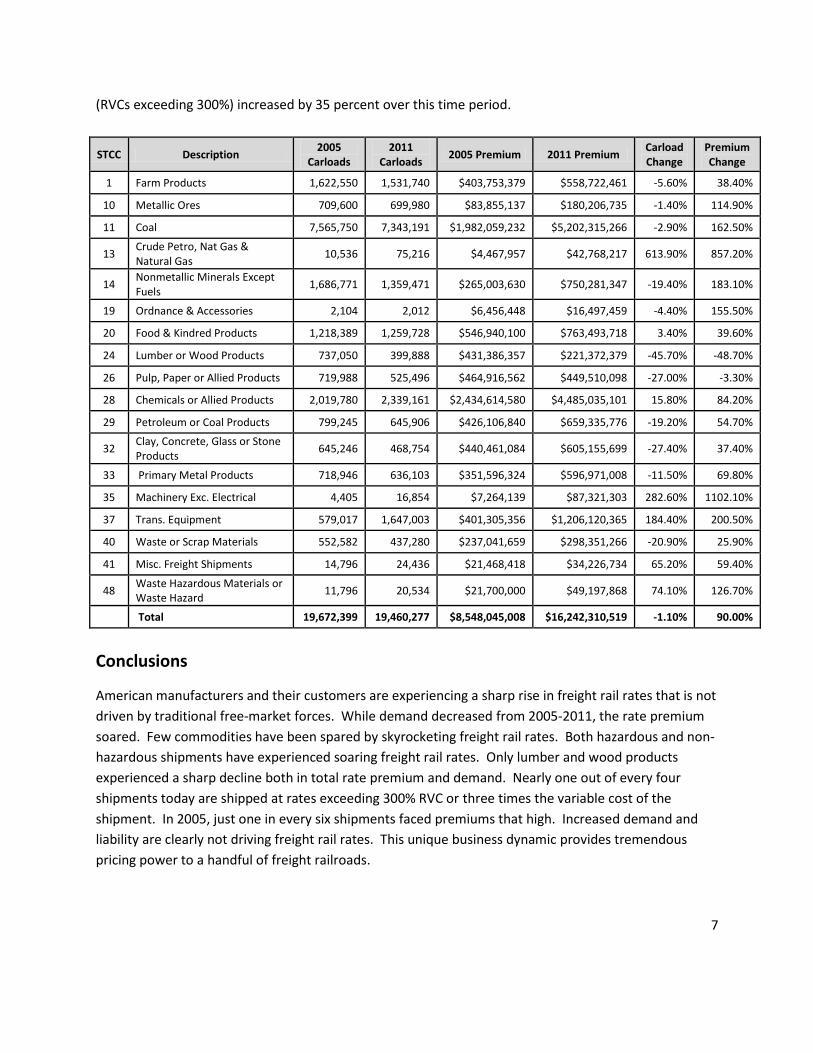
(RVCs exceeding 300%) increased by 35 percent over this time period.
STCC Description 2005
Carloads 2011
Carloads 2005 Premium 2011 Premium
Carload Change
Premium Change
1 Farm Products 1,622,550 1,531,740 $403,753,379 $558,722,461 -5.60% 38.40%
10 Metallic Ores 709,600 699,980 $83,855,137 $180,206,735 -1.40% 114.90%
11 Coal 7,565,750 7,343,191 $1,982,059,232 $5,202,315,266 -2.90% 162.50%
13 Crude Petro, Nat Gas & Natural Gas
10,536 75,216 $4,467,957 $42,768,217 613.90% 857.20%
14 Nonmetallic Minerals Except Fuels
1,686,771 1,359,471 $265,003,630 $750,281,347 -19.40% 183.10%
19 Ordnance & Accessories 2,104 2,012 $6,456,448 $16,497,459 -4.40% 155.50%
20 Food & Kindred Products 1,218,389 1,259,728 $546,940,100 $763,493,718 3.40% 39.60%
24 Lumber or Wood Products 737,050 399,888 $431,386,357 $221,372,379 -45.70% -48.70%
26 Pulp, Paper or Allied Products 719,988 525,496 $464,916,562 $449,510,098 -27.00% -3.30%
28 Chemicals or Allied Products 2,019,780 2,339,161 $2,434,614,580 $4,485,035,101 15.80% 84.20%
29 Petroleum or Coal Products 799,245 645,906 $426,106,840 $659,335,776 -19.20% 54.70%
32 Clay, Concrete, Glass or Stone Products
645,246 468,754 $440,461,084 $605,155,699 -27.40% 37.40%
33 Primary Metal Products 718,946 636,103 $351,596,324 $596,971,008 -11.50% 69.80%
35 Machinery Exc. Electrical 4,405 16,854 $7,264,139 $87,321,303 282.60% 1102.10%
37 Trans. Equipment 579,017 1,647,003 $401,305,356 $1,206,120,365 184.40% 200.50%
40 Waste or Scrap Materials 552,582 437,280 $237,041,659 $298,351,266 -20.90% 25.90%
41 Misc. Freight Shipments 14,796 24,436 $21,468,418 $34,226,734 65.20% 59.40%
48 Waste Hazardous Materials or Waste Hazard
11,796 20,534 $21,700,000 $49,197,868 74.10% 126.70%
Total 19,672,399 19,460,277 $8,548,045,008 $16,242,310,519 -1.10% 90.00%
Conclusions
American manufacturers and their customers are experiencing a sharp rise in freight rail rates that is not
driven by traditional free-market forces. While demand decreased from 2005-2011, the rate premium
soared. Few commodities have been spared by skyrocketing freight rail rates. Both hazardous and non-
hazardous shipments have experienced soaring freight rail rates. Only lumber and wood products
experienced a sharp decline both in total rate premium and demand. Nearly one out of every four
shipments today are shipped at rates exceeding 300% RVC or three times the variable cost of the
shipment. In 2005, just one in every six shipments faced premiums that high. Increased demand and
liability are clearly not driving freight rail rates. This unique business dynamic provides tremendous
pricing power to a handful of freight railroads.
8
Appendix
Methodology for Calculating the Shipper’s Rail Rate Premium
The 2011 Public Use Waybill Sample (Sample) was used to calculate the premium paid by shippers to
railroads for moving their freight. The Sample represents 100% of all rail shipments that originate or
terminate in the U.S. The Sample is a collection of railroad waybill records submitted by railroads to the
Surface Transportation Board (STB); it is roughly a 3% sample of all rail movements which is then
expanded to represent 100% of all rail traffic. The 2011 Sample consists of 599,588 waybills. Escalation
Consultants analyzed 248,596 Sample records, which included all commodity movements in the Sample
except for Intermodal. The 248,596 Sample records, when expanded to represent all rail traffic for
these types of movements, total to 19,461,517 carloads in 2011. When the 19,672,399 carloads
analyzed in 2005 are added to the 2011 carloads a total of 39,132,676 carloads were analyzed to
determine the change in shippers’ rail rate premium between 2005 and 2011.
Movement characteristics for each record were evaluated to determine the number of interchanges, car
type, weight/car, rail territory of origin, destination and all relevant movement parameters so that
railroad variable costs could be computed. All movements were run through the Optimized Rail Bid
Evaluation (ORBE) batch processing program that can analyze the cost for hundreds of thousands of
movements utilizing the STB costing program, the Uniform Rail Costing System (URCS). The ORBE
calculated the following for each movement:
Railroad long term variable cost; and,
The Revenue to Variable Cost Ratio (RVC) (RVC= Revenue ÷ Variable Cost).
The Staggers Rail Act of 1980 set a legislative demarcation for non-competitive rail rates as those rates
with an RVC of 180% or greater. The 180% RVC level is referred to as the Jurisdictional Threshold,
signifying the STB has no authority over tariff rates of less than 180%, therefore. The ORBE established
the non-competitive and competitive status by the RVC for each movement. In this Exhibit, non-
competitive movements are defined as those with an RVC of 180% or greater and competitive
movements are defined as those with an RVC of less than 180%.
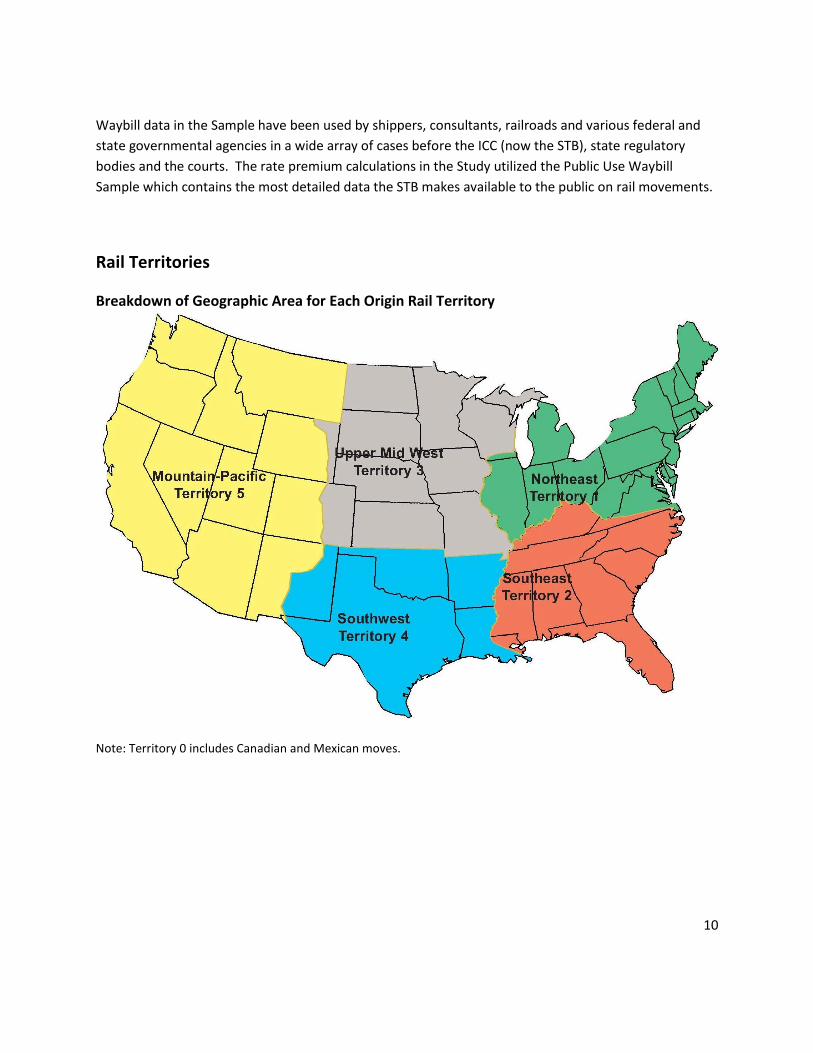
The rate premium for commodities is determined by calculating the average difference between the
rate per car above and below a 180% RVC for each commodity in each rail territory and then multiplying
this rate difference by the number of cars with RVC’s above a 180% RVC for that commodity and
territory. The sum of the premium amounts for all territories represents the total rate premium for a
commodity. A map showing the location of each rail territory is found on page 11.
9
The most detailed commodities in the Sample are five-digit Standard Transportation Commodity Codes
(five-digit STCC’s). For example, the Sample contains sixty (60) different five-digit chemical codes which
represent all chemicals shipped by rail. The overall amount for chemicals (STCC 28) is the sum of the
sixty (60) five-digit chemical codes.
In calculating the cost of non-competitive rates some commodities did not contain any movements with
less than a 180% RVC in a rail territory and in other cases the makeup of moves with less than a 180%
RVC was substantially different than the makeup of moves with RVC’s greater than 180%. In these
instances competitive rail rates were computed based on the jurisdictional threshold of 180%. In these
situations competitive rates were determined by multiplying the railroad’s average non-competitive cost
per car for a commodity in a territory by 180%. This is a conservative assumption as it assumes that the
competitive rates for all movements in a territory are at the absolute highest possible competitive rate
level which is 180% greater than the railroads’ variable cost of non-competitive movements. The rate
premium represents the difference between rates above and below a 180% RVC for a commodity in a
territory so by establishing the competitive rate at the highest level possible the Study minimizes the
rate premium when the competitive rate is a calculated amount.
A number of records in this sample were found to contain errors not detected or deemed significant by
the STB. These types of moves were eliminated from the Analysis1.
Railroads are allowed to mask contract revenue either up or down in the Sample which means that rates
may be over or understated to the extent that revenue masking occurs in the Sample. To the extent
that revenue masking occurs it would apply to the rates for both non-competitive and competitive
movements. The cost of non-competitive rates is calculated as the difference between average non-
competitive and competitive rates and both types of movements would be impacted by revenue
masking so the cost of non-competitive rates should not be materially impacted by any masking of
revenue in the Sample.
1 The movements which were eliminated fell into the following categories:
Laden weights of 130 tons or more per car,
Laden weights of zero tons per car,
Rates of zero dollars per car,
RVC levels of less than 50%,
Rates of $30,000 or above per car.
Gross track weight limitations are 286,000 lbs or 143 tons. The tare weight or empty weight of typical railcars range between 26 and 55 tons, adding 130 tons of laden to an empty car will exceed the 143 ton limit. Shipping zero tons, or having a rate of $zero or $30,000 and above per car is deemed an input error; people do not ship commodities without weight, railroads do not tend to ship commodities for free and shippers do not tend to ship commodities at rates at or in excess of $30,000 per car. An RVC level of less than 50% is indicative of an input error in the STB’s Waybill regarding the rate or the distance per movement.
10
Waybill data in the Sample have been used by shippers, consultants, railroads and various federal and
state governmental agencies in a wide array of cases before the ICC (now the STB), state regulatory
bodies and the courts. The rate premium calculations in the Study utilized the Public Use Waybill
Sample which contains the most detailed data the STB makes available to the public on rail movements.
Rail Territories
Breakdown of Geographic Area for Each Origin Rail Territory
Note: Territory 0 includes Canadian and Mexican moves.
11
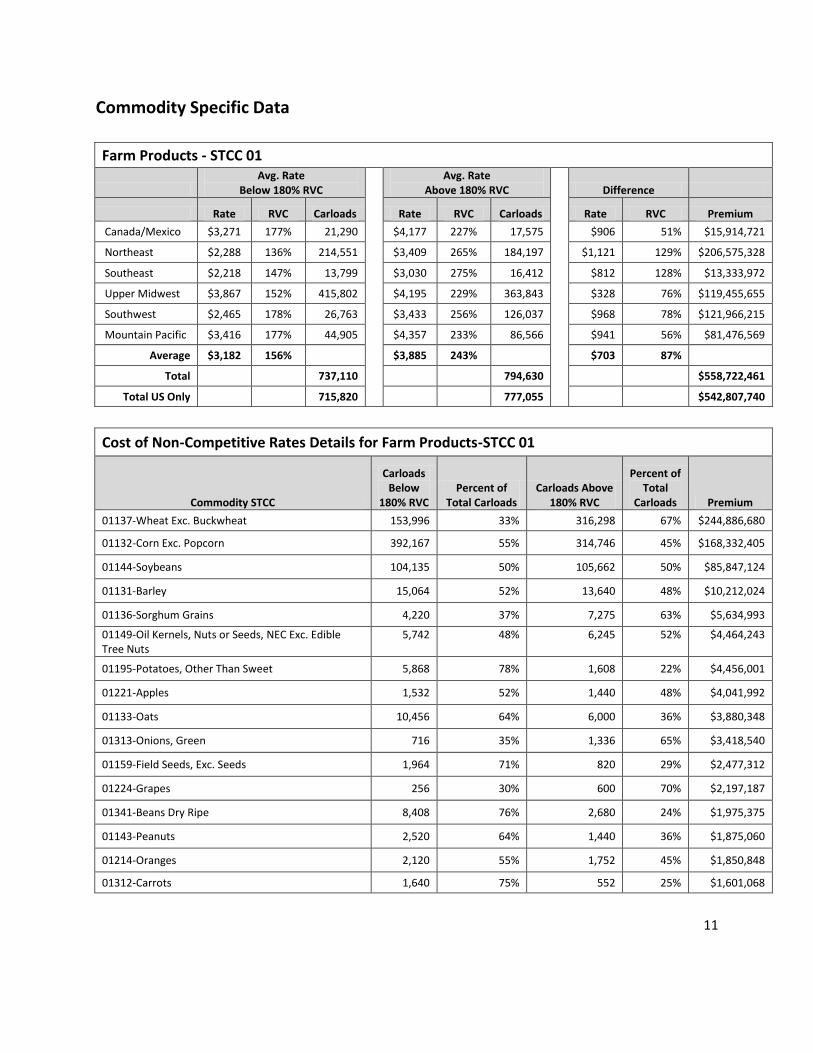
Commodity Specific Data
Farm Products - STCC 01
Avg. Rate
Below 180% RVC Avg. Rate
Above 180% RVC Difference
Rate RVC Carloads Rate RVC Carloads Rate RVC Premium
Canada/Mexico $3,271 177% 21,290 $4,177 227% 17,575
$906 51% $15,914,721
Northeast $2,288 136% 214,551 $3,409 265% 184,197
$1,121 129% $206,575,328
Southeast $2,218 147% 13,799 $3,030 275% 16,412
$812 128% $13,333,972
Upper Midwest $3,867 152% 415,802 $4,195 229% 363,843
$328 76% $119,455,655
Southwest $2,465 178% 26,763 $3,433 256% 126,037
$968 78% $121,966,215
Mountain Pacific $3,416 177% 44,905 $4,357 233% 86,566
$941 56% $81,476,569
Average $3,182 156% $3,885 243%
$703 87%
Total 737,110 794,630 $558,722,461
Total US Only 715,820 777,055 $542,807,740
Cost of Non-Competitive Rates Details for Farm Products-STCC 01
Commodity STCC
Carloads Below
180% RVC Percent of
Total Carloads Carloads Above
180% RVC
Percent of Total
Carloads Premium
01137-Wheat Exc. Buckwheat 153,996 33% 316,298 67% $244,886,680
01132-Corn Exc. Popcorn 392,167 55% 314,746 45% $168,332,405
01144-Soybeans 104,135 50% 105,662 50% $85,847,124
01131-Barley 15,064 52% 13,640 48% $10,212,024
01136-Sorghum Grains 4,220 37% 7,275 63% $5,634,993
01149-Oil Kernels, Nuts or Seeds, NEC Exc. Edible Tree Nuts
5,742 48% 6,245 52% $4,464,243
01195-Potatoes, Other Than Sweet 5,868 78% 1,608 22% $4,456,001
01221-Apples 1,532 52% 1,440 48% $4,041,992
01133-Oats 10,456 64% 6,000 36% $3,880,348
01313-Onions, Green 716 35% 1,336 65% $3,418,540
01159-Field Seeds, Exc. Seeds 1,964 71% 820 29% $2,477,312
01224-Grapes 256 30% 600 70% $2,197,187
01341-Beans Dry Ripe 8,408 76% 2,680 24% $1,975,375
01143-Peanuts 2,520 64% 1,440 36% $1,875,060
01214-Oranges 2,120 55% 1,752 45% $1,850,848
01312-Carrots 1,640 75% 552 25% $1,601,068
12
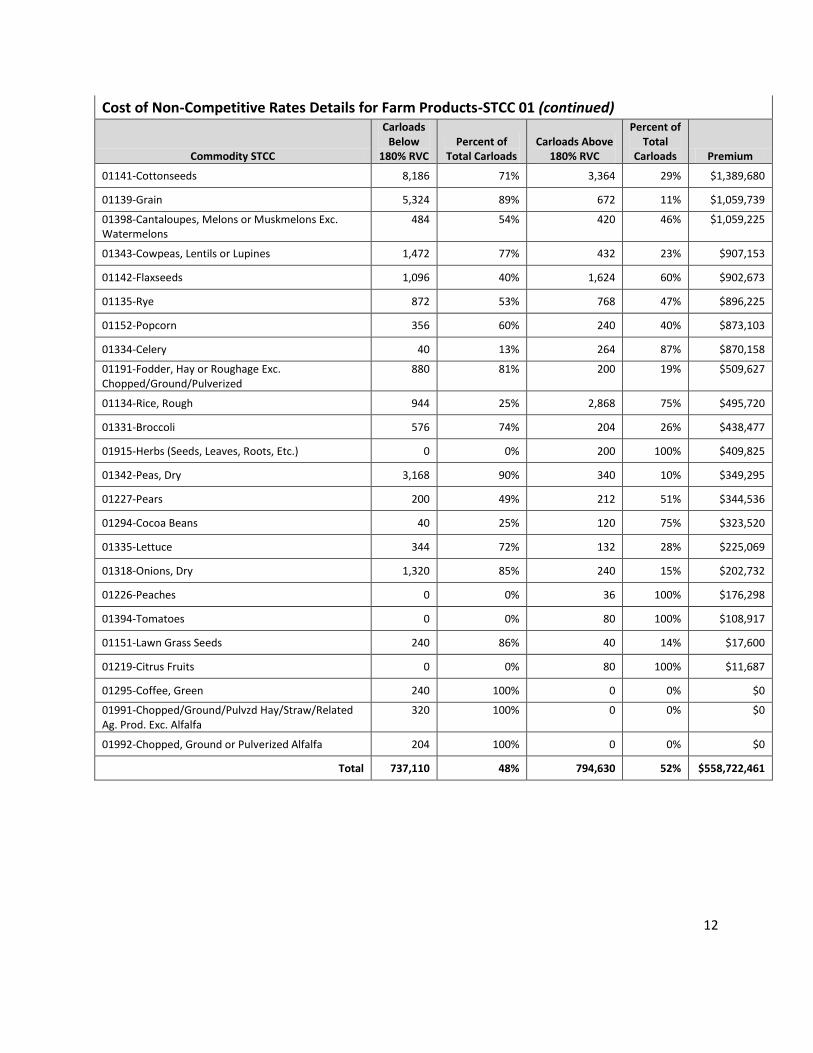
Cost of Non-Competitive Rates Details for Farm Products-STCC 01 (continued)
Commodity STCC
Carloads Below
180% RVC Percent of
Total Carloads Carloads Above
180% RVC
Percent of Total
Carloads Premium
01141-Cottonseeds 8,186 71% 3,364 29% $1,389,680
01139-Grain 5,324 89% 672 11% $1,059,739
01398-Cantaloupes, Melons or Muskmelons Exc. Watermelons
484 54% 420 46% $1,059,225
01343-Cowpeas, Lentils or Lupines 1,472 77% 432 23% $907,153
01142-Flaxseeds 1,096 40% 1,624 60% $902,673
01135-Rye 872 53% 768 47% $896,225
01152-Popcorn 356 60% 240 40% $873,103
01334-Celery 40 13% 264 87% $870,158
01191-Fodder, Hay or Roughage Exc. Chopped/Ground/Pulverized
880 81% 200 19% $509,627
01134-Rice, Rough 944 25% 2,868 75% $495,720
01331-Broccoli 576 74% 204 26% $438,477
01915-Herbs (Seeds, Leaves, Roots, Etc.) 0 0% 200 100% $409,825
01342-Peas, Dry 3,168 90% 340 10% $349,295
01227-Pears 200 49% 212 51% $344,536
01294-Cocoa Beans 40 25% 120 75% $323,520
01335-Lettuce 344 72% 132 28% $225,069
01318-Onions, Dry 1,320 85% 240 15% $202,732
01226-Peaches 0 0% 36 100% $176,298
01394-Tomatoes 0 0% 80 100% $108,917
01151-Lawn Grass Seeds 240 86% 40 14% $17,600
01219-Citrus Fruits 0 0% 80 100% $11,687
01295-Coffee, Green 240 100% 0 0% $0
01991-Chopped/Ground/Pulvzd Hay/Straw/Related Ag. Prod. Exc. Alfalfa
320 100% 0 0% $0
01992-Chopped, Ground or Pulverized Alfalfa 204 100% 0 0% $0
Total 737,110 48% 794,630 52% $558,722,461
13
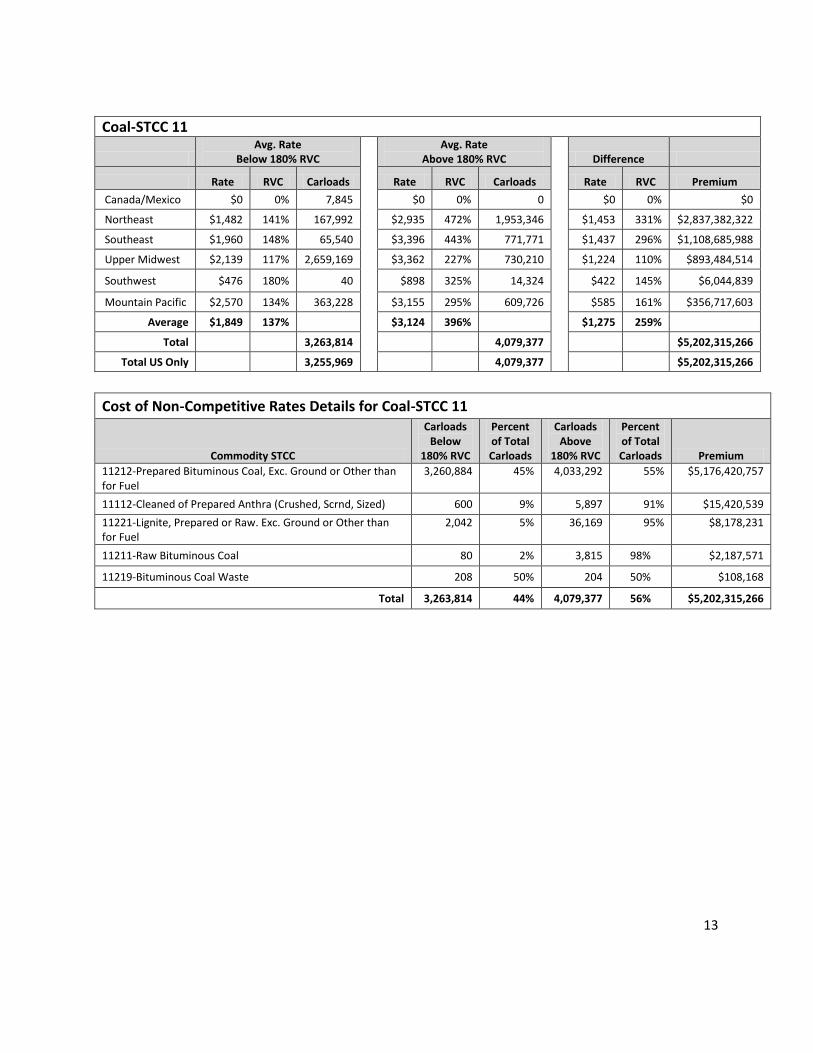
Coal-STCC 11
Avg. Rate
Below 180% RVC Avg. Rate
Above 180% RVC Difference
Rate RVC Carloads Rate RVC Carloads Rate RVC Premium
Canada/Mexico $0 0% 7,845 $0 0% 0 $0 0% $0
Northeast $1,482 141% 167,992 $2,935 472% 1,953,346 $1,453 331% $2,837,382,322
Southeast $1,960 148% 65,540 $3,396 443% 771,771 $1,437 296% $1,108,685,988
Upper Midwest $2,139 117% 2,659,169 $3,362 227% 730,210 $1,224 110% $893,484,514
Southwest $476 180% 40 $898 325% 14,324 $422 145% $6,044,839
Mountain Pacific $2,570 134% 363,228 $3,155 295% 609,726 $585 161% $356,717,603
Average $1,849 137% $3,124 396% $1,275 259%
Total 3,263,814 4,079,377 $5,202,315,266
Total US Only 3,255,969 4,079,377 $5,202,315,266
Cost of Non-Competitive Rates Details for Coal-STCC 11
Commodity STCC
Carloads Below
180% RVC
Percent of Total Carloads
Carloads Above
180% RVC
Percent of Total Carloads Premium
11212-Prepared Bituminous Coal, Exc. Ground or Other than for Fuel
3,260,884 45% 4,033,292 55% $5,176,420,757
11112-Cleaned of Prepared Anthra (Crushed, Scrnd, Sized) 600 9% 5,897 91% $15,420,539
11221-Lignite, Prepared or Raw. Exc. Ground or Other than for Fuel
2,042 5% 36,169 95% $8,178,231
11211-Raw Bituminous Coal 80 2% 3,815 98% $2,187,571
11219-Bituminous Coal Waste 208 50% 204 50% $108,168
Total 3,263,814 44% 4,079,377 56% $5,202,315,266
14
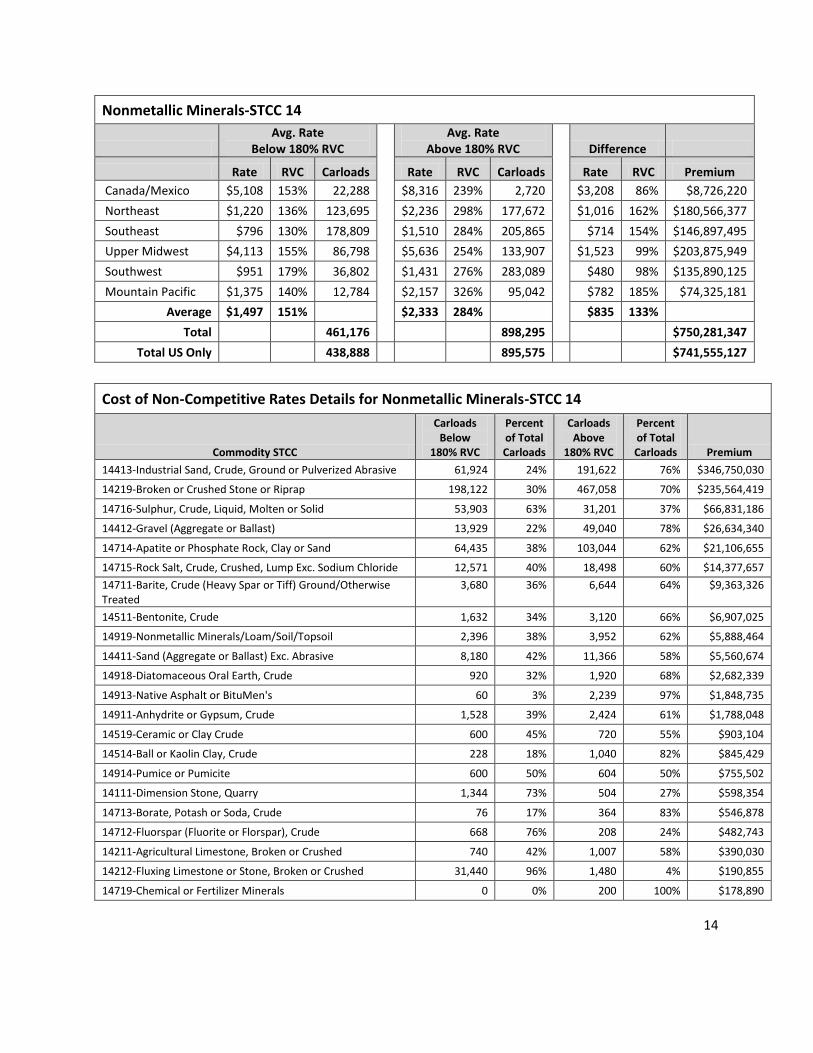
Nonmetallic Minerals-STCC 14
Avg. Rate
Below 180% RVC Avg. Rate
Above 180% RVC Difference
Rate RVC Carloads Rate RVC Carloads Rate RVC Premium
Canada/Mexico $5,108 153% 22,288 $8,316 239% 2,720 $3,208 86% $8,726,220
Northeast $1,220 136% 123,695 $2,236 298% 177,672 $1,016 162% $180,566,377
Southeast $796 130% 178,809 $1,510 284% 205,865 $714 154% $146,897,495
Upper Midwest $4,113 155% 86,798 $5,636 254% 133,907 $1,523 99% $203,875,949
Southwest $951 179% 36,802 $1,431 276% 283,089 $480 98% $135,890,125
Mountain Pacific $1,375 140% 12,784 $2,157 326% 95,042 $782 185% $74,325,181
Average $1,497 151% $2,333 284% $835 133%
Total 461,176 898,295 $750,281,347
Total US Only 438,888 895,575 $741,555,127
Cost of Non-Competitive Rates Details for Nonmetallic Minerals-STCC 14
Commodity STCC
Carloads Below
180% RVC
Percent of Total Carloads
Carloads Above
180% RVC
Percent of Total Carloads Premium
14413-Industrial Sand, Crude, Ground or Pulverized Abrasive 61,924 24% 191,622 76% $346,750,030
14219-Broken or Crushed Stone or Riprap 198,122 30% 467,058 70% $235,564,419
14716-Sulphur, Crude, Liquid, Molten or Solid 53,903 63% 31,201 37% $66,831,186
14412-Gravel (Aggregate or Ballast) 13,929 22% 49,040 78% $26,634,340
14714-Apatite or Phosphate Rock, Clay or Sand 64,435 38% 103,044 62% $21,106,655
14715-Rock Salt, Crude, Crushed, Lump Exc. Sodium Chloride 12,571 40% 18,498 60% $14,377,657
14711-Barite, Crude (Heavy Spar or Tiff) Ground/Otherwise Treated
3,680 36% 6,644 64% $9,363,326
14511-Bentonite, Crude 1,632 34% 3,120 66% $6,907,025
14919-Nonmetallic Minerals/Loam/Soil/Topsoil 2,396 38% 3,952 62% $5,888,464
14411-Sand (Aggregate or Ballast) Exc. Abrasive 8,180 42% 11,366 58% $5,560,674
14918-Diatomaceous Oral Earth, Crude 920 32% 1,920 68% $2,682,339
14913-Native Asphalt or BituMen's 60 3% 2,239 97% $1,848,735
14911-Anhydrite or Gypsum, Crude 1,528 39% 2,424 61% $1,788,048
14519-Ceramic or Clay Crude 600 45% 720 55% $903,104
14514-Ball or Kaolin Clay, Crude 228 18% 1,040 82% $845,429
14914-Pumice or Pumicite 600 50% 604 50% $755,502
14111-Dimension Stone, Quarry 1,344 73% 504 27% $598,354
14713-Borate, Potash or Soda, Crude 76 17% 364 83% $546,878
14712-Fluorspar (Fluorite or Florspar), Crude 668 76% 208 24% $482,743
14211-Agricultural Limestone, Broken or Crushed 740 42% 1,007 58% $390,030
14212-Fluxing Limestone or Stone, Broken or Crushed 31,440 96% 1,480 4% $190,855
14719-Chemical or Fertilizer Minerals 0 0% 200 100% $178,890
15
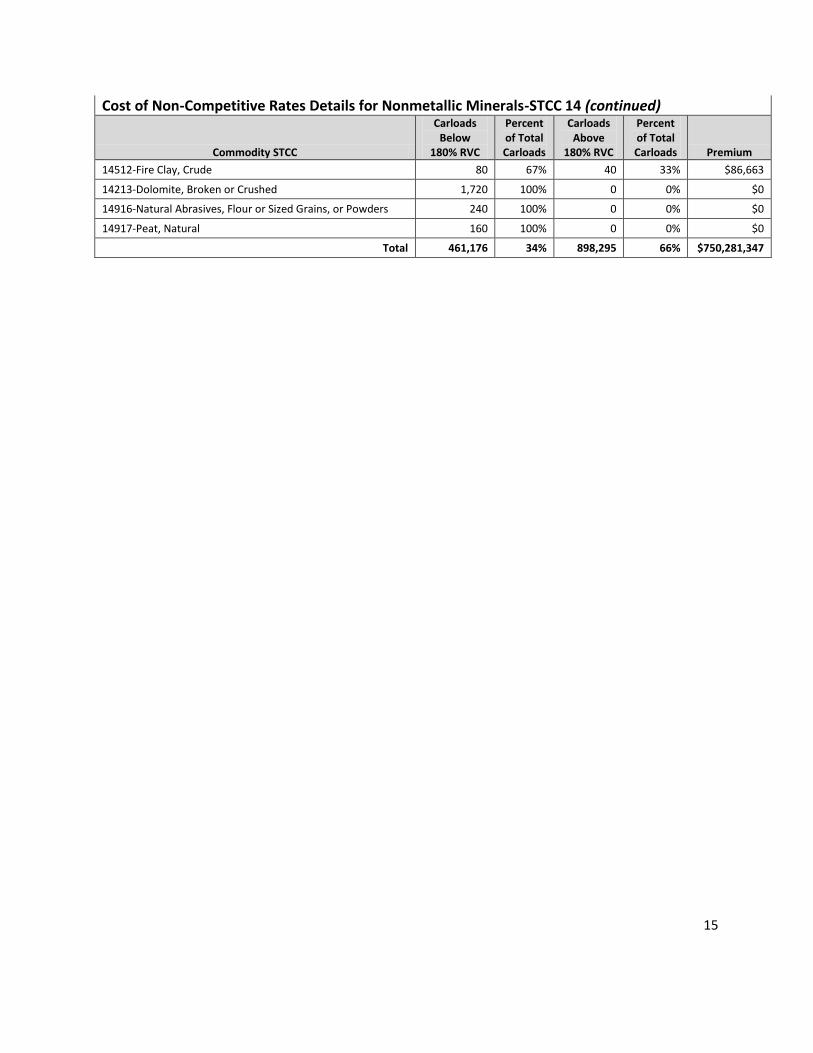
Cost of Non-Competitive Rates Details for Nonmetallic Minerals-STCC 14 (continued)
Commodity STCC
Carloads Below
180% RVC
Percent of Total Carloads
Carloads Above
180% RVC
Percent of Total Carloads Premium
14512-Fire Clay, Crude 80 67% 40 33% $86,663
14213-Dolomite, Broken or Crushed 1,720 100% 0 0% $0
14916-Natural Abrasives, Flour or Sized Grains, or Powders 240 100% 0 0% $0
14917-Peat, Natural 160 100% 0 0% $0
Total 461,176 34% 898,295 66% $750,281,347
16
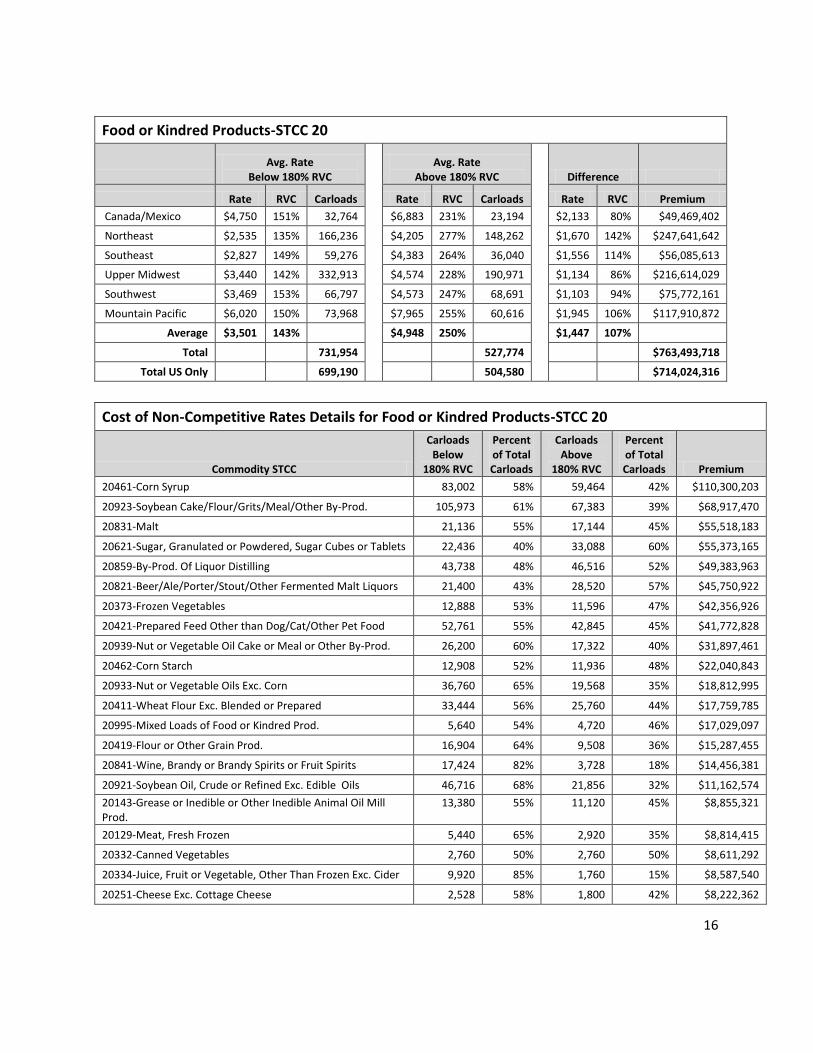
Food or Kindred Products-STCC 20
Avg. Rate
Below 180% RVC Avg. Rate
Above 180% RVC Difference
Rate RVC Carloads Rate RVC Carloads Rate RVC Premium
Canada/Mexico $4,750 151% 32,764 $6,883 231% 23,194 $2,133 80% $49,469,402
Northeast $2,535 135% 166,236 $4,205 277% 148,262 $1,670 142% $247,641,642
Southeast $2,827 149% 59,276 $4,383 264% 36,040 $1,556 114% $56,085,613
Upper Midwest $3,440 142% 332,913 $4,574 228% 190,971 $1,134 86% $216,614,029
Southwest $3,469 153% 66,797 $4,573 247% 68,691 $1,103 94% $75,772,161
Mountain Pacific $6,020 150% 73,968 $7,965 255% 60,616 $1,945 106% $117,910,872
Average $3,501 143% $4,948 250% $1,447 107%
Total 731,954 527,774 $763,493,718
Total US Only 699,190 504,580 $714,024,316
Cost of Non-Competitive Rates Details for Food or Kindred Products-STCC 20
Commodity STCC
Carloads Below
180% RVC
Percent of Total Carloads
Carloads Above
180% RVC
Percent of Total Carloads Premium
20461-Corn Syrup 83,002 58% 59,464 42% $110,300,203
20923-Soybean Cake/Flour/Grits/Meal/Other By-Prod. 105,973 61% 67,383 39% $68,917,470
20831-Malt 21,136 55% 17,144 45% $55,518,183
20621-Sugar, Granulated or Powdered, Sugar Cubes or Tablets 22,436 40% 33,088 60% $55,373,165
20859-By-Prod. Of Liquor Distilling 43,738 48% 46,516 52% $49,383,963
20821-Beer/Ale/Porter/Stout/Other Fermented Malt Liquors 21,400 43% 28,520 57% $45,750,922
20373-Frozen Vegetables 12,888 53% 11,596 47% $42,356,926
20421-Prepared Feed Other than Dog/Cat/Other Pet Food 52,761 55% 42,845 45% $41,772,828
20939-Nut or Vegetable Oil Cake or Meal or Other By-Prod. 26,200 60% 17,322 40% $31,897,461
20462-Corn Starch 12,908 52% 11,936 48% $22,040,843
20933-Nut or Vegetable Oils Exc. Corn 36,760 65% 19,568 35% $18,812,995
20411-Wheat Flour Exc. Blended or Prepared 33,444 56% 25,760 44% $17,759,785
20995-Mixed Loads of Food or Kindred Prod. 5,640 54% 4,720 46% $17,029,097
20419-Flour or Other Grain Prod. 16,904 64% 9,508 36% $15,287,455
20841-Wine, Brandy or Brandy Spirits or Fruit Spirits 17,424 82% 3,728 18% $14,456,381
20921-Soybean Oil, Crude or Refined Exc. Edible Oils 46,716 68% 21,856 32% $11,162,574
20143-Grease or Inedible or Other Inedible Animal Oil Mill Prod.
13,380 55% 11,120 45% $8,855,321
20129-Meat, Fresh Frozen 5,440 65% 2,920 35% $8,814,415
20332-Canned Vegetables 2,760 50% 2,760 50% $8,611,292
20334-Juice, Fruit or Vegetable, Other Than Frozen Exc. Cider 9,920 85% 1,760 15% $8,587,540
20251-Cheese Exc. Cottage Cheese 2,528 58% 1,800 42% $8,222,362
17
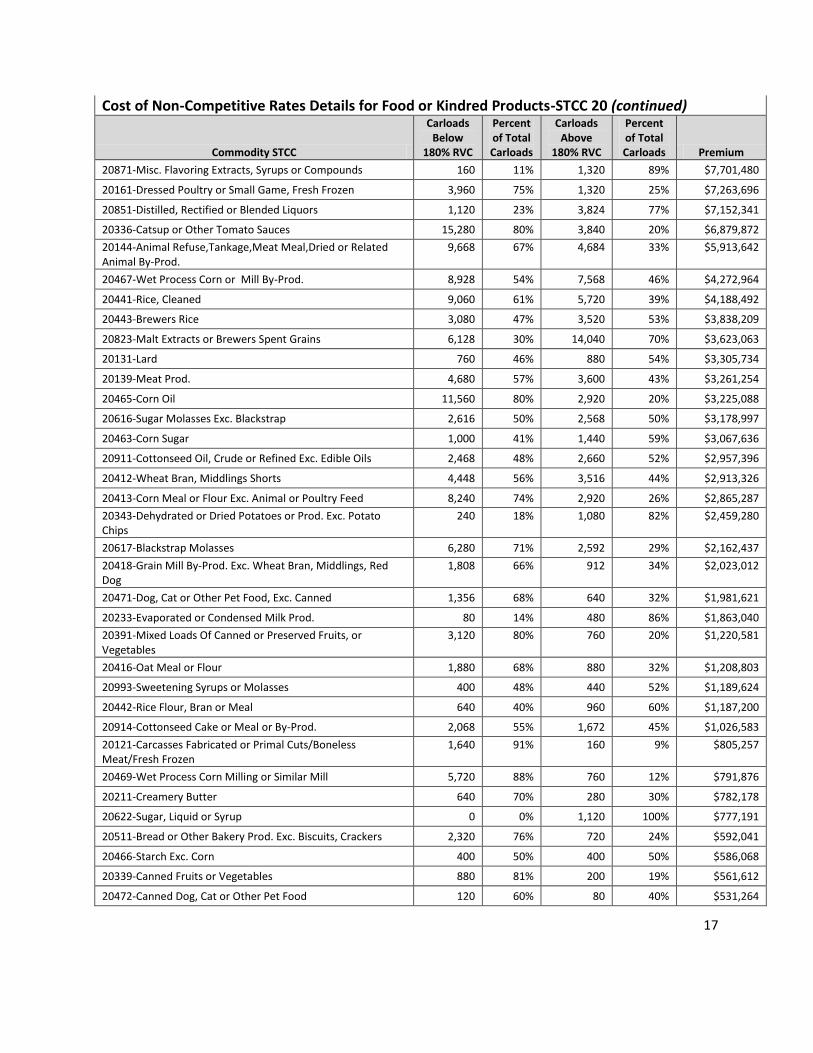
Cost of Non-Competitive Rates Details for Food or Kindred Products-STCC 20 (continued)
Commodity STCC
Carloads Below
180% RVC
Percent of Total Carloads
Carloads Above
180% RVC
Percent of Total Carloads Premium
20871-Misc. Flavoring Extracts, Syrups or Compounds 160 11% 1,320 89% $7,701,480
20161-Dressed Poultry or Small Game, Fresh Frozen 3,960 75% 1,320 25% $7,263,696
20851-Distilled, Rectified or Blended Liquors 1,120 23% 3,824 77% $7,152,341
20336-Catsup or Other Tomato Sauces 15,280 80% 3,840 20% $6,879,872
20144-Animal Refuse,Tankage,Meat Meal,Dried or Related Animal By-Prod.
9,668 67% 4,684 33% $5,913,642
20467-Wet Process Corn or Mill By-Prod. 8,928 54% 7,568 46% $4,272,964
20441-Rice, Cleaned 9,060 61% 5,720 39% $4,188,492
20443-Brewers Rice 3,080 47% 3,520 53% $3,838,209
20823-Malt Extracts or Brewers Spent Grains 6,128 30% 14,040 70% $3,623,063
20131-Lard 760 46% 880 54% $3,305,734
20139-Meat Prod. 4,680 57% 3,600 43% $3,261,254
20465-Corn Oil 11,560 80% 2,920 20% $3,225,088
20616-Sugar Molasses Exc. Blackstrap 2,616 50% 2,568 50% $3,178,997
20463-Corn Sugar 1,000 41% 1,440 59% $3,067,636
20911-Cottonseed Oil, Crude or Refined Exc. Edible Oils 2,468 48% 2,660 52% $2,957,396
20412-Wheat Bran, Middlings Shorts 4,448 56% 3,516 44% $2,913,326
20413-Corn Meal or Flour Exc. Animal or Poultry Feed 8,240 74% 2,920 26% $2,865,287
20343-Dehydrated or Dried Potatoes or Prod. Exc. Potato Chips
240 18% 1,080 82% $2,459,280
20617-Blackstrap Molasses 6,280 71% 2,592 29% $2,162,437
20418-Grain Mill By-Prod. Exc. Wheat Bran, Middlings, Red Dog
1,808 66% 912 34% $2,023,012
20471-Dog, Cat or Other Pet Food, Exc. Canned 1,356 68% 640 32% $1,981,621
20233-Evaporated or Condensed Milk Prod. 80 14% 480 86% $1,863,040
20391-Mixed Loads Of Canned or Preserved Fruits, or Vegetables
3,120 80% 760 20% $1,220,581
20416-Oat Meal or Flour 1,880 68% 880 32% $1,208,803
20993-Sweetening Syrups or Molasses 400 48% 440 52% $1,189,624
20442-Rice Flour, Bran or Meal 640 40% 960 60% $1,187,200
20914-Cottonseed Cake or Meal or By-Prod. 2,068 55% 1,672 45% $1,026,583
20121-Carcasses Fabricated or Primal Cuts/Boneless Meat/Fresh Frozen
1,640 91% 160 9% $805,257
20469-Wet Process Corn Milling or Similar Mill 5,720 88% 760 12% $791,876
20211-Creamery Butter 640 70% 280 30% $782,178
20622-Sugar, Liquid or Syrup 0 0% 1,120 100% $777,191
20511-Bread or Other Bakery Prod. Exc. Biscuits, Crackers 2,320 76% 720 24% $592,041
20466-Starch Exc. Corn 400 50% 400 50% $586,068
20339-Canned Fruits or Vegetables 880 81% 200 19% $561,612
20472-Canned Dog, Cat or Other Pet Food 120 60% 80 40% $531,264
18
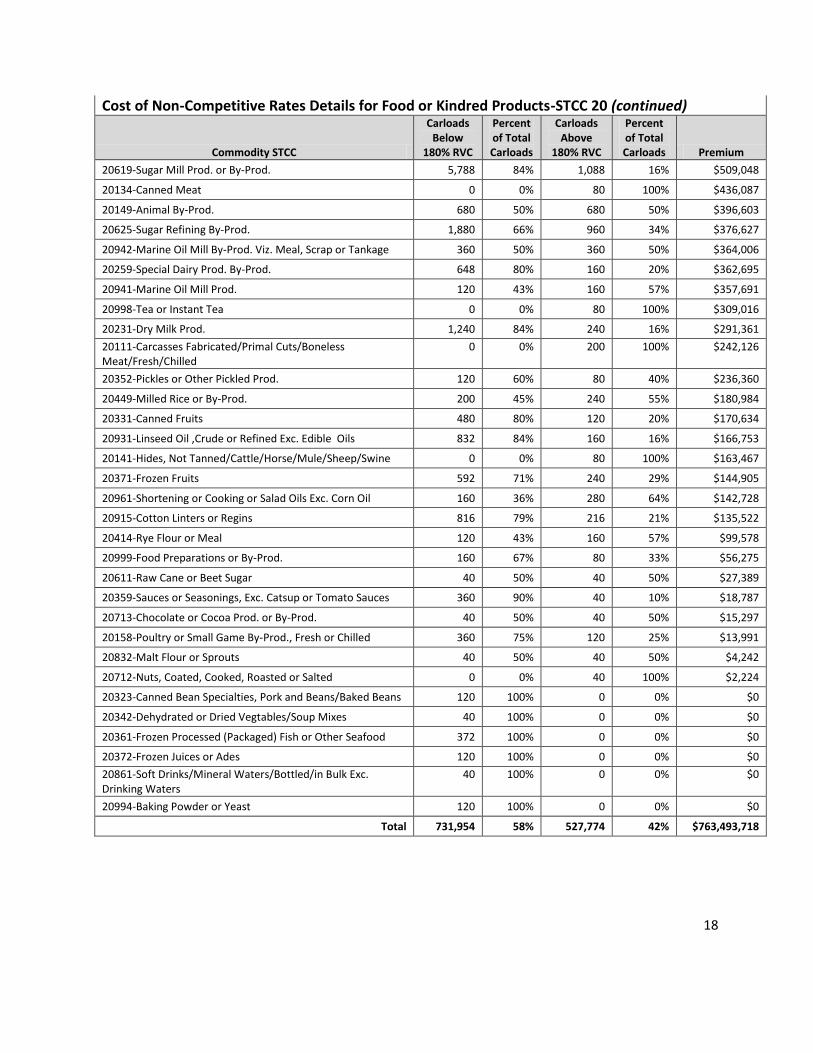
Cost of Non-Competitive Rates Details for Food or Kindred Products-STCC 20 (continued)
Commodity STCC
Carloads Below
180% RVC
Percent of Total Carloads
Carloads Above
180% RVC
Percent of Total Carloads Premium
20619-Sugar Mill Prod. or By-Prod. 5,788 84% 1,088 16% $509,048
20134-Canned Meat 0 0% 80 100% $436,087
20149-Animal By-Prod. 680 50% 680 50% $396,603
20625-Sugar Refining By-Prod. 1,880 66% 960 34% $376,627
20942-Marine Oil Mill By-Prod. Viz. Meal, Scrap or Tankage 360 50% 360 50% $364,006
20259-Special Dairy Prod. By-Prod. 648 80% 160 20% $362,695
20941-Marine Oil Mill Prod. 120 43% 160 57% $357,691
20998-Tea or Instant Tea 0 0% 80 100% $309,016
20231-Dry Milk Prod. 1,240 84% 240 16% $291,361
20111-Carcasses Fabricated/Primal Cuts/Boneless Meat/Fresh/Chilled
0 0% 200 100% $242,126
20352-Pickles or Other Pickled Prod. 120 60% 80 40% $236,360
20449-Milled Rice or By-Prod. 200 45% 240 55% $180,984
20331-Canned Fruits 480 80% 120 20% $170,634
20931-Linseed Oil ,Crude or Refined Exc. Edible Oils 832 84% 160 16% $166,753
20141-Hides, Not Tanned/Cattle/Horse/Mule/Sheep/Swine 0 0% 80 100% $163,467
20371-Frozen Fruits 592 71% 240 29% $144,905
20961-Shortening or Cooking or Salad Oils Exc. Corn Oil 160 36% 280 64% $142,728
20915-Cotton Linters or Regins 816 79% 216 21% $135,522
20414-Rye Flour or Meal 120 43% 160 57% $99,578
20999-Food Preparations or By-Prod. 160 67% 80 33% $56,275
20611-Raw Cane or Beet Sugar 40 50% 40 50% $27,389
20359-Sauces or Seasonings, Exc. Catsup or Tomato Sauces 360 90% 40 10% $18,787
20713-Chocolate or Cocoa Prod. or By-Prod. 40 50% 40 50% $15,297
20158-Poultry or Small Game By-Prod., Fresh or Chilled 360 75% 120 25% $13,991
20832-Malt Flour or Sprouts 40 50% 40 50% $4,242
20712-Nuts, Coated, Cooked, Roasted or Salted 0 0% 40 100% $2,224
20323-Canned Bean Specialties, Pork and Beans/Baked Beans 120 100% 0 0% $0
20342-Dehydrated or Dried Vegtables/Soup Mixes 40 100% 0 0% $0
20361-Frozen Processed (Packaged) Fish or Other Seafood 372 100% 0 0% $0
20372-Frozen Juices or Ades 120 100% 0 0% $0
20861-Soft Drinks/Mineral Waters/Bottled/in Bulk Exc. Drinking Waters
40 100% 0 0% $0
20994-Baking Powder or Yeast 120 100% 0 0% $0
Total 731,954 58% 527,774 42% $763,493,718
19
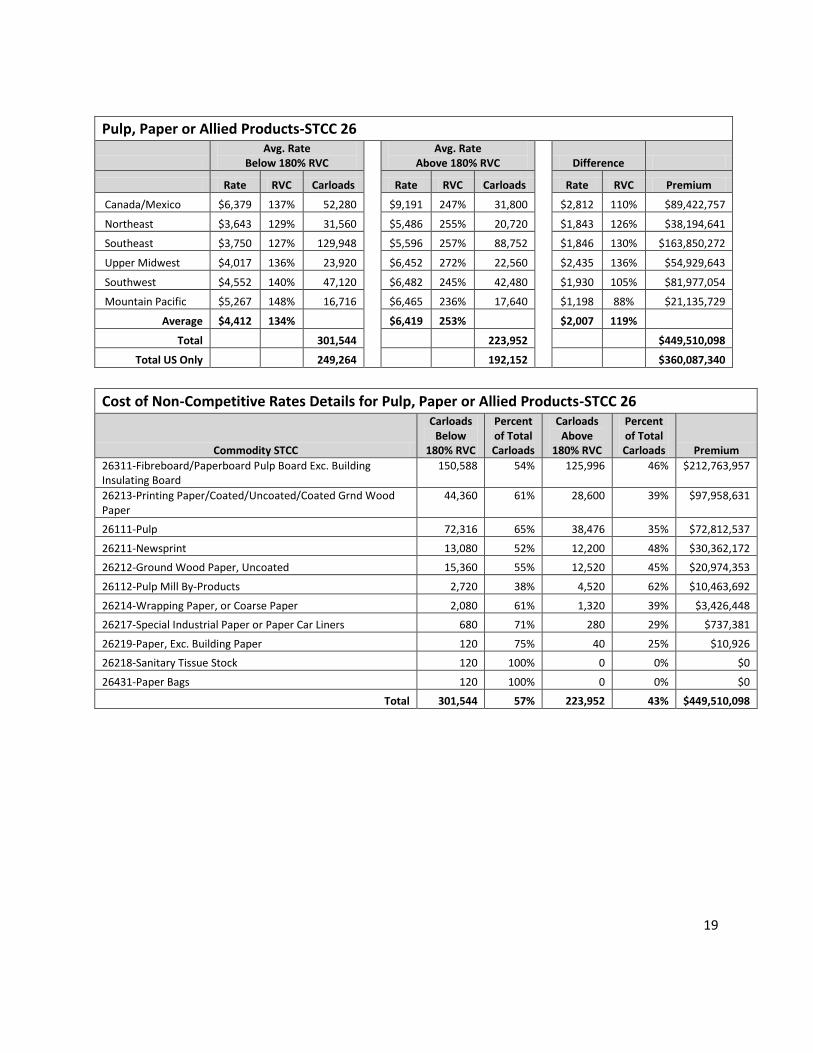
Pulp, Paper or Allied Products-STCC 26
Avg. Rate
Below 180% RVC Avg. Rate
Above 180% RVC Difference
Rate RVC Carloads Rate RVC Carloads Rate RVC Premium
Canada/Mexico $6,379 137% 52,280 $9,191 247% 31,800
$2,812 110% $89,422,757
Northeast $3,643 129% 31,560 $5,486 255% 20,720
$1,843 126% $38,194,641
Southeast $3,750 127% 129,948 $5,596 257% 88,752
$1,846 130% $163,850,272
Upper Midwest $4,017 136% 23,920 $6,452 272% 22,560
$2,435 136% $54,929,643
Southwest $4,552 140% 47,120 $6,482 245% 42,480
$1,930 105% $81,977,054
Mountain Pacific $5,267 148% 16,716 $6,465 236% 17,640
$1,198 88% $21,135,729
Average $4,412 134% $6,419 253%
$2,007 119%
Total 301,544 223,952 $449,510,098
Total US Only 249,264 192,152 $360,087,340
Cost of Non-Competitive Rates Details for Pulp, Paper or Allied Products-STCC 26
Commodity STCC
Carloads Below
180% RVC
Percent of Total Carloads
Carloads Above
180% RVC
Percent of Total Carloads Premium
26311-Fibreboard/Paperboard Pulp Board Exc. Building Insulating Board
150,588 54% 125,996 46% $212,763,957
26213-Printing Paper/Coated/Uncoated/Coated Grnd Wood Paper
44,360 61% 28,600 39% $97,958,631
26111-Pulp 72,316 65% 38,476 35% $72,812,537
26211-Newsprint 13,080 52% 12,200 48% $30,362,172
26212-Ground Wood Paper, Uncoated 15,360 55% 12,520 45% $20,974,353
26112-Pulp Mill By-Products 2,720 38% 4,520 62% $10,463,692
26214-Wrapping Paper, or Coarse Paper 2,080 61% 1,320 39% $3,426,448
26217-Special Industrial Paper or Paper Car Liners 680 71% 280 29% $737,381
26219-Paper, Exc. Building Paper 120 75% 40 25% $10,926
26218-Sanitary Tissue Stock 120 100% 0 0% $0
26431-Paper Bags 120 100% 0 0% $0
Total 301,544 57% 223,952 43% $449,510,098
20
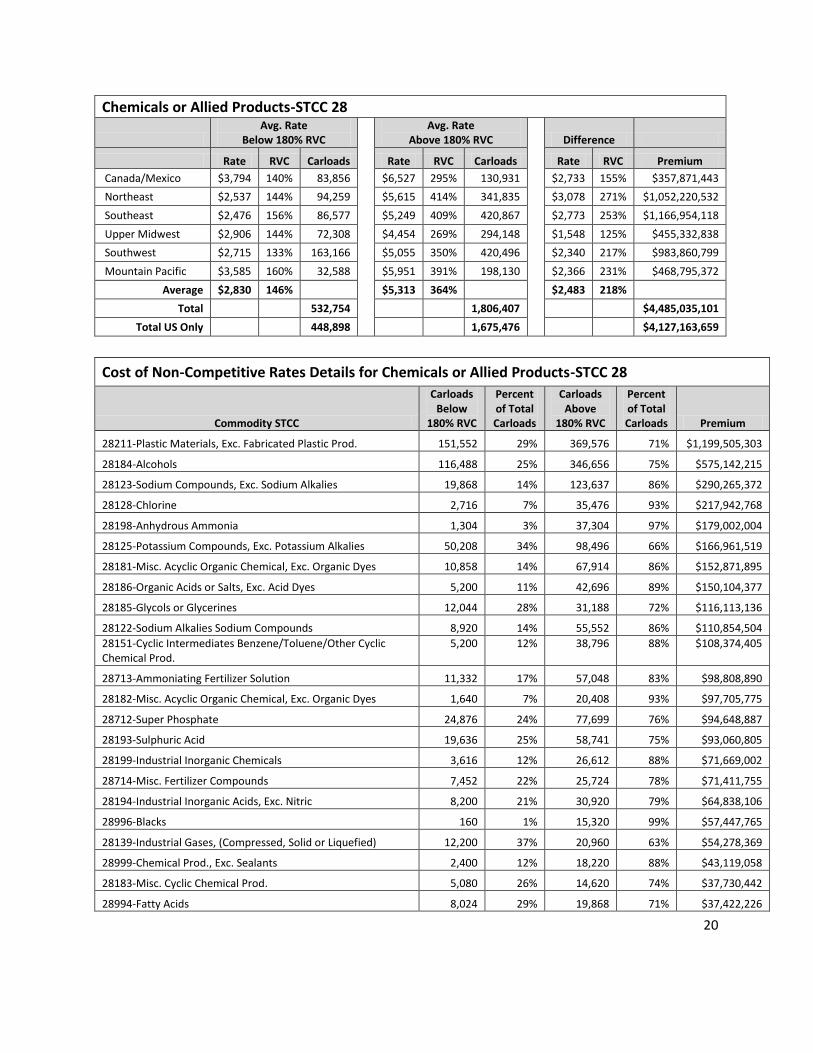
Chemicals or Allied Products-STCC 28
Avg. Rate
Below 180% RVC Avg. Rate
Above 180% RVC Difference
Rate RVC Carloads Rate RVC Carloads Rate RVC Premium
Canada/Mexico $3,794 140% 83,856 $6,527 295% 130,931 $2,733 155% $357,871,443
Northeast $2,537 144% 94,259 $5,615 414% 341,835 $3,078 271% $1,052,220,532
Southeast $2,476 156% 86,577 $5,249 409% 420,867 $2,773 253% $1,166,954,118
Upper Midwest $2,906 144% 72,308 $4,454 269% 294,148 $1,548 125% $455,332,838
Southwest $2,715 133% 163,166 $5,055 350% 420,496 $2,340 217% $983,860,799
Mountain Pacific $3,585 160% 32,588 $5,951 391% 198,130 $2,366 231% $468,795,372
Average $2,830 146% $5,313 364% $2,483 218%
Total 532,754 1,806,407 $4,485,035,101
Total US Only 448,898 1,675,476 $4,127,163,659
Cost of Non-Competitive Rates Details for Chemicals or Allied Products-STCC 28
Commodity STCC
Carloads Below
180% RVC
Percent of Total Carloads
Carloads Above
180% RVC
Percent of Total Carloads Premium
28211-Plastic Materials, Exc. Fabricated Plastic Prod. 151,552 29% 369,576 71% $1,199,505,303
28184-Alcohols 116,488 25% 346,656 75% $575,142,215
28123-Sodium Compounds, Exc. Sodium Alkalies 19,868 14% 123,637 86% $290,265,372
28128-Chlorine 2,716 7% 35,476 93% $217,942,768
28198-Anhydrous Ammonia 1,304 3% 37,304 97% $179,002,004
28125-Potassium Compounds, Exc. Potassium Alkalies 50,208 34% 98,496 66% $166,961,519
28181-Misc. Acyclic Organic Chemical, Exc. Organic Dyes 10,858 14% 67,914 86% $152,871,895
28186-Organic Acids or Salts, Exc. Acid Dyes 5,200 11% 42,696 89% $150,104,377
28185-Glycols or Glycerines 12,044 28% 31,188 72% $116,113,136
28122-Sodium Alkalies Sodium Compounds 8,920 14% 55,552 86% $110,854,504
28151-Cyclic Intermediates Benzene/Toluene/Other Cyclic Chemical Prod.
5,200 12% 38,796 88% $108,374,405
28713-Ammoniating Fertilizer Solution 11,332 17% 57,048 83% $98,808,890
28182-Misc. Acyclic Organic Chemical, Exc. Organic Dyes 1,640 7% 20,408 93% $97,705,775
28712-Super Phosphate 24,876 24% 77,699 76% $94,648,887
28193-Sulphuric Acid 19,636 25% 58,741 75% $93,060,805
28199-Industrial Inorganic Chemicals 3,616 12% 26,612 88% $71,669,002
28714-Misc. Fertilizer Compounds 7,452 22% 25,724 78% $71,411,755
28194-Industrial Inorganic Acids, Exc. Nitric 8,200 21% 30,920 79% $64,838,106
28996-Blacks 160 1% 15,320 99% $57,447,765
28139-Industrial Gases, (Compressed, Solid or Liquefied) 12,200 37% 20,960 63% $54,278,369
28999-Chemical Prod., Exc. Sealants 2,400 12% 18,220 88% $43,119,058
28183-Misc. Cyclic Chemical Prod. 5,080 26% 14,620 74% $37,730,442
28994-Fatty Acids 8,024 29% 19,868 71% $37,422,226
21
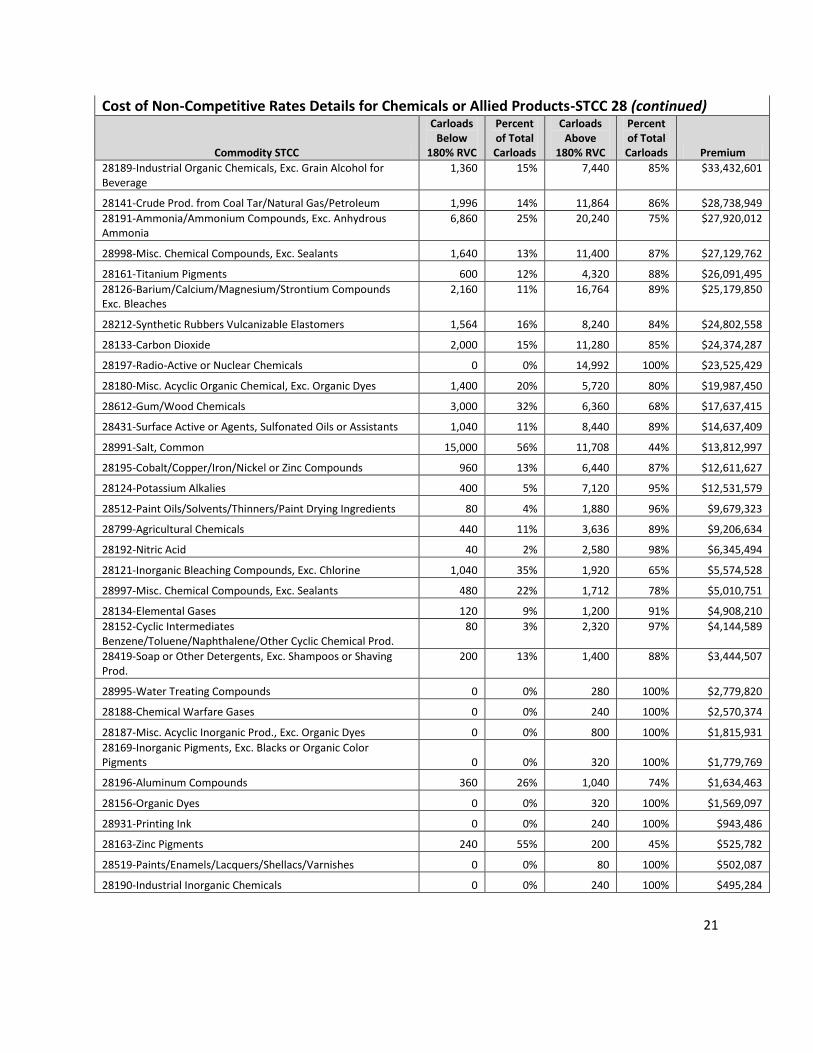
Cost of Non-Competitive Rates Details for Chemicals or Allied Products-STCC 28 (continued)
Commodity STCC
Carloads Below
180% RVC
Percent of Total Carloads
Carloads Above
180% RVC
Percent of Total Carloads Premium
28189-Industrial Organic Chemicals, Exc. Grain Alcohol for Beverage
1,360 15% 7,440 85% $33,432,601
28141-Crude Prod. from Coal Tar/Natural Gas/Petroleum 1,996 14% 11,864 86% $28,738,949
28191-Ammonia/Ammonium Compounds, Exc. Anhydrous Ammonia
6,860 25% 20,240 75% $27,920,012
28998-Misc. Chemical Compounds, Exc. Sealants 1,640 13% 11,400 87% $27,129,762
28161-Titanium Pigments 600 12% 4,320 88% $26,091,495
28126-Barium/Calcium/Magnesium/Strontium Compounds Exc. Bleaches
2,160 11% 16,764 89% $25,179,850
28212-Synthetic Rubbers Vulcanizable Elastomers 1,564 16% 8,240 84% $24,802,558
28133-Carbon Dioxide 2,000 15% 11,280 85% $24,374,287
28197-Radio-Active or Nuclear Chemicals 0 0% 14,992 100% $23,525,429
28180-Misc. Acyclic Organic Chemical, Exc. Organic Dyes 1,400 20% 5,720 80% $19,987,450
28612-Gum/Wood Chemicals 3,000 32% 6,360 68% $17,637,415
28431-Surface Active or Agents, Sulfonated Oils or Assistants 1,040 11% 8,440 89% $14,637,409
28991-Salt, Common 15,000 56% 11,708 44% $13,812,997
28195-Cobalt/Copper/Iron/Nickel or Zinc Compounds 960 13% 6,440 87% $12,611,627
28124-Potassium Alkalies 400 5% 7,120 95% $12,531,579
28512-Paint Oils/Solvents/Thinners/Paint Drying Ingredients 80 4% 1,880 96% $9,679,323
28799-Agricultural Chemicals 440 11% 3,636 89% $9,206,634
28192-Nitric Acid 40 2% 2,580 98% $6,345,494
28121-Inorganic Bleaching Compounds, Exc. Chlorine 1,040 35% 1,920 65% $5,574,528
28997-Misc. Chemical Compounds, Exc. Sealants 480 22% 1,712 78% $5,010,751
28134-Elemental Gases 120 9% 1,200 91% $4,908,210
28152-Cyclic Intermediates Benzene/Toluene/Naphthalene/Other Cyclic Chemical Prod.
80 3% 2,320 97% $4,144,589
28419-Soap or Other Detergents, Exc. Shampoos or Shaving Prod.
200 13% 1,400 88% $3,444,507
28995-Water Treating Compounds 0 0% 280 100% $2,779,820
28188-Chemical Warfare Gases 0 0% 240 100% $2,570,374
28187-Misc. Acyclic Inorganic Prod., Exc. Organic Dyes 0 0% 800 100% $1,815,931
28169-Inorganic Pigments, Exc. Blacks or Organic Color Pigments 0 0% 320 100% $1,779,769
28196-Aluminum Compounds 360 26% 1,040 74% $1,634,463
28156-Organic Dyes 0 0% 320 100% $1,569,097
28931-Printing Ink 0 0% 240 100% $943,486
28163-Zinc Pigments 240 55% 200 45% $525,782
28519-Paints/Enamels/Lacquers/Shellacs/Varnishes 0 0% 80 100% $502,087
28190-Industrial Inorganic Chemicals 0 0% 240 100% $495,284
22
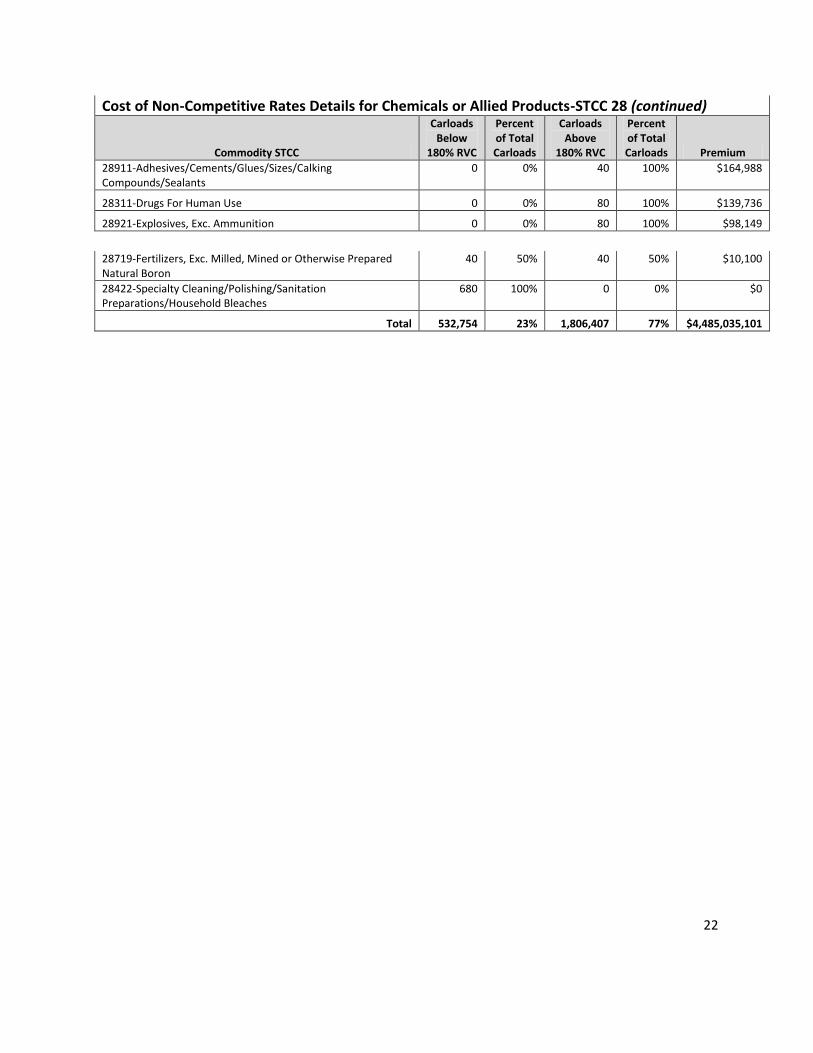
Cost of Non-Competitive Rates Details for Chemicals or Allied Products-STCC 28 (continued)
Commodity STCC
Carloads Below
180% RVC
Percent of Total Carloads
Carloads Above
180% RVC
Percent of Total Carloads Premium
28911-Adhesives/Cements/Glues/Sizes/Calking Compounds/Sealants
0 0% 40 100% $164,988
28311-Drugs For Human Use 0 0% 80 100% $139,736
28921-Explosives, Exc. Ammunition 0 0% 80 100% $98,149
28719-Fertilizers, Exc. Milled, Mined or Otherwise Prepared Natural Boron
40 50% 40 50% $10,100
28422-Specialty Cleaning/Polishing/Sanitation Preparations/Household Bleaches
680 100% 0 0% $0
Total 532,754 23% 1,806,407 77% $4,485,035,101
23
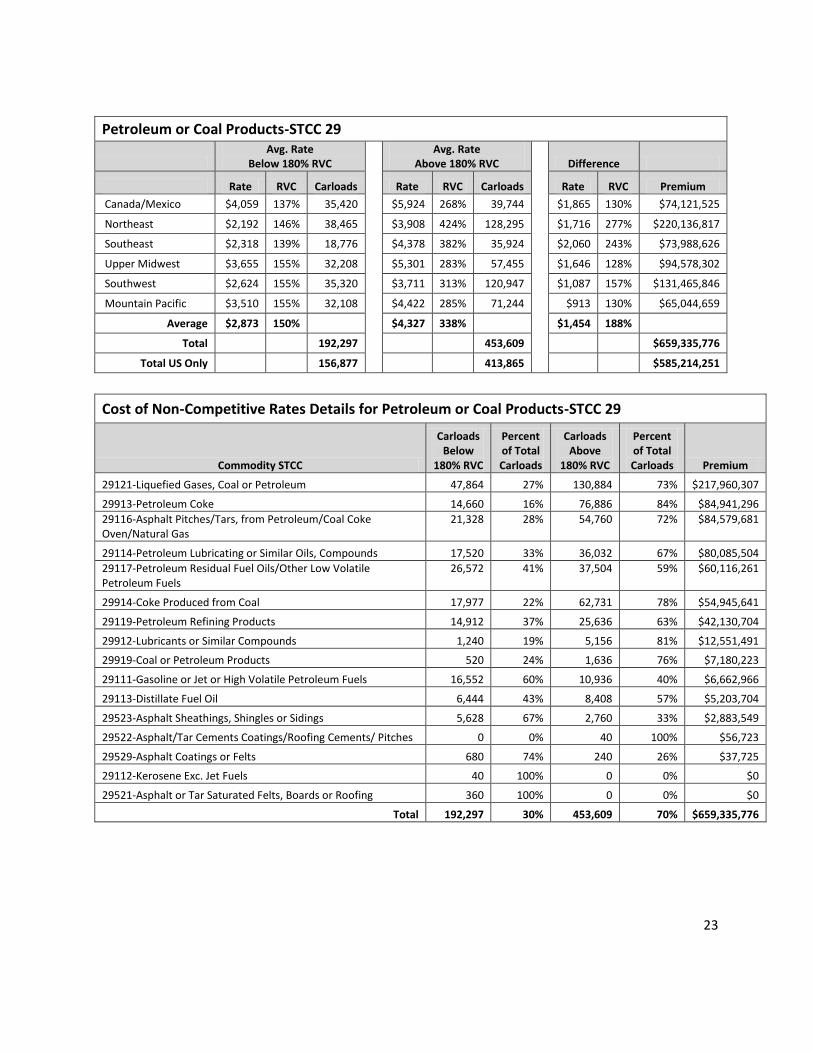
Petroleum or Coal Products-STCC 29
Avg. Rate
Below 180% RVC Avg. Rate
Above 180% RVC Difference
Rate RVC Carloads Rate RVC Carloads Rate RVC Premium
Canada/Mexico $4,059 137% 35,420 $5,924 268% 39,744 $1,865 130% $74,121,525
Northeast $2,192 146% 38,465 $3,908 424% 128,295 $1,716 277% $220,136,817
Southeast $2,318 139% 18,776 $4,378 382% 35,924 $2,060 243% $73,988,626
Upper Midwest $3,655 155% 32,208 $5,301 283% 57,455 $1,646 128% $94,578,302
Southwest $2,624 155% 35,320 $3,711 313% 120,947 $1,087 157% $131,465,846
Mountain Pacific $3,510 155% 32,108 $4,422 285% 71,244 $913 130% $65,044,659
Average $2,873 150% $4,327 338% $1,454 188%
Total 192,297 453,609 $659,335,776
Total US Only 156,877 413,865 $585,214,251
Cost of Non-Competitive Rates Details for Petroleum or Coal Products-STCC 29
Commodity STCC
Carloads Below
180% RVC
Percent of Total Carloads
Carloads Above
180% RVC
Percent of Total Carloads Premium
29121-Liquefied Gases, Coal or Petroleum 47,864 27% 130,884 73% $217,960,307
29913-Petroleum Coke 14,660 16% 76,886 84% $84,941,296
29116-Asphalt Pitches/Tars, from Petroleum/Coal Coke Oven/Natural Gas
21,328 28% 54,760 72% $84,579,681
29114-Petroleum Lubricating or Similar Oils, Compounds 17,520 33% 36,032 67% $80,085,504
29117-Petroleum Residual Fuel Oils/Other Low Volatile Petroleum Fuels
26,572 41% 37,504 59% $60,116,261
29914-Coke Produced from Coal 17,977 22% 62,731 78% $54,945,641
29119-Petroleum Refining Products 14,912 37% 25,636 63% $42,130,704
29912-Lubricants or Similar Compounds 1,240 19% 5,156 81% $12,551,491
29919-Coal or Petroleum Products 520 24% 1,636 76% $7,180,223
29111-Gasoline or Jet or High Volatile Petroleum Fuels 16,552 60% 10,936 40% $6,662,966
29113-Distillate Fuel Oil 6,444 43% 8,408 57% $5,203,704
29523-Asphalt Sheathings, Shingles or Sidings 5,628 67% 2,760 33% $2,883,549
29522-Asphalt/Tar Cements Coatings/Roofing Cements/ Pitches 0 0% 40 100% $56,723
29529-Asphalt Coatings or Felts 680 74% 240 26% $37,725
29112-Kerosene Exc. Jet Fuels 40 100% 0 0% $0
29521-Asphalt or Tar Saturated Felts, Boards or Roofing 360 100% 0 0% $0
Total 192,297 30% 453,609 70% $659,335,776
24
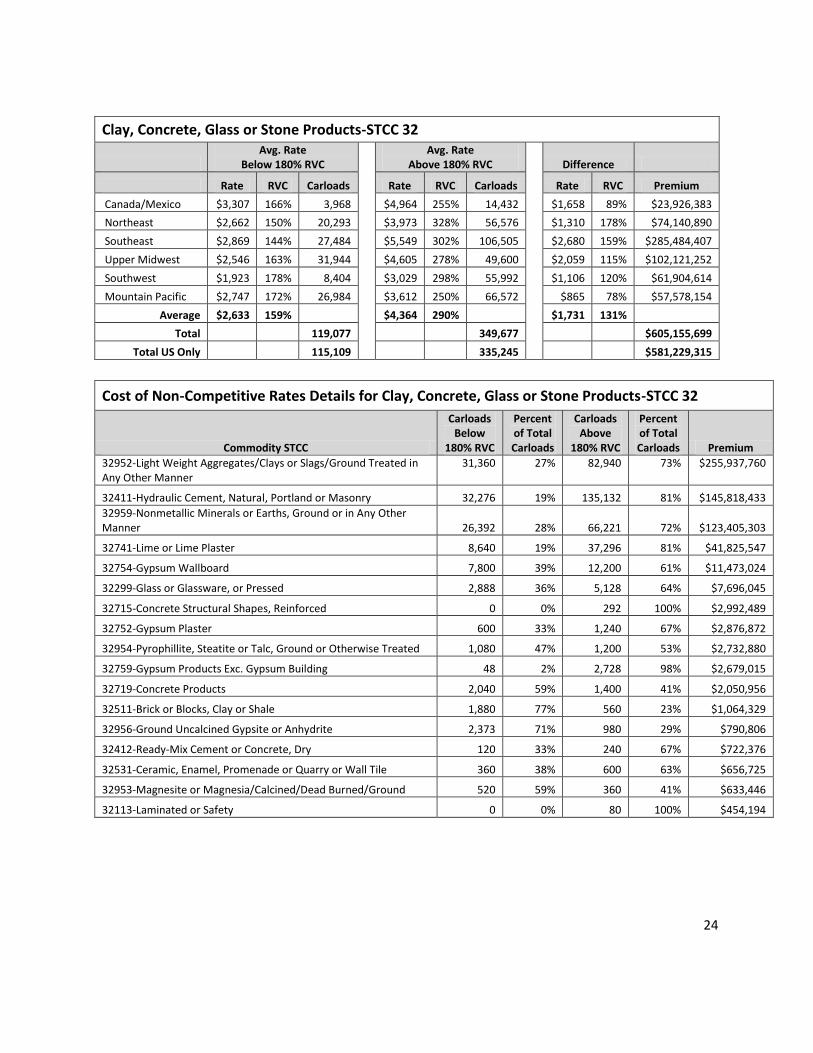
Clay, Concrete, Glass or Stone Products-STCC 32
Avg. Rate
Below 180% RVC Avg. Rate
Above 180% RVC Difference
Rate RVC Carloads Rate RVC Carloads Rate RVC Premium
Canada/Mexico $3,307 166% 3,968 $4,964 255% 14,432 $1,658 89% $23,926,383
Northeast $2,662 150% 20,293 $3,973 328% 56,576 $1,310 178% $74,140,890
Southeast $2,869 144% 27,484 $5,549 302% 106,505 $2,680 159% $285,484,407
Upper Midwest $2,546 163% 31,944 $4,605 278% 49,600 $2,059 115% $102,121,252
Southwest $1,923 178% 8,404 $3,029 298% 55,992 $1,106 120% $61,904,614
Mountain Pacific $2,747 172% 26,984 $3,612 250% 66,572 $865 78% $57,578,154
Average $2,633 159% $4,364 290% $1,731 131%
Total 119,077 349,677 $605,155,699
Total US Only 115,109 335,245 $581,229,315
Cost of Non-Competitive Rates Details for Clay, Concrete, Glass or Stone Products-STCC 32
Commodity STCC
Carloads Below
180% RVC
Percent of Total Carloads
Carloads Above
180% RVC
Percent of Total Carloads Premium
32952-Light Weight Aggregates/Clays or Slags/Ground Treated in Any Other Manner
31,360 27% 82,940 73% $255,937,760
32411-Hydraulic Cement, Natural, Portland or Masonry 32,276 19% 135,132 81% $145,818,433
32959-Nonmetallic Minerals or Earths, Ground or in Any Other Manner 26,392 28% 66,221 72% $123,405,303
32741-Lime or Lime Plaster 8,640 19% 37,296 81% $41,825,547
32754-Gypsum Wallboard 7,800 39% 12,200 61% $11,473,024
32299-Glass or Glassware, or Pressed 2,888 36% 5,128 64% $7,696,045
32715-Concrete Structural Shapes, Reinforced 0 0% 292 100% $2,992,489
32752-Gypsum Plaster 600 33% 1,240 67% $2,876,872
32954-Pyrophillite, Steatite or Talc, Ground or Otherwise Treated 1,080 47% 1,200 53% $2,732,880
32759-Gypsum Products Exc. Gypsum Building 48 2% 2,728 98% $2,679,015
32719-Concrete Products 2,040 59% 1,400 41% $2,050,956
32511-Brick or Blocks, Clay or Shale 1,880 77% 560 23% $1,064,329
32956-Ground Uncalcined Gypsite or Anhydrite 2,373 71% 980 29% $790,806
32412-Ready-Mix Cement or Concrete, Dry 120 33% 240 67% $722,376
32531-Ceramic, Enamel, Promenade or Quarry or Wall Tile 360 38% 600 63% $656,725
32953-Magnesite or Magnesia/Calcined/Dead Burned/Ground 520 59% 360 41% $633,446
32113-Laminated or Safety 0 0% 80 100% $454,194
25
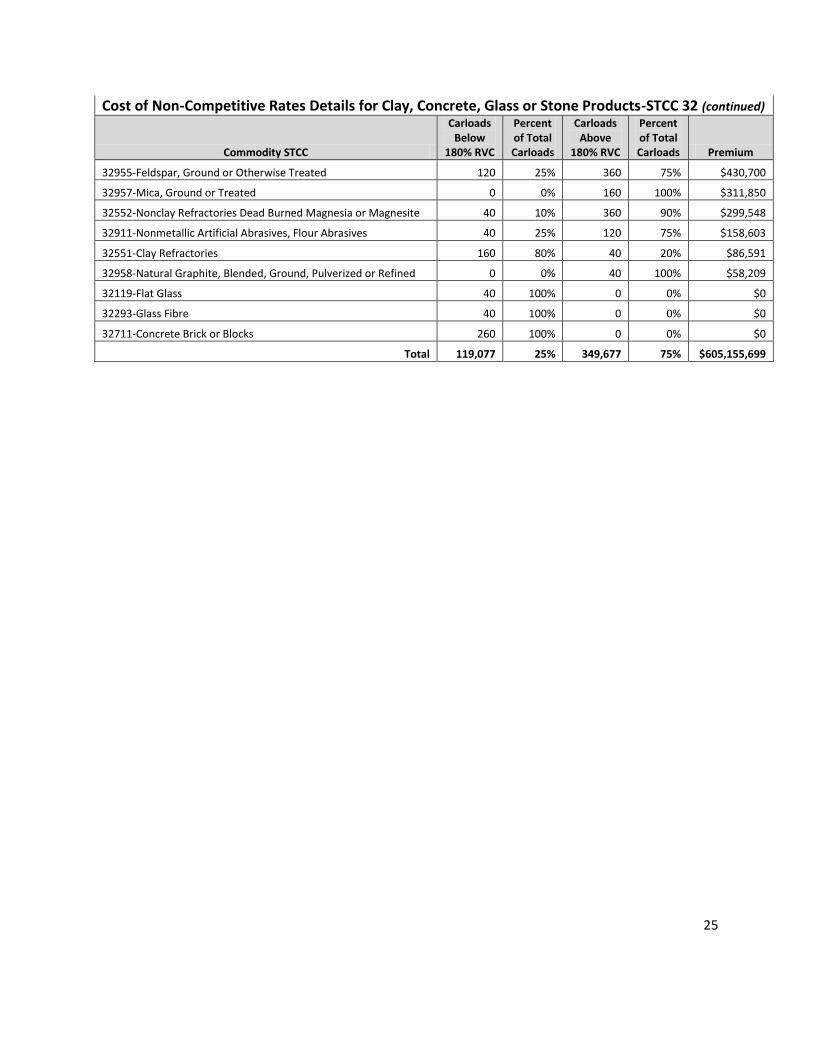
Cost of Non-Competitive Rates Details for Clay, Concrete, Glass or Stone Products-STCC 32 (continued)
Commodity STCC
Carloads Below
180% RVC
Percent of Total Carloads
Carloads Above
180% RVC
Percent of Total Carloads Premium
32955-Feldspar, Ground or Otherwise Treated 120 25% 360 75% $430,700
32957-Mica, Ground or Treated 0 0% 160 100% $311,850
32552-Nonclay Refractories Dead Burned Magnesia or Magnesite 40 10% 360 90% $299,548
32911-Nonmetallic Artificial Abrasives, Flour Abrasives 40 25% 120 75% $158,603
32551-Clay Refractories 160 80% 40 20% $86,591
32958-Natural Graphite, Blended, Ground, Pulverized or Refined 0 0% 40 100% $58,209
32119-Flat Glass 40 100% 0 0% $0
32293-Glass Fibre 40 100% 0 0% $0
32711-Concrete Brick or Blocks 260 100% 0 0% $0
Total 119,077 25% 349,677 75% $605,155,699
26
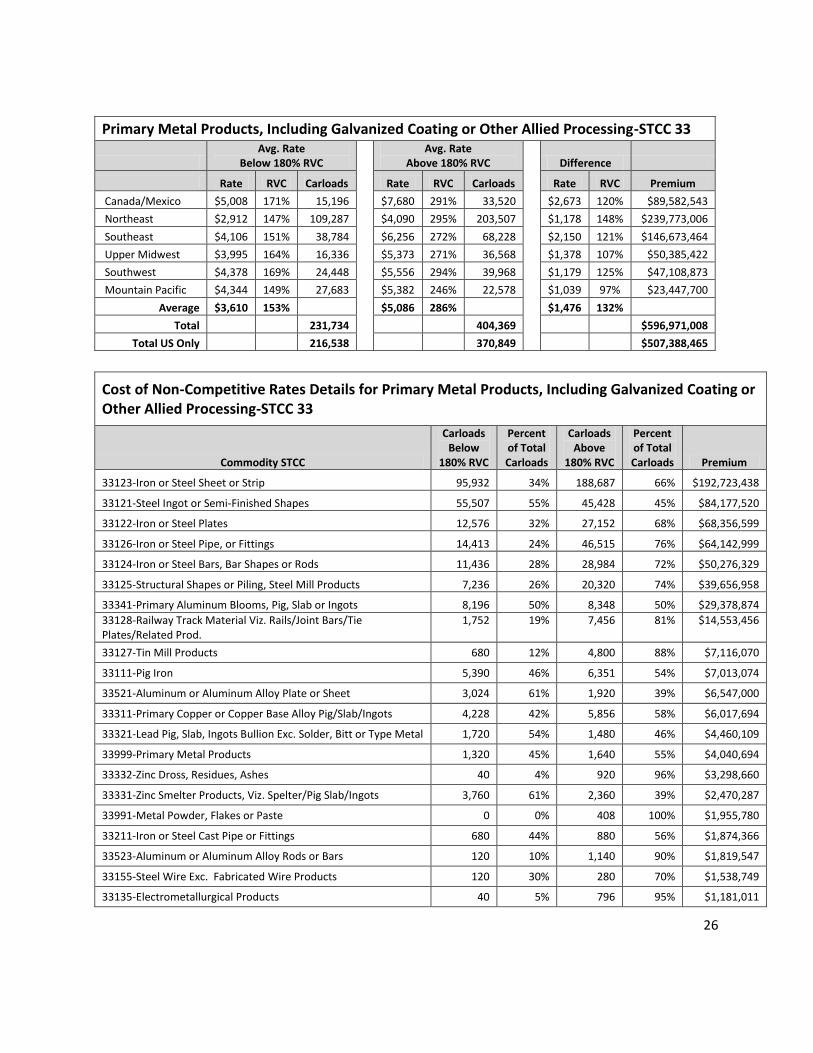
Primary Metal Products, Including Galvanized Coating or Other Allied Processing-STCC 33
Avg. Rate
Below 180% RVC Avg. Rate
Above 180% RVC Difference
Rate RVC Carloads Rate RVC Carloads Rate RVC Premium
Canada/Mexico $5,008 171% 15,196 $7,680 291% 33,520 $2,673 120% $89,582,543
Northeast $2,912 147% 109,287 $4,090 295% 203,507 $1,178 148% $239,773,006
Southeast $4,106 151% 38,784 $6,256 272% 68,228 $2,150 121% $146,673,464
Upper Midwest $3,995 164% 16,336 $5,373 271% 36,568 $1,378 107% $50,385,422
Southwest $4,378 169% 24,448 $5,556 294% 39,968 $1,179 125% $47,108,873
Mountain Pacific $4,344 149% 27,683 $5,382 246% 22,578 $1,039 97% $23,447,700
Average $3,610 153% $5,086 286% $1,476 132%
Total 231,734 404,369 $596,971,008
Total US Only 216,538 370,849 $507,388,465
Cost of Non-Competitive Rates Details for Primary Metal Products, Including Galvanized Coating or Other Allied Processing-STCC 33
Commodity STCC
Carloads Below
180% RVC
Percent of Total Carloads
Carloads Above
180% RVC
Percent of Total Carloads Premium
33123-Iron or Steel Sheet or Strip 95,932 34% 188,687 66% $192,723,438
33121-Steel Ingot or Semi-Finished Shapes 55,507 55% 45,428 45% $84,177,520
33122-Iron or Steel Plates 12,576 32% 27,152 68% $68,356,599
33126-Iron or Steel Pipe, or Fittings 14,413 24% 46,515 76% $64,142,999
33124-Iron or Steel Bars, Bar Shapes or Rods 11,436 28% 28,984 72% $50,276,329
33125-Structural Shapes or Piling, Steel Mill Products 7,236 26% 20,320 74% $39,656,958
33341-Primary Aluminum Blooms, Pig, Slab or Ingots 8,196 50% 8,348 50% $29,378,874
33128-Railway Track Material Viz. Rails/Joint Bars/Tie Plates/Related Prod.
1,752 19% 7,456 81% $14,553,456
33127-Tin Mill Products 680 12% 4,800 88% $7,116,070
33111-Pig Iron 5,390 46% 6,351 54% $7,013,074
33521-Aluminum or Aluminum Alloy Plate or Sheet 3,024 61% 1,920 39% $6,547,000
33311-Primary Copper or Copper Base Alloy Pig/Slab/Ingots 4,228 42% 5,856 58% $6,017,694
33321-Lead Pig, Slab, Ingots Bullion Exc. Solder, Bitt or Type Metal 1,720 54% 1,480 46% $4,460,109
33999-Primary Metal Products 1,320 45% 1,640 55% $4,040,694
33332-Zinc Dross, Residues, Ashes 40 4% 920 96% $3,298,660
33331-Zinc Smelter Products, Viz. Spelter/Pig Slab/Ingots 3,760 61% 2,360 39% $2,470,287
33991-Metal Powder, Flakes or Paste 0 0% 408 100% $1,955,780
33211-Iron or Steel Cast Pipe or Fittings 680 44% 880 56% $1,874,366
33523-Aluminum or Aluminum Alloy Rods or Bars 120 10% 1,140 90% $1,819,547
33155-Steel Wire Exc. Fabricated Wire Products 120 30% 280 70% $1,538,749
33135-Electrometallurgical Products 40 5% 796 95% $1,181,011
27
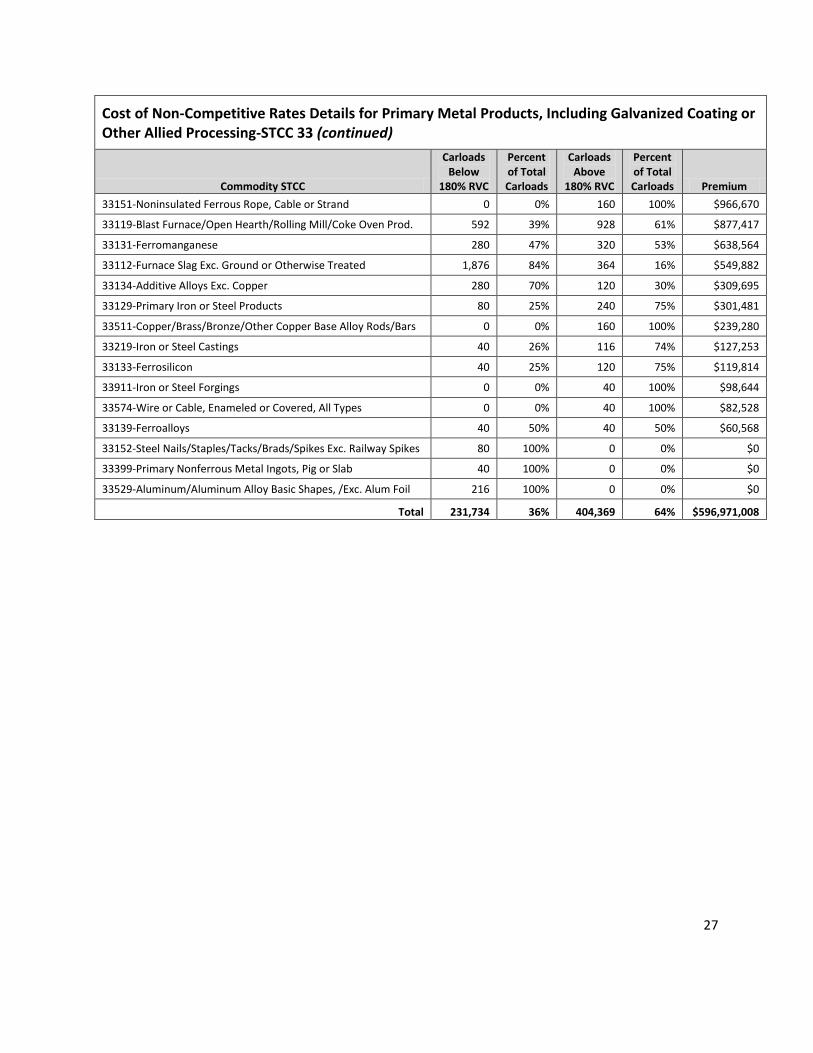
Cost of Non-Competitive Rates Details for Primary Metal Products, Including Galvanized Coating or Other Allied Processing-STCC 33 (continued)
Commodity STCC
Carloads Below
180% RVC
Percent of Total Carloads
Carloads Above
180% RVC
Percent of Total Carloads Premium
33151-Noninsulated Ferrous Rope, Cable or Strand 0 0% 160 100% $966,670
33119-Blast Furnace/Open Hearth/Rolling Mill/Coke Oven Prod. 592 39% 928 61% $877,417
33131-Ferromanganese 280 47% 320 53% $638,564
33112-Furnace Slag Exc. Ground or Otherwise Treated 1,876 84% 364 16% $549,882
33134-Additive Alloys Exc. Copper 280 70% 120 30% $309,695
33129-Primary Iron or Steel Products 80 25% 240 75% $301,481
33511-Copper/Brass/Bronze/Other Copper Base Alloy Rods/Bars 0 0% 160 100% $239,280
33219-Iron or Steel Castings 40 26% 116 74% $127,253
33133-Ferrosilicon 40 25% 120 75% $119,814
33911-Iron or Steel Forgings 0 0% 40 100% $98,644
33574-Wire or Cable, Enameled or Covered, All Types 0 0% 40 100% $82,528
33139-Ferroalloys 40 50% 40 50% $60,568
33152-Steel Nails/Staples/Tacks/Brads/Spikes Exc. Railway Spikes 80 100% 0 0% $0
33399-Primary Nonferrous Metal Ingots, Pig or Slab 40 100% 0 0% $0
33529-Aluminum/Aluminum Alloy Basic Shapes, /Exc. Alum Foil 216 100% 0 0% $0
Total 231,734 36% 404,369 64% $596,971,008
28
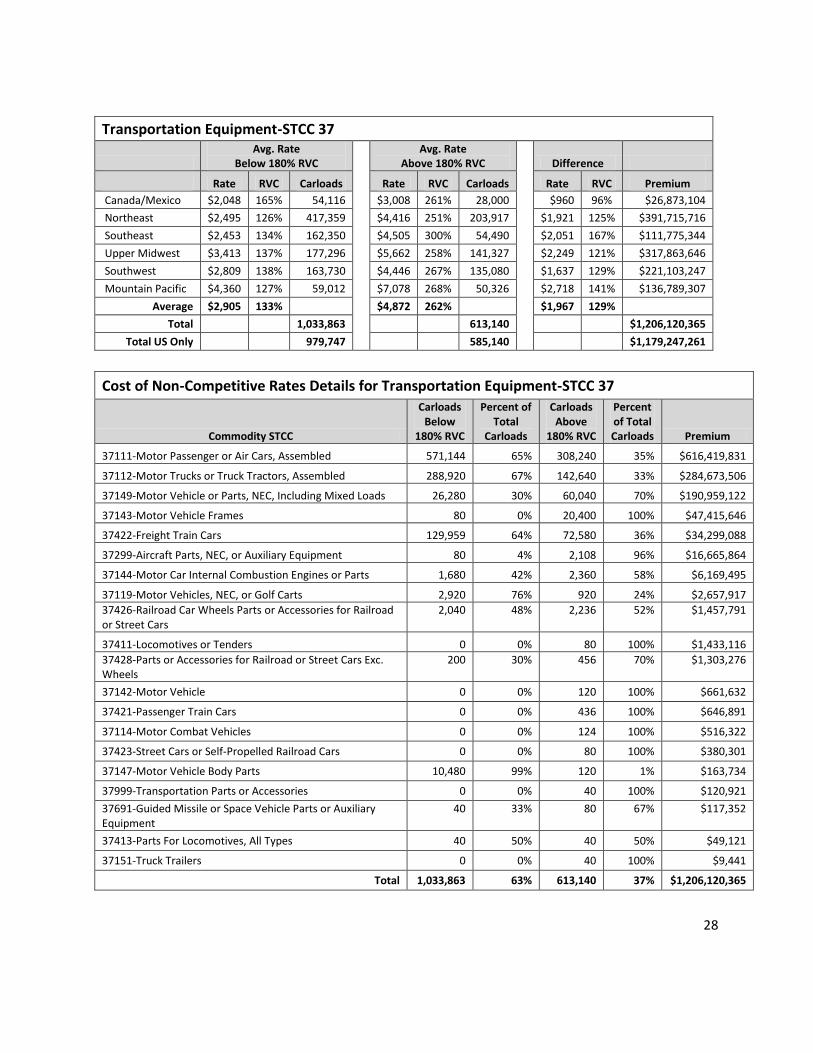
Transportation Equipment-STCC 37
Avg. Rate
Below 180% RVC Avg. Rate
Above 180% RVC Difference
Rate RVC Carloads Rate RVC Carloads Rate RVC Premium
Canada/Mexico $2,048 165% 54,116 $3,008 261% 28,000 $960 96% $26,873,104
Northeast $2,495 126% 417,359 $4,416 251% 203,917 $1,921 125% $391,715,716
Southeast $2,453 134% 162,350 $4,505 300% 54,490 $2,051 167% $111,775,344
Upper Midwest $3,413 137% 177,296 $5,662 258% 141,327 $2,249 121% $317,863,646
Southwest $2,809 138% 163,730 $4,446 267% 135,080 $1,637 129% $221,103,247
Mountain Pacific $4,360 127% 59,012 $7,078 268% 50,326 $2,718 141% $136,789,307
Average $2,905 133% $4,872 262% $1,967 129%
Total 1,033,863 613,140 $1,206,120,365
Total US Only 979,747 585,140 $1,179,247,261
Cost of Non-Competitive Rates Details for Transportation Equipment-STCC 37
Commodity STCC
Carloads Below
180% RVC
Percent of Total
Carloads
Carloads Above
180% RVC
Percent of Total Carloads Premium
37111-Motor Passenger or Air Cars, Assembled 571,144 65% 308,240 35% $616,419,831
37112-Motor Trucks or Truck Tractors, Assembled 288,920 67% 142,640 33% $284,673,506
37149-Motor Vehicle or Parts, NEC, Including Mixed Loads 26,280 30% 60,040 70% $190,959,122
37143-Motor Vehicle Frames 80 0% 20,400 100% $47,415,646
37422-Freight Train Cars 129,959 64% 72,580 36% $34,299,088
37299-Aircraft Parts, NEC, or Auxiliary Equipment 80 4% 2,108 96% $16,665,864
37144-Motor Car Internal Combustion Engines or Parts 1,680 42% 2,360 58% $6,169,495
37119-Motor Vehicles, NEC, or Golf Carts 2,920 76% 920 24% $2,657,917
37426-Railroad Car Wheels Parts or Accessories for Railroad or Street Cars
2,040 48% 2,236 52% $1,457,791
37411-Locomotives or Tenders 0 0% 80 100% $1,433,116
37428-Parts or Accessories for Railroad or Street Cars Exc. Wheels
200 30% 456 70% $1,303,276
37142-Motor Vehicle 0 0% 120 100% $661,632
37421-Passenger Train Cars 0 0% 436 100% $646,891
37114-Motor Combat Vehicles 0 0% 124 100% $516,322
37423-Street Cars or Self-Propelled Railroad Cars 0 0% 80 100% $380,301
37147-Motor Vehicle Body Parts 10,480 99% 120 1% $163,734
37999-Transportation Parts or Accessories 0 0% 40 100% $120,921
37691-Guided Missile or Space Vehicle Parts or Auxiliary Equipment
40 33% 80 67% $117,352
37413-Parts For Locomotives, All Types 40 50% 40 50% $49,121
37151-Truck Trailers 0 0% 40 100% $9,441
Total 1,033,863 63% 613,140 37% $1,206,120,365