Embed Size (px)
Citation preview
Evaluation of fi360 Fiduciary Score®
Analysis of fi360 Fiduciary Score®:
“Red is STOP, Green is GO”
January 27, 2017
Contact: G. Michael Phillips, Ph.D. Director, Center for Financial Planning & Investment David Nazarian College of Business and Economics California State University, Northridge [email protected]
Evaluation of fi360 Fiduciary Score®
Table of Contents
EXECUTIVE SUMMARY .......................................................................................................................................... 3
INTRODUCTION TO fi360 FIDUCIARY SCORE® ...................................................................................................... 4
fi360 FIDUCIARY SCORE® EVALUATED .................................................................................................................. 5
VARIABLES USED TO EVALUATE fi360 FIDUCIARY SCORE® ................................................................................... 6
ONE‐YEAR FORWARD HORIZON ANALYSIS ........................................................................................................... 7
THREE‐YEAR FORWARD HORIZON ANALYSIS ...................................................................................................... 12
FIVE‐YEAR FORWARD HORIZON ANALYSIS ......................................................................................................... 17
STABILITY ANALYSIS ............................................................................................................................................ 22
CONCLUSION ....................................................................................................................................................... 26
APPENDIX ............................................................................................................................................................ 27
Evaluation of fi360 Fiduciary Score®
EXECUTIVE SUMMARY
Economists affiliated with the Center for Financial Planning & Investment (CFPI) analyzed the observed
relationship between “color groups” of fi360 Fiduciary Score® as predictors of future outcomes, and
confirmed that the top groups (“Green” and “Light Green”) consistently provide better results than the other
averages and categories in several dimensions. The first and second quartiles of the one‐, three‐ and five‐year
average Score (Green and Light Green) demonstrated higher median returns when looking at one‐year,
three‐year, and five‐year future annualized returns. They also exhibited higher median annualized return to
standard deviation (and lower semideviation) ratios over the same one‐, three‐, five‐year forecasting
horizons.
In 2013, CFPI used data from December 31, 2000 through March 31, 2013 to evaluate fi360 Fiduciary Score®
for mutual funds and assess the measure’s effectiveness as a screening criterion. Now with updated data
from December 31, 2000 through July 31, 2016, CFPI has conducted a revised assessment of fi360 Fiduciary
Score® for mutual funds. From December 31, 2000 through the end of 2010 the periods are on a quarterly
basis. From January of 2011 through July 31, 2016 the periods are on a monthly basis. Through this revised
assessment, we again find that the Score has statistically significant content and is useful as part of a mutual
fund portfolio construction process.
With historical Score data provided for approximately 2.35 million fund‐date observations, CFPI utilized the
date‐current (a.k.a. “spot”) Score, the one‐year average Score, the three‐year average Score and the five‐year
average Score for all funds in the evaluation. For each date, we also computed the one‐year, three‐year, and
five‐year future annualized returns, forward standard deviation of returns, and forward lower semideviation
of returns observed for each fund in the time period following the historical observation date. By integrating
these forward data (“future outcomes”) with the spot Score and average Score (the “predicting data”), the
resulting database facilitated powerful forward‐looking testing of returns and empirical risk over one‐, three‐,
and five‐year future time horizons.1,2 Expanding upon our 2013 assessment, this analysis utilizes the means
and medians of the future annualized returns, standard deviation of returns and lower semideviation of
returns observed. This assessment also includes a stability analysis of the Score.
1 The current database only includes currently traded mutual funds. Any fund which has stopped trading or has closed will not be included in the returns analysis though they are included in the stability analysis. 2 A 10‐year future time horizon analysis is not performed because of inadequate history.
Evaluation of fi360 Fiduciary Score®
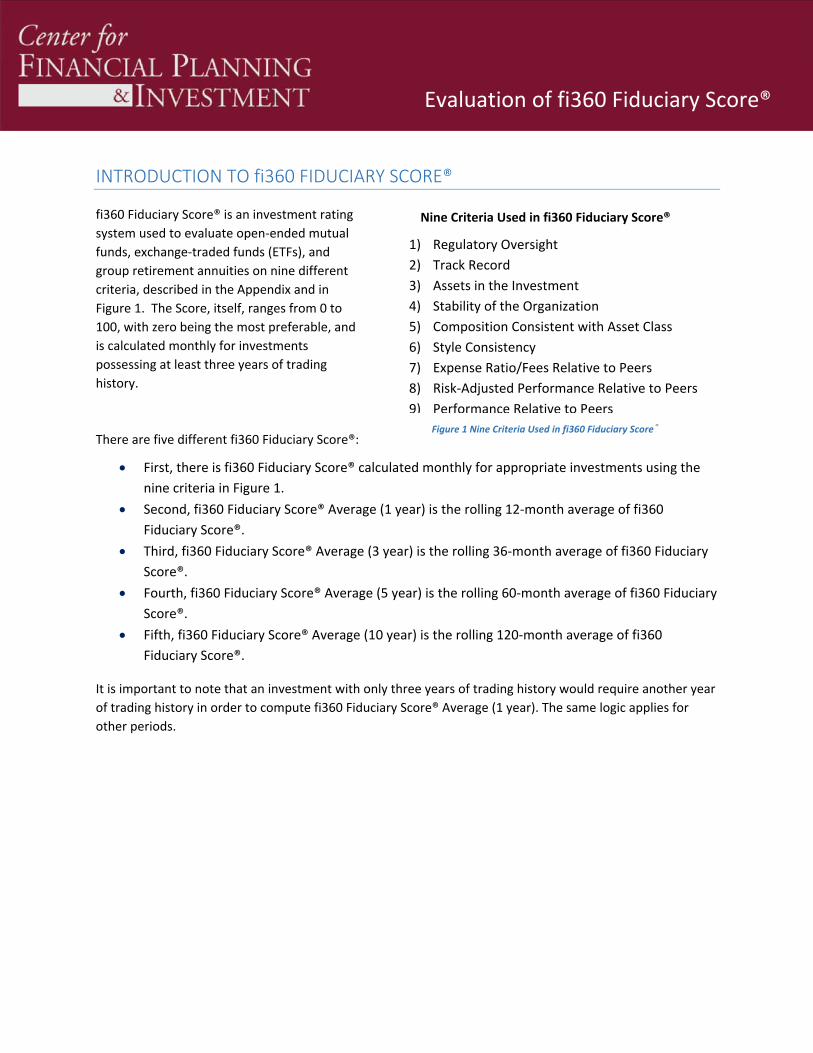
INTRODUCTION TO fi360 FIDUCIARY SCORE®
fi360 Fiduciary Score® is an investment rating
system used to evaluate open‐ended mutual
funds, exchange‐traded funds (ETFs), and
group retirement annuities on nine different
criteria, described in the Appendix and in
Figure 1. The Score, itself, ranges from 0 to
100, with zero being the most preferable, and
is calculated monthly for investments
possessing at least three years of trading
history.
There are five different fi360 Fiduciary Score®:
First, there is fi360 Fiduciary Score® calculated monthly for appropriate investments using the
nine criteria in Figure 1.
Second, fi360 Fiduciary Score® Average (1 year) is the rolling 12‐month average of fi360
Fiduciary Score®.
Third, fi360 Fiduciary Score® Average (3 year) is the rolling 36‐month average of fi360 Fiduciary
Score®.
Fourth, fi360 Fiduciary Score® Average (5 year) is the rolling 60‐month average of fi360 Fiduciary
Score®.
Fifth, fi360 Fiduciary Score® Average (10 year) is the rolling 120‐month average of fi360
Fiduciary Score®.
It is important to note that an investment with only three years of trading history would require another year
of trading history in order to compute fi360 Fiduciary Score® Average (1 year). The same logic applies for
other periods.
Nine Criteria Used in fi360 Fiduciary Score®
1) Regulatory Oversight
2) Track Record
3) Assets in the Investment
4) Stability of the Organization
5) Composition Consistent with Asset Class
6) Style Consistency
7) Expense Ratio/Fees Relative to Peers
8) Risk‐Adjusted Performance Relative to Peers
9) Performance Relative to Peers
Figure 1 Nine Criteria Used in fi360 Fiduciary Score®
Evaluation of fi360 Fiduciary Score®
fi360 FIDUCIARY SCORE® EVALUATED
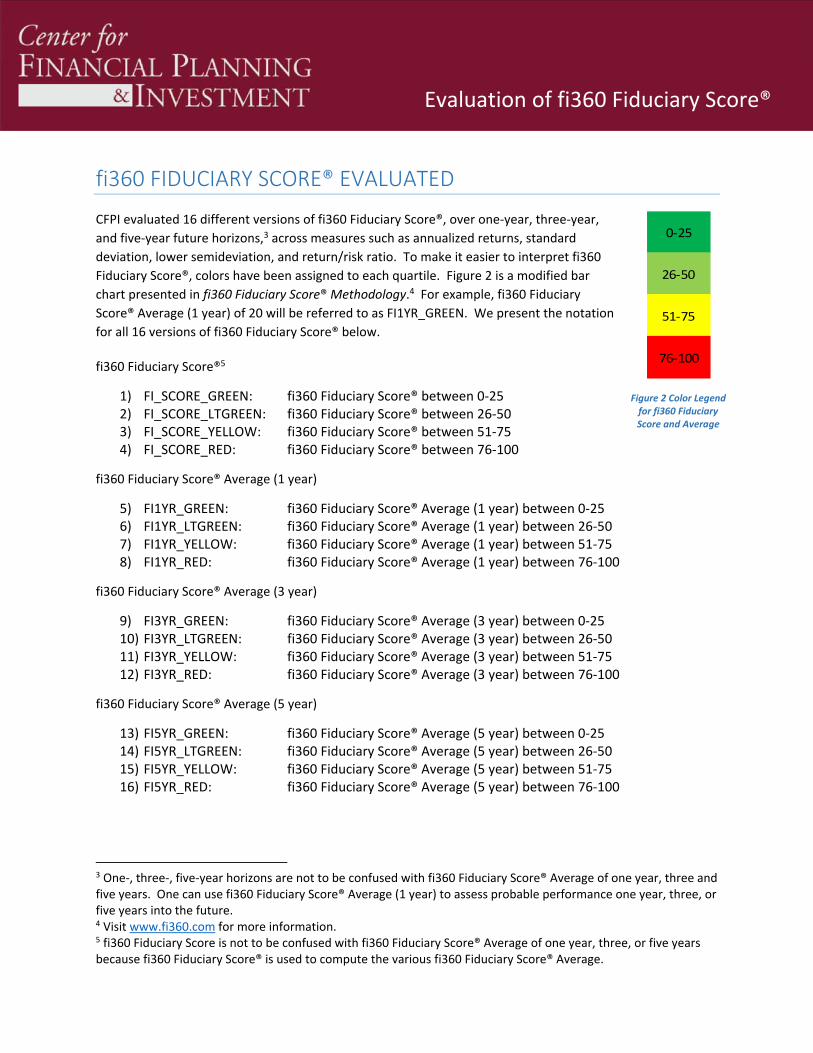
CFPI evaluated 16 different versions of fi360 Fiduciary Score®, over one‐year, three‐year,
and five‐year future horizons,3 across measures such as annualized returns, standard
deviation, lower semideviation, and return/risk ratio. To make it easier to interpret fi360
Fiduciary Score®, colors have been assigned to each quartile. Figure 2 is a modified bar
chart presented in fi360 Fiduciary Score® Methodology.4 For example, fi360 Fiduciary
Score® Average (1 year) of 20 will be referred to as FI1YR_GREEN. We present the notation
for all 16 versions of fi360 Fiduciary Score® below.
fi360 Fiduciary Score®5
1) FI_SCORE_GREEN: fi360 Fiduciary Score® between 0‐25 2) FI_SCORE_LTGREEN: fi360 Fiduciary Score® between 26‐50 3) FI_SCORE_YELLOW: fi360 Fiduciary Score® between 51‐75 4) FI_SCORE_RED: fi360 Fiduciary Score® between 76‐100
fi360 Fiduciary Score® Average (1 year)
5) FI1YR_GREEN: fi360 Fiduciary Score® Average (1 year) between 0‐25 6) FI1YR_LTGREEN: fi360 Fiduciary Score® Average (1 year) between 26‐50 7) FI1YR_YELLOW: fi360 Fiduciary Score® Average (1 year) between 51‐75 8) FI1YR_RED: fi360 Fiduciary Score® Average (1 year) between 76‐100
fi360 Fiduciary Score® Average (3 year)
9) FI3YR_GREEN: fi360 Fiduciary Score® Average (3 year) between 0‐25 10) FI3YR_LTGREEN: fi360 Fiduciary Score® Average (3 year) between 26‐50 11) FI3YR_YELLOW: fi360 Fiduciary Score® Average (3 year) between 51‐75 12) FI3YR_RED: fi360 Fiduciary Score® Average (3 year) between 76‐100
fi360 Fiduciary Score® Average (5 year)
13) FI5YR_GREEN: fi360 Fiduciary Score® Average (5 year) between 0‐25 14) FI5YR_LTGREEN: fi360 Fiduciary Score® Average (5 year) between 26‐50 15) FI5YR_YELLOW: fi360 Fiduciary Score® Average (5 year) between 51‐75 16) FI5YR_RED: fi360 Fiduciary Score® Average (5 year) between 76‐100
3 One‐, three‐, five‐year horizons are not to be confused with fi360 Fiduciary Score® Average of one year, three and five years. One can use fi360 Fiduciary Score® Average (1 year) to assess probable performance one year, three, or five years into the future. 4 Visit www.fi360.com for more information. 5 fi360 Fiduciary Score is not to be confused with fi360 Fiduciary Score® Average of one year, three, or five years because fi360 Fiduciary Score® is used to compute the various fi360 Fiduciary Score® Average.
0‐25
26‐50
51‐75
76‐100
Figure 2 Color Legend for fi360 Fiduciary Score and Average
Evaluation of fi360 Fiduciary Score®
VARIABLES USED TO EVALUATE fi360 FIDUCIARY SCORE®
Annualized Return. The annualized return formula is:
1
Standard Deviation. Standard deviation is a widely used
measure of risk. In this case, annualized standard deviation
was used for comparability. Standard deviation and
annualized standard deviation6 were used interchangeably
in this paper.
Lower Semideviation. Lower semideviation is considered a
better measure of risk than standard deviation because it
calculates the portion of the standard deviation generated
on days when the NAV goes down. It is more closely
associated with an investor’s definition of risk measuring
loss than standard deviation which treats both loss and gain
as “risk”. This analysis presents both standard deviation and
lower semideviation but places more emphasis on lower
semideviation.
Return/Risk. The return/risk ratio is calculated by dividing
annualized return by either the lower semideviation or
standard deviation. A higher ratio is preferable.
One‐, Three‐, and Five‐Year Horizons. These are future
looking observations, computed from the date associated
with each fi360 Fiduciary Score®. It should be stressed that
fi360 Fiduciary Score® and averages were based on historical
data whereas the variables (annualized return, standard
deviation, lower semideviation, and return/risk ratio) used
for assessment were based on future data, that is, data
observed after the calculation of fi360 Fiduciary Score®.
6 Annualized standard deviation is calculated by multiplying the daily standard deviation by the square root of the
number of trading days in a year: ( √260)
A technical note on some definitions …
Annualized Return vs. Annualized Mean Return vs.
Mean Return vs. Annual Return vs. Average Annual
Return vs. Total Return
Financial assessments often utilize several similar
sounding but technically different measures: annualized
return, annualized mean return, mean return, annual
return, average annual return, and total return. While
this report uses annualized return, the other measures
are discussed here for reference.
Annualized return is defined to the left. Annualized
mean return is calculated by multiplying daily mean
return by the number of trading days in a year:
∗ 260
Mean return is a simple arithmetic average of returns.
Annual return is the percentage return between the
investment’s NAV over a one‐year period, from the
beginning date to the ending date of the period. It
could be computed as a trailing 12‐month (TTM)
window.
Average annual return is an arithmetic average of
annual returns.
Total return is a return earned within a time period. For
example, total return from March 3, 2012 to September
20, 2013 would have the following formula:
. 20, 2013 3, 2012
1 100
CFPI generally will use annualized return because this
measure provides consistency and comparability
allowing a comparison between investments of
different time horizons.
Evaluation of fi360 Fiduciary Score®
ONE‐YEAR FORWARD HORIZON ANALYSIS
Annualized Return
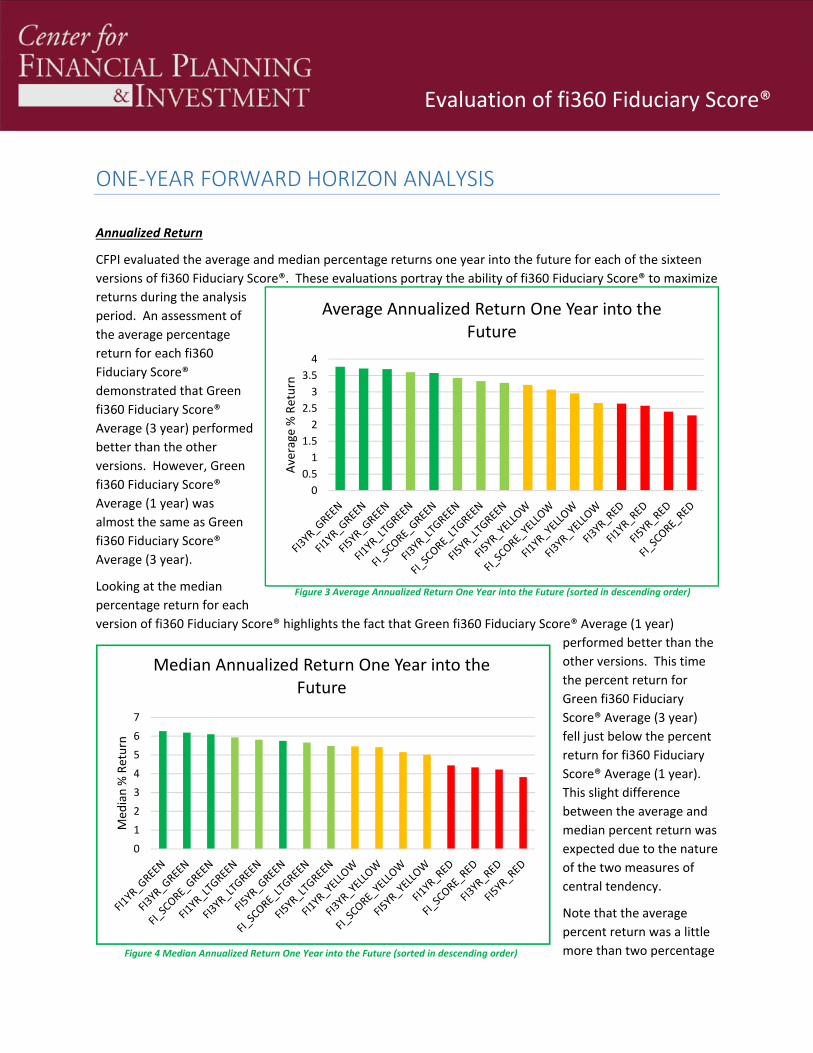
CFPI evaluated the average and median percentage returns one year into the future for each of the sixteen
versions of fi360 Fiduciary Score®. These evaluations portray the ability of fi360 Fiduciary Score® to maximize
returns during the analysis
period. An assessment of
the average percentage
return for each fi360
Fiduciary Score®
demonstrated that Green
fi360 Fiduciary Score®
Average (3 year) performed
better than the other
versions. However, Green
fi360 Fiduciary Score®
Average (1 year) was
almost the same as Green
fi360 Fiduciary Score®
Average (3 year).
Looking at the median
percentage return for each
version of fi360 Fiduciary Score® highlights the fact that Green fi360 Fiduciary Score® Average (1 year)
performed better than the
other versions. This time
the percent return for
Green fi360 Fiduciary
Score® Average (3 year)
fell just below the percent
return for fi360 Fiduciary
Score® Average (1 year).
This slight difference
between the average and
median percent return was
expected due to the nature
of the two measures of
central tendency.
Note that the average
percent return was a little
more than two percentage
0
0.5
1
1.5
2
2.5
3
3.5
4
Average % Return
Average Annualized Return One Year into the Future
Figure 3 Average Annualized Return One Year into the Future (sorted in descending order)
0
1
2
3
4
5
6
7
Med
ian % Return
Median Annualized Return One Year into the Future
Figure 4 Median Annualized Return One Year into the Future (sorted in descending order)
Evaluation of fi360 Fiduciary Score®
points below the median percent return. This suggests that the average percent return was weighed down
by a few observations with low returns, which may have been outliers.
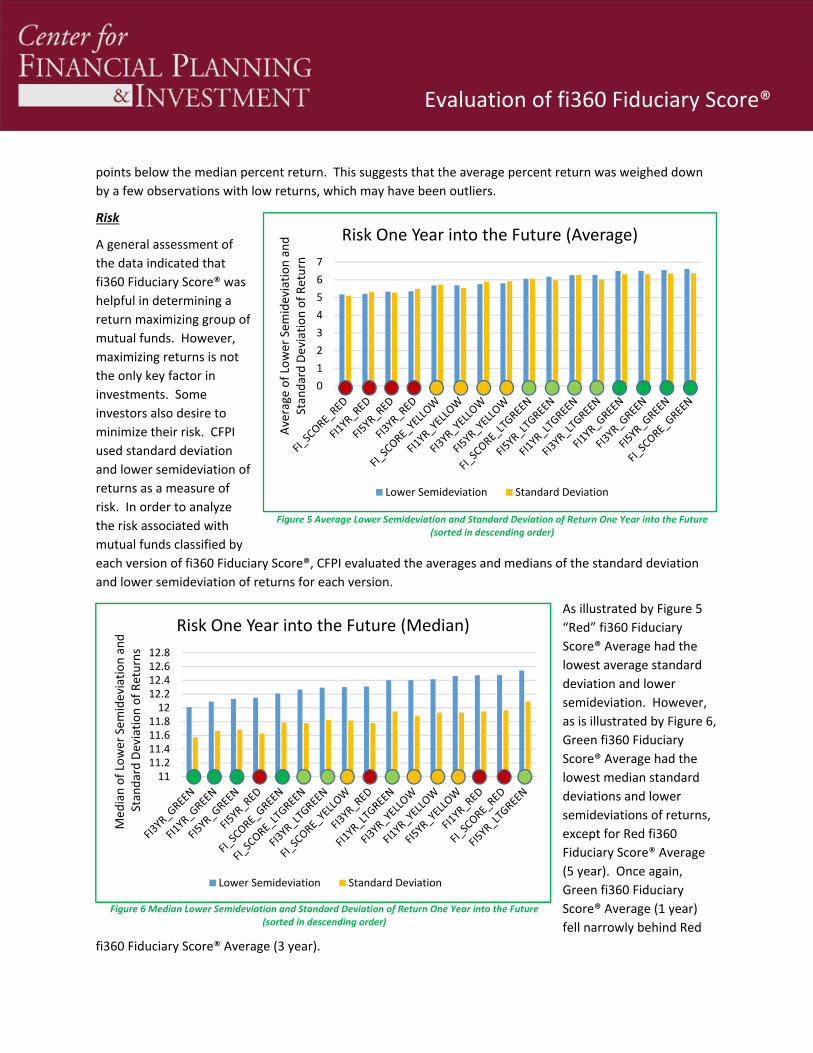
Risk
A general assessment of
the data indicated that
fi360 Fiduciary Score® was
helpful in determining a
return maximizing group of
mutual funds. However,
maximizing returns is not
the only key factor in
investments. Some
investors also desire to
minimize their risk. CFPI
used standard deviation
and lower semideviation of
returns as a measure of
risk. In order to analyze
the risk associated with
mutual funds classified by
each version of fi360 Fiduciary Score®, CFPI evaluated the averages and medians of the standard deviation
and lower semideviation of returns for each version.
As illustrated by Figure 5
“Red” fi360 Fiduciary
Score® Average had the
lowest average standard
deviation and lower
semideviation. However,
as is illustrated by Figure 6,
Green fi360 Fiduciary
Score® Average had the
lowest median standard
deviations and lower
semideviations of returns,
except for Red fi360
Fiduciary Score® Average
(5 year). Once again,
Green fi360 Fiduciary
Score® Average (1 year)
fell narrowly behind Red
fi360 Fiduciary Score® Average (3 year).
0
1
2
3
4
5
6
7
Average of Lower Sem
ideviation and
Stan
dard Deviation of Return
Risk One Year into the Future (Average)
Lower Semideviation Standard Deviation
Figure 5 Average Lower Semideviation and Standard Deviation of Return One Year into the Future (sorted in descending order)
1111.211.411.611.812
12.212.412.612.8
Med
ian of Lower Sem
ideviation and
Stan
dard Deviation of Returns
Risk One Year into the Future (Median)
Lower Semideviation Standard Deviation
Figure 6 Median Lower Semideviation and Standard Deviation of Return One Year into the Future (sorted in descending order)
Evaluation of fi360 Fiduciary Score®
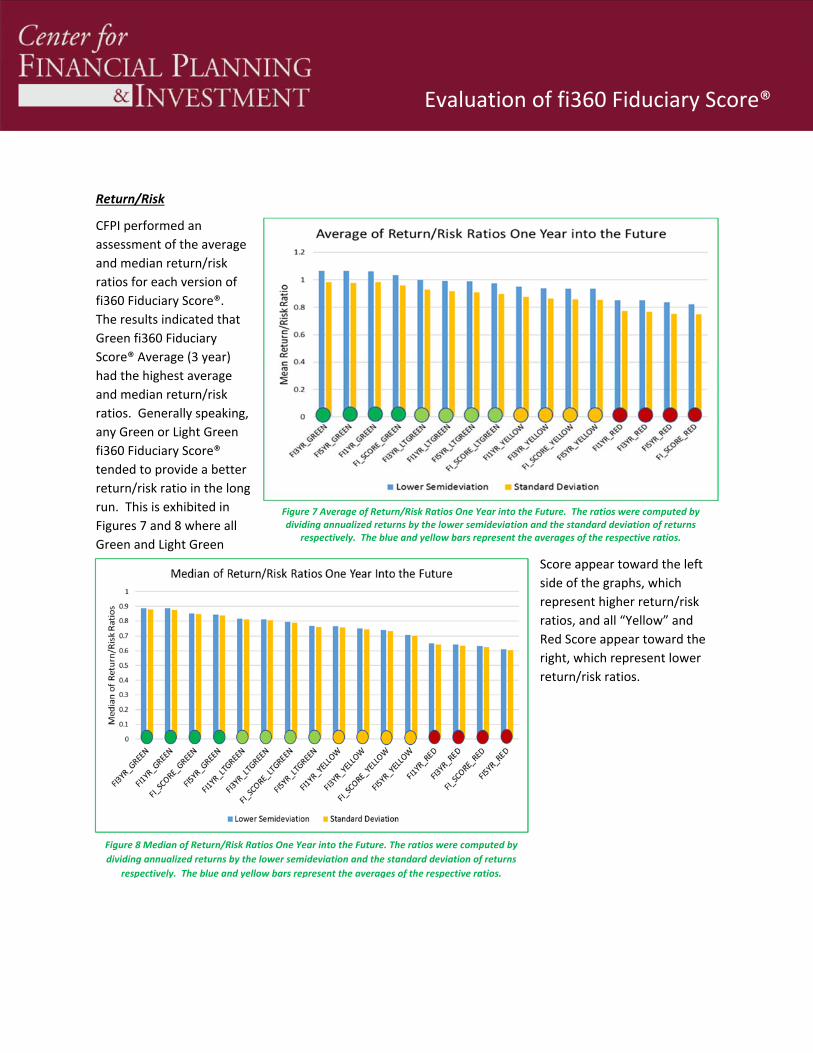
Return/Risk
CFPI performed an
assessment of the average
and median return/risk
ratios for each version of
fi360 Fiduciary Score®.
The results indicated that
Green fi360 Fiduciary
Score® Average (3 year)
had the highest average
and median return/risk
ratios. Generally speaking,
any Green or Light Green
fi360 Fiduciary Score®
tended to provide a better
return/risk ratio in the long
run. This is exhibited in
Figures 7 and 8 where all
Green and Light Green
Score appear toward the left
side of the graphs, which
represent higher return/risk
ratios, and all “Yellow” and
Red Score appear toward the
right, which represent lower
return/risk ratios.
Figure 7 Average of Return/Risk Ratios One Year into the Future. The ratios were computed by dividing annualized returns by the lower semideviation and the standard deviation of returns
respectively. The blue and yellow bars represent the averages of the respective ratios.
Figure 8 Median of Return/Risk Ratios One Year into the Future. The ratios were computed by
dividing annualized returns by the lower semideviation and the standard deviation of returns
respectively. The blue and yellow bars represent the averages of the respective ratios.
Evaluation of fi360 Fiduciary Score®
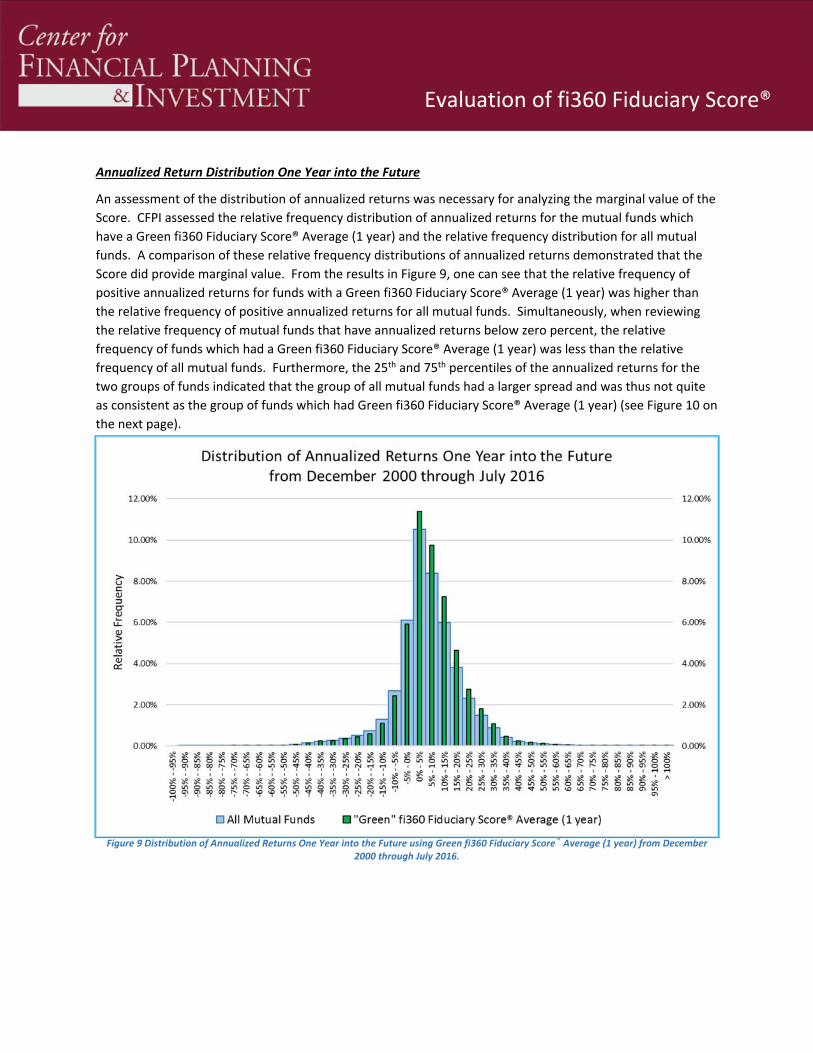
Annualized Return Distribution One Year into the Future
An assessment of the distribution of annualized returns was necessary for analyzing the marginal value of the
Score. CFPI assessed the relative frequency distribution of annualized returns for the mutual funds which
have a Green fi360 Fiduciary Score® Average (1 year) and the relative frequency distribution for all mutual
funds. A comparison of these relative frequency distributions of annualized returns demonstrated that the
Score did provide marginal value. From the results in Figure 9, one can see that the relative frequency of
positive annualized returns for funds with a Green fi360 Fiduciary Score® Average (1 year) was higher than
the relative frequency of positive annualized returns for all mutual funds. Simultaneously, when reviewing
the relative frequency of mutual funds that have annualized returns below zero percent, the relative
frequency of funds which had a Green fi360 Fiduciary Score® Average (1 year) was less than the relative
frequency of all mutual funds. Furthermore, the 25th and 75th percentiles of the annualized returns for the
two groups of funds indicated that the group of all mutual funds had a larger spread and was thus not quite
as consistent as the group of funds which had Green fi360 Fiduciary Score® Average (1 year) (see Figure 10 on
the next page).
Figure 9 Distribution of Annualized Returns One Year into the Future using Green fi360 Fiduciary Score® Average (1 year) from December 2000 through July 2016.
Evaluation of fi360 Fiduciary Score®
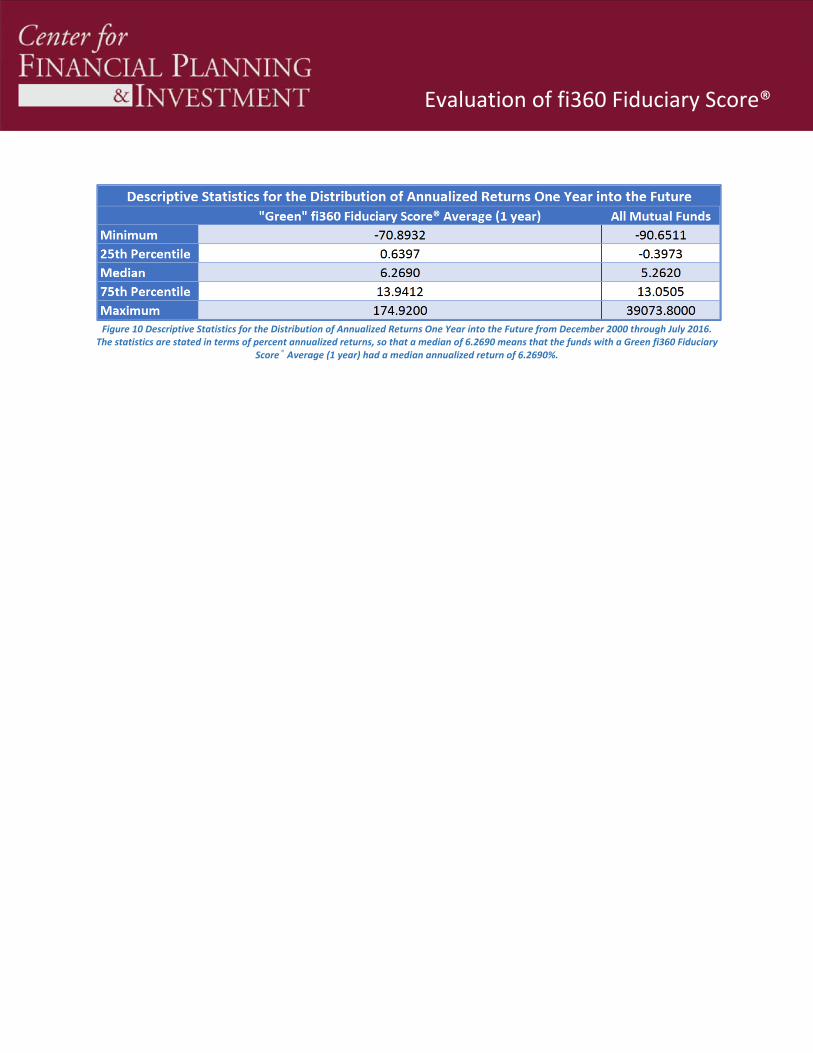
Figure 10 Descriptive Statistics for the Distribution of Annualized Returns One Year into the Future from December 2000 through July 2016. The statistics are stated in terms of percent annualized returns, so that a median of 6.2690 means that the funds with a Green fi360 Fiduciary
Score® Average (1 year) had a median annualized return of 6.2690%.
Evaluation of fi360 Fiduciary Score®
THREE‐YEAR FORWARD HORIZON ANALYSIS
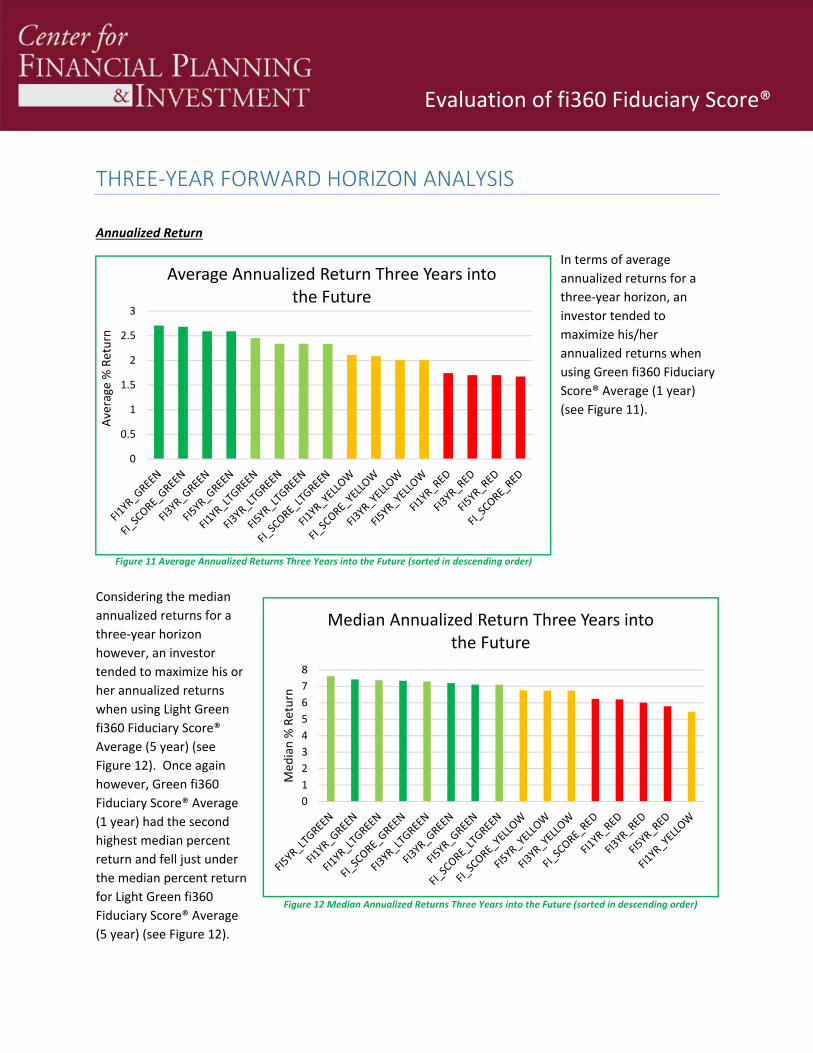
Annualized Return
In terms of average
annualized returns for a
three‐year horizon, an
investor tended to
maximize his/her
annualized returns when
using Green fi360 Fiduciary
Score® Average (1 year)
(see Figure 11).
Considering the median
annualized returns for a
three‐year horizon
however, an investor
tended to maximize his or
her annualized returns
when using Light Green
fi360 Fiduciary Score®
Average (5 year) (see
Figure 12). Once again
however, Green fi360
Fiduciary Score® Average
(1 year) had the second
highest median percent
return and fell just under
the median percent return
for Light Green fi360
Fiduciary Score® Average
(5 year) (see Figure 12).
0
0.5
1
1.5
2
2.5
3
Average % Return
Average Annualized Return Three Years into the Future
0
1
2
3
4
5
6
7
8
Med
ian % Return
Median Annualized Return Three Years into the Future
Figure 11 Average Annualized Returns Three Years into the Future (sorted in descending order)
Figure 12 Median Annualized Returns Three Years into the Future (sorted in descending order)
Evaluation of fi360 Fiduciary Score®
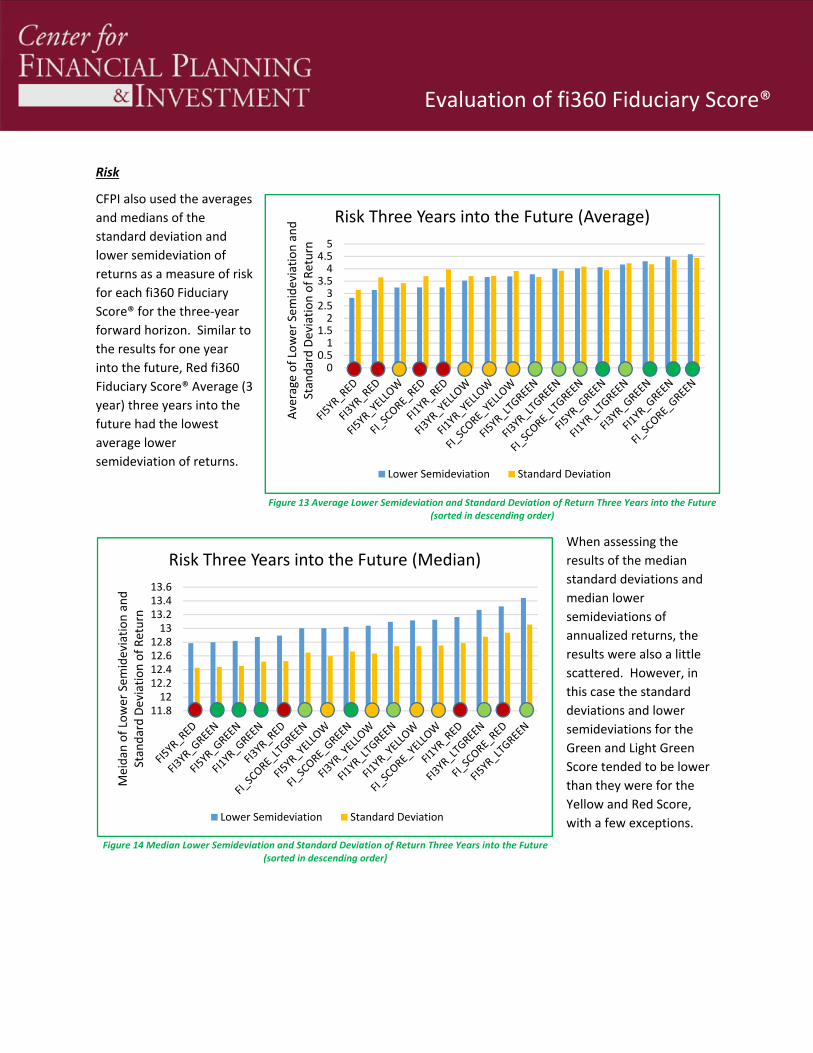
Risk
CFPI also used the averages
and medians of the
standard deviation and
lower semideviation of
returns as a measure of risk
for each fi360 Fiduciary
Score® for the three‐year
forward horizon. Similar to
the results for one year
into the future, Red fi360
Fiduciary Score® Average (3
year) three years into the
future had the lowest
average lower
semideviation of returns.
When assessing the
results of the median
standard deviations and
median lower
semideviations of
annualized returns, the
results were also a little
scattered. However, in
this case the standard
deviations and lower
semideviations for the
Green and Light Green
Score tended to be lower
than they were for the
Yellow and Red Score,
with a few exceptions.
00.51
1.52
2.53
3.54
4.55
Average of Lower Sem
ideviation and
Stan
dard Deviation of Return
Risk Three Years into the Future (Average)
Lower Semideviation Standard Deviation
Figure 13 Average Lower Semideviation and Standard Deviation of Return Three Years into the Future (sorted in descending order)
Figure 14 Median Lower Semideviation and Standard Deviation of Return Three Years into the Future (sorted in descending order)
11.812
12.212.412.612.813
13.213.413.6
Meidan
of Lower Sem
ideviation and
Stan
dard Deviation of Return
Risk Three Years into the Future (Median)
Lower Semideviation Standard Deviation
Evaluation of fi360 Fiduciary Score®
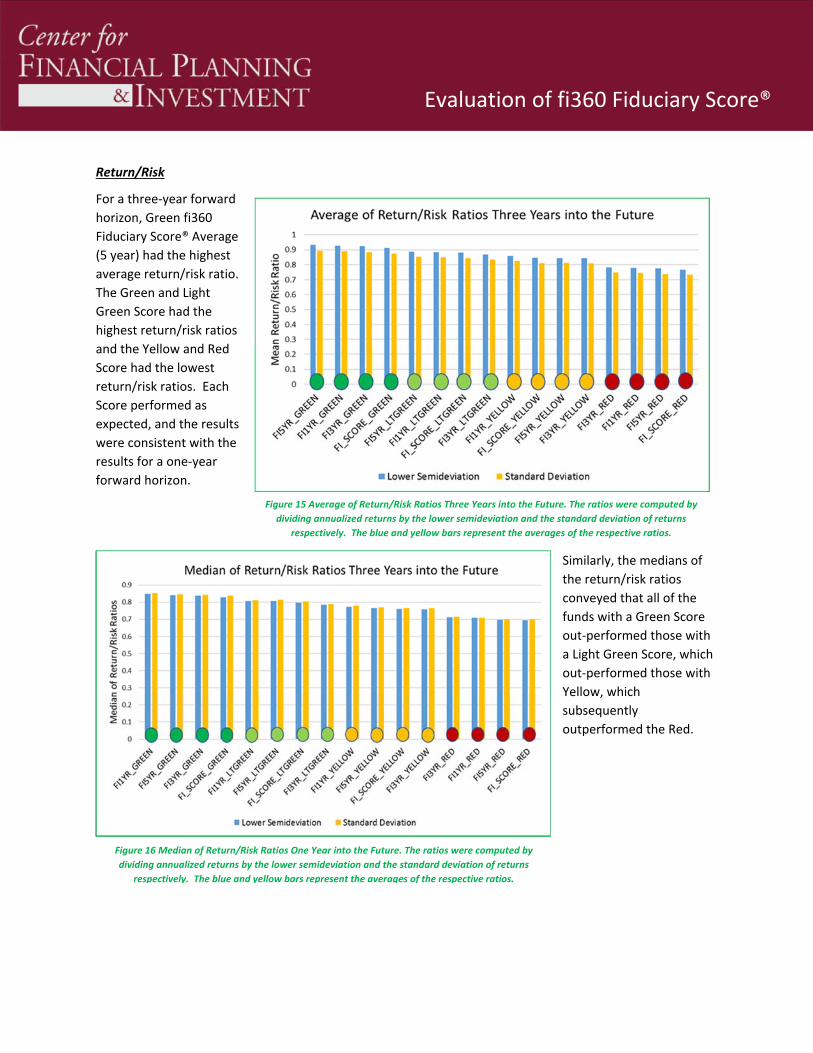
Return/Risk
For a three‐year forward
horizon, Green fi360
Fiduciary Score® Average
(5 year) had the highest
average return/risk ratio.
The Green and Light
Green Score had the
highest return/risk ratios
and the Yellow and Red
Score had the lowest
return/risk ratios. Each
Score performed as
expected, and the results
were consistent with the
results for a one‐year
forward horizon.
Similarly, the medians of
the return/risk ratios
conveyed that all of the
funds with a Green Score
out‐performed those with
a Light Green Score, which
out‐performed those with
Yellow, which
subsequently
outperformed the Red.
Figure 16 Median of Return/Risk Ratios One Year into the Future. The ratios were computed by
dividing annualized returns by the lower semideviation and the standard deviation of returns
respectively. The blue and yellow bars represent the averages of the respective ratios.
Figure 15 Average of Return/Risk Ratios Three Years into the Future. The ratios were computed by
dividing annualized returns by the lower semideviation and the standard deviation of returns
respectively. The blue and yellow bars represent the averages of the respective ratios.
Evaluation of fi360 Fiduciary Score®
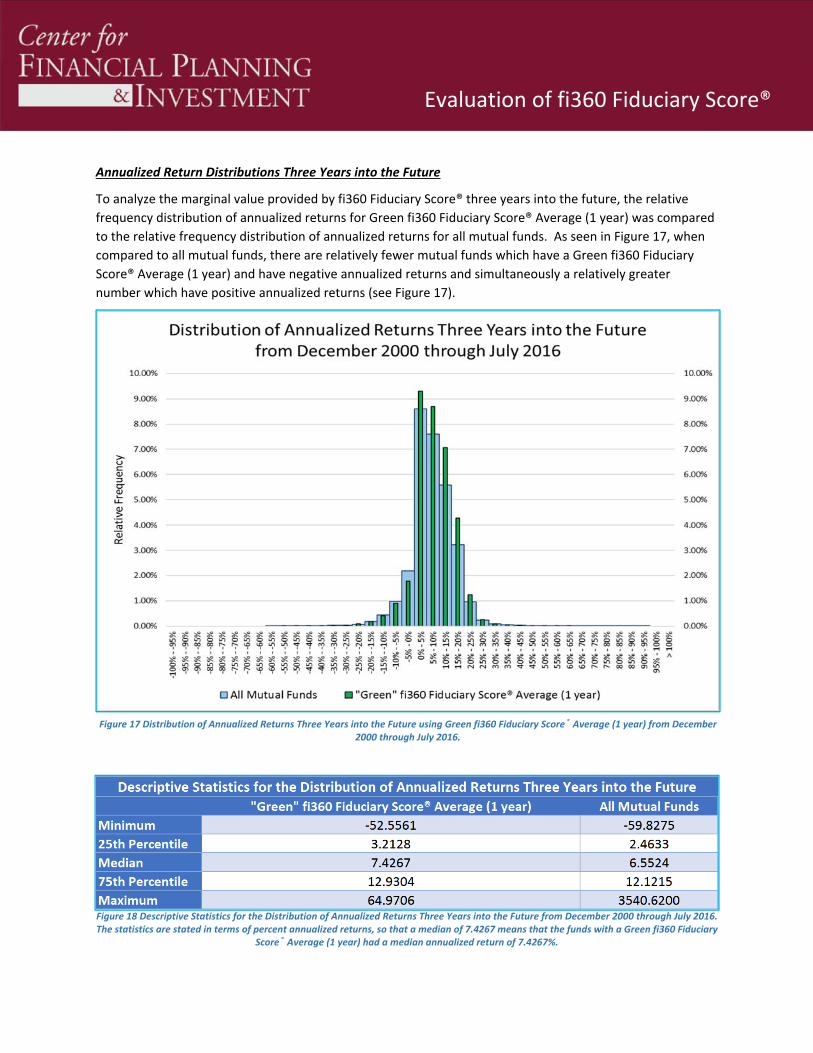
Annualized Return Distributions Three Years into the Future
To analyze the marginal value provided by fi360 Fiduciary Score® three years into the future, the relative
frequency distribution of annualized returns for Green fi360 Fiduciary Score® Average (1 year) was compared
to the relative frequency distribution of annualized returns for all mutual funds. As seen in Figure 17, when
compared to all mutual funds, there are relatively fewer mutual funds which have a Green fi360 Fiduciary
Score® Average (1 year) and have negative annualized returns and simultaneously a relatively greater
number which have positive annualized returns (see Figure 17).
Figure 17 Distribution of Annualized Returns Three Years into the Future using Green fi360 Fiduciary Score® Average (1 year) from December 2000 through July 2016.
Figure 18 Descriptive Statistics for the Distribution of Annualized Returns Three Years into the Future from December 2000 through July 2016. The statistics are stated in terms of percent annualized returns, so that a median of 7.4267 means that the funds with a Green fi360 Fiduciary
Score® Average (1 year) had a median annualized return of 7.4267%.
Evaluation of fi360 Fiduciary Score®
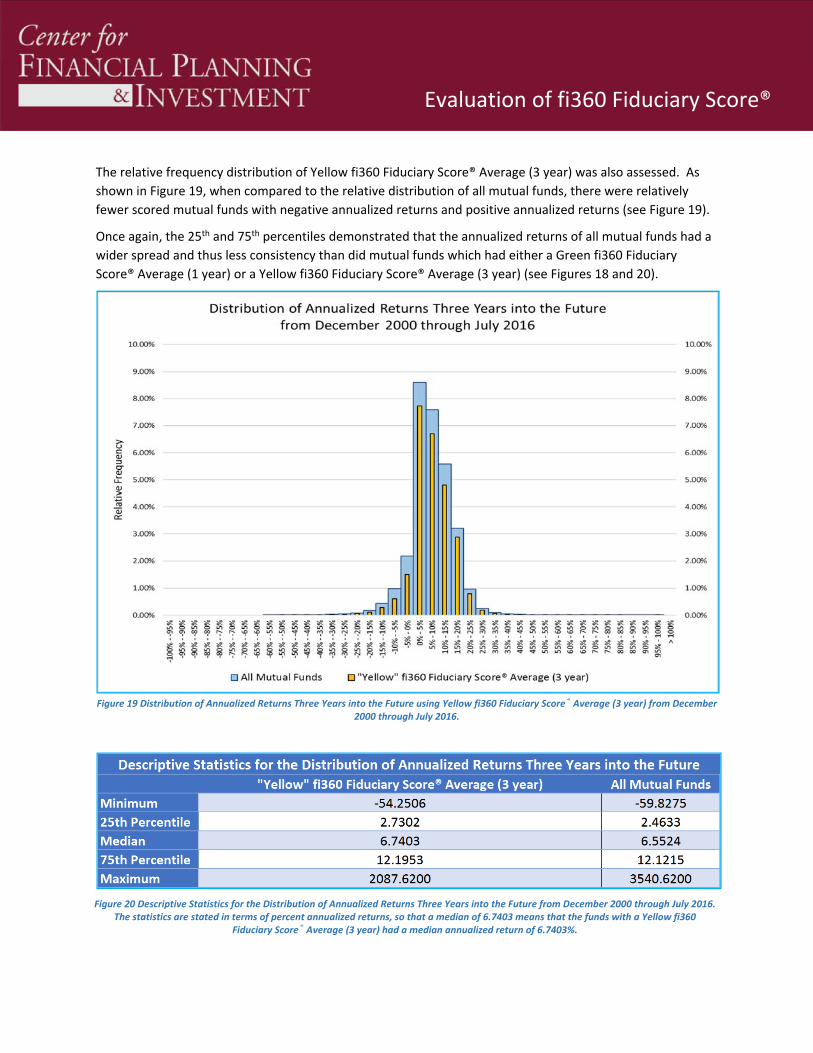
The relative frequency distribution of Yellow fi360 Fiduciary Score® Average (3 year) was also assessed. As
shown in Figure 19, when compared to the relative distribution of all mutual funds, there were relatively
fewer scored mutual funds with negative annualized returns and positive annualized returns (see Figure 19).
Once again, the 25th and 75th percentiles demonstrated that the annualized returns of all mutual funds had a
wider spread and thus less consistency than did mutual funds which had either a Green fi360 Fiduciary
Score® Average (1 year) or a Yellow fi360 Fiduciary Score® Average (3 year) (see Figures 18 and 20).
Figure 19 Distribution of Annualized Returns Three Years into the Future using Yellow fi360 Fiduciary Score® Average (3 year) from December 2000 through July 2016.
Figure 20 Descriptive Statistics for the Distribution of Annualized Returns Three Years into the Future from December 2000 through July 2016. The statistics are stated in terms of percent annualized returns, so that a median of 6.7403 means that the funds with a Yellow fi360
Fiduciary Score® Average (3 year) had a median annualized return of 6.7403%.
Evaluation of fi360 Fiduciary Score®
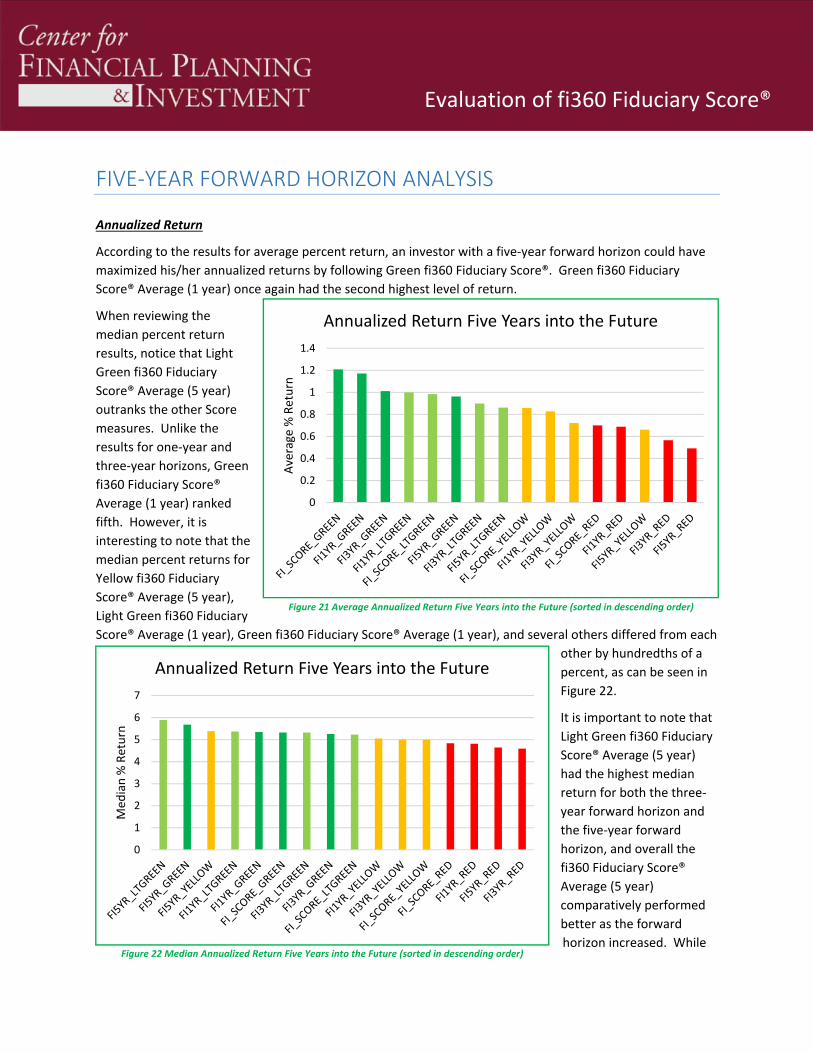
FIVE‐YEAR FORWARD HORIZON ANALYSIS
Annualized Return
According to the results for average percent return, an investor with a five‐year forward horizon could have
maximized his/her annualized returns by following Green fi360 Fiduciary Score®. Green fi360 Fiduciary
Score® Average (1 year) once again had the second highest level of return.
When reviewing the
median percent return
results, notice that Light
Green fi360 Fiduciary
Score® Average (5 year)
outranks the other Score
measures. Unlike the
results for one‐year and
three‐year horizons, Green
fi360 Fiduciary Score®
Average (1 year) ranked
fifth. However, it is
interesting to note that the
median percent returns for
Yellow fi360 Fiduciary
Score® Average (5 year),
Light Green fi360 Fiduciary
Score® Average (1 year), Green fi360 Fiduciary Score® Average (1 year), and several others differed from each
other by hundredths of a
percent, as can be seen in
Figure 22.
It is important to note that
Light Green fi360 Fiduciary
Score® Average (5 year)
had the highest median
return for both the three‐
year forward horizon and
the five‐year forward
horizon, and overall the
fi360 Fiduciary Score®
Average (5 year)
comparatively performed
better as the forward
horizon increased. While
0
0.2
0.4
0.6
0.8
1
1.2
1.4
Average % Return
Annualized Return Five Years into the Future
0
1
2
3
4
5
6
7
Med
ian % Return
Annualized Return Five Years into the Future
Figure 21 Average Annualized Return Five Years into the Future (sorted in descending order)
Figure 22 Median Annualized Return Five Years into the Future (sorted in descending order)
Evaluation of fi360 Fiduciary Score®
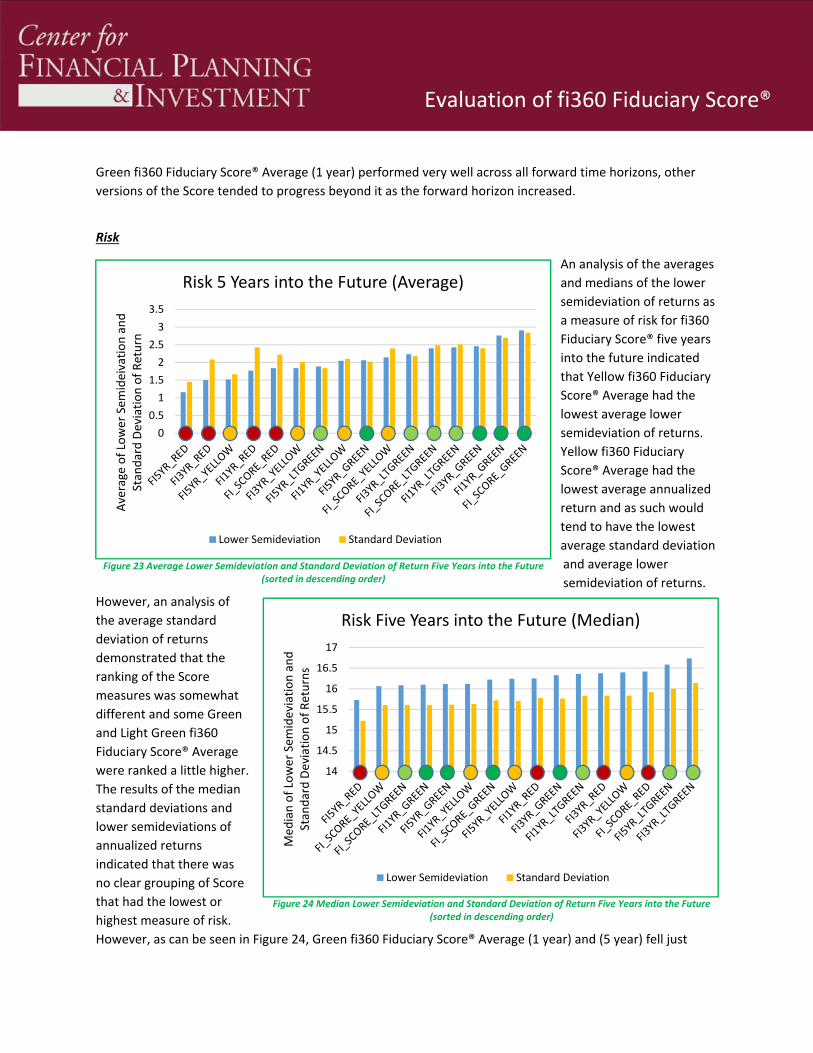
Green fi360 Fiduciary Score® Average (1 year) performed very well across all forward time horizons, other
versions of the Score tended to progress beyond it as the forward horizon increased.
Risk
An analysis of the averages
and medians of the lower
semideviation of returns as
a measure of risk for fi360
Fiduciary Score® five years
into the future indicated
that Yellow fi360 Fiduciary
Score® Average had the
lowest average lower
semideviation of returns.
Yellow fi360 Fiduciary
Score® Average had the
lowest average annualized
return and as such would
tend to have the lowest
average standard deviation
and average lower
semideviation of returns.
However, an analysis of
the average standard
deviation of returns
demonstrated that the
ranking of the Score
measures was somewhat
different and some Green
and Light Green fi360
Fiduciary Score® Average
were ranked a little higher.
The results of the median
standard deviations and
lower semideviations of
annualized returns
indicated that there was
no clear grouping of Score
that had the lowest or
highest measure of risk.
However, as can be seen in Figure 24, Green fi360 Fiduciary Score® Average (1 year) and (5 year) fell just
0
0.5
1
1.5
2
2.5
3
3.5
Average of Lower Sem
ideivation and
Stan
dard Deviation of Return
Risk 5 Years into the Future (Average)
Lower Semideviation Standard Deviation
14
14.5
15
15.5
16
16.5
17
Med
ian of Lower Sem
ideviation and
Stan
dard Deviation of Returns
Risk Five Years into the Future (Median)
Lower Semideviation Standard Deviation
Figure 23 Average Lower Semideviation and Standard Deviation of Return Five Years into the Future (sorted in descending order)
Figure 24 Median Lower Semideviation and Standard Deviation of Return Five Years into the Future (sorted in descending order)
Evaluation of fi360 Fiduciary Score®
above the measures of risk for Red fi360 Fiduciary Score® Average (5 year), Yellow and Light Green fi360
Fiduciary Score®. These Score risk measures fell within a tenth of a percent from each other.
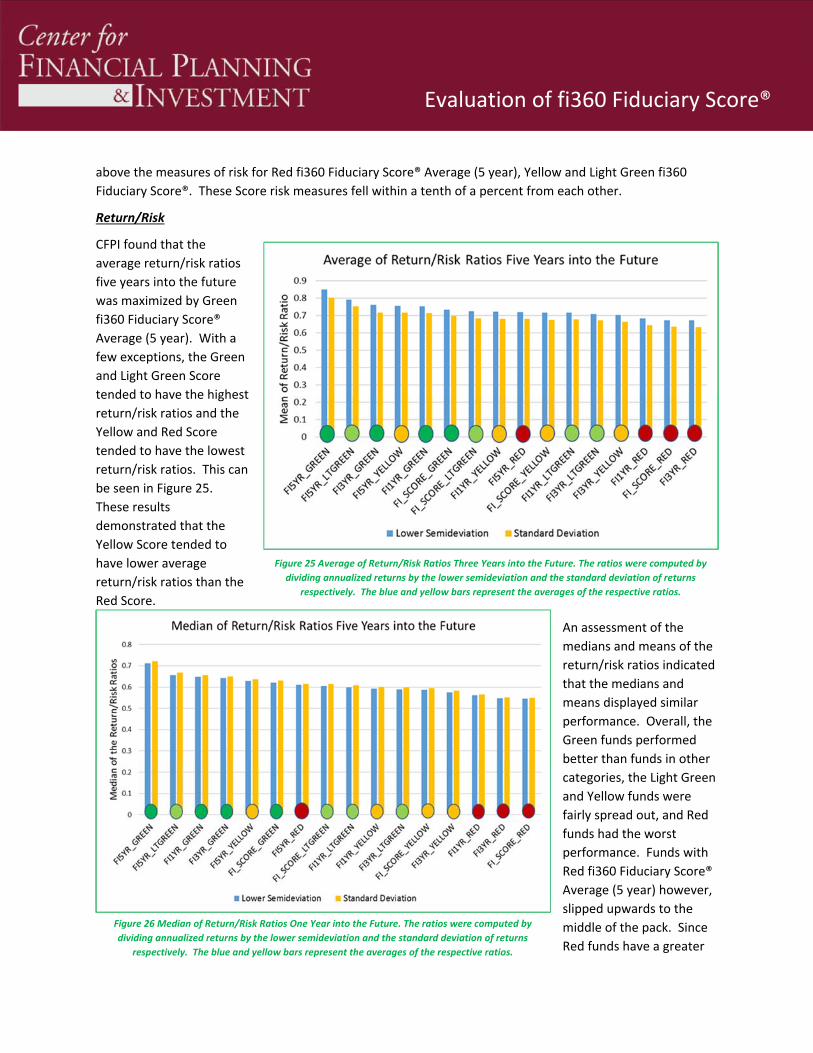
Return/Risk
CFPI found that the
average return/risk ratios
five years into the future
was maximized by Green
fi360 Fiduciary Score®
Average (5 year). With a
few exceptions, the Green
and Light Green Score
tended to have the highest
return/risk ratios and the
Yellow and Red Score
tended to have the lowest
return/risk ratios. This can
be seen in Figure 25.
These results
demonstrated that the
Yellow Score tended to
have lower average
return/risk ratios than the
Red Score.
An assessment of the
medians and means of the
return/risk ratios indicated
that the medians and
means displayed similar
performance. Overall, the
Green funds performed
better than funds in other
categories, the Light Green
and Yellow funds were
fairly spread out, and Red
funds had the worst
performance. Funds with
Red fi360 Fiduciary Score®
Average (5 year) however,
slipped upwards to the
middle of the pack. Since
Red funds have a greater
Figure 25 Average of Return/Risk Ratios Three Years into the Future. The ratios were computed by
dividing annualized returns by the lower semideviation and the standard deviation of returns
respectively. The blue and yellow bars represent the averages of the respective ratios.
Figure 26 Median of Return/Risk Ratios One Year into the Future. The ratios were computed by
dividing annualized returns by the lower semideviation and the standard deviation of returns
respectively. The blue and yellow bars represent the averages of the respective ratios.
Evaluation of fi360 Fiduciary Score®
probability of demise, funds which survive five years may be somewhat better (this is called survivorship bias
and can be seen in figures starting on page 22), but the challenge is knowing which funds those are in
advance.
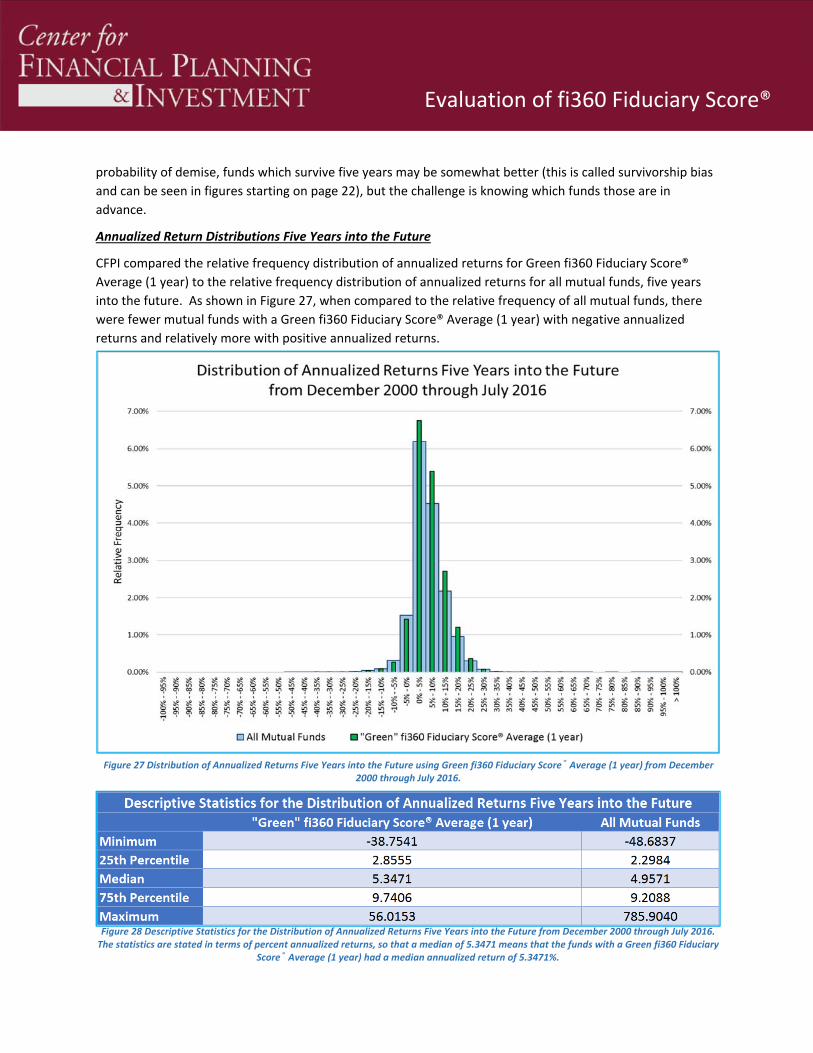
Annualized Return Distributions Five Years into the Future
CFPI compared the relative frequency distribution of annualized returns for Green fi360 Fiduciary Score®
Average (1 year) to the relative frequency distribution of annualized returns for all mutual funds, five years
into the future. As shown in Figure 27, when compared to the relative frequency of all mutual funds, there
were fewer mutual funds with a Green fi360 Fiduciary Score® Average (1 year) with negative annualized
returns and relatively more with positive annualized returns.
Figure 27 Distribution of Annualized Returns Five Years into the Future using Green fi360 Fiduciary Score® Average (1 year) from December 2000 through July 2016.
Figure 28 Descriptive Statistics for the Distribution of Annualized Returns Five Years into the Future from December 2000 through July 2016. The statistics are stated in terms of percent annualized returns, so that a median of 5.3471 means that the funds with a Green fi360 Fiduciary
Score® Average (1 year) had a median annualized return of 5.3471%.
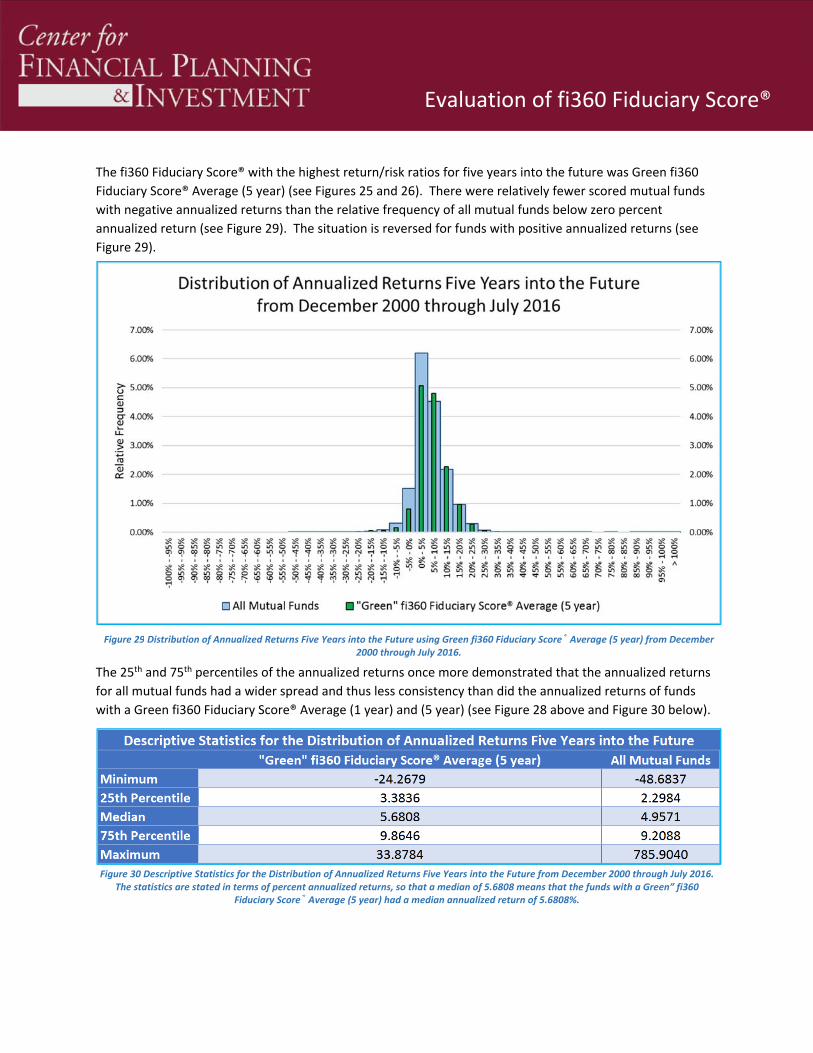
Evaluation of fi360 Fiduciary Score®
The fi360 Fiduciary Score® with the highest return/risk ratios for five years into the future was Green fi360
Fiduciary Score® Average (5 year) (see Figures 25 and 26). There were relatively fewer scored mutual funds
with negative annualized returns than the relative frequency of all mutual funds below zero percent
annualized return (see Figure 29). The situation is reversed for funds with positive annualized returns (see
Figure 29).
The 25th and 75th percentiles of the annualized returns once more demonstrated that the annualized returns
for all mutual funds had a wider spread and thus less consistency than did the annualized returns of funds
with a Green fi360 Fiduciary Score® Average (1 year) and (5 year) (see Figure 28 above and Figure 30 below).
Figure 29 Distribution of Annualized Returns Five Years into the Future using Green fi360 Fiduciary Score® Average (5 year) from December 2000 through July 2016.
Figure 30 Descriptive Statistics for the Distribution of Annualized Returns Five Years into the Future from December 2000 through July 2016. The statistics are stated in terms of percent annualized returns, so that a median of 5.6808 means that the funds with a Green” fi360
Fiduciary Score® Average (5 year) had a median annualized return of 5.6808%.
Evaluation of fi360 Fiduciary Score®
STABILITY ANALYSIS
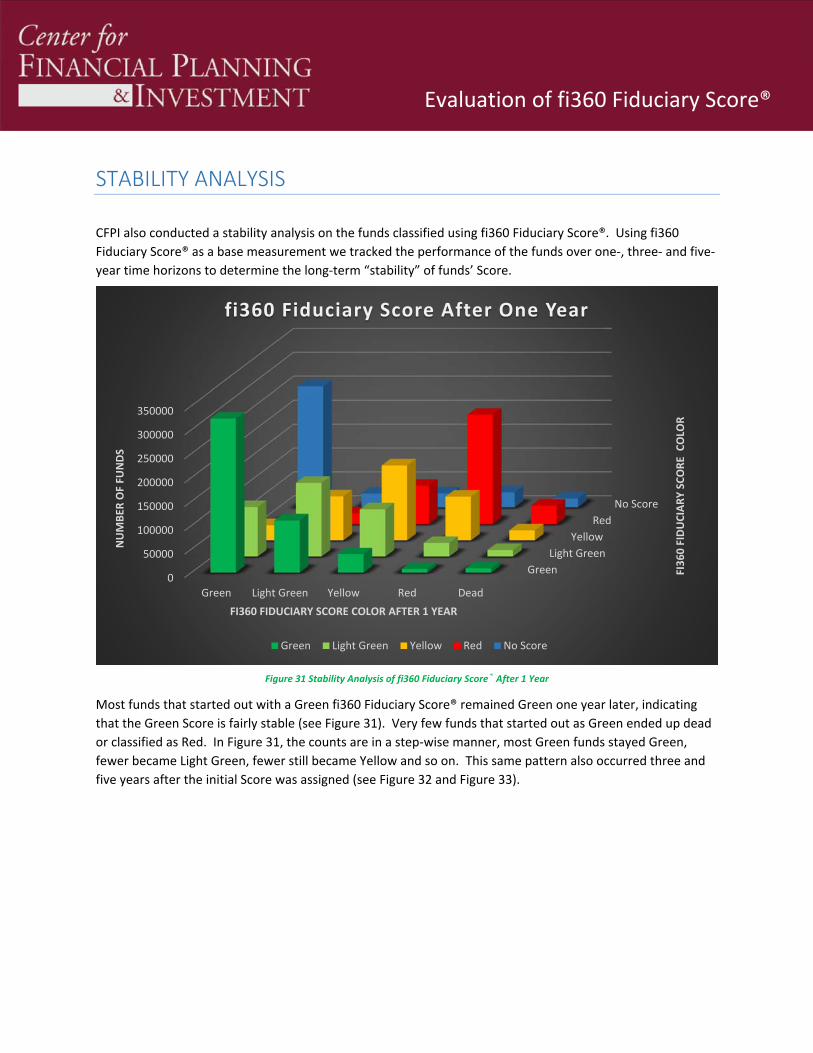
CFPI also conducted a stability analysis on the funds classified using fi360 Fiduciary Score®. Using fi360
Fiduciary Score® as a base measurement we tracked the performance of the funds over one‐, three‐ and five‐
year time horizons to determine the long‐term “stability” of funds’ Score.
Most funds that started out with a Green fi360 Fiduciary Score® remained Green one year later, indicating
that the Green Score is fairly stable (see Figure 31). Very few funds that started out as Green ended up dead
or classified as Red. In Figure 31, the counts are in a step‐wise manner, most Green funds stayed Green,
fewer became Light Green, fewer still became Yellow and so on. This same pattern also occurred three and
five years after the initial Score was assigned (see Figure 32 and Figure 33).
Figure 31 Stability Analysis of fi360 Fiduciary Score® After 1 Year
Green
Light Green
Yellow
Red
No Score
0
50000
100000
150000
200000
250000
300000
350000
Green Light Green Yellow Red Dead
FI360 FIDUCIARY SCORE COLO
R
NUMBER
OF FU
NDS
FI360 FIDUCIARY SCORE COLOR AFTER 1 YEAR
fi360 Fiduciary Score After One Year
Green Light Green Yellow Red No Score
Evaluation of fi360 Fiduciary Score®
Overall, most funds over a one‐year time horizon tended to keep the Score color that they were classified as
originally. Looking at funds initially evaluated as Yellow, the highest number of funds remained Yellow but
the number of funds that became Red is approximately the same as the number of funds that became Light
Green (see Figure 31).
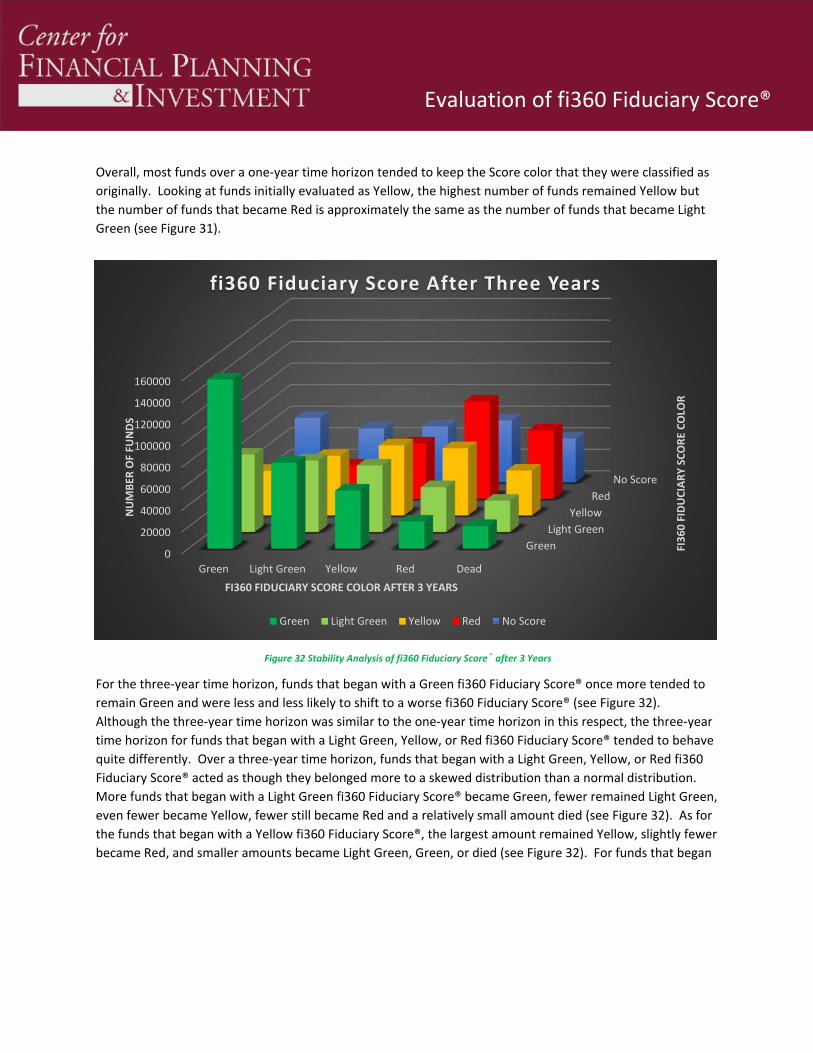
For the three‐year time horizon, funds that began with a Green fi360 Fiduciary Score® once more tended to
remain Green and were less and less likely to shift to a worse fi360 Fiduciary Score® (see Figure 32).
Although the three‐year time horizon was similar to the one‐year time horizon in this respect, the three‐year
time horizon for funds that began with a Light Green, Yellow, or Red fi360 Fiduciary Score® tended to behave
quite differently. Over a three‐year time horizon, funds that began with a Light Green, Yellow, or Red fi360
Fiduciary Score® acted as though they belonged more to a skewed distribution than a normal distribution.
More funds that began with a Light Green fi360 Fiduciary Score® became Green, fewer remained Light Green,
even fewer became Yellow, fewer still became Red and a relatively small amount died (see Figure 32). As for
the funds that began with a Yellow fi360 Fiduciary Score®, the largest amount remained Yellow, slightly fewer
became Red, and smaller amounts became Light Green, Green, or died (see Figure 32). For funds that began
Figure 32 Stability Analysis of fi360 Fiduciary Score® after 3 Years
Green
Light Green
Yellow
Red
No Score
0
20000
40000
60000
80000
100000
120000
140000
160000
Green Light Green Yellow Red Dead
FI360 FIDUCIARY SCORE COLO
R
NUMBER
OF FU
NDS
FI360 FIDUCIARY SCORE COLOR AFTER 3 YEARS
fi360 Fiduciary Score After Three Years
Green Light Green Yellow Red No Score
Evaluation of fi360 Fiduciary Score®
with a Red fi360 Fiduciary Score®, many remained Red, fewer died, and fewer still became Yellow, Light
Green, or Green (see Figure 32).
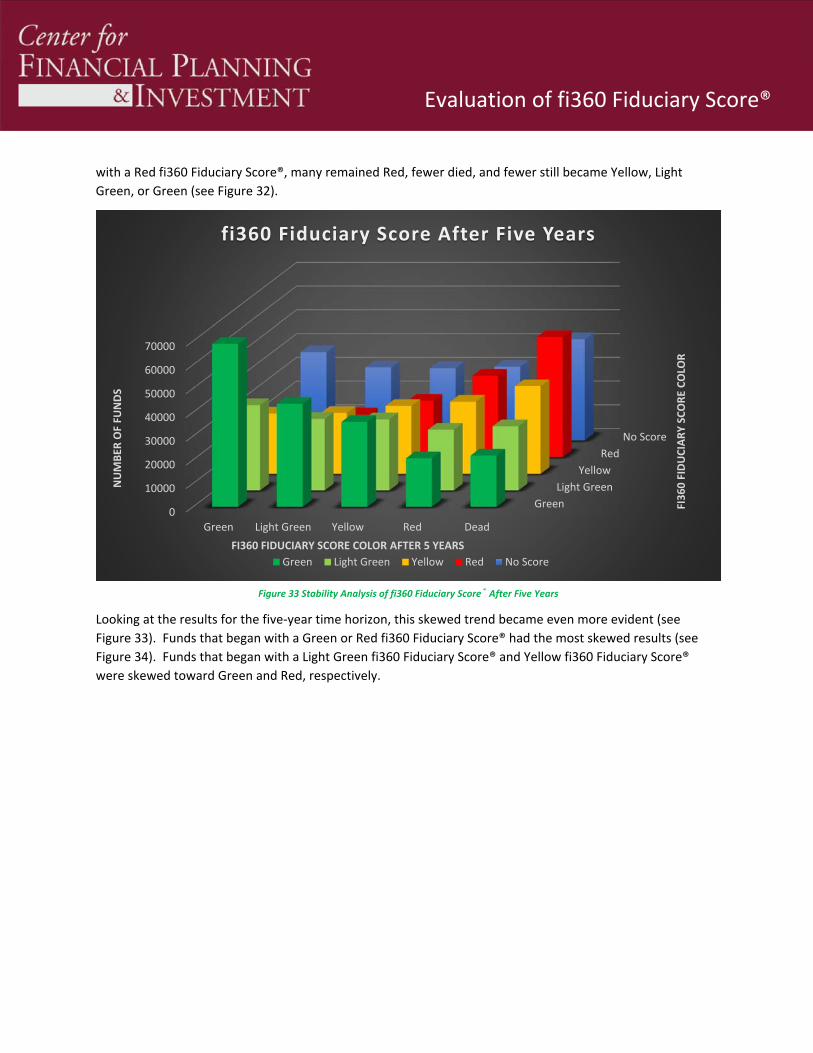
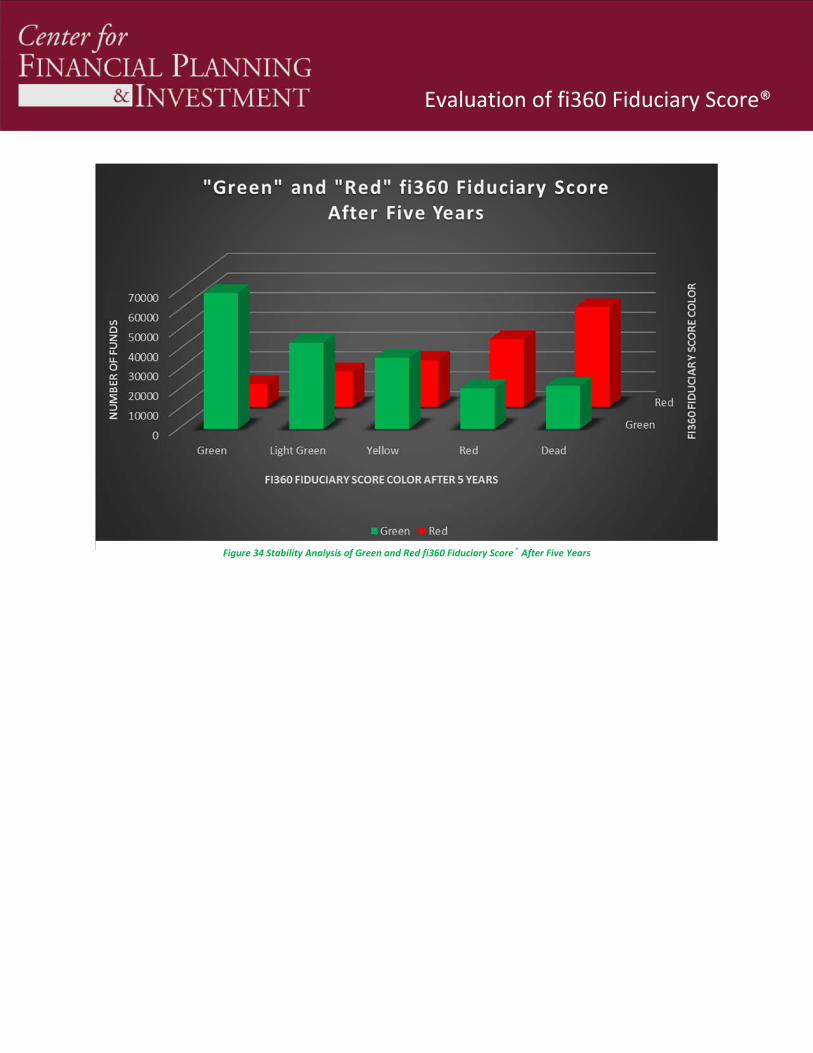
Looking at the results for the five‐year time horizon, this skewed trend became even more evident (see
Figure 33). Funds that began with a Green or Red fi360 Fiduciary Score® had the most skewed results (see
Figure 34). Funds that began with a Light Green fi360 Fiduciary Score® and Yellow fi360 Fiduciary Score®
were skewed toward Green and Red, respectively.
Figure 33 Stability Analysis of fi360 Fiduciary Score® After Five Years
Green
Light Green
Yellow
Red
No Score
0
10000
20000
30000
40000
50000
60000
70000
Green Light Green Yellow Red Dead
FI360 FIDUCIARY SCORE COLO
R
NUMBER
OF FU
NDS
FI360 FIDUCIARY SCORE COLOR AFTER 5 YEARS
fi360 Fiduciary Score After Five Years
Green Light Green Yellow Red No Score
Evaluation of fi360 Fiduciary Score®
Figure 34 Stability Analysis of Green and Red fi360 Fiduciary Score® After Five Years
Evaluation of fi360 Fiduciary Score®
CONCLUSION
Overall, the “green is good” and “red is bad” observation from several years ago still holds. The funds
identified by a fi360 Fiduciary Score® in the lowest quartile (Green) tended to have higher returns and lower
levels of risk than the other quartiles. As a result, these funds tended to have some of the highest return/risk
ratios.
The stability analysis demonstrated that funds identified by a fi360 Fiduciary Score® as Green tended to
remain in the Green category over one‐, three‐ and five‐year time horizons. At the other extreme, the funds
with a Red Score were far more likely to remain Red or to stop trading than to improve. The greater stability
of the Green funds complemented their higher return per unit risk and facilitated longer term investment
positions and, potentially, lowered trading costs. Similarly, purchasing Red category funds suggested lower
returns per unit risk and far greater probability of needing to replace the Red funds in portfolios as the funds
became delisted.
While certain numerical estimates may differ, overall this assessment is very consistent with the conclusions
from our earlier research: The use of fi360 Fiduciary Score® helps to effectively identify mutual funds to
consider because of their higher probabilities of risk‐adjusted return and long term presence in the
marketplace and, conversely, funds to avoid because of higher probabilities of poor risk‐adjusted
performance and a significantly higher chance of being delisted.
We conclude that when considering funds for inclusion in a portfolio, an initial screen should consider fi360
Fiduciary Score®. Red is STOP and Green is GO.
Evaluation of fi360 Fiduciary Score®
APPENDIX
Excerpts from: https://www.fi360.com/fa/docs/guide‐to‐using‐the‐fi360‐Fiduciary‐Score.pdf
“fi360” and “fi360 Fiduciary Score” are registered trademarks of fi360, Inc. The fi360 Fiduciary Score and data are copyright ©
2017 fi360, Inc. All Rights Reserved. Data source is © 2017 Morningstar, Inc. All Rights Reserved. The information contained
herein is reprinted with permission of fi360, Inc. The information (1) is proprietary to fi360, and/or its content providers; (2)
may not be copied or distributed; and (3) is not warranted to be accurate, complete, or timely. Neither fi360 nor its content
providers are responsible for any damages or losses arising from any use of this information. Past performance is no guarantee
of future results.
“The fi360 Fiduciary Score® is a peer percentile ranking of an investment against a set of quantitative due diligence criteria
selected to reflect prudent fiduciary management. For each investment with at least a three‐year history, fi360® calculates the
fi360 Fiduciary Score based on the following due diligence criteria: regulatory oversight, minimum track record, stability of the
organization, assets in the investment, composition consistency with asset class, style consistency, expense ratio/fees relative
to peers, risk‐adjusted performance relative to peers, and performance relative to peers. Investments are evaluated on a
monthly basis. If an investment does not meet an individual due diligence criterion, points are assigned. Investments that
satisfy all of the due diligence criteria receive a fi360 Fiduciary Score of 0. Every other investment is given a Score of 1‐100
based on their point total, and representing their percentile ranking within their peer group. The fi360 Fiduciary Score Average
is a one‐, three‐, five‐, or ten‐year rolling average of an investment’s fi360 Fiduciary Score. The Average is also calculated on a
monthly basis. The fi360 Fiduciary Score represents asuggested course of action and is not intended, nor should it be used, as
the sole source of information for reaching an investment decision. Visit www.fi360.com/fi360‐Fiduciary‐Score for the complete
methodology document.”
“The term “fi360 Fiduciary Score” is a registered trademark of fi360, Inc. In headings, labels, first references within a
distinguishable section, and other prominent placements, the complete name, “fi360 Fiduciary Score,” must be used, along
with the registered trademark symbol, “®.” Other forms of the name, such as “fi360 Score” and “Fiduciary Score,” are not
permitted. As we have done within this document, the informal description, “Score” or “the Score,” may be used in running
text when it follows the formal name and it is clear that the reference is to the fi360 Fiduciary Score. “fi360 Fiduciary Score”
may not be made plural (e.g., the fi360 Fiduciary Scores). The term “fi360” is a registered trademark of fi360, Inc. In headings,
labels, first references within a distinguishable section, and other prominent placements, the registered trademark symbol, “®,”
must be used with the mark. All fi360 Fiduciary Score data is copyrighted material of fi360, Inc. and must be presented along
with the disclosure statement below. In all instances of licensed use of fi360 intellectual property, the licensee must display the
disclosure notice below on each discrete document on which the Score and associated data appears: “fi360” and “fi360
Fiduciary Score” are registered trademarks of fi360, Inc. The fi360 Fiduciary Score and data are copyright © [Insert year] fi360,
Inc. All Rights Reserved. Data source is © [Insert year] Morningstar, Inc. All Rights Reserved. The information contained herein
is reprinted with permission of fi360, Inc. The information (1) is proprietary to fi360, and/or its content providers; (2) may not
be copied or distributed; and (3) is not warranted to be accurate, complete, or timely. Neither fi360 nor its content providers
are responsible for any damages or losses arising from any use of this information. Past performance is no guarantee of future
results.”
Evaluation of fi360 Fiduciary Score®
The research team for this report includes: G. Michael Phillips, Ph.D., Director, CFPI
William P. Jennings, Ph.D., Associate Director, CFPI
James T. Chong, Ph.D, Associate Director, CFPI
Sarah Underwood, M.S., Research Associate, CFPI
Laurel Fish, Research Associate, CFPI
Center for Financial Planning & Investment
Contact Info: G. Michael Phillips, Ph.D. Director, Center for Financial Planning & Investment David Nazarian College of Business and Economics California State University, Northridge [email protected]