Embed Size (px)
Citation preview
sustainability
Article
Analysis of Factors in Land Subsidence in Shanghai:A View Based on a StrategicEnvironmental AssessmentYe-Shuang Xu 1, Shui-Long Shen 1,*, Dong-Jie Ren 1 and Huai-Na Wu 1
State Key Laboratory of Ocean Engineering and Collaborative Innovation Center for Advanced Ship andDeep-Sea Exploration (CISSE), Department of Civil Engineering, Shanghai Jiao Tong University,Shanghai 200240, China; [email protected] (Y.-S.X.); [email protected] (D.-J.R.);[email protected] (H.-N.W.)* Correspondence: [email protected]; Tel.: +86-21-3420-4301; Fax: +86-21-6419-1030
Academic Editor: Marc A. RosenReceived: 18 March 2016; Accepted: 13 June 2016; Published: 17 June 2016
Abstract: It has been observed that in the urban center of Shanghai, land subsidence has accelerated,and the groundwater level has continued to drop even though the net withdrawn volume (NWV)of groundwater has remained unchanged since 1980. An analysis of monitoring data shows thatdrawdown of the groundwater level is one of the factors that have influenced land subsidencesince 1980. The NWV of groundwater in urban areas, however, is not the critical factor controllingthe drawdown of the groundwater level. Since the 1980s, there have been many undergroundworks constructed in the unique strata of Shanghai, which has an interlayered structure knownas a multi-aquifer-aquitard system (MAAS). Investigation into land subsidence caused by urbanconstruction is now receiving much attention. Based on the principle of a strategic environmentalassessment (SEA) for sustainable urban development, this paper presents a discussion and analysis ofthe factors which can influence the development of land subsidence during continued urbanizationin Shanghai. The main factors include the additional loading caused by the construction of structures,the cut-off effect due to construction in aquifers, the drawdown of groundwater level caused byleakage into underground structures, and the decrease of groundwater recharge from neighboringzones. SEA is recommended for the future development of Shanghai.
Keywords: land subsidence; groundwater; urbanisation; strategic environmental assessment
1. Introduction
Groundwater is the most important resource which is extracted worldwide for irrigation, industry,and domestic use. Much research is conducted into maintaining sustainable levels of groundwaterextraction [1–3]. In Shanghai, groundwater pumping started in the early 1860s, and it has resultedin serious land subsidence [4–7]. The average cumulative subsidence as of 2009 in the urban areahas reached 1.97 m [6]. Since 1966, measures relating to groundwater control have been adopted(such as banning unnecessary groundwater withdrawal, changing the withdrawal source to deeperaquifers, and adopting artificial recharge [7,8]). With these measures implemented, land subsidencewas controlled for a period of time. However, since the 1990s, land subsidence has again increased.
With the rapid expansion of urban development since the 1990s, a significant amount of municipalinfrastructure, such as water supply, gas pipelines, electric transmission lines, metro lines, undergroundstructures, and high-rise buildings, has been constructed. Environmental sustainability has becomea focal point in urban development [9,10]. Urbanization seriously affects the natural environment, notonly in terms of environmental pollution, but also in the deterioration of the geological environment,which can induce geohazards.
Sustainability 2016, 8, 573; doi:10.3390/su8060573 www.mdpi.com/journal/sustainability
Sustainability 2016, 8, 573 2 of 12
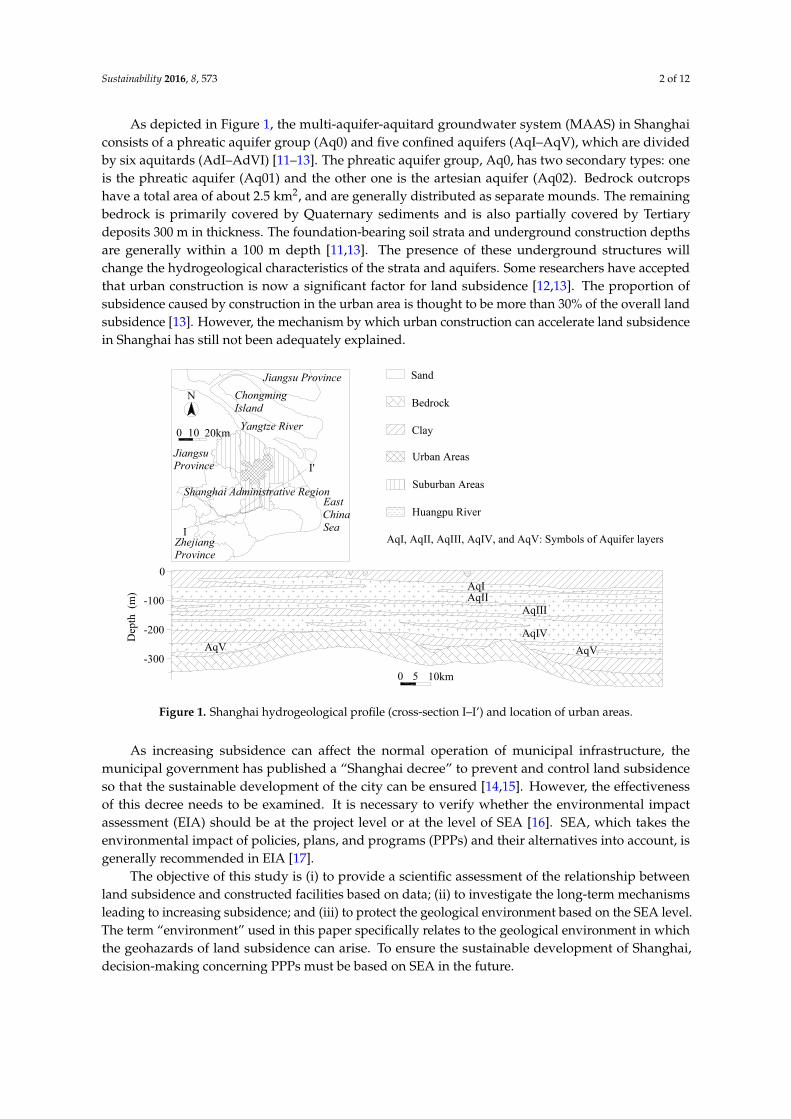
As depicted in Figure 1, the multi-aquifer-aquitard groundwater system (MAAS) in Shanghaiconsists of a phreatic aquifer group (Aq0) and five confined aquifers (AqI–AqV), which are dividedby six aquitards (AdI–AdVI) [11–13]. The phreatic aquifer group, Aq0, has two secondary types: oneis the phreatic aquifer (Aq01) and the other one is the artesian aquifer (Aq02). Bedrock outcropshave a total area of about 2.5 km2, and are generally distributed as separate mounds. The remainingbedrock is primarily covered by Quaternary sediments and is also partially covered by Tertiarydeposits 300 m in thickness. The foundation-bearing soil strata and underground construction depthsare generally within a 100 m depth [11,13]. The presence of these underground structures willchange the hydrogeological characteristics of the strata and aquifers. Some researchers have acceptedthat urban construction is now a significant factor for land subsidence [12,13]. The proportion ofsubsidence caused by construction in the urban area is thought to be more than 30% of the overall landsubsidence [13]. However, the mechanism by which urban construction can accelerate land subsidencein Shanghai has still not been adequately explained.
Sustainability 2016, 8, 573 2 of 12
the natural environment, not only in terms of environmental pollution, but also in the deterioration
of the geological environment, which can induce geohazards.
As depicted in Figure 1, the multi‐aquifer‐aquitard groundwater system (MAAS) in Shanghai
consists of a phreatic aquifer group (Aq0) and five confined aquifers (AqI–AqV), which are divided
by six aquitards (AdI–AdVI) [11–13]. The phreatic aquifer group, Aq0, has two secondary types: one
is the phreatic aquifer (Aq01) and the other one is the artesian aquifer (Aq02). Bedrock outcrops have
a total area of about 2.5 km2, and are generally distributed as separate mounds. The remaining
bedrock is primarily covered by Quaternary sediments and is also partially covered by Tertiary
deposits 300 m in thickness. The foundation‐bearing soil strata and underground construction
depths are generally within a 100 m depth [11,13]. The presence of these underground structures
will change the hydrogeological characteristics of the strata and aquifers. Some researchers have
accepted that urban construction is now a significant factor for land subsidence [12,13]. The
proportion of subsidence caused by construction in the urban area is thought to be more than 30% of
the overall land subsidence [13]. However, the mechanism by which urban construction can
accelerate land subsidence in Shanghai has still not been adequately explained.
Figure 1. Shanghai hydrogeological profile (cross‐section I–I’) and location of urban areas.
As increasing subsidence can affect the normal operation of municipal infrastructure, the
municipal government has published a “Shanghai decree” to prevent and control land subsidence so
that the sustainable development of the city can be ensured [14,15]. However, the effectiveness of
this decree needs to be examined. It is necessary to verify whether the environmental impact
assessment (EIA) should be at the project level or at the level of SEA [16]. SEA, which takes the
environmental impact of policies, plans, and programs (PPPs) and their alternatives into account, is
generally recommended in EIA [17].
The objective of this study is (i) to provide a scientific assessment of the relationship between
land subsidence and constructed facilities based on data; (ii) to investigate the long‐term
mechanisms leading to increasing subsidence; and (iii) to protect the geological environment based
on the SEA level. The term “environment” used in this paper specifically relates to the geological
environment in which the geohazards of land subsidence can arise. To ensure the sustainable
development of Shanghai, decision‐making concerning PPPs must be based on SEA in the future.
0
-100
-200
-300
Dep
th (
m)
AqIAqII
AqIII
AqIV
AqVAqV
Sand
Clay
Bedrock
AqI, AqII, AqIII, AqIV, and AqV: Symbols of Aquifer layers
0 5 10km
Jiangsu Province
JiangsuProvince
ZhejiangProvince
Yangtze River
EastChinaSea
N
Shanghai Administrative Region
I'
I
Suburban Areas
20km100
ChongmingIsland
Urban Areas
Huangpu River
Figure 1. Shanghai hydrogeological profile (cross-section I–I’) and location of urban areas.
As increasing subsidence can affect the normal operation of municipal infrastructure, themunicipal government has published a “Shanghai decree” to prevent and control land subsidenceso that the sustainable development of the city can be ensured [14,15]. However, the effectivenessof this decree needs to be examined. It is necessary to verify whether the environmental impactassessment (EIA) should be at the project level or at the level of SEA [16]. SEA, which takes theenvironmental impact of policies, plans, and programs (PPPs) and their alternatives into account, isgenerally recommended in EIA [17].
The objective of this study is (i) to provide a scientific assessment of the relationship betweenland subsidence and constructed facilities based on data; (ii) to investigate the long-term mechanismsleading to increasing subsidence; and (iii) to protect the geological environment based on the SEA level.The term “environment” used in this paper specifically relates to the geological environment in whichthe geohazards of land subsidence can arise. To ensure the sustainable development of Shanghai,decision-making concerning PPPs must be based on SEA in the future.
Sustainability 2016, 8, 573 3 of 12
2. Methodology
2.1. Data Extraction
The land subsidence monitoring system includes monitoring of land subsidence levels and soildeformation, and monitoring of the groundwater regime, and is supervised by the Shanghai Instituteof Geology Survey (SIGS). All data on land subsidence, soil deformation, groundwater levels, andgroundwater withdrawn volume were extracted from the records of the SIGS. The land subsidencedata were extracted from the land subsidence level monitoring network in Shanghai. The area coveredby this network includes the entire administrative region of Shanghai. The distance between eachleveling point is about 0.5 km in the urban center [14,18]. The leveling is checked against GPS surveydata to ensure the accuracy of the land subsidence data. All of the soil deformation data were extractedfrom soil deformation monitoring stations, each one consisting of a bedrock benchmark and boreholeextensometers, which have been installed for decades, to form the soil deformation monitoringsystem [18,19]. The benchmarks are protected by high-quality thick seamless steel tubing, and cementmortar has been grouted into the joint between the boring holes and the steel tubes. Mineral explorationtheory and techniques were applied to design special borehole structures to convert the elevationsof formations at different depths to the ground level for correlating measurements. In this way themonitoring stations can reflect the soil deformation at different depths. The data for groundwaterlevels and groundwater withdrawn-recharged volume were extracted from a groundwater regimemonitoring network. The positions of groundwater level monitoring boreholes and the boreholeextensometers correspond to each other. All of the data on urban construction, including the distancesof metro lines from the operational floor area of buildings, were extracted from the archives of theShanghai Statistics Bureau (SSB) [20].
2.2. Data Analysis
Once the land subsidence data for each monitoring point had been extracted, they were treated asa sample of a population [16]. Generally, within any monitoring data sample, there are some abnormaldata which have been caused by systematic errors and observation errors, and so the Grubbs testmethod was used to identify and eliminate the abnormal data [17]. For a random sample of n items,a parameter Ti is expressed as follows
Ti “xi ´ x
s(1)
where, x “ 1n
nř
i“1xi, s “
d
1n
nř
i“1pxi ´ xq2, and xi is an observation selected arbitrarily from the sample.
Once Ti is equal to or greater than the limit T(n, α), which can be found in a Grubbs’ table,according to sample number (n) and confidence limits (α), xi is deemed to be abnormal data whichshould be eliminated from the sample [21–23].
Testing to determine the deviation from the sample average value was done to identifydata samples from the urban center and the suburbs, based on the t-distribution method [24].For two samples of n1 and n2 items, respectively, a parameter t is expressed as follows
t “|x1 ´ x2|
s px1 ´ x2q(2)
where x1, x2 = average value of Sample 1 and Sample 2; s2 px1 ´ x2q “pn1´1qs2
1`pn2´1qs22
pn1´1q`pn2´1q , s1, s2 = standarddeviation of Sample 1 and Sample 2.
Once t is lower than the limit t(f,α), which can be found in t-distribution tables, according todegrees of freedom (f ) and confidence limits (α), Sample 1 and Sample 2 are deemed to come fromone population.
Sustainability 2016, 8, 573 4 of 12
An analysis of the average subsidence in the urban center was then carried out based ona triangulated irregular network (TIN) by considering the distribution density of monitoring points [19].Each triangular shape in the TIN is formed by the shortest lines between two monitoring points.The area average subsidence in the urban area can be expressed as follows:
∆h “´
ÿ
Si ¨∆hi
¯
{ÿ
Si (3)
where ∆h = the area average subsidence; Si = the area of each triangle in the TIN; and ∆hi = the averagesubsidence of the center of the circle around each triangle.
3. Results
3.1. Increase in the Subsidence Rate since 1989
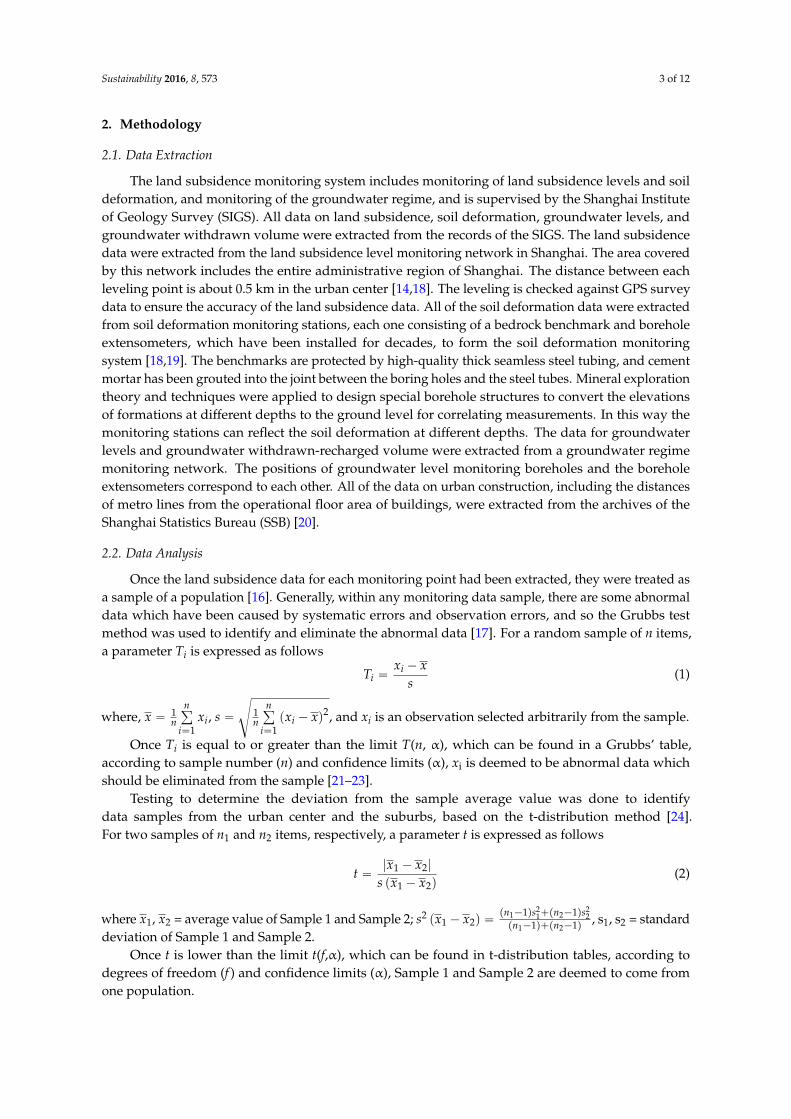
From 1921 to 1965, land subsidence and the net withdrawal volume (NWV), which equals thegroundwater withdrawal volume minus the groundwater recharge volume, both increased annuallyin the urban area [4,7,8,10,25]. Since 1966, some measures related to groundwater control have beenadopted, such as the banning of unnecessary groundwater withdrawal, changing the withdrawalsource to deeper aquifers, and adopting artificial recharge; additionally, land subsidence has beencontrolled within a small region [26]. However, after 1989, land subsidence increased again. Figure 2shows the variation in average cumulative subsidence in Shanghai since 1966, with elapsed time inyears. For comparison, the variation in the total building floor area which is defined as the sum of thearea of all the floors of all the buildings is also plotted in Figure 2. As depicted in Figure 2, the annualrate of land subsidence during each period reached 3.84 mm/year in 1980–1989 (vs1), 9.97 mm/yearin 1989–1995 (vs2), and 12.09 mm/year in 1995–2005 (vs3), while the rate of increase in floor area was0.58 ˆ 106, 2.30 ˆ 106, and 13.17 ˆ 106 m2/year, respectively [5,26]. The values of vs2 and vs3 aremore than two and three times vs1, respectively, so that even if the annual net withdrawn volumehad decreased, land subsidence still accelerated during the 1990s. A regression analysis was carriedout taking account of three main parameters: the floor area, the length of the metro lines, and thecumulative subsidence.
Sustainability 2016, 8, 573 4 of 12
Once t is lower than the limit t(f,α), which can be found in t‐distribution tables, according to
degrees of freedom (f) and confidence limits (α), Sample 1 and Sample 2 are deemed to come from
one population.
An analysis of the average subsidence in the urban center was then carried out based on a
triangulated irregular network (TIN) by considering the distribution density of monitoring points
[19]. Each triangular shape in the TIN is formed by the shortest lines between two monitoring points.
The area average subsidence in the urban area can be expressed as follows:
iii ShSh
(3)
where h = the area average subsidence; Si = the area of each triangle in the TIN; and hi = the average subsidence of the center of the circle around each triangle.
3. Results
3.1. Increase in the Subsidence Rate since 1989
From 1921 to 1965, land subsidence and the net withdrawal volume (NWV), which equals the
groundwater withdrawal volume minus the groundwater recharge volume, both increased annually
in the urban area [4,7,8,10,25]. Since 1966, some measures related to groundwater control have been
adopted, such as the banning of unnecessary groundwater withdrawal, changing the withdrawal
source to deeper aquifers, and adopting artificial recharge; additionally, land subsidence has been
controlled within a small region [26]. However, after 1989, land subsidence increased again. Figure 2
shows the variation in average cumulative subsidence in Shanghai since 1966, with elapsed time in
years. For comparison, the variation in the total building floor area which is defined as the sum of
the area of all the floors of all the buildings is also plotted in Figure 2. As depicted in Figure 2, the
annual rate of land subsidence during each period reached 3.84 mm/year in 1980–1989 (vs1), 9.97
mm/year in 1989–1995 (vs2), and 12.09 mm/year in 1995–2005 (vs3), while the rate of increase in floor
area was 0.58 × 10⁶, 2.30 × 10⁶, and 13.17 × 10⁶ m2/year, respectively [5,26]. The values of vs2 and vs3 are
more than two and three times vs1, respectively, so that even if the annual net withdrawn volume
had decreased, land subsidence still accelerated during the 1990s. A regression analysis was carried
out taking account of three main parameters: the floor area, the length of the metro lines, and the
cumulative subsidence.
1970 1980 1990 2000-2.2
-2.0
-1.8
-1.6
300
200
100
0
-100 Cumulative subsidence in urban centre
Cum
ulat
ive
subs
iden
ce (
m)
Year Note : v
s=Annual rate of subsidence (mm/a);
vf=13.17v
f=2.30
AD 1980 AD 1995AD 1989
Floor area (over 8 storeys)
Flo
or a
rea
(×10
6 m2 )
vf=Annual increase rate of floor area (×106m2/a)
vf=0.58
vs=3.84 v
s=9.97 v
s=12.09
Figure 2. Relationship between floor area and cumulative subsidence (based on Reference [25]).
Figure 2. Relationship between floor area and cumulative subsidence (based on Reference [25]).
Sustainability 2016, 8, 573 5 of 12
3.2. Subsidence and Groundwater Withdrawal
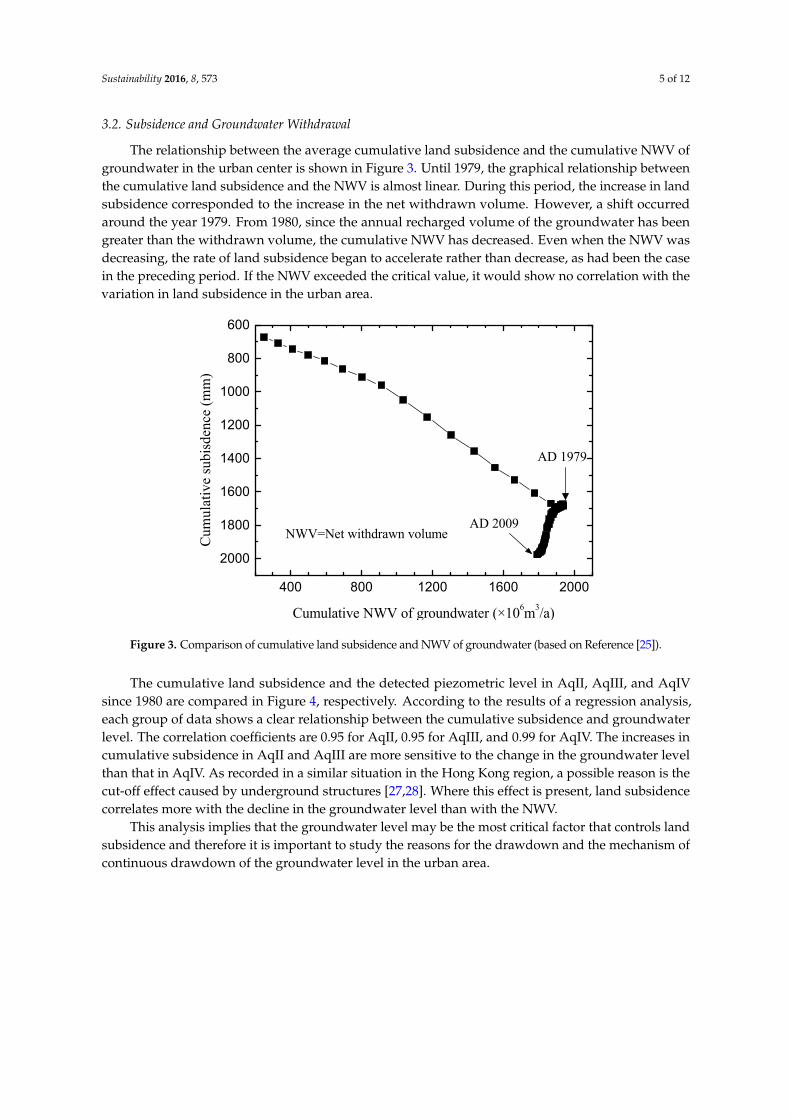
The relationship between the average cumulative land subsidence and the cumulative NWV ofgroundwater in the urban center is shown in Figure 3. Until 1979, the graphical relationship betweenthe cumulative land subsidence and the NWV is almost linear. During this period, the increase in landsubsidence corresponded to the increase in the net withdrawn volume. However, a shift occurredaround the year 1979. From 1980, since the annual recharged volume of the groundwater has beengreater than the withdrawn volume, the cumulative NWV has decreased. Even when the NWV wasdecreasing, the rate of land subsidence began to accelerate rather than decrease, as had been the casein the preceding period. If the NWV exceeded the critical value, it would show no correlation with thevariation in land subsidence in the urban area.
Sustainability 2016, 8, 573 5 of 12
3.2. Subsidence and Groundwater Withdrawal
The relationship between the average cumulative land subsidence and the cumulative NWV of
groundwater in the urban center is shown in Figure 3. Until 1979, the graphical relationship between
the cumulative land subsidence and the NWV is almost linear. During this period, the increase in
land subsidence corresponded to the increase in the net withdrawn volume. However, a shift
occurred around the year 1979. From 1980, since the annual recharged volume of the groundwater
has been greater than the withdrawn volume, the cumulative NWV has decreased. Even when the
NWV was decreasing, the rate of land subsidence began to accelerate rather than decrease, as had
been the case in the preceding period. If the NWV exceeded the critical value, it would show no
correlation with the variation in land subsidence in the urban area.
400 800 1200 1600 2000
2000
1800
1600
1400
1200
1000
800
600
AD 2009
Cum
ulat
ive
subi
sden
ce (
mm
)
Cumulative NWV of groundwater (×106m3/a)
NWV=Net withdrawn volume
AD 1979
Figure 3. Comparison of cumulative land subsidence and NWV of groundwater (based on Reference
[25]).
The cumulative land subsidence and the detected piezometric level in AqII, AqIII, and AqIV
since 1980 are compared in Figure 4, respectively. According to the results of a regression analysis,
each group of data shows a clear relationship between the cumulative subsidence and groundwater
level. The correlation coefficients are 0.95 for AqII, 0.95 for AqIII, and 0.99 for AqIV. The increases in
cumulative subsidence in AqII and AqIII are more sensitive to the change in the groundwater level
than that in AqIV. As recorded in a similar situation in the Hong Kong region, a possible reason is
the cut‐off effect caused by underground structures [27,28]. Where this effect is present, land
subsidence correlates more with the decline in the groundwater level than with the NWV.
This analysis implies that the groundwater level may be the most critical factor that controls
land subsidence and therefore it is important to study the reasons for the drawdown and the
mechanism of continuous drawdown of the groundwater level in the urban area.
Figure 3. Comparison of cumulative land subsidence and NWV of groundwater (based on Reference [25]).
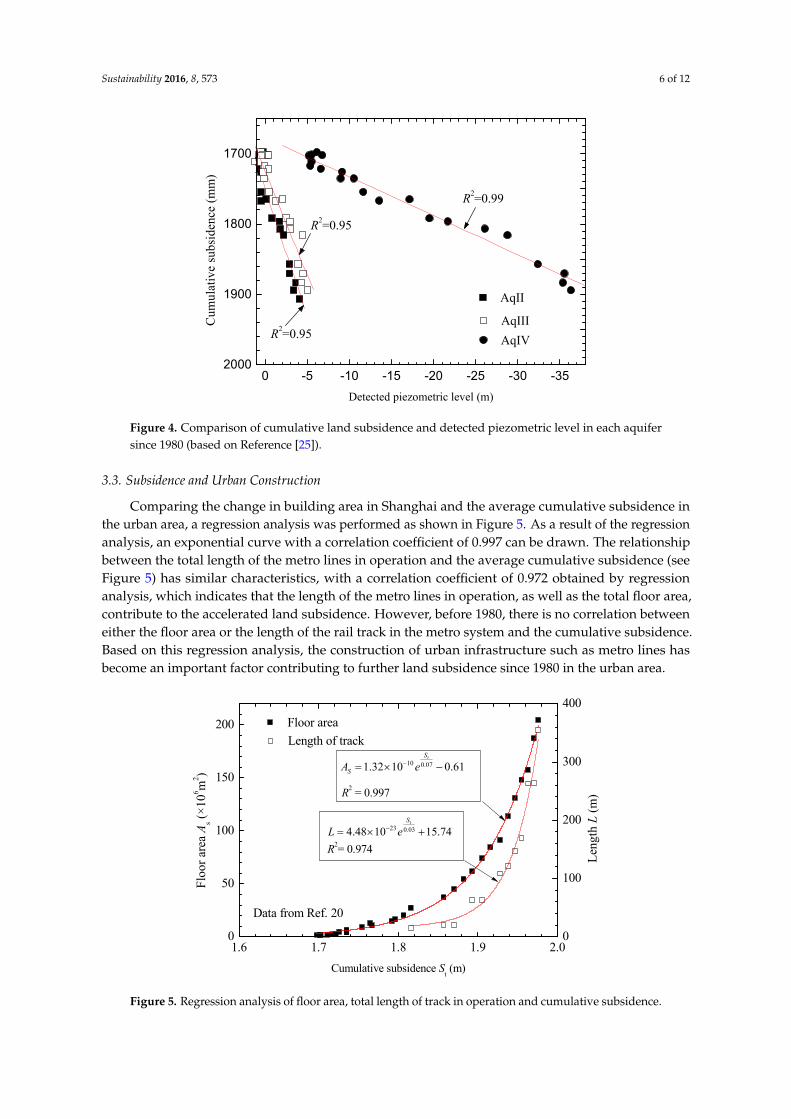
The cumulative land subsidence and the detected piezometric level in AqII, AqIII, and AqIVsince 1980 are compared in Figure 4, respectively. According to the results of a regression analysis,each group of data shows a clear relationship between the cumulative subsidence and groundwaterlevel. The correlation coefficients are 0.95 for AqII, 0.95 for AqIII, and 0.99 for AqIV. The increases incumulative subsidence in AqII and AqIII are more sensitive to the change in the groundwater levelthan that in AqIV. As recorded in a similar situation in the Hong Kong region, a possible reason is thecut-off effect caused by underground structures [27,28]. Where this effect is present, land subsidencecorrelates more with the decline in the groundwater level than with the NWV.
This analysis implies that the groundwater level may be the most critical factor that controls landsubsidence and therefore it is important to study the reasons for the drawdown and the mechanism ofcontinuous drawdown of the groundwater level in the urban area.
Sustainability 2016, 8, 573 6 of 12Sustainability 2016, 8, 573 6 of 12
0 -5 -10 -15 -20 -25 -30 -352000
1900
1800
1700
AqII
Cum
ulat
ive
subs
iden
ce (
mm
)
Detected piezometric level (m)
AqIII
AqIV
R2=0.99
R2=0.95
R2=0.95
Figure 4. Comparison of cumulative land subsidence and detected piezometric level in each aquifer
since 1980 (based on Reference [25]).
3.3. Subsidence and Urban Construction
Comparing the change in building area in Shanghai and the average cumulative subsidence in
the urban area, a regression analysis was performed as shown in Figure 5. As a result of the
regression analysis, an exponential curve with a correlation coefficient of 0.997 can be drawn. The
relationship between the total length of the metro lines in operation and the average cumulative
subsidence (see Figure 5) has similar characteristics, with a correlation coefficient of 0.972 obtained
by regression analysis, which indicates that the length of the metro lines in operation, as well as the
total floor area, contribute to the accelerated land subsidence. However, before 1980, there is no
correlation between either the floor area or the length of the rail track in the metro system and the
cumulative subsidence. Based on this regression analysis, the construction of urban infrastructure
such as metro lines has become an important factor contributing to further land subsidence since
1980 in the urban area.
1.6 1.7 1.8 1.9 2.00
50
100
150
200 Floor area
Flo
or a
rea
As (
×10
6 m2 )
Cumulative subsidence St (m)
R2= 0.974
10 0.071.32 10 0.61tS
SA e
R2 = 0.997
23 0.034.48 10 15.74tS
L e
Data from Ref. 20
0
100
200
300
400
Length of track
Len
gth
L (
m)
Figure 5. Regression analysis of floor area, total length of track in operation and cumulative
subsidence.
Figure 4. Comparison of cumulative land subsidence and detected piezometric level in each aquifersince 1980 (based on Reference [25]).
3.3. Subsidence and Urban Construction
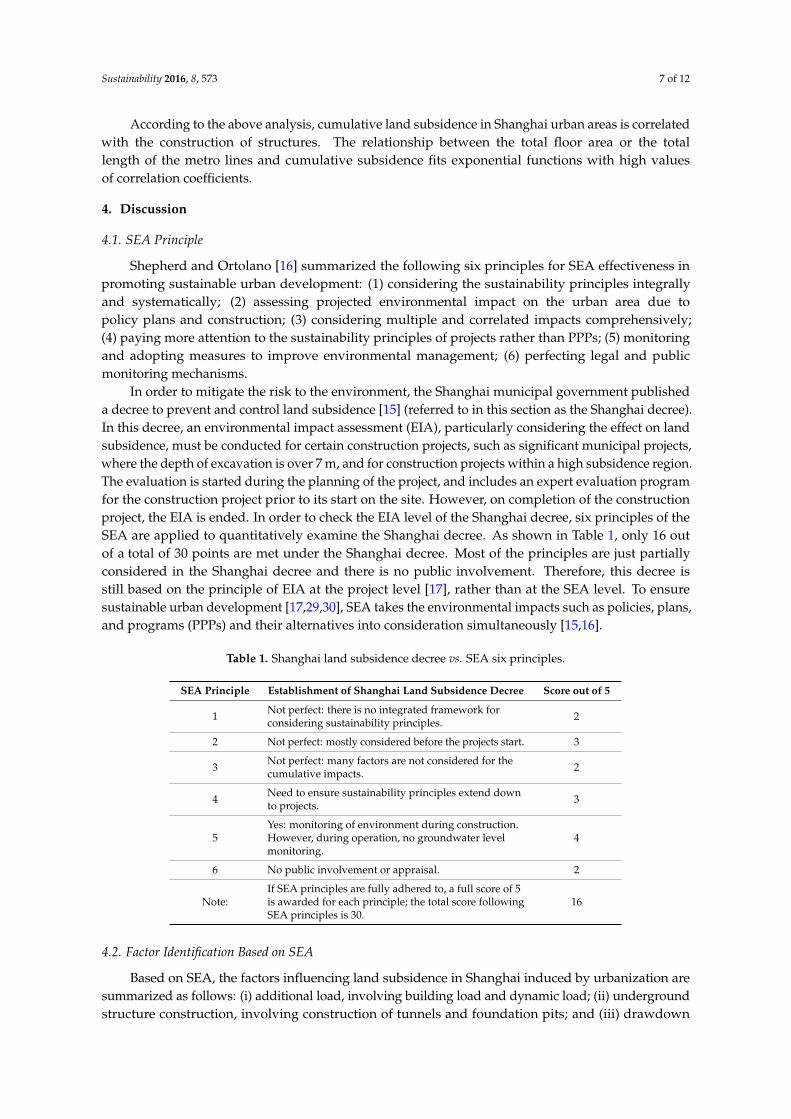
Comparing the change in building area in Shanghai and the average cumulative subsidence inthe urban area, a regression analysis was performed as shown in Figure 5. As a result of the regressionanalysis, an exponential curve with a correlation coefficient of 0.997 can be drawn. The relationshipbetween the total length of the metro lines in operation and the average cumulative subsidence (seeFigure 5) has similar characteristics, with a correlation coefficient of 0.972 obtained by regressionanalysis, which indicates that the length of the metro lines in operation, as well as the total floor area,contribute to the accelerated land subsidence. However, before 1980, there is no correlation betweeneither the floor area or the length of the rail track in the metro system and the cumulative subsidence.Based on this regression analysis, the construction of urban infrastructure such as metro lines hasbecome an important factor contributing to further land subsidence since 1980 in the urban area.
Sustainability 2016, 8, 573 6 of 12
0 -5 -10 -15 -20 -25 -30 -352000
1900
1800
1700
AqII
Cum
ulat
ive
subs
iden
ce (
mm
)
Detected piezometric level (m)
AqIII
AqIV
R2=0.99
R2=0.95
R2=0.95
Figure 4. Comparison of cumulative land subsidence and detected piezometric level in each aquifer
since 1980 (based on Reference [25]).
3.3. Subsidence and Urban Construction
Comparing the change in building area in Shanghai and the average cumulative subsidence in
the urban area, a regression analysis was performed as shown in Figure 5. As a result of the
regression analysis, an exponential curve with a correlation coefficient of 0.997 can be drawn. The
relationship between the total length of the metro lines in operation and the average cumulative
subsidence (see Figure 5) has similar characteristics, with a correlation coefficient of 0.972 obtained
by regression analysis, which indicates that the length of the metro lines in operation, as well as the
total floor area, contribute to the accelerated land subsidence. However, before 1980, there is no
correlation between either the floor area or the length of the rail track in the metro system and the
cumulative subsidence. Based on this regression analysis, the construction of urban infrastructure
such as metro lines has become an important factor contributing to further land subsidence since
1980 in the urban area.
1.6 1.7 1.8 1.9 2.00
50
100
150
200 Floor area
Flo
or a
rea
As (
×10
6 m2 )
Cumulative subsidence St (m)
R2= 0.974
10 0.071.32 10 0.61tS
SA e
R2 = 0.997
23 0.034.48 10 15.74tS
L e
Data from Ref. 20
0
100
200
300
400
Length of track
Len
gth
L (
m)
Figure 5. Regression analysis of floor area, total length of track in operation and cumulative
subsidence. Figure 5. Regression analysis of floor area, total length of track in operation and cumulative subsidence.
Sustainability 2016, 8, 573 7 of 12
According to the above analysis, cumulative land subsidence in Shanghai urban areas is correlatedwith the construction of structures. The relationship between the total floor area or the totallength of the metro lines and cumulative subsidence fits exponential functions with high valuesof correlation coefficients.
4. Discussion
4.1. SEA Principle
Shepherd and Ortolano [16] summarized the following six principles for SEA effectiveness inpromoting sustainable urban development: (1) considering the sustainability principles integrallyand systematically; (2) assessing projected environmental impact on the urban area due topolicy plans and construction; (3) considering multiple and correlated impacts comprehensively;(4) paying more attention to the sustainability principles of projects rather than PPPs; (5) monitoringand adopting measures to improve environmental management; (6) perfecting legal and publicmonitoring mechanisms.
In order to mitigate the risk to the environment, the Shanghai municipal government publisheda decree to prevent and control land subsidence [15] (referred to in this section as the Shanghai decree).In this decree, an environmental impact assessment (EIA), particularly considering the effect on landsubsidence, must be conducted for certain construction projects, such as significant municipal projects,where the depth of excavation is over 7 m, and for construction projects within a high subsidence region.The evaluation is started during the planning of the project, and includes an expert evaluation programfor the construction project prior to its start on the site. However, on completion of the constructionproject, the EIA is ended. In order to check the EIA level of the Shanghai decree, six principles of theSEA are applied to quantitatively examine the Shanghai decree. As shown in Table 1, only 16 outof a total of 30 points are met under the Shanghai decree. Most of the principles are just partiallyconsidered in the Shanghai decree and there is no public involvement. Therefore, this decree isstill based on the principle of EIA at the project level [17], rather than at the SEA level. To ensuresustainable urban development [17,29,30], SEA takes the environmental impacts such as policies, plans,and programs (PPPs) and their alternatives into consideration simultaneously [15,16].
Table 1. Shanghai land subsidence decree vs. SEA six principles.
SEA Principle Establishment of Shanghai Land Subsidence Decree Score out of 5
1 Not perfect: there is no integrated framework forconsidering sustainability principles. 2
2 Not perfect: mostly considered before the projects start. 3
3 Not perfect: many factors are not considered for thecumulative impacts. 2
4 Need to ensure sustainability principles extend downto projects. 3
5Yes: monitoring of environment during construction.However, during operation, no groundwater levelmonitoring.
4
6 No public involvement or appraisal. 2
Note:If SEA principles are fully adhered to, a full score of 5is awarded for each principle; the total score followingSEA principles is 30.
16
4.2. Factor Identification Based on SEA
Based on SEA, the factors influencing land subsidence in Shanghai induced by urbanization aresummarized as follows: (i) additional load, involving building load and dynamic load; (ii) undergroundstructure construction, involving construction of tunnels and foundation pits; and (iii) drawdown
Sustainability 2016, 8, 573 8 of 12
of groundwater level in the long term, possibly caused by leakage in tunnels and reduction ofgroundwater replenishment.
4.2.1. Additional Load
To date, most research has concentrated on additional building loads which result in landsubsidence. Since 1980, the number of high-rise buildings with pile foundations has exceeded 1000.When the pile length reaches 45 m, piles will have reached AqI, and if the length is from 60 mto 90 m, piles will have reached AqII. In order to analyze the effect of additional stresses due tobuilding loads, Tang et al. [31] conducted a model test which considered the influence of high-risebuildings. Jie et al. [32] found that the increase in land subsidence is highly correlated to the rate ofdevelopment of urban construction, and involves the distribution density of buildings, the regionalscale of construction, and the construction speed. The distinctive soft deposits in Shanghai have highcompressibility, long-term primary consolidation and sensitivity to additional load. Xu et al. [26]surmised that the maximum final settlement of a high rise building in the urban center is about50–100 mm, which is related to the characteristics of the soil and the type of pile foundations.
Dynamic loads caused by the construction of pile foundations and traffic loading are also a factorin land subsidence. When the seismic wave due to pile driving travels through the ground, deformationof the strata will occur due to the compression of soils. Jongmans [33] suggested that an influenceradius of 50 m should be considered during pile driving. There can also be an additional load fromembankment construction during urbanization [34,35], and cyclic loading due to traffic can also leadto the deformation of strata. According to an investigation made by Ling et al. [36], traffic loading at anintersection of the Shanghai outer ring road could result in a residual settlement of 50 mm. Wu et al.’sresults [37] showed that the influential depth in the subsoil, in the soft Shanghai deposits, due totrain vibration was around 4.5 m, and the maximum residual settlement from train vibration is about20 mm.
4.2.2. Ground Disturbance
Underground construction processes, such as the excavation of foundation pits, can causedisturbance of strata and lead to the deformation of surrounding layers. In addition, grounddisturbance caused during the construction of tunnels may continue to have an effect on settlementfor a long period of time. After the operation of Metro Line No. 1 for 15 years, the annual differentialsettlement of the tunnels was still significant. The average settlement was about 30 mm per year, but atone stage the maximum value of cumulative subsidence reached 350 mm within one year [38].
The effects of foundation pit excavation on land subsidence have become more apparent in recenttimes [39,40]. In order to maximize the use of underground space, excavations have become deeper andlarger. In Shanghai, excavation is generally done using the well-point dewatering method, which canlead to the depression of the groundwater level with the withdrawal of groundwater. This can resultin the influence radius of land subsidence being as much as 15 times the excavation depth. Based onengineering practice, the influence radius of dewatering in a foundation pit is about 130–180 m, andfor every 3.5 m reduction in groundwater level, there is 5–15 mm of ground settlement [39].
4.2.3. Long-Term Drawdown of Groundwater
Figure 3 shows that annual NWV, decreasing since 1980 in the urban area (marked in Figure 1),gradually becomes a less critical factor influencing the drawdown of the groundwater level. However,the drawdown of the groundwater level is still a major factor for land subsidence in the urban areaas shown in Figure 3. The potential factors for the drawdown of the groundwater level which ariseduring the process of urbanization are as follows:
(i) the increase of NWV in the suburban area; (ii) the cut-off effect of underground works on therecharge of groundwater from the suburban area to the urban area; (iii) the leakage of groundwaterinto metro tunnels.
Sustainability 2016, 8, 573 9 of 12
When the drawdown of groundwater was the result of pumping in the urban area, groundwaterin the suburban area flowed to the urban area as recharge. In the early period, the NWV in theurban area was much higher compared to that in the suburban area. However, the main region ofgroundwater withdrawal gradually moved to suburban areas in the 1970s. The ratio of the volume ofgroundwater withdrawn in urban areas to that in suburban areas was 1:70.7 in 1970, compared with 8:1in 1949, and 1:0.98 in 1964. Thus, the groundwater in urban areas lost recharge from suburban areas.
The cut-off effect of existing underground structures, which can influence the seepage ofgroundwater in aquifers, is another important reason for the reduction in recharge from suburbanareas to urban areas. For example, structures acting as diaphragm walls can hinder the groundwaterflowing in aquifers. Also, because of existing underground structures, groundwater in a hydrostaticpressure condition may change into a condition with an unsteady downward flow. Because of thecut-off effect of underground works, the steady flow in aquifers changes into turbulent flow, whichmakes the groundwater head around the bottom of underground structures lower than that aroundthe top [41–43].
The shield method is widely adopted in the construction of Shanghai metro lines. Usually, thelining in the metro tunnel consists of six segments, which means there are a lot of joints throughoutthe tunnel. Field investigations have found that groundwater leakage occurred frequently in jointsand cracks in segments and grouting holes [44–46]. During the initial period of construction, thevolume of groundwater leakage and the deformation of the tunnel can be ignored. However, as theleakage is developing, deformation of the tunnel and further leakage caused by differential settlementperpetuate the process. Wu et al. [46] concluded that leakage in tunnels can cause a decline in thegroundwater level and result in tunnel settlement. Leakage occurs not only in tunnels but also in deepexcavation works [47–51]. However, the reduction in the groundwater level contributes more to landsubsidence. It was concluded that the rate of leakage in Shanghai metro tunnels averaged 0.1 L/m2/dand the distribution of leakage locations was uniform along the tunnel. The expected magnitude ofland subsidence in the region with tunnels was only about 40 mm after 10 years.
Therefore, the potential factors contributing to land subsidence in the urban area include theadditional load caused by the construction of both above- and below-ground structures, well-pointdewatering in the excavation of foundation pits, groundwater leakage in metro tunnels duringconstruction and operation, and the reduction in groundwater recharge from the suburban areato the urban area due to the cut-off effect of underground structures, which is considered to be themain factor. Further research on the mechanisms of these factors causing land subsidence in the urbanarea of Shanghai is still required.
5. Conclusions
In general, based on SEA for sustainable urban development, the influencing factors which maylead to land subsidence during the urbanization of Shanghai are discussed. The conclusions aresummarized as follows:
(1) Land subsidence in Shanghai is closely correlated to construction in the urban area. The correlationbetween cumulative subsidence and the building area is strong, as is the correlation betweencumulative subsidence and the total length of the metro lines.
(2) The Shanghai decree for land subsidence control does not closely follow the principles of SEA toensure sustainable urban development. Most of the principles are only partially considered inthe Shanghai decree, and there is no public involvement in the Shanghai decree.
(3) The influencing factors resulting in increasing land subsidence in the urban area includeadditional load caused by construction, dewatering during excavation, groundwater leakageinto metro tunnels, and the reduction in groundwater recharge from the suburban area to theurban area.
Sustainability 2016, 8, 573 10 of 12
Acknowledgments: The research work described herein was funded by the National Nature Science Foundationof China (NSFC) (Grant No. 41472252) and partially supported by National Basic Research Program of China(973 Program: No. 2015CB057806). These financial supports are gratefully acknowledged.
Author Contributions: Ye-Shuang Xu collected the data and performed data analysis and drafted the manuscript,Shui-Long Shen did the SEA analysis, Dong-Jie Ren drew the figures, and Huai-Na Wu checked the dataand context.
Conflicts of Interest: The authors declare no conflict of interest.
References
1. Roumasset, J.A.; Wada, C.A. Optimal and Sustainable Groundwater Extraction. Sustainability 2010, 2,2676–2685. [CrossRef]
2. Becker, V.; Myrttinen, A.; Barth, J.A.; Bayer, P. A summary on the special issue “sustainability ofgroundwater”. Sustainability 2011, 3, 1792–1795. [CrossRef]
3. Xu, Y.S.; Yuan, Y.; Shen, S.L.; Yin, Z.Y.; Wu, H.N.; Ma, L. Investigation into subsidence hazards due togroundwater pumping from Aquifer II in Changzhou, China. Nat. Hazards 2015, 78, 281–296. [CrossRef]
4. Chai, J.C.; Shen, S.L.; Zhu, H.H.; Zhang, X.L. Land subsidence due to groundwater drawdown in Shanghai.Geotech. ICE 2004, 54, 143–147. [CrossRef]
5. Xue, Y.Q.; Zhang, Y.; Ye, S.J.; Wu, J.C.; Li, Q.F. Land subsidence in China. Environ. Geol. 2005, 48, 713–720.[CrossRef]
6. Shanghai Geological Environmental Bulletin (SGEB) (2001~2009). Available online: http://www.shgtj.gov.cn/dzkc/dzhjbg/ (accessed on 15 June 2016). (In Chinese)
7. Shen, S.L.; Xu, Y.S. Numerical evaluation of land subsidence induced by groundwater pumping in Shanghai.Can. Geotech. J. 2011, 48, 1378–1392. [CrossRef]
8. Xu, Y.S.; Shen, S.L.; Cai, Z.Y.; Zhou, G.Y. The state of land subsidence and prediction approaches due togroundwater withdrawal in China. Nat. Hazards 2008, 45, 123–135. [CrossRef]
9. Säynäjoki, E.S.; Heinonen, J.; Junnila, S. The power of urban planning on environmental sustainability:A focus group study in finland. Sustainability 2014, 6, 6622–6643. [CrossRef]
10. Xu, Y.S.; Shen, S.L.; Du, Y.J. Geological and hydrogeological environment in Shanghai with geohazards toconstruction and maintenance of infrastructures. Eng. Geol. 2009, 109, 241–254. [CrossRef]
11. Wu, Y.X.; Shen, S.L.; Wu, H.N.; Xu, Y.S.; Yin, Z.Y.; Sun, W.J. Environmental protection using dewateringtechnology in a deep confined aquifer beneath a shallow aquifer. Eng. Geol. 2015, 196, 59–70. [CrossRef]
12. Shanghai Geological Environmental Atlas Editorial Board (SGEAEB). Shanghai Geological Environmental Atlas;Geology Press: Beijing, China, 2002.
13. Gong, S.L.; Wu, J.Z.; Yan, X.X. Analysis on land subsidence due to construction engineering in soft soilregion of Shanghai. In Land Subsidence, Proceedings of the Seventh International Symposium on Land Subsidence;Zhang, A., Gong, S.L., Carbognin, L., Johnson, A.I., Eds.; Shanghai Scientific & Technical Publishers:Shanghai, China, 2005; Volume 1, pp. 82–87.
14. Zhang, A.G.; Wei, Z.X. Prevention and cure with Shanghai land subsidence and city sustaining development.In Land Subsidence, Proceedings of the Seventh International Symposium on Land Subsidence; Zhang, A., Gong, S.L.,Carbognin, L., Johnson, A.I., Eds.; Shanghai Scientific & Technical Publishers: Shanghai, China, 2005;Volume 1, pp. 82–87.
15. Procedures of Shanghai Municipality on the Administration of Prevention and Control of Surface Subsidence(in Chinese), Decree of Shanghai Municipal People’s Government No. 62, 2006. Available online: http://www.shanghai.gov.cn/nw2/nw2314/nw2319/nw11494/nw12654/nw15801/u26aw8263.html (accessedon 15 June 2016).
16. Shepherd, A.; Ortolano, L. Strategic environmental assessment for sustainable urban development.Environ. Impact Assess. Rev. 1996, 16, 321–335. [CrossRef]
17. Therivel, R. Systems of Strategic Environmental Assessment. Environ. Impact Assess. Rev. 1993, 13, 145–168.[CrossRef]
18. Shanghai Institute of Geology Survey (SIGS). Technical Specification for Land Subsidence Monitor and Control(DG/TJ08–2051–2008); China Architecture & Building Press: Shanghai, China, 2008.
Sustainability 2016, 8, 573 11 of 12
19. Zhang, A.G.; Gu, W.D. Design principle and construction technique of ground subsidence monitoring benchmark in Shanghai. Explor. Eng. 2000, 5, 67–69. (In Chinese)
20. Shanghai Statistics Yearbook (2000–2010). Available online: http://www.stats-sh.gov.cn/data/toTjnj.xhtml?y=2010e (accessed on 15 June 2016).
21. Wu, N.Q. Statistic Characteristics of recent settlement in Shanghai. Shanghai Geol. 1993, 2, 27–37. (In Chinese)22. Grubbs, F.E. Sample Criteria for testing outlying observations. Ann. Math. Stat. 1950, 21, 27–58. [CrossRef]23. Rice, J.A. Mathematical Statistics and Data Analysis, 3nd ed.; Duxbury Press: Pacific Grove, CA, USA, 2007.24. Tsai, V.J.D. Delaunay triangulations in TIN creation: An overview and a linear-time algorithm. Int. J. Geogr.
Inf. Syst. 1993, 7, 501–524. [CrossRef]25. Xu, Y.S.; Ma, L.; Du, Y.J.; Shen, S.L. Analysis on urbanization induced land subsidence in Shanghai.
Nat. Hazards 2012, 63, 1255–1267. [CrossRef]26. Gong, S.L. The state of land subsidence in Shanghai and its control countermeasures. Shanghai Constr.
Sci. Technol. 1996, 5, 11–12. (In Chinese)27. Geotechnical Control Office. Mid-levels Study; Report on Geology, Hydrology and Soil Properties;
Geotechnical Control Office: Hong Kong, China, 1982.28. Jiao, J.J.; Leung, C.M.; Ding, G.P. Changes to the groundwater system, from 1888 to present, in a highly-urbanized
coastal area in Hong Kong, China. Hydrogeol. J. 2008, 16, 1527–1539. [CrossRef]29. Noble, B.F. The Canadian experience with SEA and sustainability. Environ. Impact Assess. Rev. 2002, 22, 3–16.
[CrossRef]30. Fischer, T.B.L. Strategic environmental assessment in post-modern times. Environ. Impact Assess. Rev. 2003,
23, 155–170. [CrossRef]31. Tang, Y.Q.; Cui, Z.D.; Wang, J.X.; Lu, C.; Yan, X.X. Model test study of land subsidence caused by high-rise
building group in Shanghai. Bull. Eng. Geol. Environ. 2008, 67, 173–179. [CrossRef]32. Jie, Y.X.; Gao, Y.; Li, G.X. Analysis on the land subsidence induced by city construction. Geotech. Eng. Tech.
2007, 21, 78–82. (In Chinese)33. Jongmans, D. Prediction of ground vibrations caused by pile driving: A new methodology. Eng. Geol. 1996,
42, 25–36. [CrossRef]34. Zhang, N.; Shen, S.L.; Wu, H.N.; Chai, J.C.; Yin, Z.Y. Evaluation of performance of embankments with
reinforcement on PVD-improved marine clay. Geotext. Geomembr. 2015, 43, 506–514. [CrossRef]35. Wu, H.N.; Shen, S.L.; Ma, L.; Yin, Z.Y.; Horpibulsuk, S. Evaluation of the strength increase of marine clay
under staged embankment loading: A case study. Mar. Georesour. Geotechnol. 2015, 33, 532–541. [CrossRef]36. Ling, J.M.; Wang, W.; Wu, H.B. On residual deformation of saturated clay subgrade under vehicle load.
J. Tongji Univ. 2002, 30, 1315–1320. (In Chinese)37. Wu, H.N.; Shen, S.L.; Chai, J.C.; Zhang, D.M.; Xu, Y.S. Evaluation of the train-load-induced settlement of
metro tunnels in Shanghai. ICE Proc. Geotech. Eng. 2015, 168, 396–409. [CrossRef]38. Shanghai Metro Running Management Co. Ltd. Report of Monitoring on Shanghai Metro Tunnels in 2007
(RMSMT); Shanghai Metro Running Management Co. Ltd: Shanghai, China, 2007. (In Chinese)39. Gong, S.L.; Ye, W.M.; Chen, H.S.; Chen, B.; Yang, T.L.; Wan, M. Theory and methodology on assessment
of land subsidence caused by excavation engineering for deep foundation pit in Shanghai. Chin. J. Geol.Hazard Control 2008, 19, 55–60. (In Chinese)
40. Huang, S.M.; Gao, D.Z. Soft Soil and Underground Engineering, 2nd ed.; China Architecture & Building Press:Beijing, China, 2005. (In Chinese)
41. Xu, Y.S.; Shen, S.L.; Ma, L.; Sun, W.J.; Yin, Z.Y. Evaluation of the blocking effect of retaining walls ongroundwater seepage in aquifers with different insertion depths. Eng. Geol. 2014, 183, 254–264. [CrossRef]
42. Ma, L.; Xu, Y.S.; Shen, S.L.; Sun, W.J. Evaluation of the hydraulic conductivity of aquifer with piles.Hydrogeol. J. 2014, 22, 371–382. [CrossRef]
43. Xu, Y.S.; Ma, L.; Shen, S.L.; Sun, W.J. Evaluation of land subsidence by considering underground structurespenetrated into aquifers in Shanghai. Hydrogeol. J. 2012, 20, 1623–1634. [CrossRef]
44. Shen, S.L.; Wu, H.N.; Cui, Y.J.; Yin, Z.Y. Long-term settlement behavior of the metro tunnel in Shanghai.Tunn. Undergr. Space Technol. 2014, 40, 309–323. [CrossRef]
45. Wu, H.N.; Shen, S.L.; Liao, S.M.; Yin, Z.Y. Longitudinal structural modelling of shield tunnels consideringshearing dislocation between segmental rings. Tunn. Undergr. Space Technol. 2015, 50, 317–323. [CrossRef]
Sustainability 2016, 8, 573 12 of 12
46. Wu, H.N.; Huang, R.Q.; Sun, W.J.; Shen, S.L.; Xu, Y.S.; Liu, Y.B.; Du, S.J. Leaking behaviour of shield tunnelsunder the Huangpu River of Shanghai with induced hazards. Nat. Hazards 2014, 70, 1115–1132. [CrossRef]
47. Shen, S.L.; Wang, J.P.; Wu, H.N.; Xu, Y.S.; Ye, G.L.; Yin, Z.Y. Evaluation of hydraulic conductivity for bothmarine and deltaic deposit based on piezocone test. Ocean Eng. 2015, 110, 174–182. [CrossRef]
48. Luo, C.Y.; Shen, S.L.; Han, J.; Ye, G.L.; Horpibulsuk, S. Hydrogeochemical environment of aquifersgroundwater in Shanghai and potential hazards to underground infrastructures. Nat. Hazards 2015, 78,753–774. [CrossRef]
49. Wu, Y.X.; Shen, S.L.; Xu, Y.S.; Yin, Z.Y. Characteristics of groundwater seepage with cutoff wall in gravelaquifer. I: Field observations. Can. Geotech. J. 2015, 52, 1526–1538.
50. Wu, Y.X.; Shen, S.L.; Yin, Z.Y.; Xu, Y.S. Characteristics of groundwater seepage with cutoff wall in gravelaquifer. II: Numerical analysis. Can. Geotech. J. 2015, 52, 1539–1549.
51. Shen, S.L.; Wu, Y.X.; Xu, Y.S.; Hino, T.; Wu, H.N. Evaluation of hydraulic parameter based on groundwaterpumping test of multi-aquifer system of Tianjin. Comput. Geotech. 2015, 68, 196–207. [CrossRef]
© 2016 by the authors; licensee MDPI, Basel, Switzerland. This article is an open accessarticle distributed under the terms and conditions of the Creative Commons Attribution(CC-BY) license (http://creativecommons.org/licenses/by/4.0/).


![Study of land subsidence around the city of Shirazscientiairanica.sharif.edu/article_2167_b3bb54f3fcf13e2c...tectonic subsidence, and etc. [2]. Land subsidence, as a serious crisis,](https://img.pdfslide.us/doc/110x75/5f81603bf7f7323e190f6f7c/study-of-land-subsidence-around-the-city-of-s-tectonic-subsidence-and-etc.jpg)