Embed Size (px)
Citation preview
© 2018 JETIR November 2018, Volume 5, Issue 11 www.jetir.org (ISSN-2349-5162)
JETIR1811B11 Journal of Emerging Technologies and Innovative Research (JETIR) www.jetir.org 76
Analysis of Dijkstra’s And Bellman Ford Algorithm
in Passenger flow and Tweet changes
1Rutuja Shrikant Bangar 2 Prof. Dr.S.N.Kakarwal 1Student of M.E. (CSE), 2Professor of CSE, 1P.E.S. College of Engineering ‘Aurangabad. 2 P.E.S. College of Engineering, Aurangabad.
ABSTRACT-
Transportation framework in mega city is regularly influenced by different sorts of occasions, for example, normal disaster,
accidents. Exceptionally thick and complicated network in the transportation frameworks of increase quickly in number in the
system since they offer different conceivable exchange courses to travelers. Visualization is one of the most critical methods for
analyzing such cascades of abnormal circumstances within the network. This paper proposes visual coordination of movement
examination and web-based social organizing examination utilizing two sorts of stream: smart card data on the Metro city and
social media life on the outline. Our framework gives various facilitated perspectives to outwardly, instinctively, and at the same
time investigate changes in travelers’ conduct and strange circumstances from smart card information and situational
clarifications from real voices of traveler, for example, objections about administrations removed from web-based life
information. At that point, the different employments of the information at three levels of administration are described: strategic
(long-term arranging), tactical (benefit alterations and system advancement), and operational (ridership insights and execution
markers). Likewise detailed are smart card commercialization tests led everywhere throughout the world.
Keywords: information visualization, public transportation, Smart card, transportation demand and visual analysis.
1 INTRODUCTION
The smart card is being utilized increasingly by open travel organizations, This technology is not modern. The primary obvious
was distributed in 1968 by Dethloff and Grotrupp, two German inventors, who created the concept of a smart card containing a
microchip (Shelfer and Procaccino, 2002). In 1970, the Japanese taken after the lead of the Germans and enrolled a patent for
their possess form of the smart card (Attoh‐Okine & Shen, 1995). At the end of 1970, Motorola created the primary secure single
chip microcontroller, which is utilized by the French banking framework to make security in exchanges. In any case, it is since
1990 that the utilize of the smart card has gotten to be critical, with the exponential development of the Web and the increased
advancement of mobile communication innovations (Blythe, 2004) [1].
The public transportation system which causes large-scale movements of people over the wide area around Metro City. Powerful
inland earthquakes are also estimated to possibly occur in the metro city transportation area. Public transportation systems are
now preparing responses for these events.
To increase the resilience of the systems, lessons must be learned from past events to understand how the systems are affected by
changes in passengers’ behaviors. Integration of smart card data and social media data enables us to replay past events and to
discover abnormal situations of transportation systems, propagations of abnormalities over transportation networks, and
passengers’ complaints or dissatisfaction about which even train system operators and station staff do not know. Our final goal is
to implement the system for real-time analysis and prediction of passenger behaviors in a complex transportation system using
real-time transportation logs and social media streams. It can support the evidence-based improvements of customer services such
as an optimal operation of transportation systems, navigation of passengers, and allocation of sufficient staff, trains, and other
© 2018 JETIR November 2018, Volume 5, Issue 11 www.jetir.org (ISSN-2349-5162)
JETIR1811B11 Journal of Emerging Technologies and Innovative Research (JETIR) www.jetir.org 77
resources. It would also help offer proper staff training. Moreover, it can adapt to digital sign advertising to select appropriate
advertisements for passengers going to gatherings such as sporting events or concerts.
As the first step to this goal, this paper proposes a novel visual fusion analysis environment that can support ex-post evaluations
of trouble in a metro system by using two forms of information: documented transportation logs from the smart card system of the
Metro city and social media information. Knowledge acquired through the visualized results mostly reflects real situations such as
disasters, accidents, and public gatherings. For supporting effective exploration, the environment needs to satisfy the following
requirements:
1) Discovering unusual phenomena from the wide range of temporal overviews that are derived from differences between daily
and event-driven passenger behaviors. The techniques for intuitively verifying effects of known events and discovering trouble
unknown to even train system operators are desired.
2) Understanding changes in passenger flows and spatial propagation of unusual phenomena in each time period on a wide area
metro network. A visual exploration environment is necessary to intuitively understand the route, speed, and range of propagation
of the unusual phenomena such as abnormal crowdedness. These are difficult for the train system operators to understand because
the transportation system network in smart city is extremely dense and complicated.
3) Exploring reasons for unusual phenomena or their effects from real users’ voices. A system is required for exploring
information about passengers’ complaints, activities such as use of taxis or buses, and confusing Situations in stations, which
often cannot be obtained from customer support or operation trouble databases. [2]
We demonstrate the usefulness of our novel visualization system through a series of case studies extracted from real data related
to natural disasters, accidents, and public gatherings. These case studies show how our visualization system enables users such as
domain experts in the metro operating company to explore hidden knowledge based on data-driven analysis and visualization that
were previously unattainable.
In summary, we have made the following contributions.
(1) We introduce one of the first Frames of analysis systems that use of smart card data including Passenger Flow data and social
media data. (2) Our system strongly highlights the effectiveness of used for visualization using real data and domain [3].
The Smart card
Smart Cards are being used throughout the world to collect fares for smart city public transport systems. A smart card is basically
a piece of plastic that has the size and dimensions of a credit card, being exceptionally versatile and tough. It encompasses a
microchip that performs all the fundamental capacities it was conceived for, primarily putting away, processing and composing
information. This capacity for the card for exchanging information makes it exceptionally valuable for a number of conceivable
outcomes. Smart cards can be utilized in a wide range of different segments, but in this project, as it were they are utilized in open
transport framework as a strategy of collecting admissions is considered. Smart cards claim to revolutionize open transport
passenger involvement, and how travel frameworks work. Smart cards are long-term of high quality ‘integrated ticketing’. Smart
card innovation isn't new; it was designed more than 30 a long time back. Be that as it may, at the starting it was presented to the
advertising based on a push methodology rather than a pull methodology, which made a few failures that disheartened the
transport industry from contributing in this kind of innovation amid the 90s. (Barry et al., 2002) . In any case, over the time smart
card finished taking off after the introduction of the Octopus card in Hong Kong and it was at that point within the 2000s when
smart cards were progressively embedded around the world. [4]
2. RELATED WORK
Smart card data is one of the data sources to analyze the operation of public transportation systems [5], [6]. Ceapa et al. focused
on congestion patterns of some underground stations in London to reveal station crowding patterns to avoid traffic crowdedness
[7]. They utilized data of Oyster cards, the smart cards used on the London Underground. Their Spatio-temporal analysis showed
© 2018 JETIR November 2018, Volume 5, Issue 11 www.jetir.org (ISSN-2349-5162)
JETIR1811B11 Journal of Emerging Technologies and Innovative Research (JETIR) www.jetir.org 78
a highly regular crowding pattern during the Before Passenger Flow with large spikes occurring in short time intervals. Sun et al.
provided a model to predict the spatiotemporal density of passengers and analyzed it for one MRT line in Singapore [8].
However, previous work only focused on a single selected line or some stations. One reason is that most smart card data does not
include transfer station information. Our work speculates the most probable path of each trip from origin and destination in smart
card data and succeeds in visualizing the propagation of effects of trouble on the metro network. Zeng et al. [9] provided a
visualization system to explore passenger mobility in Singapore public transportation systems including Metro system and public
bus network. They estimated various mobility-related factors such as waiting time, riding time, transfer time, and travel efficiency
using data including passenger journey data via RFID card, transit line schedule data, and transportation network data. They then
visualized them to explore geographical accessibility, time-efficient routes and their temporal variations along the origin-
destination journeys. Although they focused on visualizing mobility-related information along routes from a specific origin in a
tree structure, our work focus on visualizing Spatio-temporal propagation of crowdedness or emptiness in a complicated network.
As far as we know, there has been no research on the visualization of propagation of influences spreading over a wide range of
public transportation systems such as metro networks.
3. PROPOSED SYSTEM
We construct an analytical framework which can integrate both smart card and Social media data to explore passengers’
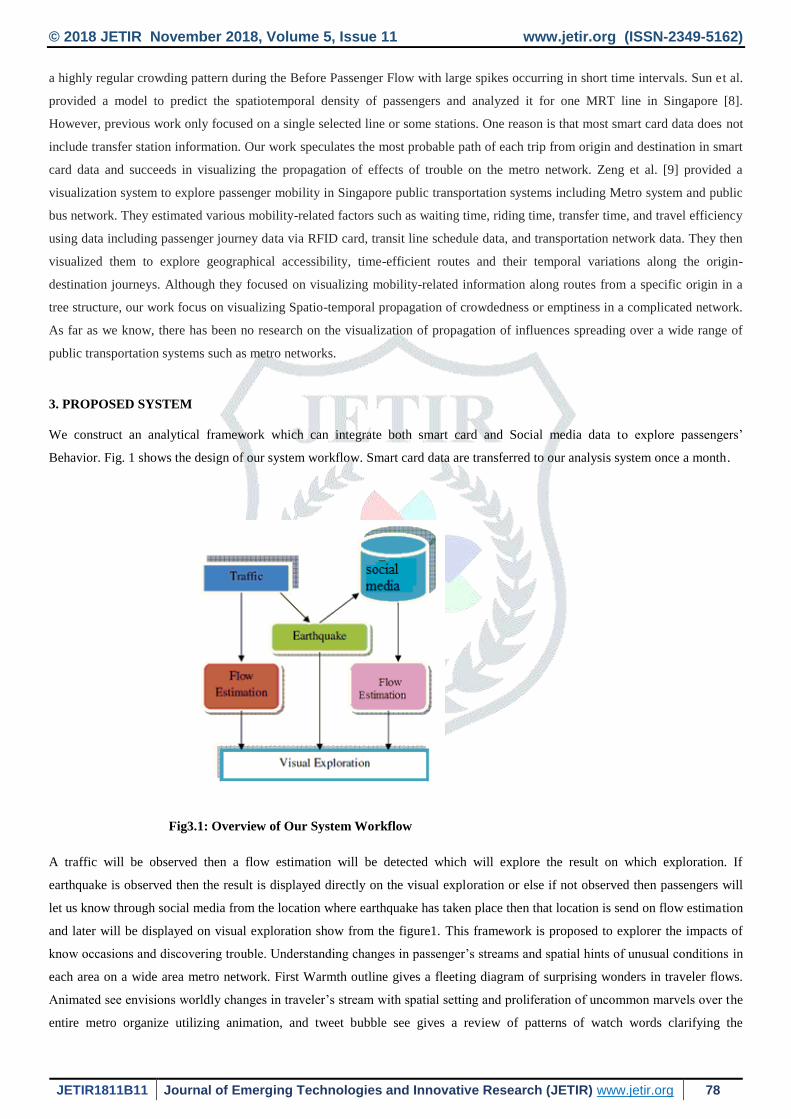
Behavior. Fig. 1 shows the design of our system workflow. Smart card data are transferred to our analysis system once a month.
Fig3.1: Overview of Our System Workflow
A traffic will be observed then a flow estimation will be detected which will explore the result on which exploration. If
earthquake is observed then the result is displayed directly on the visual exploration or else if not observed then passengers will
let us know through social media from the location where earthquake has taken place then that location is send on flow estimation
and later will be displayed on visual exploration show from the figure1. This framework is proposed to explorer the impacts of
know occasions and discovering trouble. Understanding changes in passenger’s streams and spatial hints of unusual conditions in
each area on a wide area metro network. First Warmth outline gives a fleeting diagram of surprising wonders in traveler flows.
Animated see envisions worldly changes in traveler’s stream with spatial setting and proliferation of uncommon marvels over the
entire metro organize utilizing animation, and tweet bubble see gives a review of patterns of watch words clarifying the
© 2018 JETIR November 2018, Volume 5, Issue 11 www.jetir.org (ISSN-2349-5162)
JETIR1811B11 Journal of Emerging Technologies and Innovative Research (JETIR) www.jetir.org 79
circumstance amid the abnormal wonders. We are also use the Dijkstra algorithm, to find the shortest path for travelers and
passengers in abnormal situations.
3.1. DIJKSTRA ALGORITHM
This is used for finding the shortest paths from a single node to a single destination node by stopping the algorithm once the
shortest path to the destination node has been determined. We assume that total travel time (t) of each trip is defined as t ¼ T þ C
þW, where:
T is the time while passengers are riding trains. It defined by using the timetable.
C is the walking time while passengers are transferring trains. It relates to the structure of the station, so it differs at
every station. We roughly define these times by using the information from the train company.
W is the time waiting for a transfer. We define this as (average train interval / 2) extracted from the timetable. It differs
on every line.
Algorithm Notation:
d` denotes the distance value of a node `.
p or t denotes the status label of a node, where p stand for permanent and t stands for temporary
cij is the cost of traversing link (i, j) as given by the problem The state of a node ` is the ordered pair of its
distance value d` and its status label.
3.1.1 Algorithm
Step 1: Initialization
• Assign the zero distance value to node s, and label it as Permanent. [The state of node s is (0, p).]
• Assign to every node a distance value of ∞ and label them as Temporary. [The state of every other node is (∞, t).]
• Designate the node s as the current node.
Step 2: Distance Value Update and Current Node Designation Update
Let i be the index of the current node.
(1) Find the set J of nodes with temporary labels that can be reached from the current node i by a link (i, j). Update
the distance values of these nodes.
• For each j ∈ J, the distance value dj of node j is updated as follows new dj = min {dj, di + cij} where cij is the
cost of link (i, j), as given in the network problem.
(2) Determine a node j that has the smallest distance value dj among all nodes j ∈ J,
Find j ∗ such that min j∈J dj = dj ∗
(3) Change the label of node j ∗ to permanent and designate this node as the current node.
Step 3: Termination Criterion
If all nodes that can be reached from node s have been permanently labeled, then stop - we are done.
If we cannot reach any temporary labeled node from the current node, then all the temporary labels become
permanent - we are done. Otherwise, go to Step 2.
3.2 BELLMAN FORD ALGORITHM
The Bellman-Ford algorithm uses relaxation to find single source shortest paths on directed graphs. And it is also contain
negative edges. The algorithm will also detect if there are any negative weight cycles (such that there is no solution). If talking
absout distances on a map, there is no any negative distance. It relaxes all the edges, and does this |V| - 1 time, where |V| is the
number of vertices in the graph. The cost of a path is the sum of edge weights in the path. Now srv is source and this is single
© 2018 JETIR November 2018, Volume 5, Issue 11 www.jetir.org (ISSN-2349-5162)
JETIR1811B11 Journal of Emerging Technologies and Innovative Research (JETIR) www.jetir.org 80
source shortest path problem so find distance form single source to different destination. This algorithm return value that negative
cycle is present or not and also return shortest path. This algorithm find shortest path in bottom up manner.
3.2.1 Algorithm
Step 1: initialize graph
Step 2: Relaxation of edges
Step 3: Checking negative cycle
4. Case Study:
4.1 Engineering student run over by car while heading to tuitions (Oct 25, 2018, 01.22 PM):
AURANGABAD: In yet another hit and run case in the city, a 17-year old engineering student was crushed by an
unidentified vehicle, while she was heading for tuitions at Osmanpura on her moped on Wednesday morning. The deceased,
identified as Vaibhavi Sunil Kherad, a resident of Chanakyapuram, came under the wheels of a speeding four wheeler at around
8.30am at the crossroad in the Peer Bazar area of the city. She was studying in the first year of a diploma in mechanical
engineering after securing 87% marks earlier this year in the SSC exams. Police said that the girl, the daughter of a realtor, was
riding a moped with the registration number MH-20-BR-0191, and was not wearing a helmet when she met with the accident. She
sustained fatal injuries in a manner that her head was crushed, resulting in her death on the spot. Soon, residents from the area
brought the matter to the notice of the area’s police, who rushed to the spot and took her to the Government Medical College and
Hospital (GMCH), where she was declared brought dead. After the incident came to light, the Osmanpura police have pressed in
several teams to identify and track down the driver of the unidentified vehicle. The police have registered a case of accidental
death but are in the process of turning it in to a case of causing death due to negligence, rash and negligent driving. Kalyan
Shelke, a sub-inspector of the Osmanpura police, said that several police teams have been working to identify the vehicle that
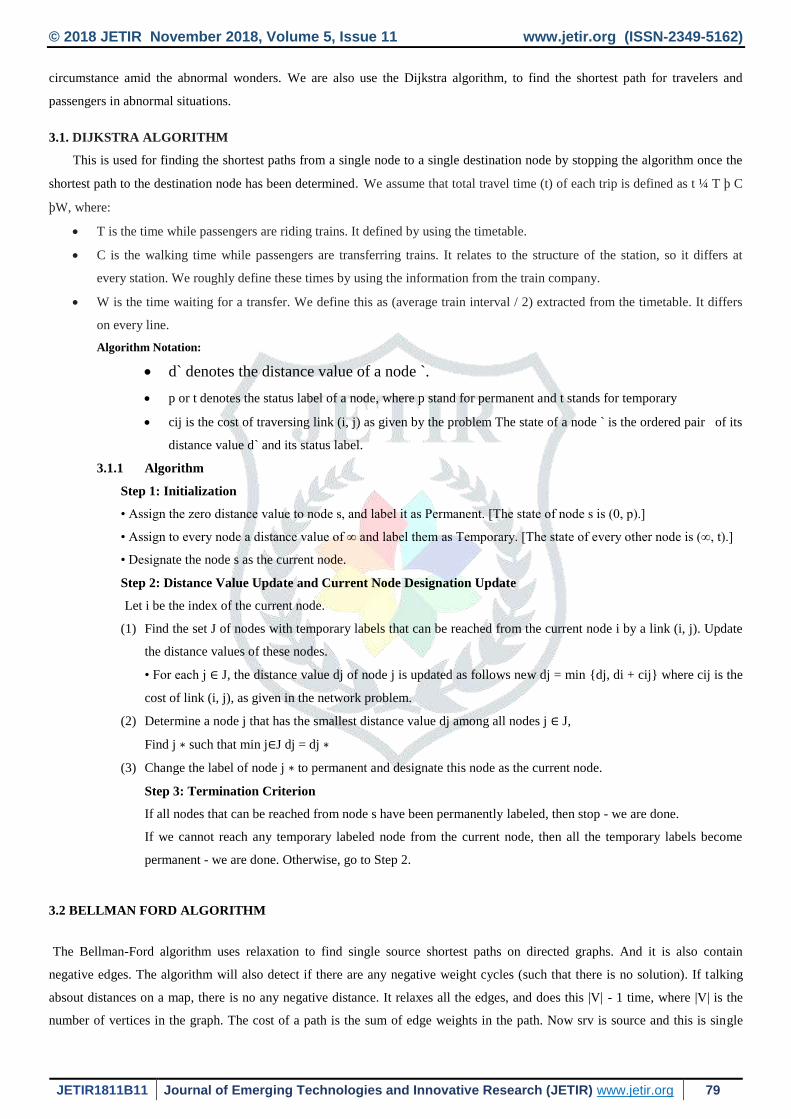
killed the girl before fleeing from the spot since the morning. Fig 4.1(a) shows that the location of Engineering student run over
by the car while heading to tuitions (Oct 25, 2018, 01.22 PM)
Fig 4.1(a) shows that the location of Engineering student run over by car while heading to tuitions (Oct 25, 2018, 01.22
PM)
© 2018 JETIR November 2018, Volume 5, Issue 11 www.jetir.org (ISSN-2349-5162)
JETIR1811B11 Journal of Emerging Technologies and Innovative Research (JETIR) www.jetir.org 81
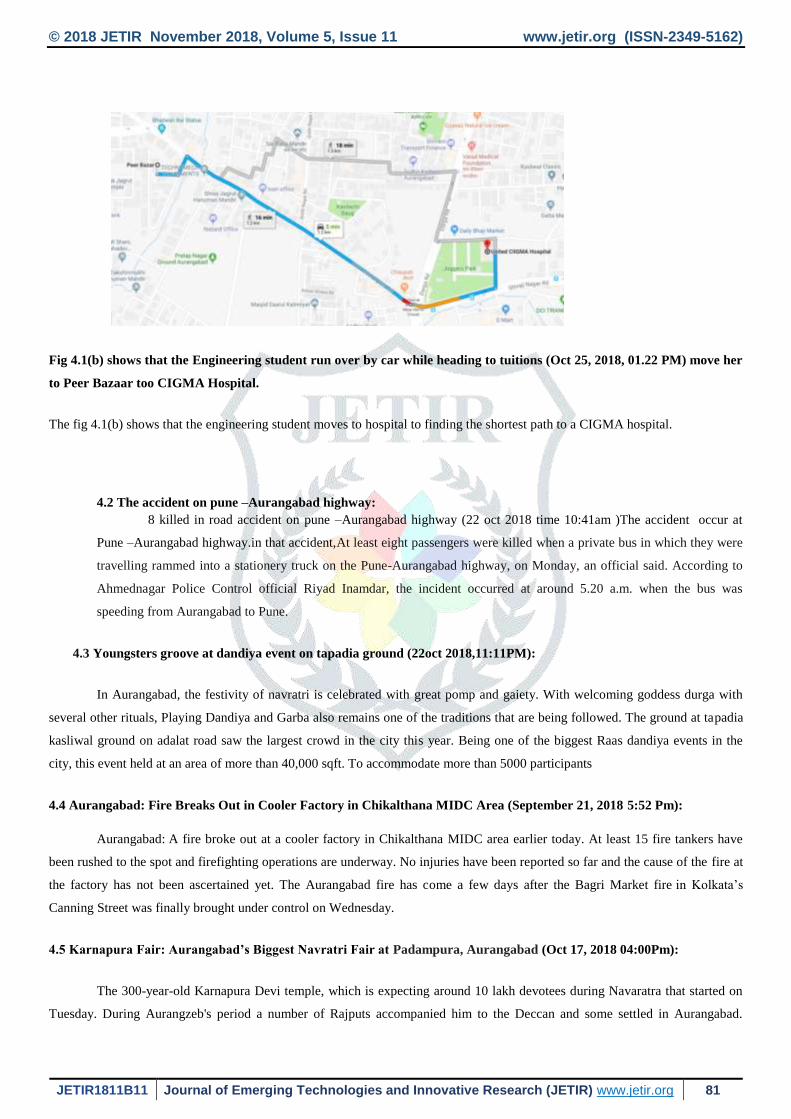
Fig 4.1(b) shows that the Engineering student run over by car while heading to tuitions (Oct 25, 2018, 01.22 PM) move her
to Peer Bazaar too CIGMA Hospital.
The fig 4.1(b) shows that the engineering student moves to hospital to finding the shortest path to a CIGMA hospital.
4.2 The accident on pune –Aurangabad highway:
8 killed in road accident on pune –Aurangabad highway (22 oct 2018 time 10:41am )The accident occur at
Pune –Aurangabad highway.in that accident,At least eight passengers were killed when a private bus in which they were
travelling rammed into a stationery truck on the Pune-Aurangabad highway, on Monday, an official said. According to
Ahmednagar Police Control official Riyad Inamdar, the incident occurred at around 5.20 a.m. when the bus was
speeding from Aurangabad to Pune.
4.3 Youngsters groove at dandiya event on tapadia ground (22oct 2018,11:11PM):
In Aurangabad, the festivity of navratri is celebrated with great pomp and gaiety. With welcoming goddess durga with
several other rituals, Playing Dandiya and Garba also remains one of the traditions that are being followed. The ground at tapadia
kasliwal ground on adalat road saw the largest crowd in the city this year. Being one of the biggest Raas dandiya events in the
city, this event held at an area of more than 40,000 sqft. To accommodate more than 5000 participants
4.4 Aurangabad: Fire Breaks Out in Cooler Factory in Chikalthana MIDC Area (September 21, 2018 5:52 Pm):
Aurangabad: A fire broke out at a cooler factory in Chikalthana MIDC area earlier today. At least 15 fire tankers have
been rushed to the spot and firefighting operations are underway. No injuries have been reported so far and the cause of the fire at
the factory has not been ascertained yet. The Aurangabad fire has come a few days after the Bagri Market fire in Kolkata’s
Canning Street was finally brought under control on Wednesday.
4.5 Karnapura Fair: Aurangabad’s Biggest Navratri Fair at Padampura, Aurangabad (Oct 17, 2018 04:00Pm):
The 300-year-old Karnapura Devi temple, which is expecting around 10 lakh devotees during Navaratra that started on
Tuesday. During Aurangzeb's period a number of Rajputs accompanied him to the Deccan and some settled in Aurangabad.
© 2018 JETIR November 2018, Volume 5, Issue 11 www.jetir.org (ISSN-2349-5162)
JETIR1811B11 Journal of Emerging Technologies and Innovative Research (JETIR) www.jetir.org 82
Maharaj Kama Singh Bikaner settled in the city and established the temple of Karnadevi who is specially worshipped during the
nine days of Navaratra where a fair is held and people from far and wide come to worship Renukadevi.
Out of five Case Studies I have explain the Engineering student run over by car while heading to tuitions with the help of
screenshot.
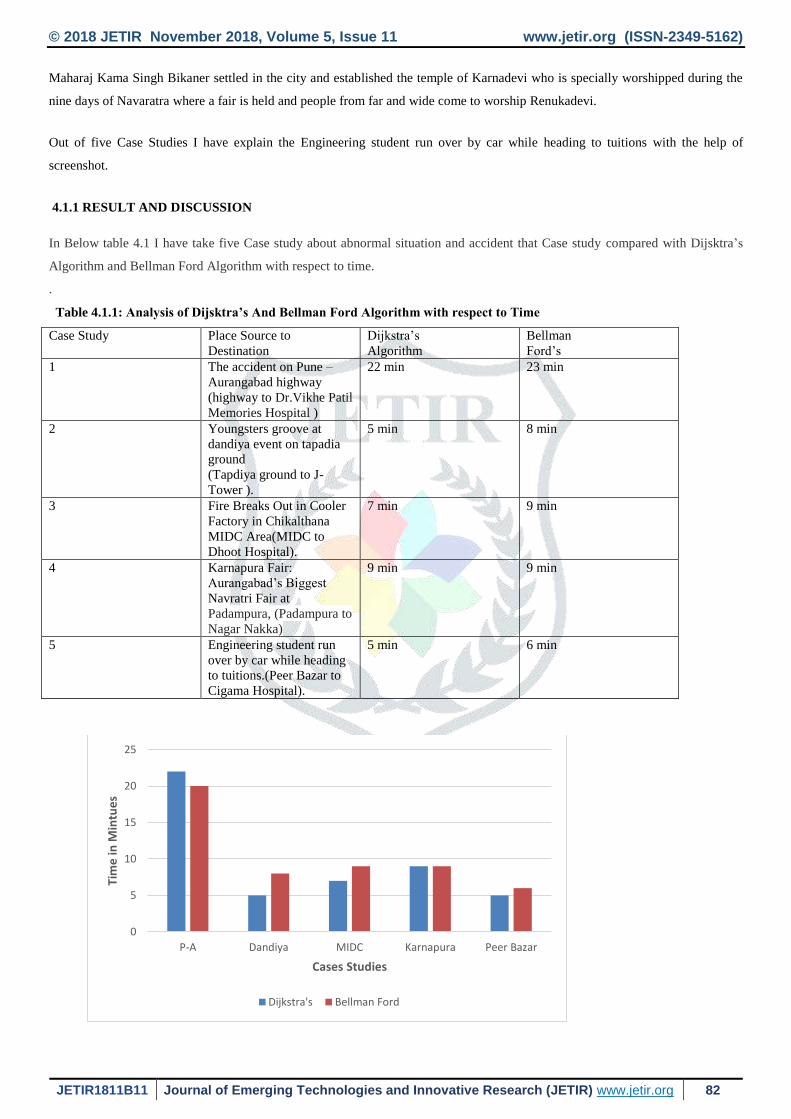
4.1.1 RESULT AND DISCUSSION
In Below table 4.1 I have take five Case study about abnormal situation and accident that Case study compared with Dijsktra’s
Algorithm and Bellman Ford Algorithm with respect to time.
.
Table 4.1.1: Analysis of Dijsktra’s And Bellman Ford Algorithm with respect to Time
Case Study Place Source to
Destination
Dijkstra’s
Algorithm
Bellman
Ford’s
1 The accident on Pune –
Aurangabad highway
(highway to Dr.Vikhe Patil
Memories Hospital )
22 min 23 min
2 Youngsters groove at
dandiya event on tapadia
ground
(Tapdiya ground to J-
Tower ).
5 min 8 min
3 Fire Breaks Out in Cooler
Factory in Chikalthana
MIDC Area(MIDC to
Dhoot Hospital).
7 min 9 min
4 Karnapura Fair:
Aurangabad’s Biggest
Navratri Fair at
Padampura, (Padampura to
Nagar Nakka)
9 min 9 min
5 Engineering student run
over by car while heading
to tuitions.(Peer Bazar to
Cigama Hospital).
5 min 6 min
0
5
10
15
20
25
P-A Dandiya MIDC Karnapura Peer Bazar
Tim
e in
Min
tue
s
Cases Studies
Dijkstra's Bellman Ford
© 2018 JETIR November 2018, Volume 5, Issue 11 www.jetir.org (ISSN-2349-5162)
JETIR1811B11 Journal of Emerging Technologies and Innovative Research (JETIR) www.jetir.org 83
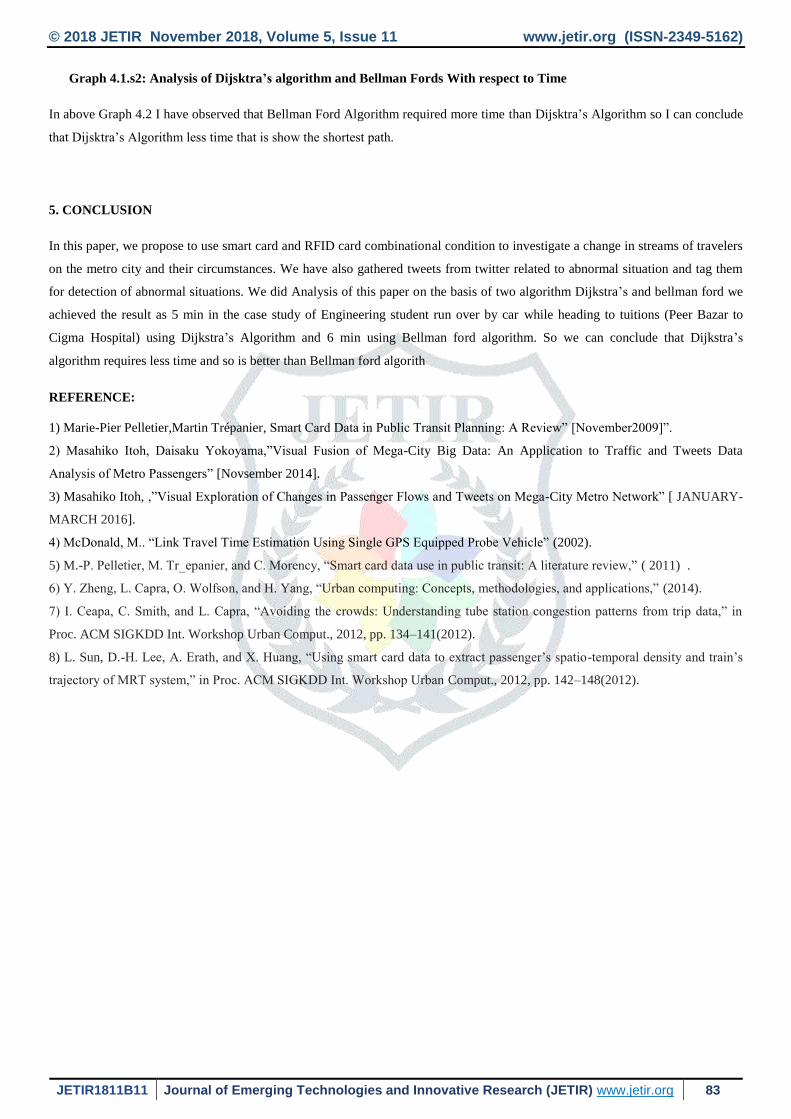
Graph 4.1.s2: Analysis of Dijsktra’s algorithm and Bellman Fords With respect to Time
In above Graph 4.2 I have observed that Bellman Ford Algorithm required more time than Dijsktra’s Algorithm so I can conclude
that Dijsktra’s Algorithm less time that is show the shortest path.
5. CONCLUSION
In this paper, we propose to use smart card and RFID card combinational condition to investigate a change in streams of travelers
on the metro city and their circumstances. We have also gathered tweets from twitter related to abnormal situation and tag them
for detection of abnormal situations. We did Analysis of this paper on the basis of two algorithm Dijkstra’s and bellman ford we
achieved the result as 5 min in the case study of Engineering student run over by car while heading to tuitions (Peer Bazar to
Cigma Hospital) using Dijkstra’s Algorithm and 6 min using Bellman ford algorithm. So we can conclude that Dijkstra’s
algorithm requires less time and so is better than Bellman ford algorith
REFERENCE:
1) Marie-Pier Pelletier,Martin Trépanier, Smart Card Data in Public Transit Planning: A Review” [November2009]”.
2) Masahiko Itoh, Daisaku Yokoyama,”Visual Fusion of Mega-City Big Data: An Application to Traffic and Tweets Data
Analysis of Metro Passengers” [Novsember 2014].
3) Masahiko Itoh, ,”Visual Exploration of Changes in Passenger Flows and Tweets on Mega-City Metro Network” [ JANUARY-
MARCH 2016].
4) McDonald, M.. “Link Travel Time Estimation Using Single GPS Equipped Probe Vehicle” (2002).
5) M.-P. Pelletier, M. Tr_epanier, and C. Morency, “Smart card data use in public transit: A literature review,” ( 2011) .
6) Y. Zheng, L. Capra, O. Wolfson, and H. Yang, “Urban computing: Concepts, methodologies, and applications,” (2014).
7) I. Ceapa, C. Smith, and L. Capra, “Avoiding the crowds: Understanding tube station congestion patterns from trip data,” in
Proc. ACM SIGKDD Int. Workshop Urban Comput., 2012, pp. 134–141(2012).
8) L. Sun, D.-H. Lee, A. Erath, and X. Huang, “Using smart card data to extract passenger’s spatio-temporal density and train’s
trajectory of MRT system,” in Proc. ACM SIGKDD Int. Workshop Urban Comput., 2012, pp. 142–148(2012).