Embed Size (px)
Citation preview
Analysis of Costs and Benefits for the State Route 710 North Study
Alternatives
June 19, 2015

TBG070214143329SCO ES-1
Executive Summary This Cost‐Benefit Analysis (CBA) was prepared for the State Route (SR) 710 North Study, in Los Angeles County, California, in response to a motion approved by the Metro Board of Directors at their June 2010 meeting. The CBA is not required by the California Environmental Quality Act/National Environmental Policy Act (CEQA/NEPA) and is not a technical study included in the comprehensive analysis of the alternatives, which is available in the Draft Environmental Impact Report/Environmental Impact Statement (DEIR/DEIS). The CBA will be considered in conjunction with the information provided in Table 2.15 (Summary of Alternatives and Impacts) during the identification of the Preferred Alternative, as referenced in the SR 710 North Draft EIR/EIS (Chapter 2, Section 2.3, on page 107).
The SR 710 North Study is the culmination of a long history of efforts to address north‐south mobility constraints in east/northeast Los Angeles and the western San Gabriel Valley. The study area is greater than 100 square miles and is generally bounded by Interstate 210 (I‐210) to the north, Interstate 605 (I‐605) to the east, Interstate 10 (I‐10) to the south, and Interstate 5 (I‐5) and State Route 2 (SR 2) to the west. The June 2010 Board motion directed Metro’s Chief Executive Officer to conduct a parallel CBA concurrent with the DEIR/DEIS. The SR 710 North Study DEIR/DEIS (http://www.dot.ca.gov/dist07/resources/envdocs/docs/710study/draft_eir‐eis) that is currently available for public review provides the broadest assessment of potential benefits and potential impacts related to the five SR 710 North Study alternatives (referenced below).
While no formal action is required of the Metro Board of Directors during the review period for the SR 710 North Study DEIR/DEIS, this CBA will be used as input for one of the performance measures that was established during the Alternatives Analysis (AA) phase of the Study. During the AA screening and selection process, more than 40 performance measures related to project objectives were established to evaluate more than 100 multimodal alternatives and to address the Purpose and Need of the Project. The project objectives included, but were not limited to:
Minimizing travel time
Improving connectivity and mobility
Reducing congestion on freeway and local roads
Increasing transit ridership
Minimizing environmental and community impacts related to transportation
Assuring consistency with regional plans and strategies
Maximizing the cost efficiency of public investments
While the CBA is one of many tools used to assess the cost efficiency of public investments, it is viewed as a method that informs. This CBA evaluates the costs and benefits associated with the five SR 710 North Study alternatives. The following five multimodal alternatives were advanced to the SR 710 North Study DEIR/DEIS for further study:
1. The No Build Alternative includes projects/planned improvements through 2035 that are contained in the Federal Transportation Improvement Program, as listed in the Southern California Association of Governments (SCAG) 2012 Regional Transportation Plan (RTP)/Sustainable Communities Strategy Measure R, and the funded portion of Metro’s 2009 Long‐Range Transportation Plan. It does not include any planned improvements to the SR 710 North Corridor.
2. The Transportation System Management/Transportation Demand Management (TSM/TDM) Alternative consists of strategies and improvements to increase efficiency and capacity for all modes in the transportation system with lower capital cost investments and/or lower potential impacts such as substantially increased bus service in the study area, active transportation (pedestrian and bicycle) facilities, intersection spot improvements, local street improvements, and Intelligent Transportation System (ITS) elements.
EXECUTIVE SUMMARY
ES-2 TBG070214143329SCO
3. The Bus Rapid Transit (BRT) Alternative provides high‐speed, high‐frequency bus service through a combination of new, dedicated, and existing bus lanes, and mixed‐flow traffic lanes to key destinations between East Los Angeles and Pasadena. The proposed route length is approximately 12 miles.
4. The Light Rail Transit (LRT) Alternative includes a passenger rail operated along a dedicated guideway, similar to other Metro light rail lines, also with service to key destinations between East Los Angeles and Pasadena. The LRT alignment is approximately 7.5 miles long, with 3 miles of aerial segments and 4.5 miles of bored tunnel segments.
5. The Freeway Tunnel Alternative starts at the existing southern stub of SR 710 in Alhambra, just north of I‐10, and connects to the existing northern stub of SR 710, south of the I‐210/SR 134 interchange in Pasadena. The Freeway Tunnel Alternative has two design variations: a dual‐bore tunnel and a single‐bore tunnel. The Freeway Tunnel Alternative alignment is about 6.3 miles long, with 4.2 miles of bored tunnel and 0.7 miles of cut‐and‐cover tunnel. Tolls were included in some variations of the Freeway Tunnel Alternative. The toll values used in the modeling were determined by finding the toll where the tunnels would attract traffic to approximately 75 percent of the physical capacity and operate at speeds of 45 miles per hour and higher. The tolls used for the traffic analysis would not be the actual tolls during operations; the ultimate tolls would be determined by a future Traffic and Revenue Study.
In general, a CBA is a means of applying an economic (monetary) value to alternative proposals, thereby enabling the costs of an alternative to be compared directly with the benefits the alternative will deliver. However, not all benefits and costs can be monetized reliably or easily. For example, direct and indirect long‐term (or life cycle) benefits associated with underground facilities (transit and highways) may outweigh higher initial capital costs of facilities above ground. While underground construction projects are not without challenges, one major advantage is that such projects reduce adverse impacts to existing surface structures and facilities. The need to remove or displace businesses and residential dwellings are for the most part eliminated. Typical impacts such as division of neighborhoods and communities are avoided; and other adverse impacts associated with surface transportation projects, including the removal of historic properties and districts, the taking of parks or recreational areas and/or the taking of community facilities such as schools and churches, are also avoided. The value of saving homes, businesses, protected properties, and other community resources is not included in the CBA appraisal process, because no definitive data are available to quantify these benefits.
After a review of national and international guidance documents, the California Benefit/Cost (Cal‐B/C) model was selected for use because it is transparent and easy to use; and it is designed to accommodate the type of multimodal appraisal needed for the SR 710 North Study alternatives. The CBA evaluation is done during an established appraisal period for all of the alternatives. The appraisal period for the CBA evaluation refers to the period of time over which benefits and costs associated with an investment are evaluated. This timeframe includes the construction period and the period of operation. The construction period is different for each of the SR 710 North Study Build Alternatives. Most appraisals evaluate benefits over an operational period of 20 to 60 years, based on the life of the asset. The life expectancy varies for the assets for each of the Build Alternatives.
An appraisal period of 20 years following the construction period for each of the SR 710 North Study Build Alternatives was used for this CBA. The residual value was included for assets (tunnels and right‐of‐way) that have a life of more than 20 years.
This CBA evaluation includes the following factors:
Travel time benefits
Capital expenditures (construction and right‐of‐way costs)
Vehicle operating costs
System operations and maintenance costs
Safety effects
Emissions effects
EXECUTIVE SUMMARY
TBG070214143329SCO ES-3
Employment benefits
Residual values
A comprehensive traffic analysis was conducted to provide data on the travel behavior associated with each alternative. Engineers’ estimates of capital and operating costs, an air quality model, a safety model, and a travel demand forecasting model were used to generate the inputs for the estimation of the monetary benefits and costs identified in this CBA.
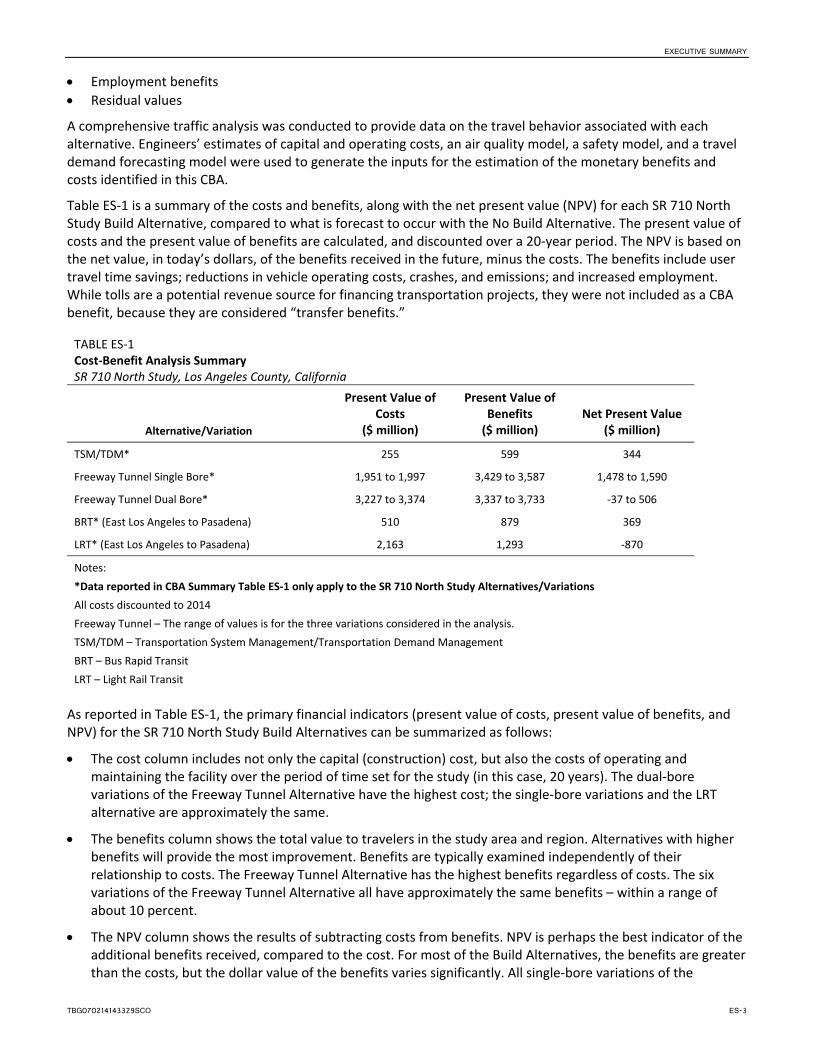
Table ES‐1 is a summary of the costs and benefits, along with the net present value (NPV) for each SR 710 North Study Build Alternative, compared to what is forecast to occur with the No Build Alternative. The present value of costs and the present value of benefits are calculated, and discounted over a 20‐year period. The NPV is based on the net value, in today’s dollars, of the benefits received in the future, minus the costs. The benefits include user travel time savings; reductions in vehicle operating costs, crashes, and emissions; and increased employment. While tolls are a potential revenue source for financing transportation projects, they were not included as a CBA benefit, because they are considered “transfer benefits.”
TABLE ES‐1 Cost‐Benefit Analysis Summary SR 710 North Study, Los Angeles County, California
Alternative/Variation
Present Value of Costs
($ million)
Present Value of Benefits ($ million)
Net Present Value ($ million)
TSM/TDM* 255 599 344
Freeway Tunnel Single Bore* 1,951 to 1,997 3,429 to 3,587 1,478 to 1,590
Freeway Tunnel Dual Bore* 3,227 to 3,374 3,337 to 3,733 ‐37 to 506
BRT* (East Los Angeles to Pasadena) 510 879 369
LRT* (East Los Angeles to Pasadena) 2,163 1,293 ‐870
Notes:
*Data reported in CBA Summary Table ES‐1 only apply to the SR 710 North Study Alternatives/Variations
All costs discounted to 2014
Freeway Tunnel – The range of values is for the three variations considered in the analysis.
TSM/TDM – Transportation System Management/Transportation Demand Management
BRT – Bus Rapid Transit
LRT – Light Rail Transit
As reported in Table ES‐1, the primary financial indicators (present value of costs, present value of benefits, and NPV) for the SR 710 North Study Build Alternatives can be summarized as follows:
The cost column includes not only the capital (construction) cost, but also the costs of operating and maintaining the facility over the period of time set for the study (in this case, 20 years). The dual‐bore variations of the Freeway Tunnel Alternative have the highest cost; the single‐bore variations and the LRT alternative are approximately the same.
The benefits column shows the total value to travelers in the study area and region. Alternatives with higher benefits will provide the most improvement. Benefits are typically examined independently of their relationship to costs. The Freeway Tunnel Alternative has the highest benefits regardless of costs. The six variations of the Freeway Tunnel Alternative all have approximately the same benefits – within a range of about 10 percent.
The NPV column shows the results of subtracting costs from benefits. NPV is perhaps the best indicator of the additional benefits received, compared to the cost. For most of the Build Alternatives, the benefits are greater than the costs, but the dollar value of the benefits varies significantly. All single‐bore variations of the
EXECUTIVE SUMMARY
ES-4 TBG070214143329SCO
Freeway Tunnel Alternative have an NPV of approximately $1.5 billion. Dual‐bore variations have NPVs ranging from $0.04 billion to $0.5 billion. The TSM/TDM and BRT Alternatives have similar NPVs ($0.34 billion and $0.37 billion), and the LRT Alternative has the lowest NPV at ‐$0.9 billion. A negative NPV means that the total benefits are less than the total costs.
This CBA is based on the best available data, but there are some limits to the analysis. For example, travel time reliability has not been captured as a part of the user benefits. Indirect benefits for non‐users (persons not using the transportation system) have not been included. These indirect benefits include reduction in noise, construction impacts, and improvements in the labor market. To assess the impact of any uncertainties in the Cal‐B/C model projections, a sensitivity analysis was conducted (refer to Section 4). The results of the sensitivity analysis do not change the findings summarized and reported in Table ES‐1 for the SR 710 North Study alternatives.
TBG070214143329SCO I
Contents Section Page
Executive Summary ....................................................................................................................................... ES‐1
Acronyms and Abbreviations ............................................................................................................................. iii
1 Project Overview ................................................................................................................................ 1‐1
2 Study Technical Approach ................................................................................................................... 2‐1
2.1 Overview of Cost‐Benefit Analysis .................................................................................................. 2‐1 2.1.1 Purpose of CBA .................................................................................................................. 2‐1 2.1.2 Background ........................................................................................................................ 2‐1 2.1.3 CBA Model Structure ......................................................................................................... 2‐2 2.1.4 Parameters ........................................................................................................................ 2‐3
2.2 Cost Evaluation ............................................................................................................................... 2‐4 2.2.1 Capital Expenditure ........................................................................................................... 2‐4 2.2.2 Operations and Maintenance Costs .................................................................................. 2‐6 2.2.3 Employment Benefits ........................................................................................................ 2‐7 2.2.4 Residual Value ................................................................................................................... 2‐8
2.3 Traffic Analysis ................................................................................................................................ 2‐9 2.3.1 Overview ............................................................................................................................ 2‐9 2.3.2 Methodology ..................................................................................................................... 2‐9 2.3.3 Assumptions ...................................................................................................................... 2‐9 2.3.4 CBA Traffic Analysis ........................................................................................................... 2‐9
2.4 Safety Analysis .............................................................................................................................. 2‐11 2.4.1 Overview .......................................................................................................................... 2‐11 2.4.2 Methodology ................................................................................................................... 2‐12 2.4.3 Assumptions .................................................................................................................... 2‐13 2.4.4 Safety Analysis Outputs ................................................................................................... 2‐13 2.4.5 CBA Analysis Approach .................................................................................................... 2‐15
2.5 Environmental Analysis ................................................................................................................ 2‐15 2.6 Net Present Value Calculations .................................................................................................... 2‐15
3 Results ................................................................................................................................................ 3‐1
3.1 Cost Evaluation ............................................................................................................................... 3‐1 3.2 Benefits Evaluation ......................................................................................................................... 3‐3 3.3 Overall Evaluation ........................................................................................................................... 3‐8 3.4 CBA Analysis Limitations ................................................................................................................. 3‐9
4 Sensitivity Analysis.............................................................................................................................. 4‐1
CONTENTS, CONTINUED
II TBG070214143329SCO
Tables
ES‐1 Cost‐Benefit Analysis Summary ................................................................................................................. ES‐3 2‐1 Alternatives Opening Year and Construction Period ................................................................................... 2‐4 2‐2 Construction, Right‐of‐Way, and TSM/TDM Costs ...................................................................................... 2‐5 2‐3 Operations and Maintenance Costs ............................................................................................................ 2‐6 2‐4 Employment Benefits .................................................................................................................................. 2‐8 2‐5 Residual Value.............................................................................................................................................. 2‐8 2‐6 Value of Time Parameters ......................................................................................................................... 2‐11 2‐7 Predicted Average Annual Crashes by Severity by Facility and Alternative (2035) ................................... 2‐14 2‐8 Unit Costs of Crashes by Severity Level ..................................................................................................... 2‐15 3‐1 Cost‐Benefit Analysis Summary ................................................................................................................... 3‐8 4‐1 NPV Sensitivity Analysis Summary ($ million) ............................................................................................. 4‐2
Exhibits
2‐1 CBA Analysis Overview ................................................................................................................................ 2‐2 2‐2 Detailed CBA Model Structure ..................................................................................................................... 2‐3 2‐3 Capture Area for VMT and VHT Calculations ............................................................................................. 2‐10 3‐1 Capital Expenditure Cost Summary by Alternative ..................................................................................... 3‐1 3‐2 Operations and Maintenance Cost Summary by Alternative ...................................................................... 3‐2 3‐3 Residual Value Summary by Alternative ...................................................................................................... 3‐2 3‐4 User Time Savings Benefits by Alternative .................................................................................................. 3‐3 3‐5 Monetized Time Savings Benefits Summary by Alternative ........................................................................ 3‐4 3‐6 Distribution of Time Savings Benefits ......................................................................................................... 3‐5 3‐7 Time Savings Benefits Details by Alternative ............................................................................................... 3‐5 3‐8 Vehicle Operating Costs/Benefits Summary by Alternative ........................................................................ 3‐6 3‐9 Cost/Benefits Due to Changes in Crashes by Alternative ............................................................................ 3‐6 3‐10 Emissions Costs Benefits Summary by Alternative ...................................................................................... 3‐7 3‐11 Employment Benefits Summary by Alternative .......................................................................................... 3‐7 4‐1 Sensitivity Analysis Summary – Operating Costs ......................................................................................... 4‐3 4‐2 Sensitivity Analysis Summary – Tunnel Life ................................................................................................. 4‐3 4‐3 Sensitivity Analysis Summary – VMT Reduction .......................................................................................... 4‐4 4‐4 Sensitivity Analysis Summary – Air Quality .................................................................................................. 4‐4 4‐5 Sensitivity Analysis Summary – Discount Rate ............................................................................................ 4‐5 4‐6 Sensitivity Analysis Summary – Annualization ............................................................................................ 4‐5 4‐7 Sensitivity Analysis Summary – Value of Time ............................................................................................ 4‐6
TBG070214143329SCO III
Acronyms and Abbreviations AA Alternatives Analysis
AADT average annual daily traffic
AASHTO American Association of State Highway and Transportation Officials
BRT Bus Rapid Transit
Cal‐B/C California Benefit/Cost
Caltrans California Department of Transportation
CBA cost‐benefit analysis
CEQA California Environmental Quality Act
DEIR/DEIS Draft Environmental Impact Report/Environmental Impact Statement
ELA East Los Angeles
FHWA Federal Highway Administration
FY fiscal year
I Interstate
ITS Intelligent Transportation Systems
LRT Light Rail Transit
Metro Los Angeles County Metropolitan Transportation Authority
NEPA National Environmental Policy Act
NPV net present value
O&M operations and maintenance
OD origin‐destination
ROW right‐of‐way
RTP Regional Transportation Plan
SCAG Southern California Association of Governments
SPF Safety Performance Function
SR State Route
STEAM Surface Transportation Efficiency Analysis Model
SWITRS Statewide Integrated Traffic Records System
TDM Transportation Demand Management
TIGER Transportation Investment Generating Economic Recovery
TSM Transportation System Management
TTR Transportation Technical Report
UK United Kingdom
VHT vehicle hours traveled
ACRONYMS AND ABBREVIATIONS
IV TBG070214143329SCO
VMT vehicle mile traveled
VOT value of time
WebTAG web‐based transport appraisal guidance (United Kingdom)
TBG070214143329SCO 1-1
SECTION 1
Project Overview This Cost‐Benefit Analysis (CBA) was prepared for the State Route (SR) 710 North Study, in Los Angeles County, California. The SR 710 North Study is the culmination of a long history of efforts to address north‐south mobility in east/northeast Los Angeles and the western San Gabriel Valley. The California Department of Transportation (Caltrans), in cooperation with the Los Angeles County Metropolitan Transportation Authority (Metro), proposes transportation improvements to improve mobility and relieve congestion in the area between SR 2 and Interstates 5, 10, 210, and 605 (I‐5, I‐10, I‐210, and I‐605, respectively) in east/northeast Los Angeles and the western San Gabriel Valley. The study area for the SR 710 North Study is approximately 100 square miles and generally bounded by I‐210 on the north, I‐605 on the east, I‐10 on the south, and I‐5 and SR 2 on the west. Caltrans is the Lead Agency under the National Environmental Policy Act (NEPA) and the California Environmental Quality Act (CEQA).
The primary purpose of the project is to effectively and efficiently accommodate regional and local north‐south travel demands in the study area, including the following considerations:
Improve efficiency of the existing regional freeway and transit networks.
Reduce congestion on local arterials adversely affected due to accommodating regional traffic volumes.
Minimize environmental impacts related to mobile sources.
A set of alternatives has been evaluated in the Draft Environmental Impact Report/Environmental Impact Statement (DEIR/DEIS). The DEIR/DEIS is available online at http://www.dot.ca.gov/dist07/resources/envdocs/docs/710study/draft_eir‐eis. The CBA in this document focuses on those alternatives. Following is a summary of the SR 710 North Study alternatives:
1. No Build. The No Build Alternative does not include any planned improvements to the SR 710 Corridor. The No Build Alternative includes projects/planned improvements through 2035 that are contained in the Federal Transportation Improvement Program, as listed in the Southern California Association of Governments (SCAG) 2012 Regional Transportation Plan (RTP)/Sustainable Communities Strategy Measure R, and the funded portion of Metro’s 2009 Long‐Range Transportation Plan.
2. Transportation System Management/Transportation Demand Management (TSM/TDM). This alternative consists of strategies and improvements to increase efficiency and capacity for all modes in the transportation system with lower capital cost investments and/or lower potential impacts, such as substantially increased bus service in the study area, active transportation (pedestrian and bicycle) facilities, intersection spot improvements, local street improvements, and Intelligent Transportation Systems (ITS) elements.
3. Bus Rapid Transit (BRT). The BRT Alternative would provide high‐speed, high‐frequency bus service through a combination of new, dedicated, and existing bus lanes, and mixed‐flow traffic lanes to key destinations between East Los Angeles and Pasadena. The proposed route length is approximately 12 miles.
4. Light Rail Transit (LRT). The LRT Alternative would include passenger rail operated along a dedicated guideway, similar to other Metro light rail lines. The LRT alignment is approximately 7.5 miles long, with 3 miles of aerial segments and 4.5 miles of bored tunnel segments.
5. Freeway Tunnel. The alignment for the Freeway Tunnel Alternative starts at the existing southern stub of SR 710 in Alhambra, just north of I‐10, and connects to the existing northern stub of SR 710, south of the I‐210/SR 134 interchange in Pasadena. The Freeway Tunnel Alternative has two design variations: a dual‐bore tunnel and a single‐bore tunnel.
Dual‐Bore Tunnel: The dual‐bore tunnel design variation is approximately 6.3 miles long, with 4.2 miles of bored tunnel, 0.7 miles of cut‐and‐cover tunnel, and 1.4 miles of at‐grade segments. The dual‐bore tunnel variation would consist of two side‐by‐side tunnels (the east tunnel would convey northbound traffic; the west tunnel would convey southbound traffic). Each tunnel would have two levels with traffic traveling
1. PROJECT OVERVIEW
1-2 TBG070214143329SCO
in the same direction. Each tunnel would consist of two lanes of traffic on each level, traveling in one direction, for a total of four lanes in each tunnel. Each bored tunnel would have an outside diameter of approximately 58.5 feet and would be located approximately 120 to 250 feet below the ground surface. Operational variations for the dual‐bore tunnel include the following:
– Dual Bore with Toll: Vehicles using the tunnel will be tolled.
– Dual Bore with No Toll: No toll will be applied to any vehicles using the tunnel facilities.
– Dual Bore with No Toll, with Trucks Excluded: No toll will be applied to vehicles using the tunnel. Trucks would be excluded from using the tunnel.
Single‐Bore Tunnel: The single‐bore tunnel design variation is also approximately 6.3 miles long, with 4.2 miles of bored tunnel, 0.7 miles of cut‐and‐cover tunnel, and 1.4 miles of at‐grade segments. The single‐bore tunnel variation would consist of one tunnel with two levels. Each level would have two lanes of traffic traveling in one direction. Northbound traffic would traverse the upper level; southbound traffic would traverse the lower level. The single‐bore tunnel would provide a total of four lanes. The single‐bore tunnel would also have an outside diameter of approximately 58.5 feet and would be located approximately 120 to 250 feet below the ground surface. Operational variations for the single‐bore tunnel include the following:
– Single Bore with Toll: Vehicles using the tunnel will be tolled.
– Single Bore with Toll, with Trucks Excluded: The facility would be tolled for all automobiles. Trucks would be excluded from using the tunnel.
– Single Bore with Toll with Express Bus: The freeway tunnel would operate as a tolled facility and include an Express Bus component.
Tolls for the Freeway Tunnel Alternatives were developed based on traffic modeling, using the concept of operational capacity. With this approach, the toll values used in the modeling were determined by finding the toll where the tunnels would attract traffic to approximately 75 percent of the physical capacity. At these demand levels, the tunnels would operate at speeds of 45 miles per hour and higher and have buffer capacity for daily variations, but would still serve a relatively high volume of traffic. The tolls used for the traffic analysis would not be the actual tolls during operations. The ultimate tolls would be determined by a future Traffic and Revenue Study, and ultimately the defined toll operating procedures.
The TSM/TDM Alternative improvements would also be constructed as part of the BRT, LRT, and Freeway Tunnel Alternatives. Because of physical conditions, some of the TSM/TDM Alternative improvements would not be constructed with the Build Alternatives.
TBG070214143329SCO 2-1
SECTION 2
Study Technical Approach 2.1 Overview of Cost-Benefit Analysis 2.1.1 Purpose of CBA A CBA is a means of applying an economic (monetary) value to alternative proposals for delivering a project, enabling the costs of an alternative to be compared directly with the benefits the alternative will deliver.
The CBA is used as a means of demonstrating the value of a project. CBA is an approach used widely by governments and funding agencies across the world to assess the monetary value of improvements, select the preferred option and refine the design, aid comparisons across different modes of transportation improvements and policy mixes, and provide indicators of social value for money.
It is widely agreed that not all benefits and costs can be monetized reliably or easily, so the results of the CBA should be viewed for what they are—careful estimates of the monetary value of the principal components of value associated with regional or large‐scale corridor travel. CBA is widely viewed as a method that informs.
The DEIR/DEIS will provide information for decision makers as it assesses potential alternatives. The CBA will be considered in conjunction with the information provided in Table 2.15 (Summary of Alternatives and Impacts) during the identification of the Preferred Alternative, as referenced in the DEIR/DEIS (Chapter 2, Section 2.3, on page 107). Both the CBA and DEIR/DEIS provide useful information for comparing alternatives:
The DEIR/DEIS provides the broadest assessment of benefits and impacts of each alternative.
The CBA provides different performance measures for comparing the costs of an alternative directly with the benefits the alternative will deliver. The CBA also may be used to highlight the various components of the value of the project alternatives.
Assessment of the alternatives will be based on a set of performance measures. The assessment will occur after comments are received on the DEIR/DEIS. During the Alternatives Analysis (AA) phase, over 40 performance measures related to project objectives were developed.
The project objectives included, but were not limited to:
Minimizing travel time
Improving connectivity and mobility
Reducing congestion on freeway and local roads
Increasing transit ridership
Minimizing environmental and community impacts related to transportation
Assuring consistency with regional plans and strategies
Maximizing the cost efficiency of public investments
The performance measures associated with these objectives will be refined and revised to reflect the level of analysis performed for the DEIR/DEIS. One of the measures used in the AA phase evaluation was financial feasibility. The results of the CBA will be used as an input for this measure. The CBA will not be used by itself for making decisions.
2.1.2 Background From the set of available guidance, four tools were selected for review. These included:
The California Benefit/Cost (Cal‐B/C) model, which was developed for Caltrans as a tool for CBA of highway and transit projects. Cal‐B/C is an Excel (spreadsheet) application structured to analyze several types of transportation improvement projects in a corridor where there is an existing highway facility or a transit service (the base case).

2. STUDY TECHNICAL APPROACH
2-2 TBG070214143329SCO
Surface Transportation Efficiency Analysis Model (STEAM), which was developed for the Federal Highway Administration (FHWA) as a framework for state and regional agencies to assess investments in multimodal urban transportation infrastructure, as well as policy alternatives such as pricing and demand management measures; STEAM can be used to analyze investments at the regional and corridor levels.
The American Association of State Highway and Transportation Officials (AASHTO) manual, which includes guidance to assess the user and nonuser benefits for highways.
Web‐Based Transport Appraisal Guidance (WebTag), which is the guidance used in the United Kingdom (UK).
Following a detailed review of all the different appraisal tools, Cal‐B/C was selected as an appropriate tool. Cal‐B/C was chosen because it satisfies all the requirements for the SR 710 North Study, and is designed to accommodate a multimodal appraisal. For the SR 710 North Study, there is a range of alternatives covering different modes including highway, bus, and light rail. To be consistent, it is essential to use the same tool for appraising the different modes. Furthermore, Cal‐B/C has been specially tailored to the state of California and is consistent with AASHTO guidance. Finally, the model is very transparent, accessible (Microsoft Excel), and easy to use.
2.1.3 CBA Model Structure Exhibit 2‐1 is an overview of the relationship between the CBA and other models and analysis undertaken for the SR 710 North Study. An extensive modeling effort was conducted that included both highway (cars and trucks) and transit evaluations. That analysis is documented in the Transportation Technical Report (TTR)1 for the SR 710 North Study. The data from the modeling and traffic analysis were key inputs to the CBA, but additional safety and environmental analyses also were conducted.
EXHIBIT 2‐1 CBA Analysis Overview SR 710 North Study, Los Angeles County, California
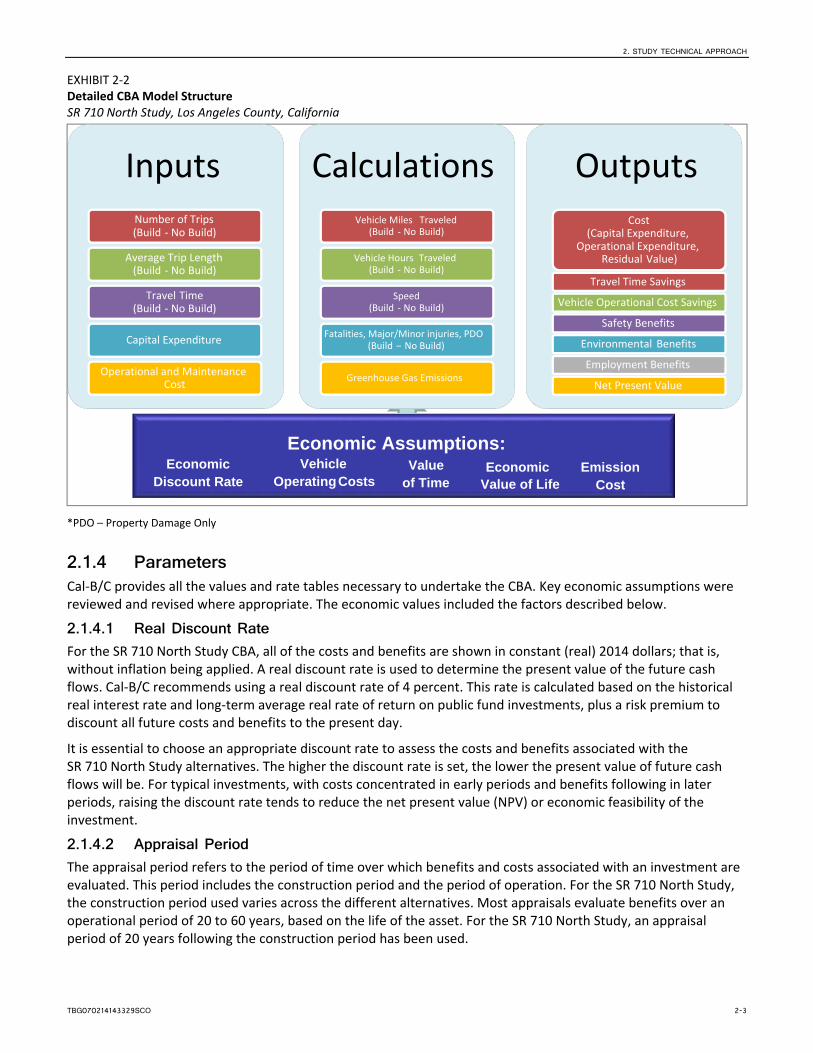
Exhibit 2‐2 is a diagram of the overall structure of the Cal‐B/C model categorized into inputs, calculations, and outputs. The basic approach is to compare each Build Alternative to the No Build Alternative using a variety of measures. The analysis output is the incremental costs and benefits for each Build Alternative, compared to the No Build Alternative.
1 CH2M HILL. 2014. Draft Transportation Technical Report, SR 710 North Study, Los Angeles County, California. June.
Transportation Modeling
Safety Analysis
Cost‐Benefit Analysis
Environmental Analysis
Highway
Transit
2. STUDY TECHNICAL APPROACH
TBG070214143329SCO 2-3
EXHIBIT 2‐2 Detailed CBA Model Structure SR 710 North Study, Los Angeles County, California
*PDO – Property Damage Only
2.1.4 Parameters Cal‐B/C provides all the values and rate tables necessary to undertake the CBA. Key economic assumptions were reviewed and revised where appropriate. The economic values included the factors described below.
2.1.4.1 Real Discount Rate For the SR 710 North Study CBA, all of the costs and benefits are shown in constant (real) 2014 dollars; that is, without inflation being applied. A real discount rate is used to determine the present value of the future cash flows. Cal‐B/C recommends using a real discount rate of 4 percent. This rate is calculated based on the historical real interest rate and long‐term average real rate of return on public fund investments, plus a risk premium to discount all future costs and benefits to the present day.
It is essential to choose an appropriate discount rate to assess the costs and benefits associated with the SR 710 North Study alternatives. The higher the discount rate is set, the lower the present value of future cash flows will be. For typical investments, with costs concentrated in early periods and benefits following in later periods, raising the discount rate tends to reduce the net present value (NPV) or economic feasibility of the investment.
2.1.4.2 Appraisal Period The appraisal period refers to the period of time over which benefits and costs associated with an investment are evaluated. This period includes the construction period and the period of operation. For the SR 710 North Study, the construction period used varies across the different alternatives. Most appraisals evaluate benefits over an operational period of 20 to 60 years, based on the life of the asset. For the SR 710 North Study, an appraisal period of 20 years following the construction period has been used.
InputsNumber of Trips (Build ‐ No Build)
Average Trip Length (Build ‐ No Build)
Travel Time (Build ‐ No Build)
Capital Expenditure
Operational and Maintenance Cost
CalculationsVehicle Miles Traveled
(Build ‐ No Build)
Vehicle Hours Traveled (Build ‐ No Build)
Speed (Build ‐ No Build)
Fatalities, Major/Minor injuries, PDO(Build – No Build)
Greenhouse Gas Emissions
Outputs
Cost(Capital Expenditure,
Operational Expenditure, Residual Value)
Travel Time Savings
Vehicle Operational Cost Savings
Safety Benefits
Environmental Benefits
Employment Benefits
Net Present Value
Economic Assumptions:Economic
Discount RateValue
of Time
VehicleOperatingCosts
Emission Cost
EconomicValue of Life
2. STUDY TECHNICAL APPROACH
2-4 TBG070214143329SCO
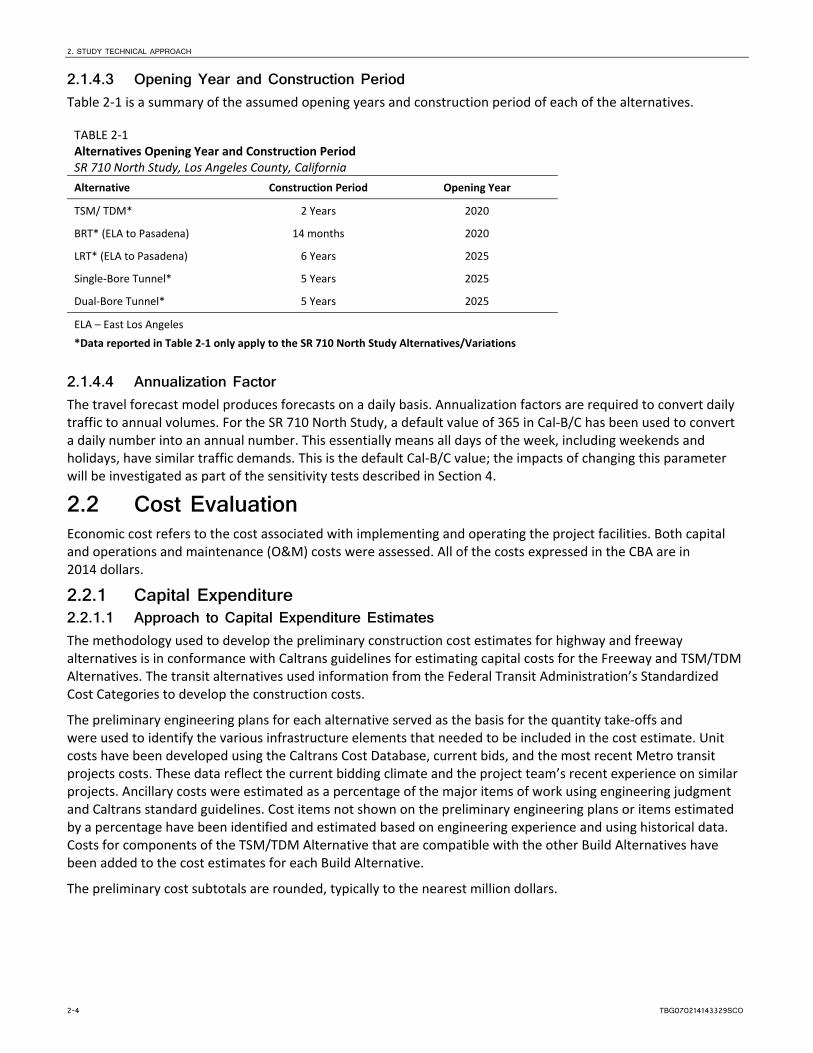
2.1.4.3 Opening Year and Construction Period Table 2‐1 is a summary of the assumed opening years and construction period of each of the alternatives.
TABLE 2‐1 Alternatives Opening Year and Construction Period SR 710 North Study, Los Angeles County, California
Alternative Construction Period Opening Year
TSM/ TDM* 2 Years 2020
BRT* (ELA to Pasadena) 14 months 2020
LRT* (ELA to Pasadena) 6 Years 2025
Single‐Bore Tunnel* 5 Years 2025
Dual‐Bore Tunnel* 5 Years 2025
ELA – East Los Angeles
*Data reported in Table 2‐1 only apply to the SR 710 North Study Alternatives/Variations
2.1.4.4 Annualization Factor The travel forecast model produces forecasts on a daily basis. Annualization factors are required to convert daily traffic to annual volumes. For the SR 710 North Study, a default value of 365 in Cal‐B/C has been used to convert a daily number into an annual number. This essentially means all days of the week, including weekends and holidays, have similar traffic demands. This is the default Cal‐B/C value; the impacts of changing this parameter will be investigated as part of the sensitivity tests described in Section 4.
2.2 Cost Evaluation Economic cost refers to the cost associated with implementing and operating the project facilities. Both capital and operations and maintenance (O&M) costs were assessed. All of the costs expressed in the CBA are in 2014 dollars.
2.2.1 Capital Expenditure 2.2.1.1 Approach to Capital Expenditure Estimates The methodology used to develop the preliminary construction cost estimates for highway and freeway alternatives is in conformance with Caltrans guidelines for estimating capital costs for the Freeway and TSM/TDM Alternatives. The transit alternatives used information from the Federal Transit Administration’s Standardized Cost Categories to develop the construction costs.
The preliminary engineering plans for each alternative served as the basis for the quantity take‐offs and were used to identify the various infrastructure elements that needed to be included in the cost estimate. Unit costs have been developed using the Caltrans Cost Database, current bids, and the most recent Metro transit projects costs. These data reflect the current bidding climate and the project team’s recent experience on similar projects. Ancillary costs were estimated as a percentage of the major items of work using engineering judgment and Caltrans standard guidelines. Cost items not shown on the preliminary engineering plans or items estimated by a percentage have been identified and estimated based on engineering experience and using historical data. Costs for components of the TSM/TDM Alternative that are compatible with the other Build Alternatives have been added to the cost estimates for each Build Alternative.
The preliminary cost subtotals are rounded, typically to the nearest million dollars.
2. STUDY TECHNICAL APPROACH
TBG070214143329SCO 2-5
2.2.1.2 Capital Expenditure Cost Estimating Assumptions The basic assumptions and criteria used to develop the cost data, consistent with the SR 710 North Study Draft Project Report, are as follows:
Estimates have been prepared using 2014 dollars.
To account for additions, 5 percent of the roadway cost has been added. Ten percent has been added for minor items, except for structures, where 5 percent was used. A contingency of 25 percent has been added to right‐of‐way (ROW) costs and other potential costs not already identified. A higher contingency (34 percent) was applied to the tunnel elements of the Freeway Tunnel and LRT Alternatives.
All utility relocation and protection costs are assumed to be paid by Metro (and thus are included in the estimate) since prior rights have not been determined at this point in the study. This is a conservative approach.
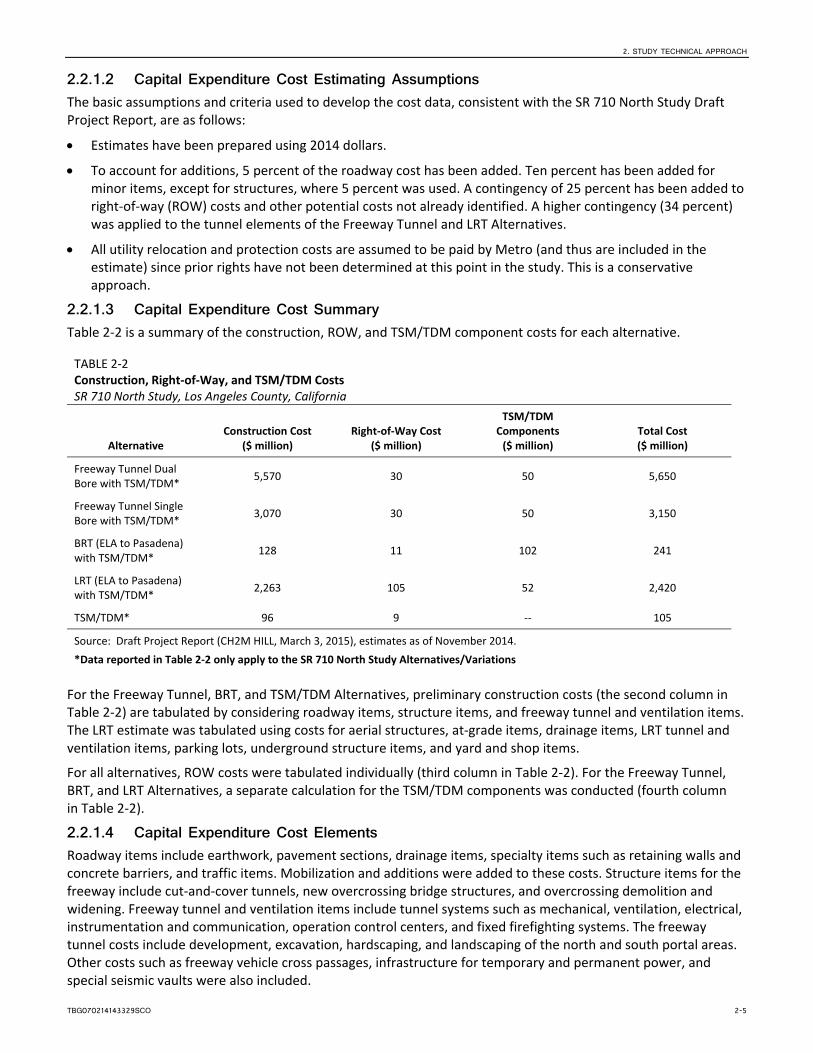
2.2.1.3 Capital Expenditure Cost Summary Table 2‐2 is a summary of the construction, ROW, and TSM/TDM component costs for each alternative.
TABLE 2‐2 Construction, Right‐of‐Way, and TSM/TDM Costs SR 710 North Study, Los Angeles County, California
Alternative Construction Cost
($ million) Right‐of‐Way Cost
($ million)
TSM/TDM Components ($ million)
Total Cost ($ million)
Freeway Tunnel Dual Bore with TSM/TDM*
5,570 30 50 5,650
Freeway Tunnel Single Bore with TSM/TDM*
3,070 30 50 3,150
BRT (ELA to Pasadena) with TSM/TDM*
128 11 102 241
LRT (ELA to Pasadena) with TSM/TDM*
2,263 105 52 2,420
TSM/TDM* 96 9 ‐‐ 105
Source: Draft Project Report (CH2M HILL, March 3, 2015), estimates as of November 2014.
*Data reported in Table 2‐2 only apply to the SR 710 North Study Alternatives/Variations
For the Freeway Tunnel, BRT, and TSM/TDM Alternatives, preliminary construction costs (the second column in Table 2‐2) are tabulated by considering roadway items, structure items, and freeway tunnel and ventilation items. The LRT estimate was tabulated using costs for aerial structures, at‐grade items, drainage items, LRT tunnel and ventilation items, parking lots, underground structure items, and yard and shop items.
For all alternatives, ROW costs were tabulated individually (third column in Table 2‐2). For the Freeway Tunnel, BRT, and LRT Alternatives, a separate calculation for the TSM/TDM components was conducted (fourth column in Table 2‐2).
2.2.1.4 Capital Expenditure Cost Elements Roadway items include earthwork, pavement sections, drainage items, specialty items such as retaining walls and concrete barriers, and traffic items. Mobilization and additions were added to these costs. Structure items for the freeway include cut‐and‐cover tunnels, new overcrossing bridge structures, and overcrossing demolition and widening. Freeway tunnel and ventilation items include tunnel systems such as mechanical, ventilation, electrical, instrumentation and communication, operation control centers, and fixed firefighting systems. The freeway tunnel costs include development, excavation, hardscaping, and landscaping of the north and south portal areas. Other costs such as freeway vehicle cross passages, infrastructure for temporary and permanent power, and special seismic vaults were also included.
2. STUDY TECHNICAL APPROACH
2-6 TBG070214143329SCO
ROW costs include potential residential and commercial acquisitions, temporary and permanent easements, relocation assistance, clearance and demolition of commercial properties, and fees associated with title, escrow, and appraisals. Utility relocation and protection costs are also included in this section.
2.2.2 Operations and Maintenance Costs 2.2.2.1 Approach to O&M Estimates Operational costs include all of the day‐to‐day running costs of the facilities. Maintenance costs include maintaining the facilities and assets. These costs are expressed on an annual basis. Equipment renewal and pavement rehabilitation costs were added as part of the subsequent costs, which occur once the facilities are in place.
Freeway O&M costs related to the tunnel include the energy costs associated with running equipment based on electricity supply requirements, maintenance associated with each installed system, and the staffing to accommodate tunnel operations. Freeway maintenance costs not related to the tunnels include costs for pavement, toll systems, bridges, and a tunnel express bus service.
2.2.2.2 O&M Cost Estimating Assumptions The basis for costing freeway O&M includes a breakdown of the estimate for mechanical and electrical systems. From this breakdown, O&M and renewal costs are estimated for each system. Rates and factors used to estimate the average annual cost are derived from a number of references including data from operational tunnels, supplier estimates, and information used from previous studies for other freeway tunnels. Freeway maintenance costs for items outside the tunnel were provided by Caltrans at an assumed value of $10,000 per lane mile with trucks allowed on the freeway and a reduced $3,500 per lane mile for the no trucks alternative. Reconstruction of pavement was assumed to cost $1,250,000 per lane mile and to take place every 20 years with trucks present and every 30 years for the freeway alternative without trucks. O&M costs for tunnel damage caused during a car or truck collision were reduced for non‐truck scenarios. Costs for bridge maintenance were assumed to be 2 percent of the bridge construction cost.
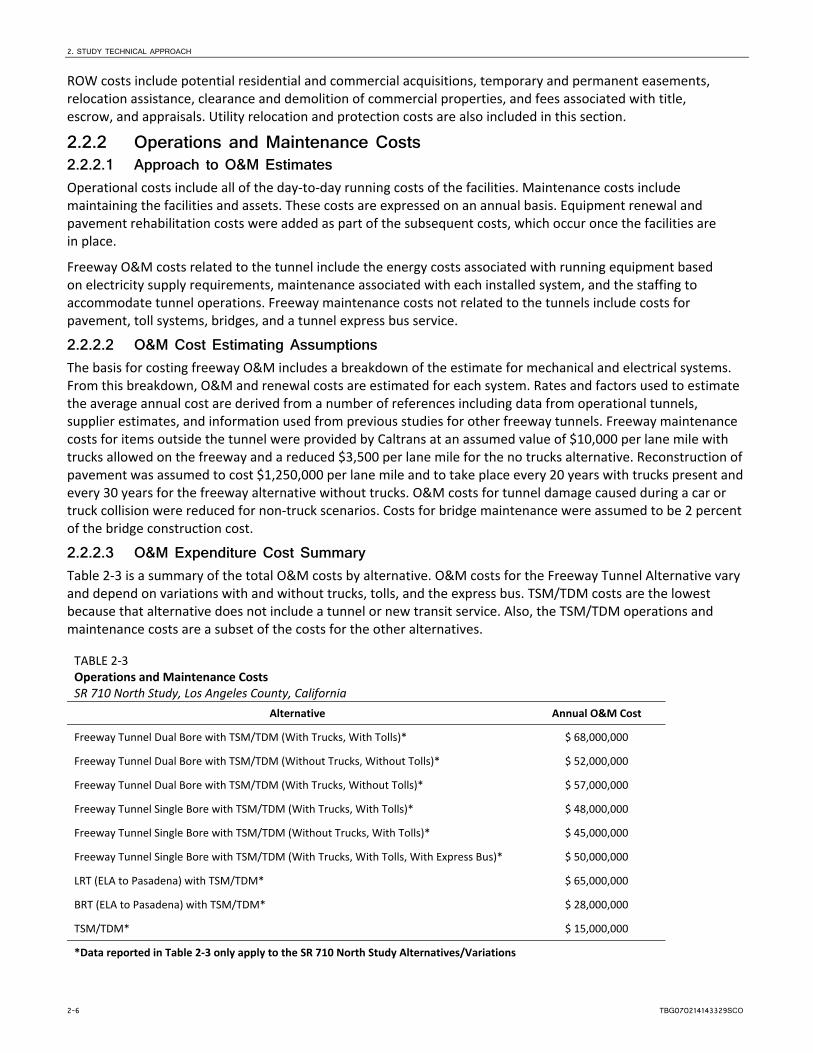
2.2.2.3 O&M Expenditure Cost Summary Table 2‐3 is a summary of the total O&M costs by alternative. O&M costs for the Freeway Tunnel Alternative vary and depend on variations with and without trucks, tolls, and the express bus. TSM/TDM costs are the lowest because that alternative does not include a tunnel or new transit service. Also, the TSM/TDM operations and maintenance costs are a subset of the costs for the other alternatives.
TABLE 2‐3 Operations and Maintenance Costs SR 710 North Study, Los Angeles County, California
Alternative Annual O&M Cost
Freeway Tunnel Dual Bore with TSM/TDM (With Trucks, With Tolls)* $ 68,000,000
Freeway Tunnel Dual Bore with TSM/TDM (Without Trucks, Without Tolls)* $ 52,000,000
Freeway Tunnel Dual Bore with TSM/TDM (With Trucks, Without Tolls)* $ 57,000,000
Freeway Tunnel Single Bore with TSM/TDM (With Trucks, With Tolls)* $ 48,000,000
Freeway Tunnel Single Bore with TSM/TDM (Without Trucks, With Tolls)* $ 45,000,000
Freeway Tunnel Single Bore with TSM/TDM (With Trucks, With Tolls, With Express Bus)* $ 50,000,000
LRT (ELA to Pasadena) with TSM/TDM* $ 65,000,000
BRT (ELA to Pasadena) with TSM/TDM* $ 28,000,000
TSM/TDM* $ 15,000,000
*Data reported in Table 2‐3 only apply to the SR 710 North Study Alternatives/Variations

2. STUDY TECHNICAL APPROACH
TBG070214143329SCO 2-7
2.2.2.4 O&M Expenditure Cost Elements Freeway O&M costs include ongoing maintenance and renewal costs. The freeway tunnel systems include mechanical, electrical, fire safety, and communication systems. Each system contains components subject to different levels of use and located in different environments.
The renewal cost of each system is broken down into component elements based on their expected service life duration. For the purpose of this assessment, the cost of renewing a system is considered to be a proportion of the initial cost. This is generally assumed to be 75 percent, but the percentage may be higher or lower depending on the system and how it might be replaced in an operational tunnel environment.
A major consideration in the renewal of systems is the disruption to the operation of the tunnel during the replacement of the equipment. Generally, the equipment located in the tunnel bores will require a tunnel closure; the cost of implementing the closure, as well as the impact of delay to users, should be taken into account. However, the proposed freeway tunnel includes continuous walkways and access below the road deck so many of the systems outside the tunnels can be replaced without tunnel closures and during normal working hours. This will reduce the cost of replacement, and supports the assumption to use costs less than the initial cost as a basis for future renewals.
LRT O&M costs are calculated based on the fiscal year (FY) 2012 cost per revenue service hour presented in Metro’s FY 2013 proposed budget. The unit cost of $374.48 is applied for each hour each light rail vehicle would be operated in revenue service during a 1‐year period, and includes transportation costs, maintenance costs, other operating costs, and support department costs. The SR 710 North Study LRT Preliminary Operation Plan Technical Memorandum (CH2M HILL, April 2, 2014) and the SR 710 North Study LRT Feeder Bus Preliminary Operating Plan Technical Memorandum (CH2M HILL, February 10, 2014) provide more detail on operating costs for LRT.
BRT operating costs are calculated based on the revenue vehicle hours of service for the 12‐mile route and applying a fully allocated cost rate of $134.70 per revenue service hour from Metro’s FY 2013 budget. BRT‐related TSM operating costs were developed focusing on the directly comparable number of revenue vehicle service hours included in the demand forecast model. The SR 710 North Study ‐ BRT Operating Plan (CH2M HILL, March 31, 2014) provides more detail on BRT and related TSM operating costs.
TSM/TDM Alternative O&M costs that were compatible with the other Build Alternatives were added to the other Build Alternatives. TSM/TDM Alternative costs were determined for each intersection, local street, and hook ramp location based on a value of $20,000 per intersection and per ITS location, and $33,000 per lane mile.
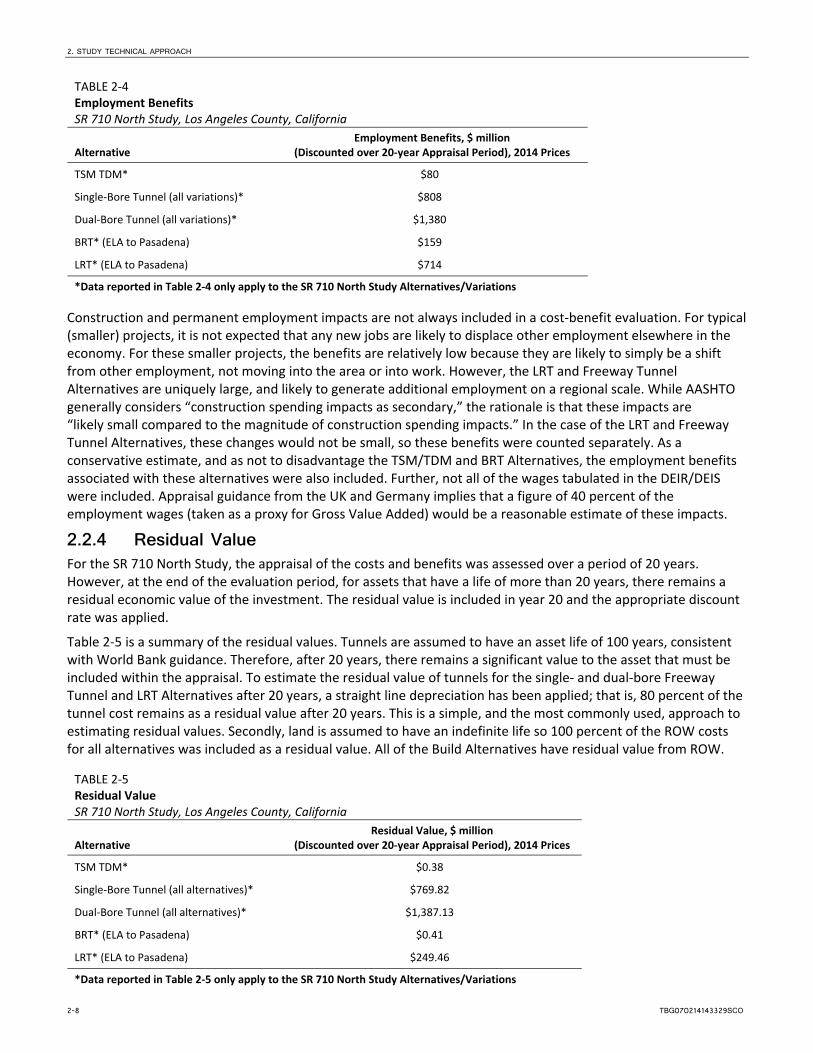
2.2.3 Employment Benefits All of the alternatives will result in new employment associated with construction and related activities in the vicinity of the study area. Table 2‐4 is a summary of the employment benefits by alternative, converted to 2014 dollars. Table ES‐1 in the DEIR/DEIS includes a calculation of expected employment earnings associated with construction. Earnings were estimated based on the creation of 1,400 to 41,100 person‐year jobs, which would occur over the construction period (14 months to 6 years, depending on the alternative). These benefits are associated with the wages paid to workers, and do not count secondary benefits (for example, workers eating lunch at nearby restaurants). Permanent employment benefits (300 to 1,300 jobs per year, depending on the alternative) were also included.
2. STUDY TECHNICAL APPROACH
2-8 TBG070214143329SCO
TABLE 2‐4 Employment Benefits SR 710 North Study, Los Angeles County, California
Alternative Employment Benefits, $ million
(Discounted over 20‐year Appraisal Period), 2014 Prices
TSM TDM* $80
Single‐Bore Tunnel (all variations)* $808
Dual‐Bore Tunnel (all variations)* $1,380
BRT* (ELA to Pasadena) $159
LRT* (ELA to Pasadena) $714
*Data reported in Table 2‐4 only apply to the SR 710 North Study Alternatives/Variations
Construction and permanent employment impacts are not always included in a cost‐benefit evaluation. For typical (smaller) projects, it is not expected that any new jobs are likely to displace other employment elsewhere in the economy. For these smaller projects, the benefits are relatively low because they are likely to simply be a shift from other employment, not moving into the area or into work. However, the LRT and Freeway Tunnel Alternatives are uniquely large, and likely to generate additional employment on a regional scale. While AASHTO generally considers “construction spending impacts as secondary,” the rationale is that these impacts are “likely small compared to the magnitude of construction spending impacts.” In the case of the LRT and Freeway Tunnel Alternatives, these changes would not be small, so these benefits were counted separately. As a conservative estimate, and as not to disadvantage the TSM/TDM and BRT Alternatives, the employment benefits associated with these alternatives were also included. Further, not all of the wages tabulated in the DEIR/DEIS were included. Appraisal guidance from the UK and Germany implies that a figure of 40 percent of the employment wages (taken as a proxy for Gross Value Added) would be a reasonable estimate of these impacts.
2.2.4 Residual Value For the SR 710 North Study, the appraisal of the costs and benefits was assessed over a period of 20 years. However, at the end of the evaluation period, for assets that have a life of more than 20 years, there remains a residual economic value of the investment. The residual value is included in year 20 and the appropriate discount rate was applied.
Table 2‐5 is a summary of the residual values. Tunnels are assumed to have an asset life of 100 years, consistent with World Bank guidance. Therefore, after 20 years, there remains a significant value to the asset that must be included within the appraisal. To estimate the residual value of tunnels for the single‐ and dual‐bore Freeway Tunnel and LRT Alternatives after 20 years, a straight line depreciation has been applied; that is, 80 percent of the tunnel cost remains as a residual value after 20 years. This is a simple, and the most commonly used, approach to estimating residual values. Secondly, land is assumed to have an indefinite life so 100 percent of the ROW costs for all alternatives was included as a residual value. All of the Build Alternatives have residual value from ROW.
TABLE 2‐5 Residual Value SR 710 North Study, Los Angeles County, California
Alternative Residual Value, $ million
(Discounted over 20‐year Appraisal Period), 2014 Prices
TSM TDM* $0.38
Single‐Bore Tunnel (all alternatives)* $769.82
Dual‐Bore Tunnel (all alternatives)* $1,387.13
BRT* (ELA to Pasadena) $0.41
LRT* (ELA to Pasadena) $249.46
*Data reported in Table 2‐5 only apply to the SR 710 North Study Alternatives/Variations
2. STUDY TECHNICAL APPROACH
TBG070214143329SCO 2-9
2.3 Traffic Analysis The traffic analysis was based on travel forecast modeling, conducted for existing and future conditions. Forecasts were developed for the opening year (2020 or 2025 depending on the alternative) and a horizon year of 2035. The travel forecast model area included the entire SCAG region, but performance was evaluated for the SCAG region including Los Angeles County and the SR 710 North Study area depending on the performance measure. Details of the forecast modeling can be found in the TTR (CH2M HILL, 2014).
2.3.1 Overview A customized travel forecast model, described as “the SR 710 Model” was developed. The SR 710 Model is based on the SCAG 2012 RTP Version 6.1 model (or the “Version 6.1 model”). The Version 6.1 model includes multiple updates to the SCAG 2012 RTP model, which was used by SCAG for analysis in the 2012 RTP. Updates to the Version 6.1 model include highway and transit network descriptions, updated traffic analysis zone definitions, and incorporation of updated and improved modeling of mode choice. The most significant update included in the Version 6.1 model was a new time‐of‐day model sensitive to traveler characteristics and congestion. Additional details on the overview and history of the SCAG model, including adaptions and enhancements that were made to develop the SR 710 North model, are included in detail in the TTR (CH2M HILL, 2014).
2.3.2 Methodology The SR 710 Model has been adjusted to improve the calibration of the transportation network outputs to observed travel data in the study area. These improvements include model network definition, model parameter and coefficient changes, and model process (scripting) changes. Some of the process changes were implemented to correct issues with the model as provided by SCAG. These issues have been shared with SCAG for their model improvement.
The outputs from the travel forecast model are used to directly, and indirectly, inform the CBA analysis. Several outputs are used directly in the CBA analysis. Another set of outputs was used for safety analysis, of which, the output was used for CBA analysis (an indirect use of travel model performance measures).
2.3.3 Assumptions The SR 710 North travel demand model outputs were used as inputs to the CBA analysis. The vehicle miles traveled (VMT) and vehicle hours traveled (VHT) are the main inputs to the CBA process. Due to the regional nature of the SR 710 North project, VMT and VHT over multiple geographies, including the SCAG region and the study area, were evaluated as input to the CBA process. Using an analysis area that is too large accumulates trips that are not affected by the SR 710 North alternatives, and therefore dilutes the changes in VMT and VHT in the transportation system between the alternatives. Therefore, it was assumed that the “capture area” (described in Section 2.3.4.1) VMT and VHT would be used as inputs to the CBA analysis. The “capture area” enables us to see differences in VMT and VHT without being overwhelmed by the entire region. The use of “capture area” VMT and VHT best serves the needs of the CBA because it captures the changes in trip distribution and time of day that occur due to the SR 710 North Study alternatives.
2.3.4 CBA Traffic Analysis 2.3.4.1 Performance Measures Performance measures allow for the impacts of transportation alternatives to be quantified. The performance measures used in this analysis are designed to focus on the transportation system (vehicular and transit) performance for the region and the study area. A thorough discussion about the various performance measures is described in the TTR.
Two of the performance measures developed to evaluate SR 710 North model outputs were used as direct inputs to the CBA analysis: VMT and VHT. Utilizing the study area did not capture changes in the surrounding area as the facility and additional capacity alters the travel patterns of travelers in a large area. To account for this issue, a “capture area” was developed using origin‐destination (OD) pairs to develop consistent VMT and VHT estimates across the alternatives.
2. STUDY TECHNICAL APPROACH
2-10 TBG070214143329SCO
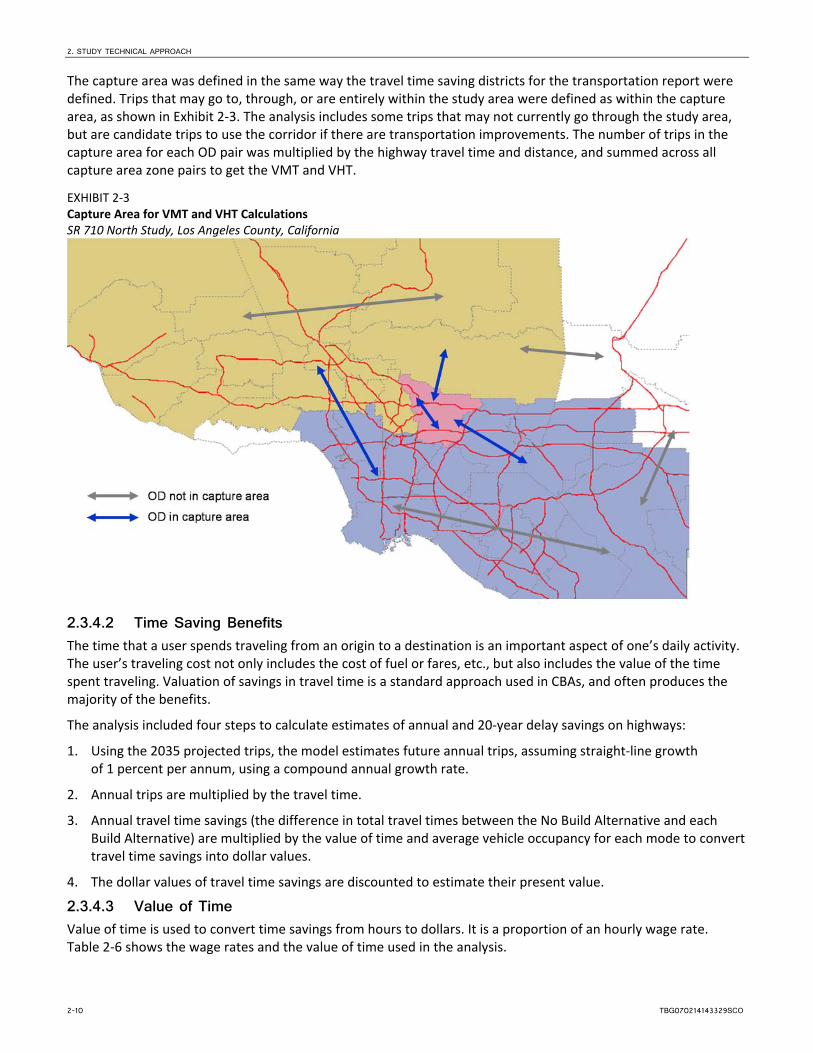
The capture area was defined in the same way the travel time saving districts for the transportation report were defined. Trips that may go to, through, or are entirely within the study area were defined as within the capture area, as shown in Exhibit 2‐3. The analysis includes some trips that may not currently go through the study area, but are candidate trips to use the corridor if there are transportation improvements. The number of trips in the capture area for each OD pair was multiplied by the highway travel time and distance, and summed across all capture area zone pairs to get the VMT and VHT.
EXHIBIT 2‐3 Capture Area for VMT and VHT Calculations SR 710 North Study, Los Angeles County, California
2.3.4.2 Time Saving Benefits The time that a user spends traveling from an origin to a destination is an important aspect of one’s daily activity. The user’s traveling cost not only includes the cost of fuel or fares, etc., but also includes the value of the time spent traveling. Valuation of savings in travel time is a standard approach used in CBAs, and often produces the majority of the benefits.
The analysis included four steps to calculate estimates of annual and 20‐year delay savings on highways:
1. Using the 2035 projected trips, the model estimates future annual trips, assuming straight‐line growth of 1 percent per annum, using a compound annual growth rate.
2. Annual trips are multiplied by the travel time.
3. Annual travel time savings (the difference in total travel times between the No Build Alternative and each Build Alternative) are multiplied by the value of time and average vehicle occupancy for each mode to convert travel time savings into dollar values.
4. The dollar values of travel time savings are discounted to estimate their present value.
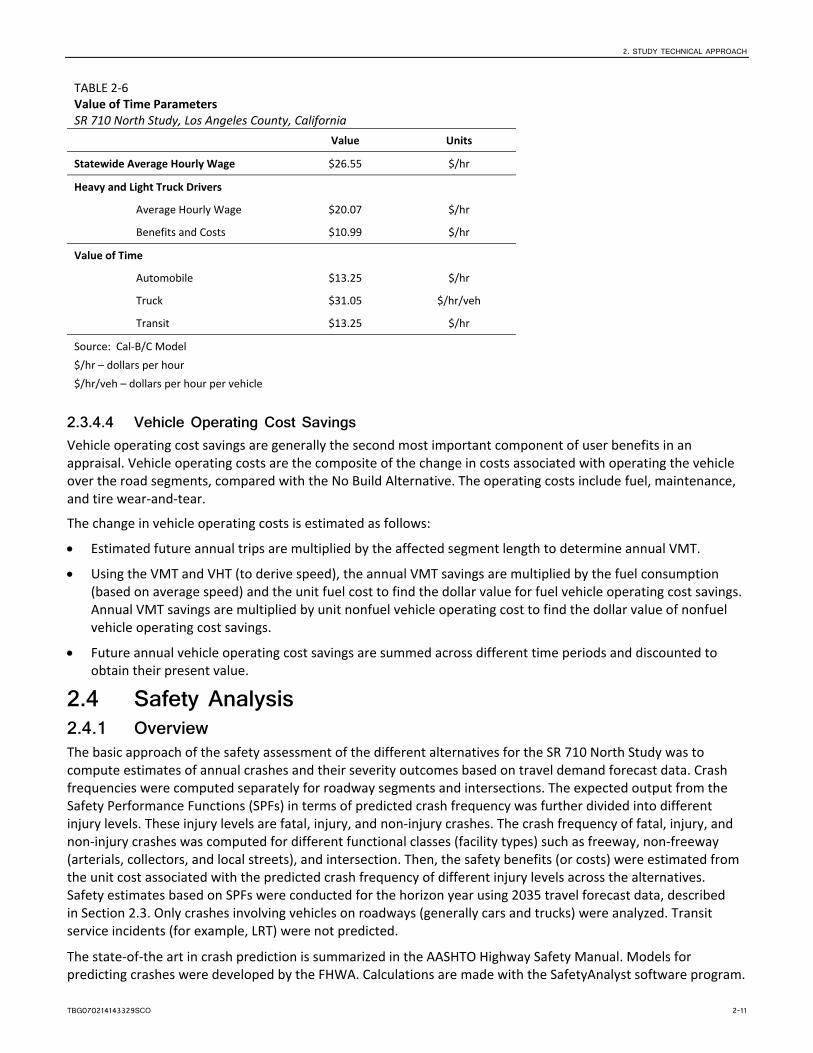
2.3.4.3 Value of Time Value of time is used to convert time savings from hours to dollars. It is a proportion of an hourly wage rate. Table 2‐6 shows the wage rates and the value of time used in the analysis.
2. STUDY TECHNICAL APPROACH
TBG070214143329SCO 2-11
TABLE 2‐6 Value of Time Parameters SR 710 North Study, Los Angeles County, California
Value Units
Statewide Average Hourly Wage $26.55 $/hr
Heavy and Light Truck Drivers
Average Hourly Wage $20.07 $/hr
Benefits and Costs $10.99 $/hr
Value of Time
Automobile $13.25 $/hr
Truck $31.05 $/hr/veh
Transit $13.25 $/hr
Source: Cal‐B/C Model
$/hr – dollars per hour
$/hr/veh – dollars per hour per vehicle
2.3.4.4 Vehicle Operating Cost Savings Vehicle operating cost savings are generally the second most important component of user benefits in an appraisal. Vehicle operating costs are the composite of the change in costs associated with operating the vehicle over the road segments, compared with the No Build Alternative. The operating costs include fuel, maintenance, and tire wear‐and‐tear.
The change in vehicle operating costs is estimated as follows:
Estimated future annual trips are multiplied by the affected segment length to determine annual VMT.
Using the VMT and VHT (to derive speed), the annual VMT savings are multiplied by the fuel consumption (based on average speed) and the unit fuel cost to find the dollar value for fuel vehicle operating cost savings. Annual VMT savings are multiplied by unit nonfuel vehicle operating cost to find the dollar value of nonfuel vehicle operating cost savings.
Future annual vehicle operating cost savings are summed across different time periods and discounted to obtain their present value.
2.4 Safety Analysis 2.4.1 Overview The basic approach of the safety assessment of the different alternatives for the SR 710 North Study was to compute estimates of annual crashes and their severity outcomes based on travel demand forecast data. Crash frequencies were computed separately for roadway segments and intersections. The expected output from the Safety Performance Functions (SPFs) in terms of predicted crash frequency was further divided into different injury levels. These injury levels are fatal, injury, and non‐injury crashes. The crash frequency of fatal, injury, and non‐injury crashes was computed for different functional classes (facility types) such as freeway, non‐freeway (arterials, collectors, and local streets), and intersection. Then, the safety benefits (or costs) were estimated from the unit cost associated with the predicted crash frequency of different injury levels across the alternatives. Safety estimates based on SPFs were conducted for the horizon year using 2035 travel forecast data, described in Section 2.3. Only crashes involving vehicles on roadways (generally cars and trucks) were analyzed. Transit service incidents (for example, LRT) were not predicted.
The state‐of‐the art in crash prediction is summarized in the AASHTO Highway Safety Manual. Models for predicting crashes were developed by the FHWA. Calculations are made with the SafetyAnalyst software program.
2. STUDY TECHNICAL APPROACH
2-12 TBG070214143329SCO
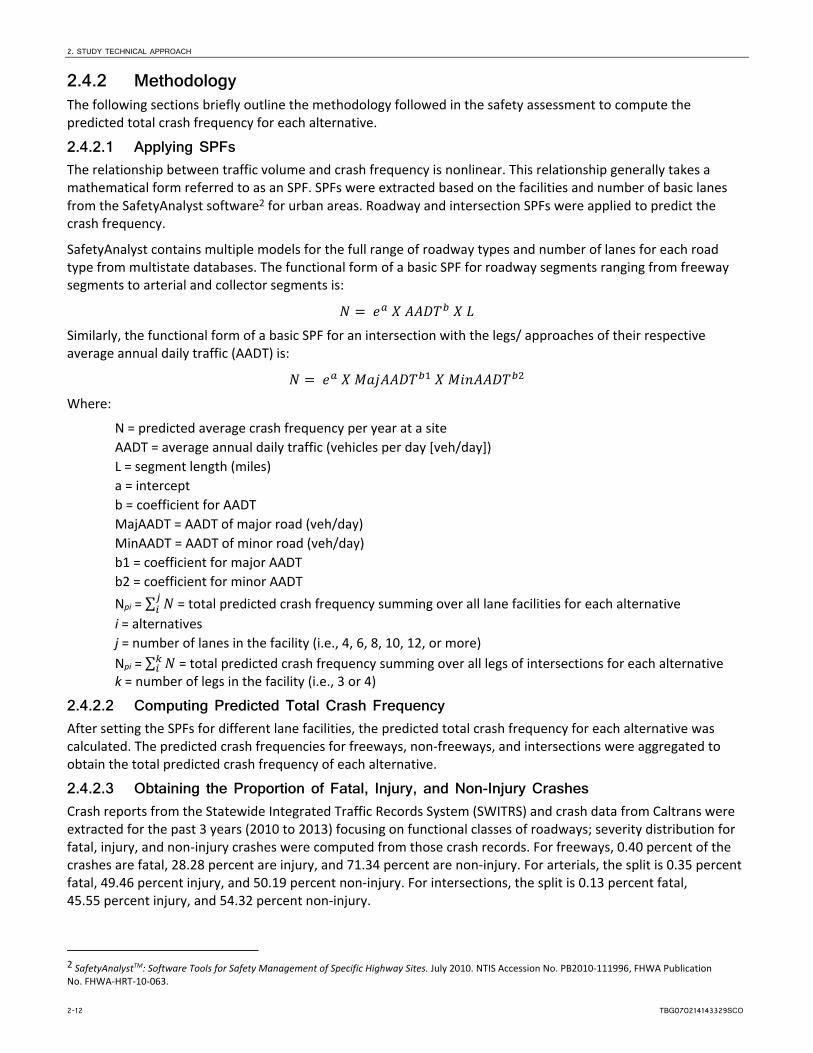
2.4.2 Methodology The following sections briefly outline the methodology followed in the safety assessment to compute the predicted total crash frequency for each alternative.
2.4.2.1 Applying SPFs The relationship between traffic volume and crash frequency is nonlinear. This relationship generally takes a mathematical form referred to as an SPF. SPFs were extracted based on the facilities and number of basic lanes from the SafetyAnalyst software2 for urban areas. Roadway and intersection SPFs were applied to predict the crash frequency.
SafetyAnalyst contains multiple models for the full range of roadway types and number of lanes for each road type from multistate databases. The functional form of a basic SPF for roadway segments ranging from freeway segments to arterial and collector segments is:
Similarly, the functional form of a basic SPF for an intersection with the legs/ approaches of their respective average annual daily traffic (AADT) is:
Where:
N = predicted average crash frequency per year at a site
AADT = average annual daily traffic (vehicles per day [veh/day])
L = segment length (miles)
a = intercept
b = coefficient for AADT
MajAADT = AADT of major road (veh/day)
MinAADT = AADT of minor road (veh/day)
b1 = coefficient for major AADT
b2 = coefficient for minor AADT
Npi = ∑ = total predicted crash frequency summing over all lane facilities for each alternative
i = alternatives
j = number of lanes in the facility (i.e., 4, 6, 8, 10, 12, or more)
Npi = ∑ = total predicted crash frequency summing over all legs of intersections for each alternative k = number of legs in the facility (i.e., 3 or 4)
2.4.2.2 Computing Predicted Total Crash Frequency After setting the SPFs for different lane facilities, the predicted total crash frequency for each alternative was calculated. The predicted crash frequencies for freeways, non‐freeways, and intersections were aggregated to obtain the total predicted crash frequency of each alternative.
2.4.2.3 Obtaining the Proportion of Fatal, Injury, and Non-Injury Crashes Crash reports from the Statewide Integrated Traffic Records System (SWITRS) and crash data from Caltrans were extracted for the past 3 years (2010 to 2013) focusing on functional classes of roadways; severity distribution for fatal, injury, and non‐injury crashes were computed from those crash records. For freeways, 0.40 percent of the crashes are fatal, 28.28 percent are injury, and 71.34 percent are non‐injury. For arterials, the split is 0.35 percent fatal, 49.46 percent injury, and 50.19 percent non‐injury. For intersections, the split is 0.13 percent fatal, 45.55 percent injury, and 54.32 percent non‐injury.
2 SafetyAnalystTM: Software Tools for Safety Management of Specific Highway Sites. July 2010. NTIS Accession No. PB2010‐111996, FHWA Publication No. FHWA‐HRT‐10‐063.
2. STUDY TECHNICAL APPROACH
TBG070214143329SCO 2-13
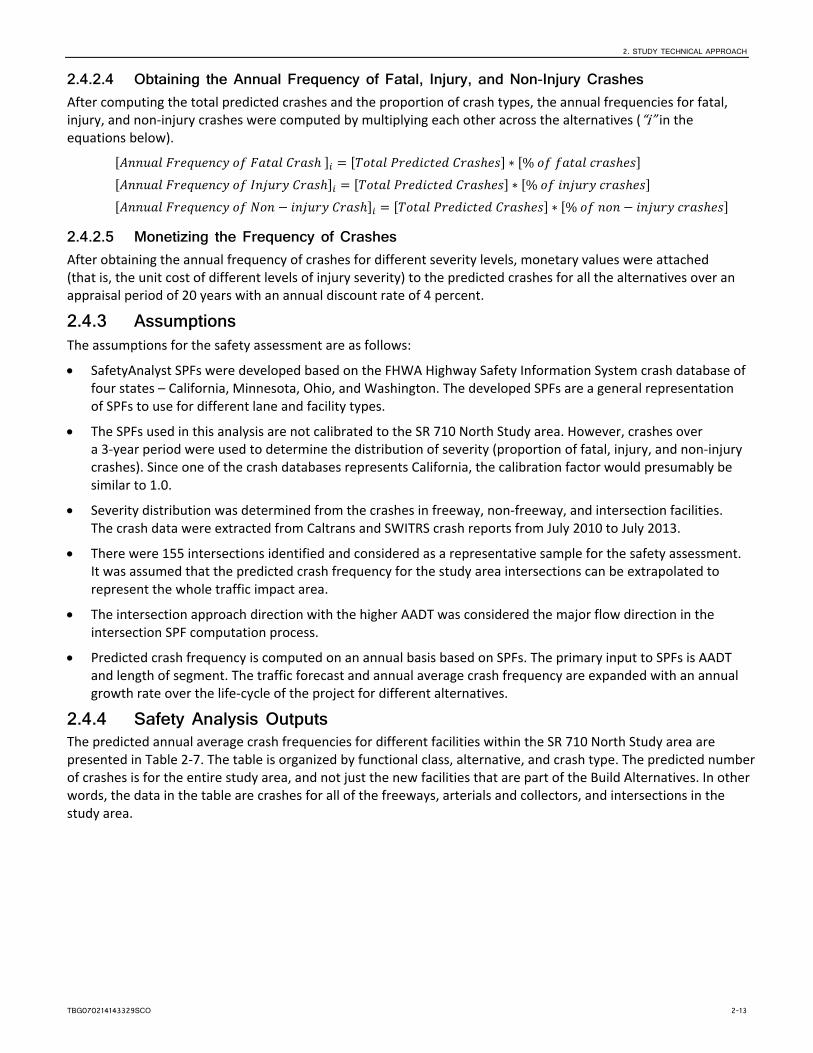
2.4.2.4 Obtaining the Annual Frequency of Fatal, Injury, and Non-Injury Crashes After computing the total predicted crashes and the proportion of crash types, the annual frequencies for fatal, injury, and non‐injury crashes were computed by multiplying each other across the alternatives (“i” in the equations below).
∗ %
∗ %
∗ %
2.4.2.5 Monetizing the Frequency of Crashes After obtaining the annual frequency of crashes for different severity levels, monetary values were attached (that is, the unit cost of different levels of injury severity) to the predicted crashes for all the alternatives over an appraisal period of 20 years with an annual discount rate of 4 percent.
2.4.3 Assumptions The assumptions for the safety assessment are as follows:
SafetyAnalyst SPFs were developed based on the FHWA Highway Safety Information System crash database of four states – California, Minnesota, Ohio, and Washington. The developed SPFs are a general representation of SPFs to use for different lane and facility types.
The SPFs used in this analysis are not calibrated to the SR 710 North Study area. However, crashes over a 3‐year period were used to determine the distribution of severity (proportion of fatal, injury, and non‐injury crashes). Since one of the crash databases represents California, the calibration factor would presumably be similar to 1.0.
Severity distribution was determined from the crashes in freeway, non‐freeway, and intersection facilities. The crash data were extracted from Caltrans and SWITRS crash reports from July 2010 to July 2013.
There were 155 intersections identified and considered as a representative sample for the safety assessment. It was assumed that the predicted crash frequency for the study area intersections can be extrapolated to represent the whole traffic impact area.
The intersection approach direction with the higher AADT was considered the major flow direction in the intersection SPF computation process.
Predicted crash frequency is computed on an annual basis based on SPFs. The primary input to SPFs is AADT and length of segment. The traffic forecast and annual average crash frequency are expanded with an annual growth rate over the life‐cycle of the project for different alternatives.
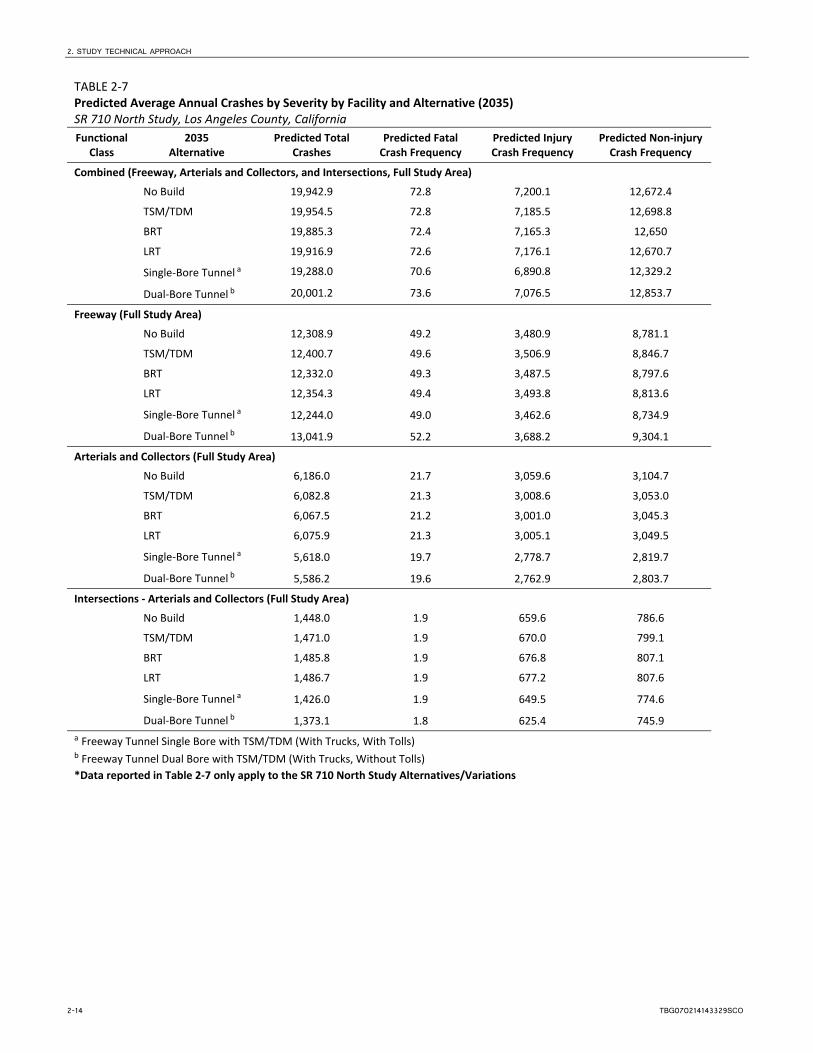
2.4.4 Safety Analysis Outputs The predicted annual average crash frequencies for different facilities within the SR 710 North Study area are presented in Table 2‐7. The table is organized by functional class, alternative, and crash type. The predicted number of crashes is for the entire study area, and not just the new facilities that are part of the Build Alternatives. In other words, the data in the table are crashes for all of the freeways, arterials and collectors, and intersections in the study area.
2. STUDY TECHNICAL APPROACH
2-14 TBG070214143329SCO
TABLE 2‐7 Predicted Average Annual Crashes by Severity by Facility and Alternative (2035) SR 710 North Study, Los Angeles County, California
Functional Class
2035 Alternative
Predicted Total Crashes
Predicted Fatal Crash Frequency
Predicted Injury Crash Frequency
Predicted Non‐injury Crash Frequency
Combined (Freeway, Arterials and Collectors, and Intersections, Full Study Area)
No Build 19,942.9 72.8 7,200.1 12,672.4
TSM/TDM 19,954.5 72.8 7,185.5 12,698.8
BRT 19,885.3 72.4 7,165.3 12,650
LRT 19,916.9 72.6 7,176.1 12,670.7
Single‐Bore Tunnel a 19,288.0 70.6 6,890.8 12,329.2
Dual‐Bore Tunnel b 20,001.2 73.6 7,076.5 12,853.7
Freeway (Full Study Area)
No Build 12,308.9 49.2 3,480.9 8,781.1
TSM/TDM 12,400.7 49.6 3,506.9 8,846.7
BRT 12,332.0 49.3 3,487.5 8,797.6
LRT 12,354.3 49.4 3,493.8 8,813.6
Single‐Bore Tunnel a 12,244.0 49.0 3,462.6 8,734.9
Dual‐Bore Tunnel b 13,041.9 52.2 3,688.2 9,304.1
Arterials and Collectors (Full Study Area)
No Build 6,186.0 21.7 3,059.6 3,104.7
TSM/TDM 6,082.8 21.3 3,008.6 3,053.0
BRT 6,067.5 21.2 3,001.0 3,045.3
LRT 6,075.9 21.3 3,005.1 3,049.5
Single‐Bore Tunnel a 5,618.0 19.7 2,778.7 2,819.7
Dual‐Bore Tunnel b 5,586.2 19.6 2,762.9 2,803.7
Intersections ‐ Arterials and Collectors (Full Study Area)
No Build 1,448.0 1.9 659.6 786.6
TSM/TDM 1,471.0 1.9 670.0 799.1
BRT 1,485.8 1.9 676.8 807.1
LRT 1,486.7 1.9 677.2 807.6
Single‐Bore Tunnel a 1,426.0 1.9 649.5 774.6
Dual‐Bore Tunnel b 1,373.1 1.8 625.4 745.9 a Freeway Tunnel Single Bore with TSM/TDM (With Trucks, With Tolls) b Freeway Tunnel Dual Bore with TSM/TDM (With Trucks, Without Tolls)
*Data reported in Table 2‐7 only apply to the SR 710 North Study Alternatives/Variations
2. STUDY TECHNICAL APPROACH
TBG070214143329SCO 2-15
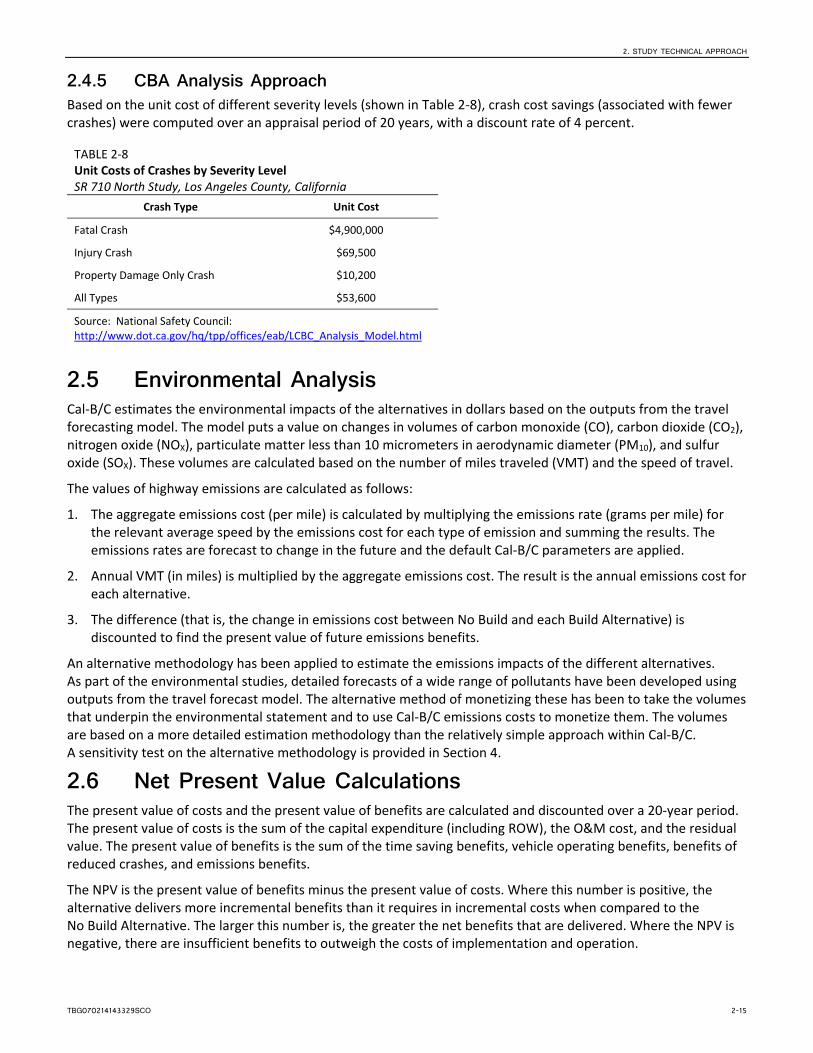
2.4.5 CBA Analysis Approach Based on the unit cost of different severity levels (shown in Table 2‐8), crash cost savings (associated with fewer crashes) were computed over an appraisal period of 20 years, with a discount rate of 4 percent.
TABLE 2‐8 Unit Costs of Crashes by Severity Level SR 710 North Study, Los Angeles County, California
Crash Type Unit Cost
Fatal Crash $4,900,000
Injury Crash $69,500
Property Damage Only Crash $10,200
All Types $53,600
Source: National Safety Council: http://www.dot.ca.gov/hq/tpp/offices/eab/LCBC_Analysis_Model.html
2.5 Environmental Analysis Cal‐B/C estimates the environmental impacts of the alternatives in dollars based on the outputs from the travel forecasting model. The model puts a value on changes in volumes of carbon monoxide (CO), carbon dioxide (CO2), nitrogen oxide (NOX), particulate matter less than 10 micrometers in aerodynamic diameter (PM10), and sulfur oxide (SOX). These volumes are calculated based on the number of miles traveled (VMT) and the speed of travel.
The values of highway emissions are calculated as follows:
1. The aggregate emissions cost (per mile) is calculated by multiplying the emissions rate (grams per mile) for the relevant average speed by the emissions cost for each type of emission and summing the results. The emissions rates are forecast to change in the future and the default Cal‐B/C parameters are applied.
2. Annual VMT (in miles) is multiplied by the aggregate emissions cost. The result is the annual emissions cost for each alternative.
3. The difference (that is, the change in emissions cost between No Build and each Build Alternative) is discounted to find the present value of future emissions benefits.
An alternative methodology has been applied to estimate the emissions impacts of the different alternatives. As part of the environmental studies, detailed forecasts of a wide range of pollutants have been developed using outputs from the travel forecast model. The alternative method of monetizing these has been to take the volumes that underpin the environmental statement and to use Cal‐B/C emissions costs to monetize them. The volumes are based on a more detailed estimation methodology than the relatively simple approach within Cal‐B/C. A sensitivity test on the alternative methodology is provided in Section 4.
2.6 Net Present Value Calculations The present value of costs and the present value of benefits are calculated and discounted over a 20‐year period. The present value of costs is the sum of the capital expenditure (including ROW), the O&M cost, and the residual value. The present value of benefits is the sum of the time saving benefits, vehicle operating benefits, benefits of reduced crashes, and emissions benefits.
The NPV is the present value of benefits minus the present value of costs. Where this number is positive, the alternative delivers more incremental benefits than it requires in incremental costs when compared to the No Build Alternative. The larger this number is, the greater the net benefits that are delivered. Where the NPV is negative, there are insufficient benefits to outweigh the costs of implementation and operation.
2. STUDY TECHNICAL APPROACH
2-16 TBG070214143329SCO
Some improvements may have a low (but positive) NPV but also low costs, meaning they deliver modest benefits but have a good return on investment. Larger improvements may have high NPVs as they deliver greater benefits but require a higher investment. None of the outputs from the CBA measures (costs, value of benefits, and NPV) should be used on their own. However, all provide useful information and should be considered together with other performance measures by decision makers.
Tolls, taxes, and other user charges for transportation projects represent a revenue source to government agencies for financing transportation projects. However, from the CBA point of view, this revenue cannot be considered as a benefit. A more accurate way of viewing these elements is that they are transfer benefits. This CBA approach is consistent with the guidance provided by FHWA (FHWA Transportation Performance Management Web site, http://www.fhwa.dot.gov/tpm/).
TBG070214143329SCO 3-1
SECTION 3
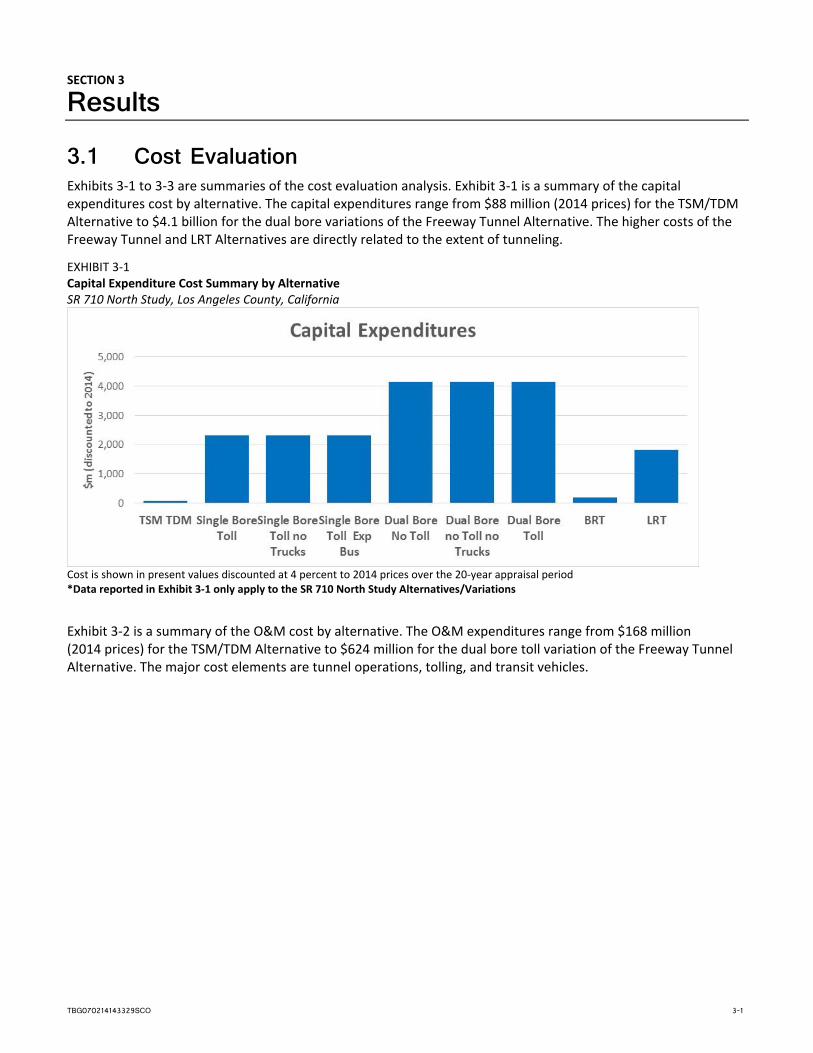
Results 3.1 Cost Evaluation Exhibits 3‐1 to 3‐3 are summaries of the cost evaluation analysis. Exhibit 3‐1 is a summary of the capital expenditures cost by alternative. The capital expenditures range from $88 million (2014 prices) for the TSM/TDM Alternative to $4.1 billion for the dual bore variations of the Freeway Tunnel Alternative. The higher costs of the Freeway Tunnel and LRT Alternatives are directly related to the extent of tunneling.
EXHIBIT 3‐1 Capital Expenditure Cost Summary by Alternative SR 710 North Study, Los Angeles County, California
Cost is shown in present values discounted at 4 percent to 2014 prices over the 20‐year appraisal period *Data reported in Exhibit 3‐1 only apply to the SR 710 North Study Alternatives/Variations
Exhibit 3‐2 is a summary of the O&M cost by alternative. The O&M expenditures range from $168 million (2014 prices) for the TSM/TDM Alternative to $624 million for the dual bore toll variation of the Freeway Tunnel Alternative. The major cost elements are tunnel operations, tolling, and transit vehicles.
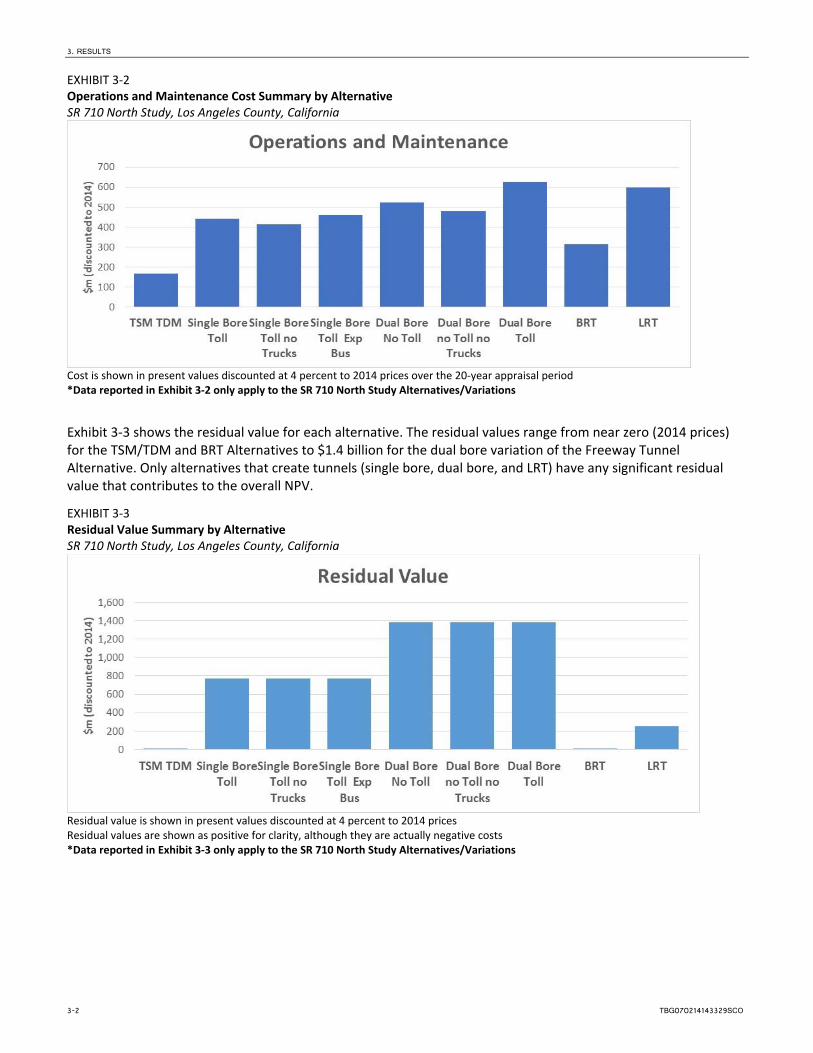
3. RESULTS
3-2 TBG070214143329SCO
EXHIBIT 3‐2 Operations and Maintenance Cost Summary by Alternative SR 710 North Study, Los Angeles County, California
Cost is shown in present values discounted at 4 percent to 2014 prices over the 20‐year appraisal period *Data reported in Exhibit 3‐2 only apply to the SR 710 North Study Alternatives/Variations
Exhibit 3‐3 shows the residual value for each alternative. The residual values range from near zero (2014 prices) for the TSM/TDM and BRT Alternatives to $1.4 billion for the dual bore variation of the Freeway Tunnel Alternative. Only alternatives that create tunnels (single bore, dual bore, and LRT) have any significant residual value that contributes to the overall NPV.
EXHIBIT 3‐3 Residual Value Summary by Alternative SR 710 North Study, Los Angeles County, California
Residual value is shown in present values discounted at 4 percent to 2014 prices Residual values are shown as positive for clarity, although they are actually negative costs *Data reported in Exhibit 3‐3 only apply to the SR 710 North Study Alternatives/Variations
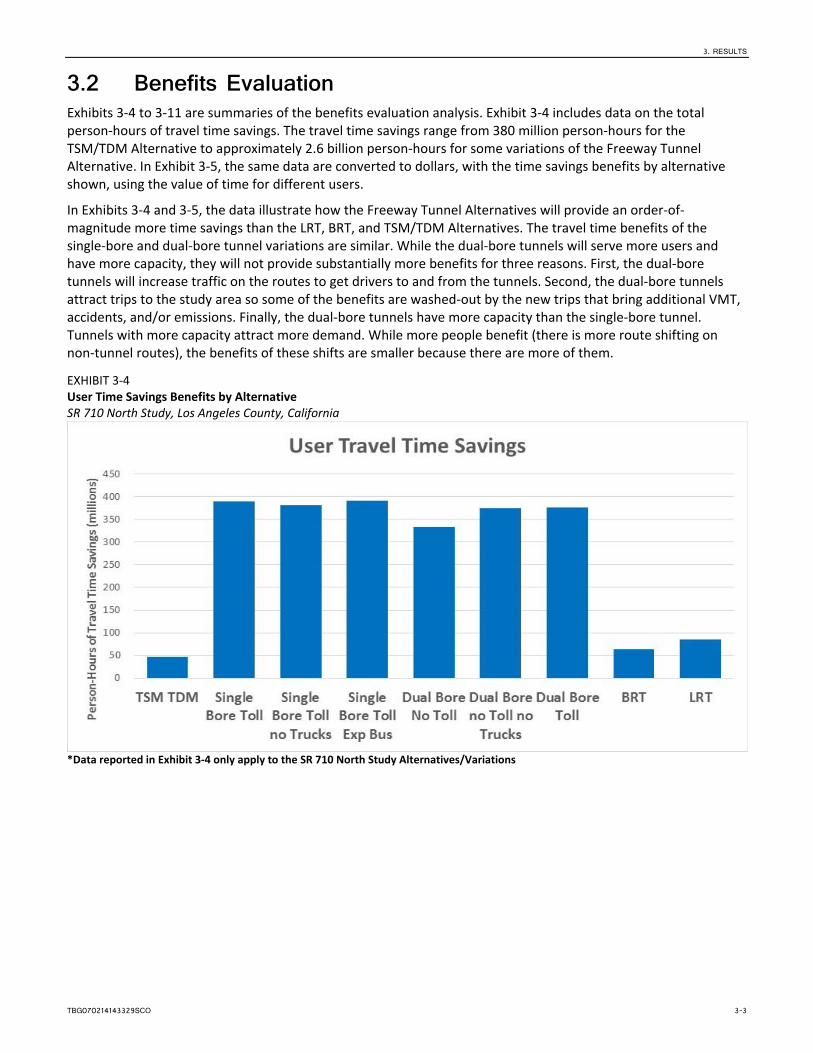
3. RESULTS
TBG070214143329SCO 3-3
3.2 Benefits Evaluation Exhibits 3‐4 to 3‐11 are summaries of the benefits evaluation analysis. Exhibit 3‐4 includes data on the total person‐hours of travel time savings. The travel time savings range from 380 million person‐hours for the TSM/TDM Alternative to approximately 2.6 billion person‐hours for some variations of the Freeway Tunnel Alternative. In Exhibit 3‐5, the same data are converted to dollars, with the time savings benefits by alternative shown, using the value of time for different users.
In Exhibits 3‐4 and 3‐5, the data illustrate how the Freeway Tunnel Alternatives will provide an order‐of‐magnitude more time savings than the LRT, BRT, and TSM/TDM Alternatives. The travel time benefits of the single‐bore and dual‐bore tunnel variations are similar. While the dual‐bore tunnels will serve more users and have more capacity, they will not provide substantially more benefits for three reasons. First, the dual‐bore tunnels will increase traffic on the routes to get drivers to and from the tunnels. Second, the dual‐bore tunnels attract trips to the study area so some of the benefits are washed‐out by the new trips that bring additional VMT, accidents, and/or emissions. Finally, the dual‐bore tunnels have more capacity than the single‐bore tunnel. Tunnels with more capacity attract more demand. While more people benefit (there is more route shifting on non‐tunnel routes), the benefits of these shifts are smaller because there are more of them.
EXHIBIT 3‐4 User Time Savings Benefits by Alternative SR 710 North Study, Los Angeles County, California
*Data reported in Exhibit 3‐4 only apply to the SR 710 North Study Alternatives/Variations
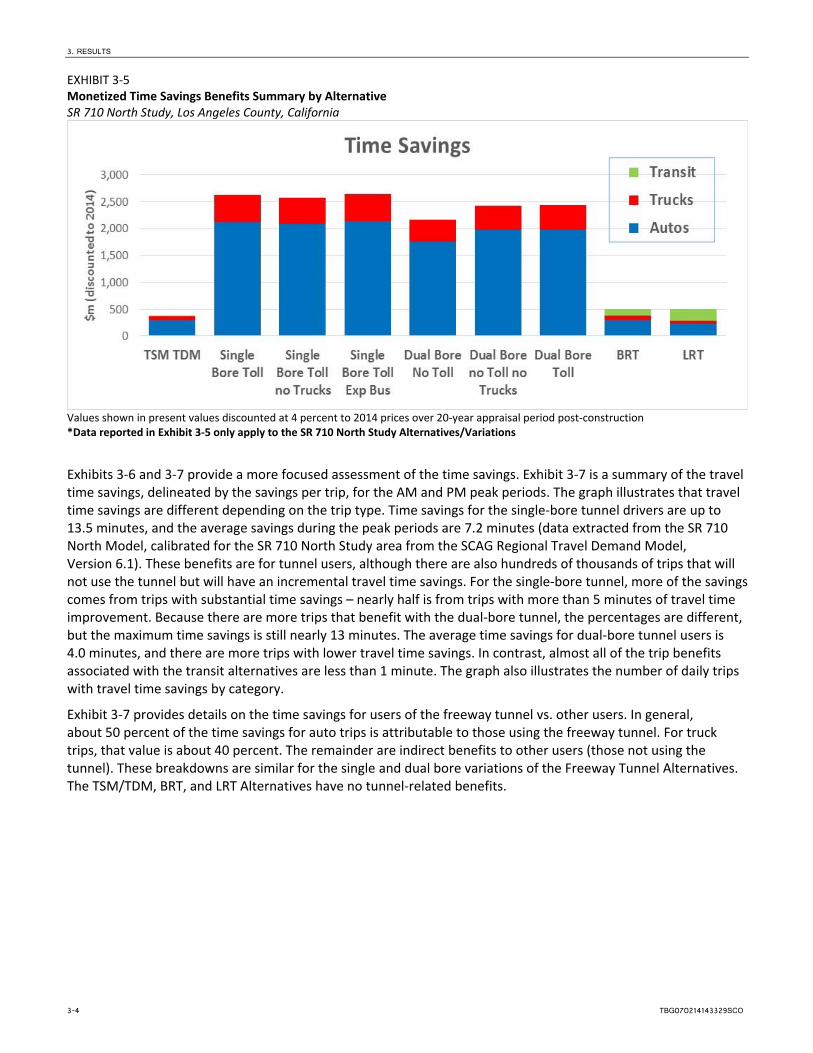
3. RESULTS
3-4 TBG070214143329SCO
EXHIBIT 3‐5 Monetized Time Savings Benefits Summary by Alternative SR 710 North Study, Los Angeles County, California
Values shown in present values discounted at 4 percent to 2014 prices over 20‐year appraisal period post‐construction *Data reported in Exhibit 3‐5 only apply to the SR 710 North Study Alternatives/Variations
Exhibits 3‐6 and 3‐7 provide a more focused assessment of the time savings. Exhibit 3‐7 is a summary of the travel time savings, delineated by the savings per trip, for the AM and PM peak periods. The graph illustrates that travel time savings are different depending on the trip type. Time savings for the single‐bore tunnel drivers are up to 13.5 minutes, and the average savings during the peak periods are 7.2 minutes (data extracted from the SR 710 North Model, calibrated for the SR 710 North Study area from the SCAG Regional Travel Demand Model, Version 6.1). These benefits are for tunnel users, although there are also hundreds of thousands of trips that will not use the tunnel but will have an incremental travel time savings. For the single‐bore tunnel, more of the savings comes from trips with substantial time savings – nearly half is from trips with more than 5 minutes of travel time improvement. Because there are more trips that benefit with the dual‐bore tunnel, the percentages are different, but the maximum time savings is still nearly 13 minutes. The average time savings for dual‐bore tunnel users is 4.0 minutes, and there are more trips with lower travel time savings. In contrast, almost all of the trip benefits associated with the transit alternatives are less than 1 minute. The graph also illustrates the number of daily trips with travel time savings by category.
Exhibit 3‐7 provides details on the time savings for users of the freeway tunnel vs. other users. In general, about 50 percent of the time savings for auto trips is attributable to those using the freeway tunnel. For truck trips, that value is about 40 percent. The remainder are indirect benefits to other users (those not using the tunnel). These breakdowns are similar for the single and dual bore variations of the Freeway Tunnel Alternatives. The TSM/TDM, BRT, and LRT Alternatives have no tunnel‐related benefits.
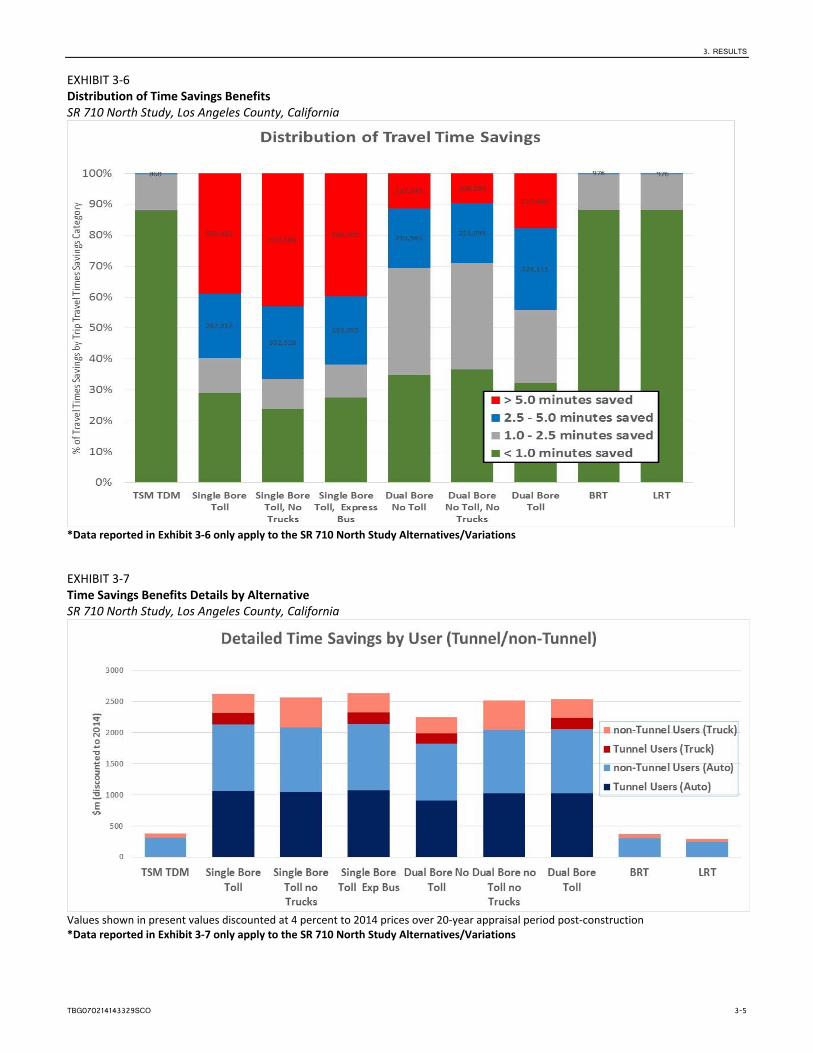
3. RESULTS
TBG070214143329SCO 3-5
EXHIBIT 3‐6 Distribution of Time Savings Benefits SR 710 North Study, Los Angeles County, California
*Data reported in Exhibit 3‐6 only apply to the SR 710 North Study Alternatives/Variations
EXHIBIT 3‐7 Time Savings Benefits Details by Alternative SR 710 North Study, Los Angeles County, California
Values shown in present values discounted at 4 percent to 2014 prices over 20‐year appraisal period post‐construction *Data reported in Exhibit 3‐7 only apply to the SR 710 North Study Alternatives/Variations
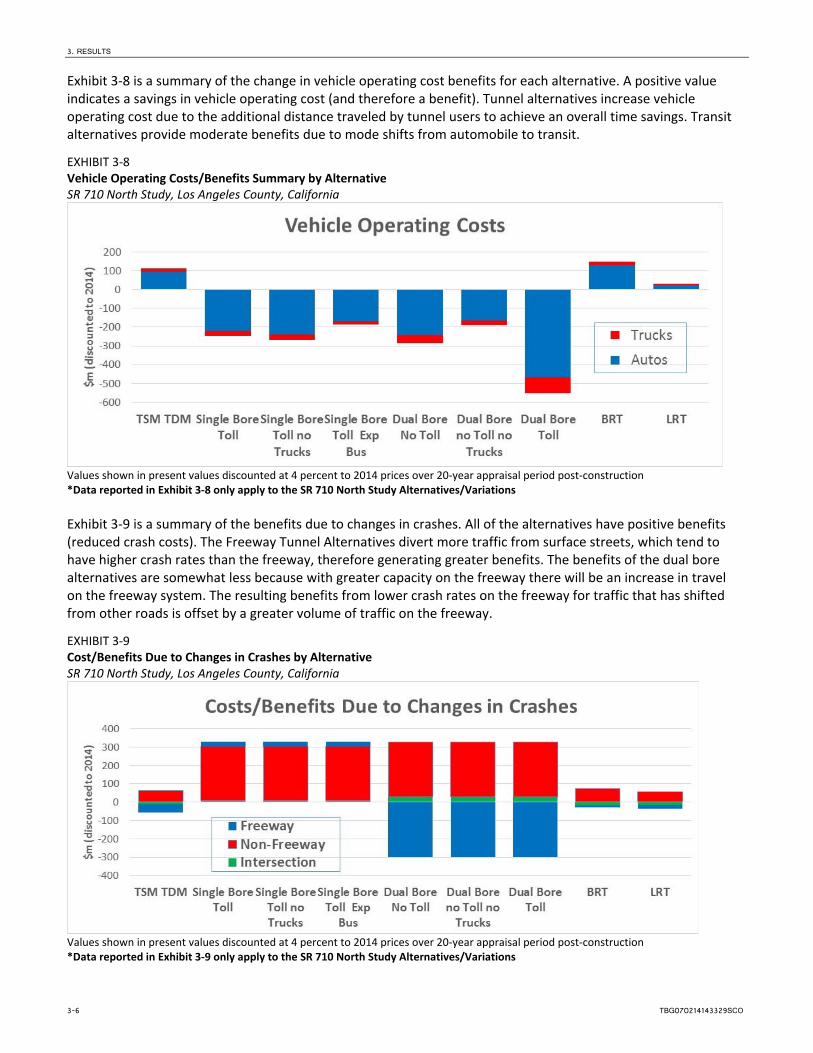
3. RESULTS
3-6 TBG070214143329SCO
Exhibit 3‐8 is a summary of the change in vehicle operating cost benefits for each alternative. A positive value indicates a savings in vehicle operating cost (and therefore a benefit). Tunnel alternatives increase vehicle operating cost due to the additional distance traveled by tunnel users to achieve an overall time savings. Transit alternatives provide moderate benefits due to mode shifts from automobile to transit.
EXHIBIT 3‐8 Vehicle Operating Costs/Benefits Summary by Alternative SR 710 North Study, Los Angeles County, California
Values shown in present values discounted at 4 percent to 2014 prices over 20‐year appraisal period post‐construction *Data reported in Exhibit 3‐8 only apply to the SR 710 North Study Alternatives/Variations
Exhibit 3‐9 is a summary of the benefits due to changes in crashes. All of the alternatives have positive benefits (reduced crash costs). The Freeway Tunnel Alternatives divert more traffic from surface streets, which tend to have higher crash rates than the freeway, therefore generating greater benefits. The benefits of the dual bore alternatives are somewhat less because with greater capacity on the freeway there will be an increase in travel on the freeway system. The resulting benefits from lower crash rates on the freeway for traffic that has shifted from other roads is offset by a greater volume of traffic on the freeway.
EXHIBIT 3‐9 Cost/Benefits Due to Changes in Crashes by Alternative SR 710 North Study, Los Angeles County, California
Values shown in present values discounted at 4 percent to 2014 prices over 20‐year appraisal period post‐construction *Data reported in Exhibit 3‐9 only apply to the SR 710 North Study Alternatives/Variations
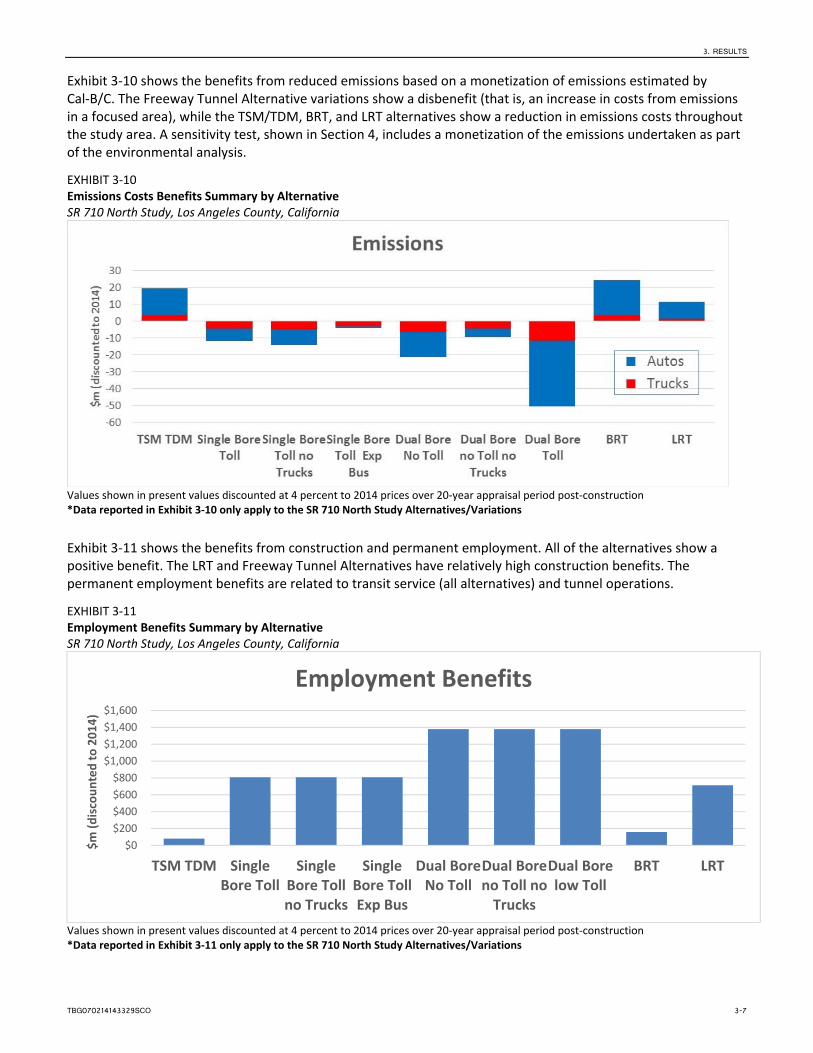
3. RESULTS
TBG070214143329SCO 3-7
Exhibit 3‐10 shows the benefits from reduced emissions based on a monetization of emissions estimated by Cal‐B/C. The Freeway Tunnel Alternative variations show a disbenefit (that is, an increase in costs from emissions in a focused area), while the TSM/TDM, BRT, and LRT alternatives show a reduction in emissions costs throughout the study area. A sensitivity test, shown in Section 4, includes a monetization of the emissions undertaken as part of the environmental analysis.
EXHIBIT 3‐10 Emissions Costs Benefits Summary by Alternative SR 710 North Study, Los Angeles County, California
Values shown in present values discounted at 4 percent to 2014 prices over 20‐year appraisal period post‐construction *Data reported in Exhibit 3‐10 only apply to the SR 710 North Study Alternatives/Variations
Exhibit 3‐11 shows the benefits from construction and permanent employment. All of the alternatives show a positive benefit. The LRT and Freeway Tunnel Alternatives have relatively high construction benefits. The permanent employment benefits are related to transit service (all alternatives) and tunnel operations.
EXHIBIT 3‐11 Employment Benefits Summary by Alternative SR 710 North Study, Los Angeles County, California
Values shown in present values discounted at 4 percent to 2014 prices over 20‐year appraisal period post‐construction *Data reported in Exhibit 3‐11 only apply to the SR 710 North Study Alternatives/Variations
$0
$200
$400
$600
$800
$1,000
$1,200
$1,400
$1,600
TSM TDM SingleBore Toll
SingleBore Tollno Trucks
SingleBore TollExp Bus
Dual BoreNo Toll
Dual Boreno Toll noTrucks
Dual Borelow Toll
BRT LRT
$m (discounted to 2014)
Employment Benefits
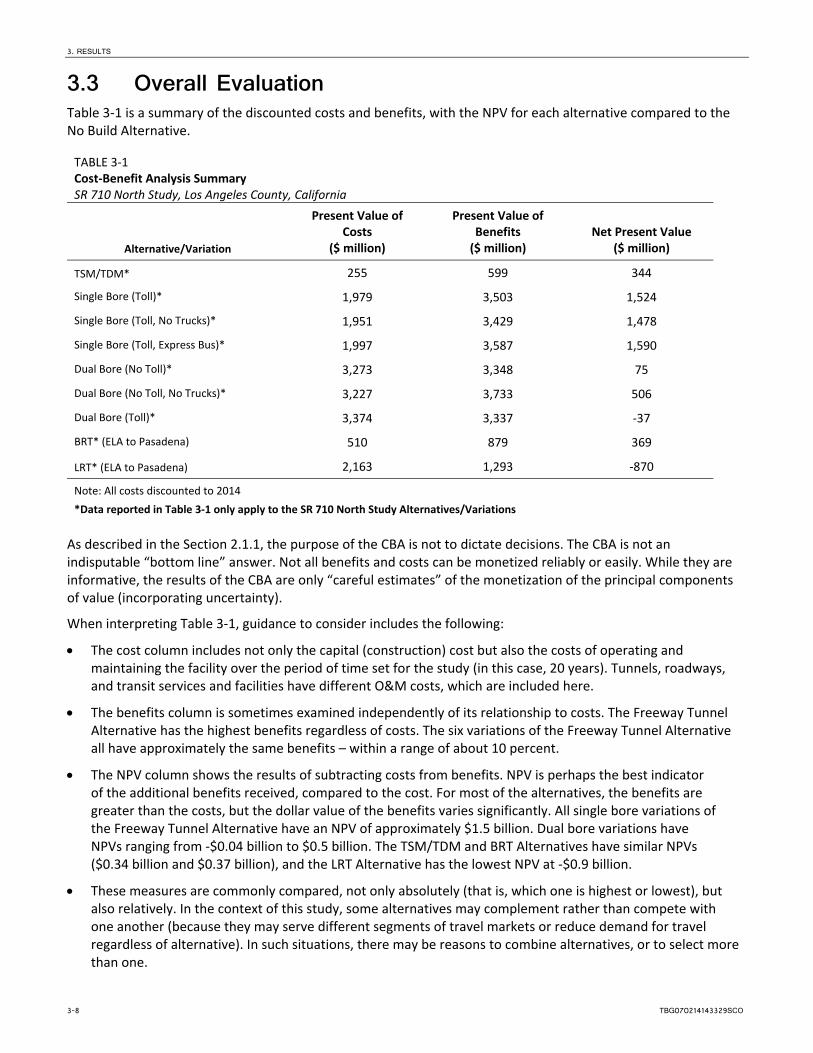
3. RESULTS
3-8 TBG070214143329SCO
3.3 Overall Evaluation Table 3‐1 is a summary of the discounted costs and benefits, with the NPV for each alternative compared to the No Build Alternative.
TABLE 3‐1 Cost‐Benefit Analysis Summary SR 710 North Study, Los Angeles County, California
Alternative/Variation
Present Value of Costs
($ million)
Present Value of Benefits ($ million)
Net Present Value ($ million)
TSM/TDM* 255 599 344
Single Bore (Toll)* 1,979 3,503 1,524
Single Bore (Toll, No Trucks)* 1,951 3,429 1,478
Single Bore (Toll, Express Bus)* 1,997 3,587 1,590
Dual Bore (No Toll)* 3,273 3,348 75
Dual Bore (No Toll, No Trucks)* 3,227 3,733 506
Dual Bore (Toll)* 3,374 3,337 ‐37
BRT* (ELA to Pasadena) 510 879 369
LRT* (ELA to Pasadena) 2,163 1,293 ‐870
Note: All costs discounted to 2014
*Data reported in Table 3‐1 only apply to the SR 710 North Study Alternatives/Variations
As described in the Section 2.1.1, the purpose of the CBA is not to dictate decisions. The CBA is not an indisputable “bottom line” answer. Not all benefits and costs can be monetized reliably or easily. While they are informative, the results of the CBA are only “careful estimates” of the monetization of the principal components of value (incorporating uncertainty).
When interpreting Table 3‐1, guidance to consider includes the following:
The cost column includes not only the capital (construction) cost but also the costs of operating and maintaining the facility over the period of time set for the study (in this case, 20 years). Tunnels, roadways, and transit services and facilities have different O&M costs, which are included here.
The benefits column is sometimes examined independently of its relationship to costs. The Freeway Tunnel Alternative has the highest benefits regardless of costs. The six variations of the Freeway Tunnel Alternative all have approximately the same benefits – within a range of about 10 percent.
The NPV column shows the results of subtracting costs from benefits. NPV is perhaps the best indicator of the additional benefits received, compared to the cost. For most of the alternatives, the benefits are greater than the costs, but the dollar value of the benefits varies significantly. All single bore variations of the Freeway Tunnel Alternative have an NPV of approximately $1.5 billion. Dual bore variations have NPVs ranging from ‐$0.04 billion to $0.5 billion. The TSM/TDM and BRT Alternatives have similar NPVs ($0.34 billion and $0.37 billion), and the LRT Alternative has the lowest NPV at ‐$0.9 billion.
These measures are commonly compared, not only absolutely (that is, which one is highest or lowest), but also relatively. In the context of this study, some alternatives may complement rather than compete with one another (because they may serve different segments of travel markets or reduce demand for travel regardless of alternative). In such situations, there may be reasons to combine alternatives, or to select more than one.
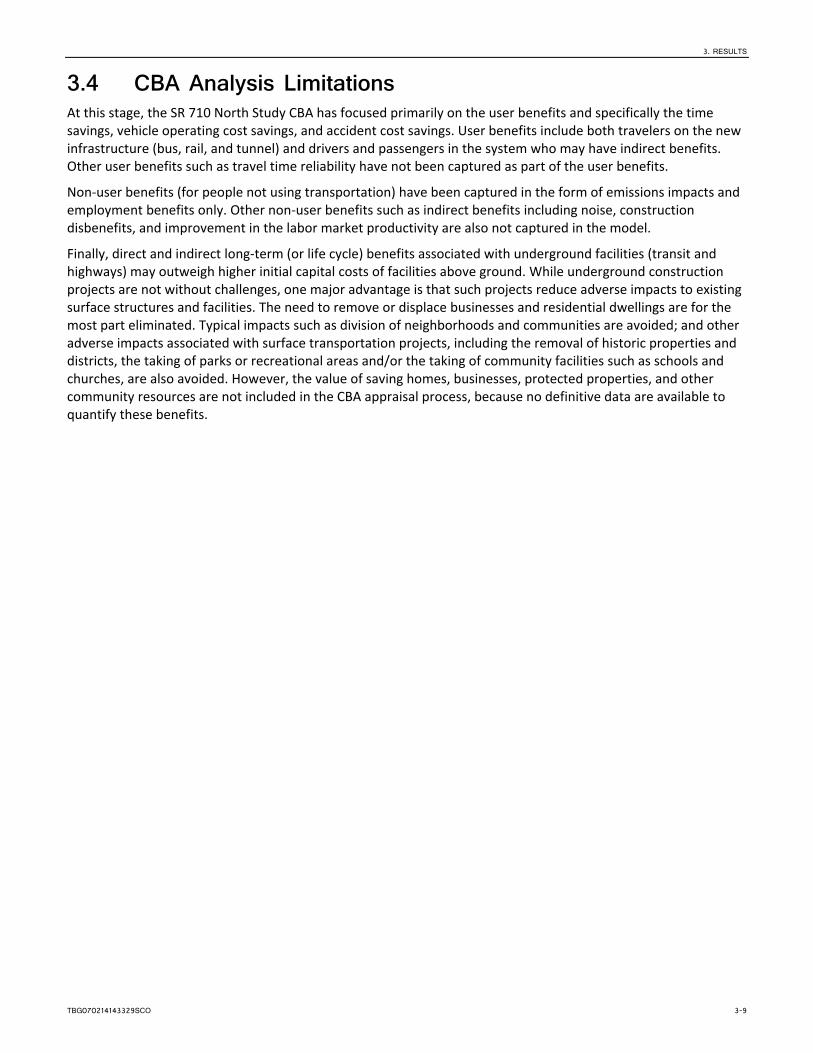
3. RESULTS
TBG070214143329SCO 3-9
3.4 CBA Analysis Limitations At this stage, the SR 710 North Study CBA has focused primarily on the user benefits and specifically the time savings, vehicle operating cost savings, and accident cost savings. User benefits include both travelers on the new infrastructure (bus, rail, and tunnel) and drivers and passengers in the system who may have indirect benefits. Other user benefits such as travel time reliability have not been captured as part of the user benefits.
Non‐user benefits (for people not using transportation) have been captured in the form of emissions impacts and employment benefits only. Other non‐user benefits such as indirect benefits including noise, construction disbenefits, and improvement in the labor market productivity are also not captured in the model.
Finally, direct and indirect long‐term (or life cycle) benefits associated with underground facilities (transit and highways) may outweigh higher initial capital costs of facilities above ground. While underground construction projects are not without challenges, one major advantage is that such projects reduce adverse impacts to existing surface structures and facilities. The need to remove or displace businesses and residential dwellings are for the most part eliminated. Typical impacts such as division of neighborhoods and communities are avoided; and other adverse impacts associated with surface transportation projects, including the removal of historic properties and districts, the taking of parks or recreational areas and/or the taking of community facilities such as schools and churches, are also avoided. However, the value of saving homes, businesses, protected properties, and other community resources are not included in the CBA appraisal process, because no definitive data are available to quantify these benefits.

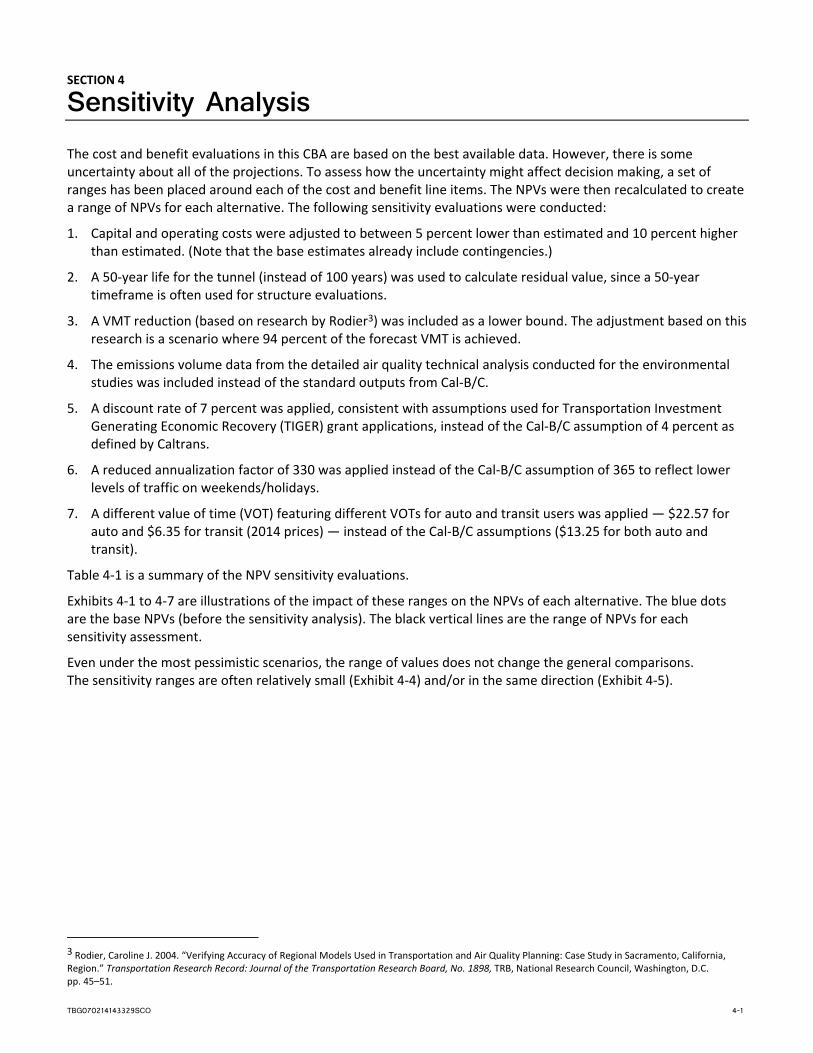
TBG070214143329SCO 4-1
SECTION 4
Sensitivity Analysis The cost and benefit evaluations in this CBA are based on the best available data. However, there is some uncertainty about all of the projections. To assess how the uncertainty might affect decision making, a set of ranges has been placed around each of the cost and benefit line items. The NPVs were then recalculated to create a range of NPVs for each alternative. The following sensitivity evaluations were conducted:
1. Capital and operating costs were adjusted to between 5 percent lower than estimated and 10 percent higher than estimated. (Note that the base estimates already include contingencies.)
2. A 50‐year life for the tunnel (instead of 100 years) was used to calculate residual value, since a 50‐year timeframe is often used for structure evaluations.
3. A VMT reduction (based on research by Rodier3) was included as a lower bound. The adjustment based on this research is a scenario where 94 percent of the forecast VMT is achieved.
4. The emissions volume data from the detailed air quality technical analysis conducted for the environmental studies was included instead of the standard outputs from Cal‐B/C.
5. A discount rate of 7 percent was applied, consistent with assumptions used for Transportation Investment Generating Economic Recovery (TIGER) grant applications, instead of the Cal‐B/C assumption of 4 percent as defined by Caltrans.
6. A reduced annualization factor of 330 was applied instead of the Cal‐B/C assumption of 365 to reflect lower levels of traffic on weekends/holidays.
7. A different value of time (VOT) featuring different VOTs for auto and transit users was applied — $22.57 for auto and $6.35 for transit (2014 prices) — instead of the Cal‐B/C assumptions ($13.25 for both auto and transit).
Table 4‐1 is a summary of the NPV sensitivity evaluations.
Exhibits 4‐1 to 4‐7 are illustrations of the impact of these ranges on the NPVs of each alternative. The blue dots are the base NPVs (before the sensitivity analysis). The black vertical lines are the range of NPVs for each sensitivity assessment.
Even under the most pessimistic scenarios, the range of values does not change the general comparisons. The sensitivity ranges are often relatively small (Exhibit 4‐4) and/or in the same direction (Exhibit 4‐5).
3 Rodier, Caroline J. 2004. “Verifying Accuracy of Regional Models Used in Transportation and Air Quality Planning: Case Study in Sacramento, California, Region.” Transportation Research Record: Journal of the Transportation Research Board, No. 1898, TRB, National Research Council, Washington, D.C. pp. 45–51.

4. SENSITIVITY ANALYSIS
4-2 TBG070214143329SCO
TABLE 4‐1 NPV Sensitivity Analysis Summary ($ million) SR 710 North Study, Los Angeles County, California
Alternative/ Variation
Base NPV Range
Sensitivity Evaluation
Operating Costs
Tunnel Life
VMT Reduction
Air Quality
Discount Rate Annualization
Value of Time
TSM/TDM 343 Lower 318 343 309 325 223 294 343
Upper 356 343 343 343 343 343 561
Single Bore (Toll) 1524 Lower 1250 1140 1159 1524 428 1298 1524
Upper 1662 1524 1524 1543 1524 1524 3022
Single Bore (Toll, No Trucks) 1477 Lower 1205 1093 1165 1477 397 1258 1477
Upper 1613 1477 1477 1497 1477 1477 2946
Single Bore (Toll, Express Bus) 1590 Lower 1313 1205 1267 1590 466 1355 1590
Upper 1728 1590 1590 1601 1590 1590 3095
Dual Bore (No Toll) 75 Lower ‐391 ‐618 ‐261 75 ‐783 ‐111 75
Upper 308 75 75 92 75 75 1358
Dual Bore (No Toll, No Trucks) 506 Lower 45 ‐188 191 506 ‐533 283 506
Upper 737 506 506 506 506 506 1947
Dual Bore (Toll) ‐37 Lower ‐513 ‐730 ‐328 ‐37 ‐851 ‐222 ‐37
Upper 201 ‐37 ‐37 7 ‐37 ‐37 1410
BRT (ELA to Pasadena) 369 Lower 318 369 332 348 224 316 369
Upper 394 369 369 369 369 369 516
LRT (ELA to Pasadena) ‐869 Lower ‐1110 ‐869 ‐1219 ‐880 ‐853 ‐902 ‐869
Upper ‐749 ‐869 ‐869 ‐869 ‐869 ‐869 ‐813
*Data reported in Table 4‐1 only apply to the SR 710 North Study Alternatives/Variations
4. SENSITIVITY ANALYSIS
TBG070214143329SCO 4-3
EXHIBIT 4‐1 Sensitivity Analysis Summary – Operating Costs SR 710 North Study, Los Angeles County, California
*Data reported in Exhibit 4‐1 only apply to the SR 710 North Study Alternatives/Variations
EXHIBIT 4‐2 Sensitivity Analysis Summary – Tunnel Life SR 710 North Study, Los Angeles County, California
*Data reported in Exhibit 4‐2 only apply to the SR 710 North Study Alternatives/Variations
‐$1,500
‐$1,000
‐$500
$0
$500
$1,000
$1,500
$2,000
TSM/TDM Single BoreToll
Single BoreToll no Trucks
Single BoreToll Exp Bus
Dual Bore NoToll
Dual Bore noToll no Trucks
Dual Bore lowToll
BRT LRT
Net Present Value
Alternative
SR 710 Cost‐Benefit Analysis Sensitivity Analysis ‐ Operating Costs
‐$1,000
‐$500
$0
$500
$1,000
$1,500
$2,000
TSM/TDM Single BoreToll
Single BoreToll no Trucks
Single BoreToll Exp Bus
Dual Bore NoToll
Dual Bore noToll no Trucks
Dual Bore lowToll
BRT LRT
Net Present Value
Alternative
SR 710 Cost‐Benefit Analysis Sensitivity Analysis – Tunnel Life
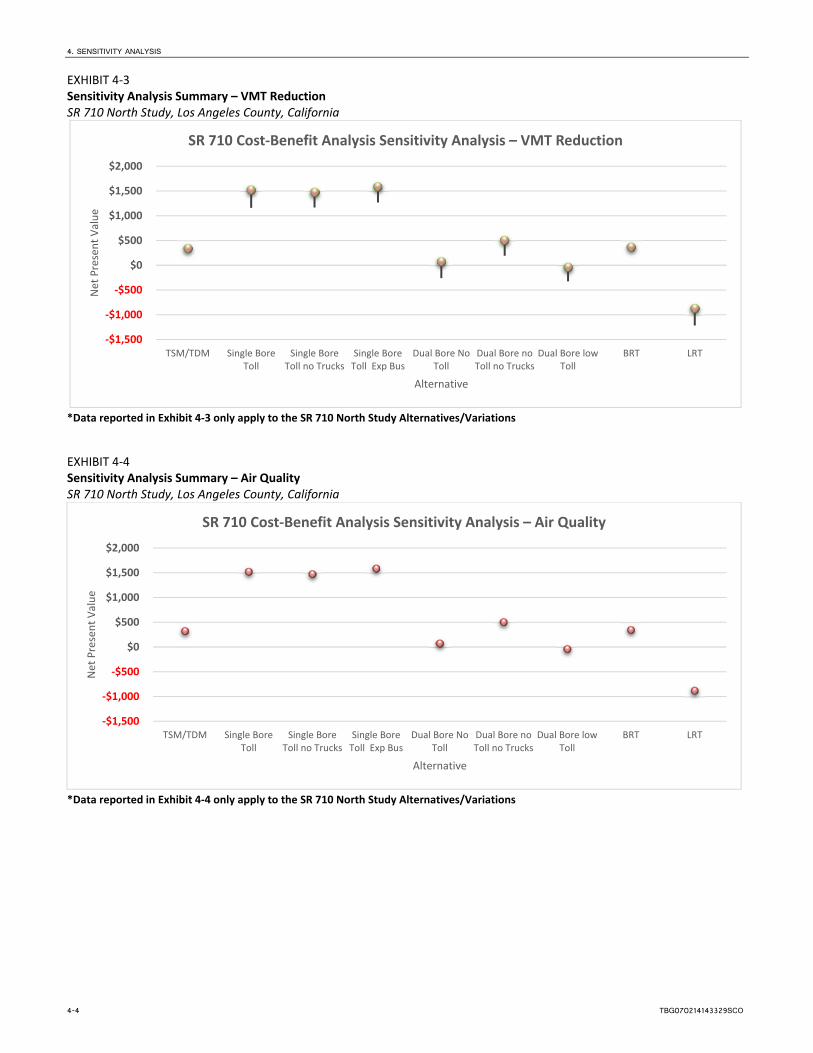
4. SENSITIVITY ANALYSIS
4-4 TBG070214143329SCO
EXHIBIT 4‐3 Sensitivity Analysis Summary – VMT Reduction SR 710 North Study, Los Angeles County, California
*Data reported in Exhibit 4‐3 only apply to the SR 710 North Study Alternatives/Variations
EXHIBIT 4‐4 Sensitivity Analysis Summary – Air Quality SR 710 North Study, Los Angeles County, California
*Data reported in Exhibit 4‐4 only apply to the SR 710 North Study Alternatives/Variations
‐$1,500
‐$1,000
‐$500
$0
$500
$1,000
$1,500
$2,000
TSM/TDM Single BoreToll
Single BoreToll no Trucks
Single BoreToll Exp Bus
Dual Bore NoToll
Dual Bore noToll no Trucks
Dual Bore lowToll
BRT LRT
Net Present Value
Alternative
SR 710 Cost‐Benefit Analysis Sensitivity Analysis – VMT Reduction
‐$1,500
‐$1,000
‐$500
$0
$500
$1,000
$1,500
$2,000
TSM/TDM Single BoreToll
Single BoreToll no Trucks
Single BoreToll Exp Bus
Dual Bore NoToll
Dual Bore noToll no Trucks
Dual Bore lowToll
BRT LRT
Net Present Value
Alternative
SR 710 Cost‐Benefit Analysis Sensitivity Analysis – Air Quality
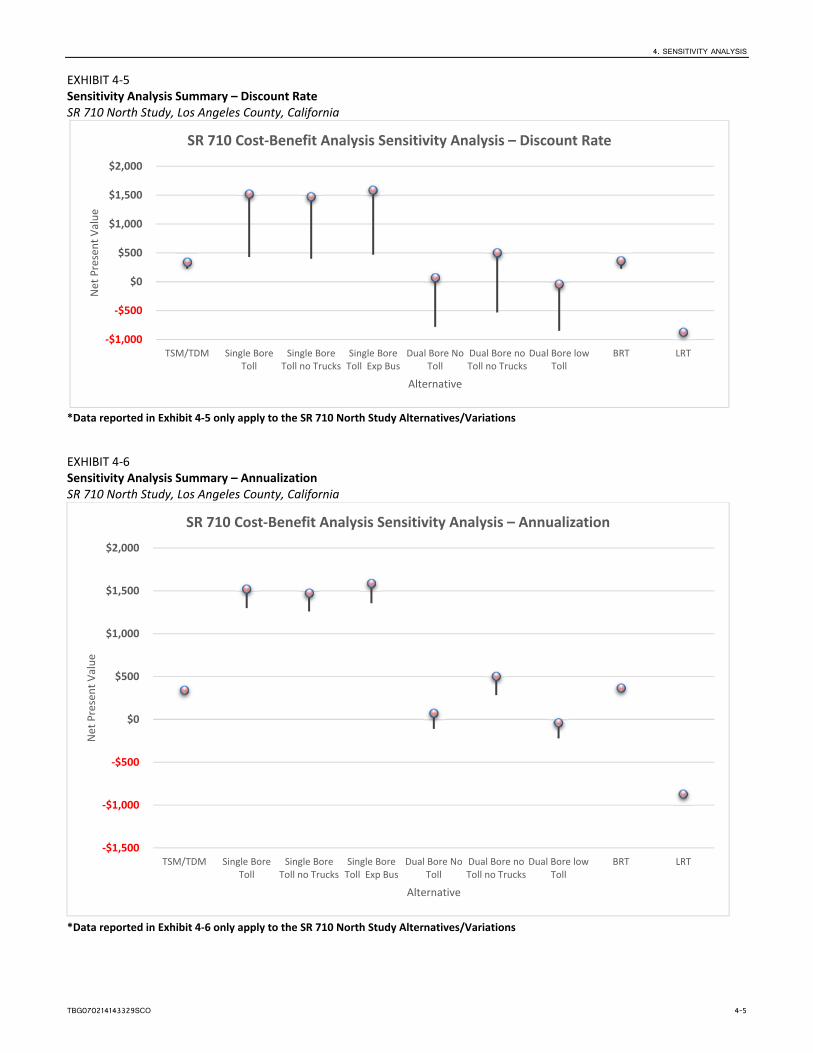
4. SENSITIVITY ANALYSIS
TBG070214143329SCO 4-5
EXHIBIT 4‐5 Sensitivity Analysis Summary – Discount Rate SR 710 North Study, Los Angeles County, California
*Data reported in Exhibit 4‐5 only apply to the SR 710 North Study Alternatives/Variations
EXHIBIT 4‐6 Sensitivity Analysis Summary – Annualization SR 710 North Study, Los Angeles County, California
*Data reported in Exhibit 4‐6 only apply to the SR 710 North Study Alternatives/Variations
‐$1,000
‐$500
$0
$500
$1,000
$1,500
$2,000
TSM/TDM Single BoreToll
Single BoreToll no Trucks
Single BoreToll Exp Bus
Dual Bore NoToll
Dual Bore noToll no Trucks
Dual Bore lowToll
BRT LRT
Net Present Value
Alternative
SR 710 Cost‐Benefit Analysis Sensitivity Analysis – Discount Rate
‐$1,500
‐$1,000
‐$500
$0
$500
$1,000
$1,500
$2,000
TSM/TDM Single BoreToll
Single BoreToll no Trucks
Single BoreToll Exp Bus
Dual Bore NoToll
Dual Bore noToll no Trucks
Dual Bore lowToll
BRT LRT
Net Present Value
Alternative
SR 710 Cost‐Benefit Analysis Sensitivity Analysis – Annualization
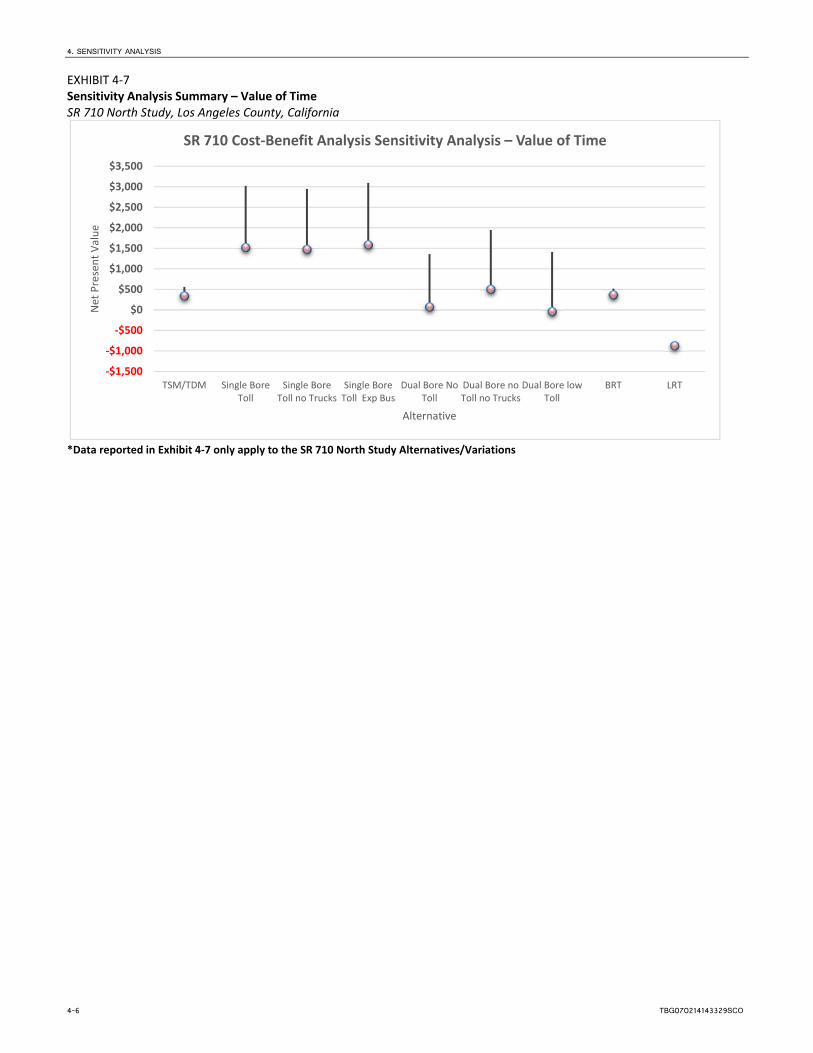
4. SENSITIVITY ANALYSIS
4-6 TBG070214143329SCO
EXHIBIT 4‐7 Sensitivity Analysis Summary – Value of Time SR 710 North Study, Los Angeles County, California
*Data reported in Exhibit 4‐7 only apply to the SR 710 North Study Alternatives/Variations
‐$1,500
‐$1,000
‐$500
$0
$500
$1,000
$1,500
$2,000
$2,500
$3,000
$3,500
TSM/TDM Single BoreToll
Single BoreToll no Trucks
Single BoreToll Exp Bus
Dual Bore NoToll
Dual Bore noToll no Trucks
Dual Bore lowToll
BRT LRT
Net Present Value
Alternative
SR 710 Cost‐Benefit Analysis Sensitivity Analysis – Value of Time