Embed Size (px)
Citation preview
1
COUNTING THE COSTS AND BENEFITS OF RICE FARMING A trade-off analysis among different types of agricultural management
2
List of authors
Anne Bogdanski, FAO
Renee van Dis, FAO
Barbara Gemmill-Herren, FAO
Finbarr Horgan, IRRI
Pieter Rutsaert, IRRI
Buyung Hadi, IRRI
Marie-Soleil Turmel, Bioversity International
Simon Attwood, Bioversity International
Fabrice DeClerck and Rachelle DeClerck, Bioversity International
Recommend citation: Van Dis, R., Attwood, S., Bogdanski, A., DeClerck, F., DeClerck, R., Gemmill-Herren, B., Hadi,
B., Horgan, F., Rutsaert, P., Turmel, M.-S., Garibaldi, L. (2015). Counting the costs and benefits of rice farming. A
trade-off analysis among different types of agricultural management. FAO, unpublished project report for The
Economics of Ecosystems and Biodiversity (TEEB) global initiative for Agriculture and Food.
3
ABSTRACT Rice farming today is faced with several agronomic and environmental challenges related to the intensification
of crop production. At the same time, improved agricultural management practices can lead to or enhance the
different benefits that rice- agroecosystems can provide. This analysis has set out to identify those sustainable
farm management practices that offer the best options to reduce environmental impacts and increase ecosystem
benefits from rice farming. Be it the growth of rice yields and the provision of a diversified diet, the arresting of
soil depletion, the reduction in water use, or the mitigation of climate change – deciding on how to reach these
different management objectives is likely to require the negotiation of trade-offs, but might also offer some
options for synergies. Results of this study are to inform this process.
This research paper feeds into The Economics of Ecosystems and Biodiversity (TEEB) global initiative for
Agriculture and Food on rice production. The TEEB programme is focused on drawing attention to the economic
benefits of biodiversity and ecosystem services including the growing cost of biodiversity loss and ecosystem
degradation. TEEB presents an approach that can help decision-makers recognize, demonstrate and capture the
values of ecosystem services & biodiversity. The initiative has recently set out to assess the agricultural sector in
this regard, in order to demonstrate that the economic environment in which farmers operate is distorted by
significant externalities, both negative and positive, and that there is a lack of awareness of dependency on
natural capital.
At the center of this research are five county studies – Cambodia, Philippines, Senegal, Costa Rica and California.
The study applied a vote-counting analysis to synthesize the results from all five country studies. The final
outcome is a statistical review of primary research, i.e. peer reviewed literature, on the effects of different
agricultural management practices on different environmental, agronomic and ecosystem variables. The analysis
presents the results of about 100 published studies from these five countries/regions that have examined the
effect of at least one treatment comparison on at least one response variable, totaling more than 1500 data
points and 750 interactions. These interactions either show an increase, a decrease or no effect in the strength
or frequency of the interaction.
The vote-counting analysis complements a narrative report developed within this project, and constitutes a
sound basis for the biophysical and monetary valuations conducted for the TEEB Agriculture and Food rice study.
CONTENTS

4
1. Introduction ......................................................................................................................................... 5
2. Assumptions ........................................................................................................................................ 7
3. Methodology ....................................................................................................................................... 9
4. Results & Discussion .......................................................................................................................... 11
Increase in rice yield versus maintenance of water quality .............................................................. 11
A. Irrigated lowlands ..................................................................................................................... 11
B. Rainfed lowlands ....................................................................................................................... 13
Increase in rice yields versus reduction of water use ....................................................................... 14
A. Irrigated lowlands ..................................................................................................................... 14
Increase in rice yields versus reduction of air pollution .................................................................... 17
A. Irrigated lowlands ..................................................................................................................... 17
Increase in rice yields versus reduction of GHG emissions ............................................................... 21
A. Irrigated lowlands ..................................................................................................................... 21
B. Rainfed lowlands ....................................................................................................................... 26
Increase in rice yield versus habitat provisioning ............................................................................. 28
A. Irrigated and rainfed lowlands .................................................................................................. 28
Increase in rice yield versus nutrient cycling and soil fertility .......................................................... 31
A. Irrigated lowlands ..................................................................................................................... 31
B . Rainfed Lowland ....................................................................................................................... 34
C. Rainfed upland .......................................................................................................................... 35
Increase in yield versus preventing pest and disease outbreaks ...................................................... 36
A. Irrigated lowlands ..................................................................................................................... 37
5. Conclusions ........................................................................................................................................ 42
6. References ......................................................................................................................................... 48
5
1. INTRODUCTION Rice farming today is faced with several agronomic and environmental challenges related to the intensification
of crop production. Deceleration in the growth of rice yields, soil depletion, growing water use, increasing water
and air pollution as well as climate change are some of the biggest areas of concern. Tackling them at the same
time is likely to require negotiating trade-offs, and making management decisions that need to be weighted
carefully in order to reduce environmental impact, on the one hand, while maintaining or increasing yields and
contributions to food security on the other (see table 1 for different management objectives).1 This study has
therefore set out to identify those sustainable farm management practices that offer the best options to reach
synergies, and reduce trade-offs among different management objectives.
Table 1. Rice farming management objectives considered in this study
1. Increase rice yields 2. Maintain or increase water quality 3. Reduce water use 4. Reduce air pollution 5. Reduce greenhouse gas emissions 6. Provide habitat for aquatic species to increase food provision and dietary diversity, for wild
biodiversity, ecosystem functioning and space for recreational activities 7. Regulate nutrient cycling and improve soil fertility 8. Prevent or reduce risk of pest and disease outbreaks
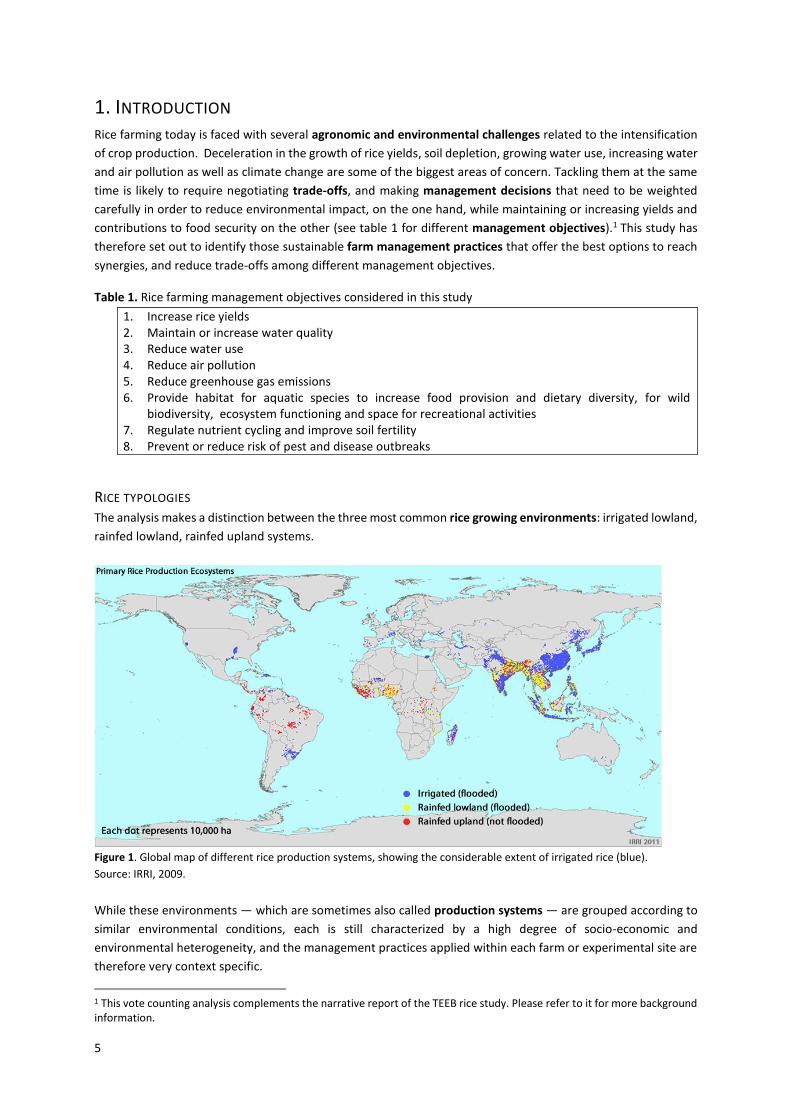
RICE TYPOLOGIES The analysis makes a distinction between the three most common rice growing environments: irrigated lowland,
rainfed lowland, rainfed upland systems.
Figure 1. Global map of different rice production systems, showing the considerable extent of irrigated rice (blue).
Source: IRRI, 2009.
While these environments — which are sometimes also called production systems — are grouped according to
similar environmental conditions, each is still characterized by a high degree of socio-economic and
environmental heterogeneity, and the management practices applied within each farm or experimental site are
therefore very context specific.
1 This vote counting analysis complements the narrative report of the TEEB rice study. Please refer to it for more background information.
6
This study has focused on practices related to rice production. The analysis therefore starts with the pre-planting
phase, continues with the growing phase, and ends with the rice harvesting phase. While each rice growing
environment contains the same practice categories, there are important differences between the three systems
in terms of practices and environmental impacts, which are reflected in this analysis.
A. IRRIGATED LOWLANDS
Irrigated lowland rice constitutes around 75% of rice production yield globally and covers between 55 and 60 %
of the global rice production area (see Fig. 1). Lowland irrigated rice can be highly productive, with the potential
to produce two or three crops per year and yields averaging 4.9 t ha-1 but attaining upwards of 11 t ha-1 for
example in California. Application of water to the crop can depend on a number of factors, including water
sources and availability, water distribution infrastructure and climate. In terms of temporal application, irrigation
water can be used to augment rain sourced water during the rainy season, or can be applied only in the dry
season. A major feature of irrigated rice is that the rice production land is flooded permanently during the
growing phase, or for most of the year.
B. RAINFED LOWLAND
Rainfed lowland rice constitutes around 20 % of global rice production yields and around 30 % of the global rice
production area. Systems lack irrigation and associated water control, and therefore are more prone to both
flooding and drought (Jongdee et al. 2006). In these contexts, productivity is largely determined by the timing,
frequency and amount of rainfall in the system (Saleh and Bhuiyan, 1995). Average yields of rainfed lowland rice
are less than half that of irrigated lowland systems averaging 1.9 t ha-1 (Pandey, in Ladha et al 1998). In addition
to water availability, yields are also determined by topography and soil fertility, and can be highly variable across
small spatial scales (Wade et al 1999). Another constraint on yield is that rainfall seasonality may restrict farmers
to growing only one crop per year (IRRI, 2014).
C. RAINFED UPLAND
Permanent upland rice production is mainly practiced by low-income farmers and is characterized by farming
without bunds on typically sloping terrain. Permanent upland rice produces less than 5 % of global yields on
around 10 % of the global rice production area. In general, this is the lowest yielding rice system with yields
averaging 1.5t ha-1, with drought stress being a major constraint on production (Bernier et al 2008), as an
unbunded field system is entirely dependent on rainfall (Javier 1997). Low yields of upland rice are driving the
development and distribution of drought resistant, high yielding varieties in order to improve upland production
(Atlin et al 2006). Upland rice is the most diverse in terms of varieties, reflecting the wide range of environmental
conditions and soil types under which it is grown, and can be part of a shifting cultivation or permanent
cultivation system (Javier 1997). Shifting rice cultivation often involves intercropping with other crops, such as
maize, cassava, cucumber, watermelon, eggplant and beans (Makara et al 2001). Constraints to upland rice
production are many, including weeds, soil erosion, soil nutrient loss, fungal diseases and pests such as wild
pigeons, pigs and rats (Javier 1997; Makara et al 2001).
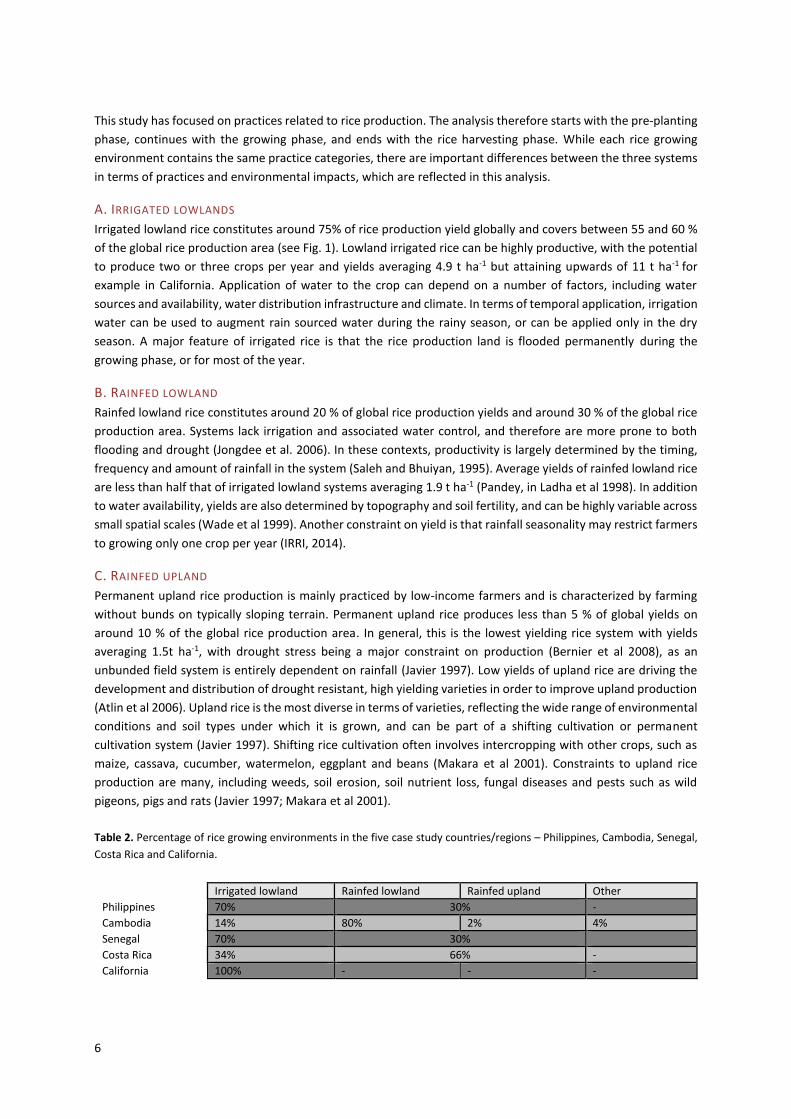
Table 2. Percentage of rice growing environments in the five case study countries/regions – Philippines, Cambodia, Senegal,
Costa Rica and California.
Irrigated lowland Rainfed lowland Rainfed upland Other
Philippines 70% 30% -
Cambodia 14% 80% 2% 4%
Senegal 70% 30%
Costa Rica 34% 66% -
California 100% - - -
7
2. ASSUMPTIONS Our analysis tests various assumptions with regards to the effects of different rice management practices and
systems. While we expect some differences amongst different rice growing environments and contexts, the
assumptions are based on general trends that we expect to verify. We utilize a vote counting approach as further
explained in the methodology section.
Assumption 1: Conventional pest management depends on pesticide use and leads to water contamination and
aquatic habitat degradation. We assume that there will be no effect on rice yield. Alternative pest management
practices, on the other hand, reduce or eliminate water contamination and therefore provide habitat to wild
biodiversity. Cultural practices may include a change of planting time, crop rotations, the introduction of trap
crops, or flooding of rice residues. Genetic means of pest control involves the planting of pest and disease
resistant rice varieties, or varietal mixtures. Biological control is based on the deliberate introduction of natural
enemies (such as parasitoids, spiders or fish) against a specific pest species, or can be based on the management
of habitat within and adjacent to rice production systems as habitat for natural enemies. Integrated Pest
management might combine any of these above in addition to using reduced amounts of pesticides, when
possible. Under these alternate management practices, we expect yields to at minimum remain the same or
increase. Water quality is expected to increase as is habitat provided. Ecological infrastructure builds over time.
Some alternative pest control practices require higher labour inputs than conventional practices.
Assumption 2: Conventional weed management that depends on herbicide use leads to the contamination of
water and at the same time, the degradation of habitat for aquatic biodiversity. Furthermore, the use of
herbicides can destroy the ecological infrastructure (e.g. vegetation structure and composition) of the rice
paddies. Rice yield is likely to increase with decreasing weed competition. Alternative weed management
practices, on the other hand, reduce or eliminate the contamination of water. Mechanical control can include
hand weeding or the use of machinery such as rotary hoes, which depends on labour costs and availability.
Cultural practices may include different spacing of rice crops, transplanting rice seedlings rather than direct
seeding, increasing of soil fertility to strengthen rice crops resilience or planting cover crops. Genetic pest control
involves planting weed tolerant or weed competitive rice varieties. Biological control is less common, but possible
through the deliberate introduction of natural enemies (such as fungi) targeting specific weed species. Integrated
Pest Management (IPM) often combines any of the above, accompanied with reduced herbicides applications,
when necessary. The effect on yields is variable, and depends on the specific weed control practice chosen and
the context. The effect on water quality is increased quality with a similar expectation for, habitat provisioning.
Assumption 3: Conventional water management – continuous flooding – of rice plants through precipitation and
irrigation leads to high water consumption, and eventually to pronounced water scarcity in water scarce areas.
Yields will be high, as well as the natural control of pests and weeds through water inundation. Continuously
flooded systems provide habitat for aquatic biodiversity. GHG emissions, particularly methane increase, while
carbon dioxide emissions are reduced in flooded conditions. Improved water management, such as alternate
wetting and drying (AWD) or the System of Rice Intensification (SRI), can reduce water needs through
intermittent irrigation. Water inputs can be saved, however with likely trade-offs include: pest and weed
suppression by inundation needs to be replaced with chemical pesticide and herbicide alternatives as in the case
of AWD or hand or mechanical weeding in the case of SRI. The former can lead to negative impacts on water
quality; the latter requires additional labour inputs. At the same time, habitat and foraging opportunities for
aquatic biodiversity will degrade, when synthetic pesticides are used, and lost in the absence of flooding. The
impact on yield is variable, but might tend to decline through increased weed competition. Methane emissions
normally decrease, but overall, carbon dioxide emissions increase. The net balance is of reduced emissions with
reduced flooding.

8
Assumption 4: Rice straw is often burnt after harvesting. Farmers use straw burning as a means to eliminate the
weed seedbank and to reduce the incidence of pests and diseases. This leads to environmental impacts such as
air pollution and GHG emissions (CO2), but also to the loss of soil nitrogen. The majority of soil phosphorus and
potassium are retained in the ashes. A principle alternative to rice straw burning is retention or incorporation
into fields. This requires labour and/or flooding to facilitate the decomposition of the silica rich organic material.
While soil fertility is maintained and yield is likely to increase over the long term, there may be a net increase in
GHG emissions (methane) associated with flood driven decomposition. Water quality can likewise decrease if
pesticides and herbicides are used to address pest and weed occurrence which were previously addressed by
burning the fields after harvest.
Assumption 5: Rice straw is often burnt after harvesting. Farmers use straw burning as a means to eliminate the
weed seedbank and to reduce the incidence of pests and diseases. This leads to environmental impacts such as
air pollution and GHG emissions (CO2), but also to the loss of soil nitrogen. The majority of soil phosphorus and
potassium are retained in the ashes. A second alternative to straw burning is baling and rice straw removal. The
removed straw is often used as animal feed, albeit of low nutritional value. Soil fertility is likely to decrease over
time, when nutrients are not replenished through other inputs. Accordingly, yields might decline over the long
term. The extent of GHG emissions will depend strongly on the end us of the rice straw.
Assumption 6: Flooded rice production is a net producer of methane, an important GHG. Flooding when
irrigation is needed leads to high water consumption, and eventually to pronounced water scarcity in water
scarce regions. Yields will be high, and pests and weeds can be controlled through the application of irrigation
water. Continuously flooded systems provide habitat for aquatic biodiversity. While water usage is high, in some
flood based systems, irrigation water is returned to river systems and contributes to environmental flows. On
the other hand, improved water management such as alternate wetting and drying (AWD) or the System of Rice
Intensification (SRI) reduce water needs through intermittent irrigation. Water inputs can be saved, and methane
emissions are decreased, albeit accompanied by increase in nitrous oxide and carbon dioxide emissions. Other
trade-offs are: Pest and weed suppression by water will need to be replaced with other pest and weed
management practices. When chemical control (AWD) is used, this will lead to negative impacts on water quality;
at the same time, habitat for aquatic species and birds will degrade or be lost. Mechanical weeding (SRI) requires
additional labour. The impact on yield is variable, but may tend to decline through increasing weed competition.
Assumption 7: The production and application of synthetic fertilizers contribute considerably to GHG emissions.
While fertilizer use increases yields, it also impacts soil biota and structure. We assume that a reduction in
fertilizer application reduces net emissions. [Though decreased yields also lead to decrease GHG sequestered]
Synthetic fertilizer and organic fertilizer use both contribute to GHG emissions. Yet, the industrial production of
synthetic fertilizers adds further emissions when compared to organic sources.
Assumption 8: Straw burning leads to high GHG emissions. This changes when alternative residue management
options are implemented. When straw is incorporated or rolled into the soil with subsequent flooding, we
assume increased methane emissions. Due to a higher climate forcing of methane compared to carbon dioxide,
there will be a net increase in emissions. The effect on yield is likely to be variable as many other factors
additional to soil organic matter influence the outcome. When straw is baled and removed from the field instead,
GHG emissions are likely to decrease. However, one needs to consider the potential replacement of organic
matter by synthetic fertilizers and the related emissions. While straw removal will not show an immediate effect
on soil fertility and yields, there might be a long term decrease in both. Removed straw is often used as animal
feed, although of low nutritional value.
Assumption 9: The 1996 California rice burning ban prohibits the burning of rice straw after harvest. Flooding
has become the dominate means of rice straw decomposition in the absence of burning. When changing from

9
burning to flooding to decompose residues, habitat for wintering and migrating waterfowl is provided. It leads
to higher water consumption compared to no flooding however, although much of this water is returned to the
Sacramento river and is consider as an environmental flow. Methane emissions increase with this winter
flooding. There has been no reduction in rice yield during this transition.
3. METHODOLOGY The study applied a vote-counting analysis to synthesize the results from all five case study countries. The final
outcome is a statistical review of primary research, i.e. peer reviewed literature, on the effects of different
agricultural management practices on different environmental, agronomic and ecosystem variables.

10
To be more specific, the analysis consists of 28 treatment comparisons between different agricultural
management practices and systems. The treatments differ in their impacts on various agronomic and
environmental variables, which were measured by a total of 43 indicators. These indicators provide specific
information on the state or condition of the following seven categories (i.e. response variables), which all relate
directly or indirectly to the management objectives outlined in the introduction:
1. Rice yield, a provisioning ecosystem service
2. Water pollution (pesticide and herbicide run-off), an environmental impact that results from specific
types of agricultural management
3. Freshwater consumption, an environmental impact that results from specific types of agricultural
management
4. Greenhouse gas emissions, an environmental impact that results from specific types of agricultural
management
5. Biodiversity habitat, a habitat or supporting ecosystem service
6. Nutrient cycling and soil fertility, which can be chemical or biological, the latter being a regulating
ecosystem service
7. Pest control, which can be of chemical, cultural, mechanical, or biological nature, the latter being a
regulating ecosystem service
The analysis presents the results of 65 published studies that have examined the effect of at least one treatment
comparison on at least one response variable, totaling more than 1500 data points and 750 interactions. These
interactions either show an increase, a decrease or no effect in the strength or frequency of the interaction. For
more specific information on how the different treatment comparisons and response variables were grouped
and which assumptions were made, please refer to the Annex (“Vote counting overview”).
Results are given for effect size results and statistically significant results. For the effect size data, we considered
no differences between treatments when those were less than 30 %, i.e. a contrast was classified as an increase
(or decrease) when the treatment augmented (or decreased) the response variable in more than 30 % of the
cases compared to the baseline treatment, otherwise it was classified as no difference. While the minimum
amount of studies necessary for a vote-counting analysis is subjective, the general rule of thumb points to at
least 20 repetitions when analysing agronomic data.
While a vote-counting analysis is a commonly used tool to integrated and summarize data, it is increasingly
criticized by ecologists and experts from other disciplines where vote-counting analysis has been extensively
used (e.g. medicine). For instance, Koricheva and Gurevitch (2013) claim that vote counting analysis has poor
qualities as a statistical procedure because it is not able to provide information on the magnitude of effects. And
indeed, a vote-counting analysis merely provides information on whether an effect increases, decreases or shows
no change. We recognize these limitations and therefore acknowledge that the results of this vote counting
should be taken as indicative only. While further meta-analytical research is needed to fully understand the
tradeoffs among different rice management approaches, we have used this method to obtain a general overview
of how different farm management practices can influence different environmental, agronomic and ecosystem
variables in rice production. This helped to inform the building of the valuation framework and the interpretation
of the valuation results (presented in the final project report).
11
4. RESULTS & DISCUSSION
INCREASE IN RICE YIELD VERSUS MAINTENANCE OF WATER QUALITY
A. IRRIGATED LOWLANDS
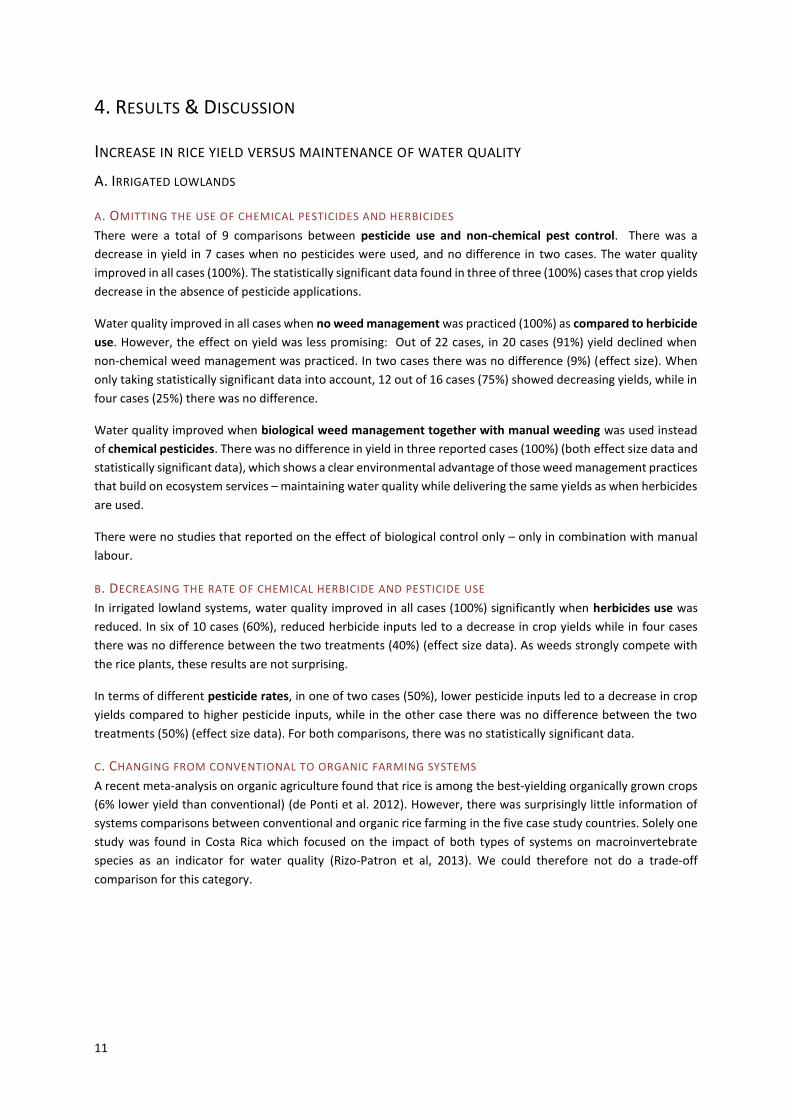
A. OMITTING THE USE OF CHEMICAL PESTICIDES AND HERBICIDES
There were a total of 9 comparisons between pesticide use and non-chemical pest control. There was a
decrease in yield in 7 cases when no pesticides were used, and no difference in two cases. The water quality
improved in all cases (100%). The statistically significant data found in three of three (100%) cases that crop yields
decrease in the absence of pesticide applications.
Water quality improved in all cases when no weed management was practiced (100%) as compared to herbicide
use. However, the effect on yield was less promising: Out of 22 cases, in 20 cases (91%) yield declined when
non-chemical weed management was practiced. In two cases there was no difference (9%) (effect size). When
only taking statistically significant data into account, 12 out of 16 cases (75%) showed decreasing yields, while in
four cases (25%) there was no difference.
Water quality improved when biological weed management together with manual weeding was used instead
of chemical pesticides. There was no difference in yield in three reported cases (100%) (both effect size data and
statistically significant data), which shows a clear environmental advantage of those weed management practices
that build on ecosystem services – maintaining water quality while delivering the same yields as when herbicides
are used.
There were no studies that reported on the effect of biological control only – only in combination with manual
labour.
B. DECREASING THE RATE OF CHEMICAL HERBICIDE AND PESTICIDE USE
In irrigated lowland systems, water quality improved in all cases (100%) significantly when herbicides use was
reduced. In six of 10 cases (60%), reduced herbicide inputs led to a decrease in crop yields while in four cases
there was no difference between the two treatments (40%) (effect size data). As weeds strongly compete with
the rice plants, these results are not surprising.
In terms of different pesticide rates, in one of two cases (50%), lower pesticide inputs led to a decrease in crop
yields compared to higher pesticide inputs, while in the other case there was no difference between the two
treatments (50%) (effect size data). For both comparisons, there was no statistically significant data.
C. CHANGING FROM CONVENTIONAL TO ORGANIC FARMING SYSTEMS
A recent meta-analysis on organic agriculture found that rice is among the best-yielding organically grown crops
(6% lower yield than conventional) (de Ponti et al. 2012). However, there was surprisingly little information of
systems comparisons between conventional and organic rice farming in the five case study countries. Solely one
study was found in Costa Rica which focused on the impact of both types of systems on macroinvertebrate
species as an indicator for water quality (Rizo-Patron et al, 2013). We could therefore not do a trade-off
comparison for this category.

12
Figure 2. Data with significant results and effect size of 30 % is shown for California, Cambodia, Costa Rica, the
Philippines and Senegal in irrigated lowland systems.
13
B. RAINFED LOWLANDS
A. MANUAL WEEDING INSTEAD OF HERBICIDE USE
Water quality improved when manual weeding was used instead of herbicides, as expected. Also yield increased
in one case (50%) and there was no difference in yield in one of the two reported cases (50%) (both effect size
data and statistical significant data). Accordingly, weed control increased in one case (50%) and there was no
difference in weed biomass in one of the two reported cases (50%) (effect size data only). The results of this
treatment comparison are from one study only (Rickman et al., 2001), and therefore cannot be extrapolated.
The study also does not give more details on labour demands related to hand weeding as compared to herbicide
use. One can assume however, that manual weeding takes considerably more time. A study undertaken by
Farmers et al. (2009) found that hand weeding in Cambodian lowland systems takes 10 man days per ha whereas
herbicide application only needs 1 man day per ha.
14
INCREASE IN RICE YIELDS VERSUS REDUCTION OF WATER USE
A. IRRIGATED LOWLANDS
A. ALTERNATE WETTING AND DRYING OR AEROBIC SOILS VERSUS CONVENTIONAL WATER MANAGEMENT
In irrigated lowland systems, improved water management such as alternate wetting and drying (AWD) or
aerobic soils clearly reduced water needs in 53 from 99 cases (54%) compared to continuous flooding, while in
the remaining 46 cases (46%) there was no difference (effect size data). For statistically significant data, 33 out
of 52 cases (63%) reduced water needs, while the remaining 19 (37%) showed no significant difference.
Estimates of the effect on yields vary. Using improved water management practices, yields remained the same,
with 95 out of 123 cases (77%) and decreased in 28 cases (23%) (effect size data). In 64 out of 96 (67%) cases
where statistically significant data is available, yields remained the same, while in 32 cases (33%) yields
decreased. This is mostly due to the aerobic rice systems as a long-term experiment in the Philippines has shown.
Aerobic rice yields were consistently lower than in conventional flooded rice, and yield differences increased
over eight seasons of continuous cropping (Peng et al. 2006). Yield failures, or zero harvest, occur occasionally
and were attributed to ‘soil sickness’: potentially the combined effect of allelopathy, nutrient depletion, buildup
of soil-borne pests and diseases and soil structural degradation (Ventura & Watanabe 1978). Key pathogens
include the Rice Root Knot Nematode (RRKN) (Meloidogyne graminicola), which is known to cause yield declines
ranging from 12 to 80% (Padgham et al. 2004 and others in Kreye et al. 2009). Furthermore, Pythium
arrhenomanes – a plant pathogen - has been isolated from soil following aerobic rice monocropping in the
Philippines and was linked to reduced seedling growth (Van Buyten et al. 2013). Rice in aerobic soils also suffer
from a lower availability of Fe and Mn due to positive redox potential (Kreye et al. 2009) as well as a lower
availability of phosphorus, which is less mobile in unsaturated soils (Kato & Katsura 2014). Despite these issues,
Bouman et al. (2005) indicate that whereas aerobic rice has lower yields than flooded rice, it can attain
appreciably higher water productivity.
As for the other response variables, pest and weed control decreased in 3 out of 4 cases (75%), while the
remaining case showed no difference (25%) (effect size). There were no statistically significant data on this
response variable. Weed control decreased because water represents an efficient control for weeds in rice
cultivation. Most of the water saving technologies therefore have concomitant problems with weeds, which is
likely to lead to increased problems of water contamination and declining water quality if herbicide use is
increased.
The effect on GHG emissions was mixed as explained in more detail in the following section on this topic.
There was no data on habitat provisioning, but evidence from other countries clearly shows effects on this
response variable. For example in Japan, an increase in the area of dry rice fields with high drainage efficiencies
has had a negative impact on wetland birds through reduction in the abundance of prey species (Maeda &
Yoshida 2009 in Amano et al. 2010); the greater painted-snipe (Rostratula benghalensis), ruddy-breasted crake
(Porzana fusca), and common snipe (Gallinago gallinago) have all declined in rice-paddy areas in recent years
(Amado 2006; Amado & Yamaura 2007).
B. SYSTEM OF RICE INTENSIFICATION VERSUS CONVENTIONAL WATER MANAGEMENT
The System of Rice Intensification (SRI) includes intermittent flooding as part of a production package. The
system advises transplanting of young (eight to ten days old) single rice seedlings, with care and spacing, and
applying intermittent irrigation and drainage to maintain soil aeration. In addition the use of a mechanical rotary
hoe or weeder to aerate the soil and control weeds is encouraged. Our analysis found that in irrigated lowland
systems, there was no difference between SRI and conventional systems in 10 out of 13 cases (77%), while in
two cases (15%) there was an increase in water use in SRI and in one case (8%) there was a decrease in water
use (effect size data). There were no statistically significant data on this response variable.
15
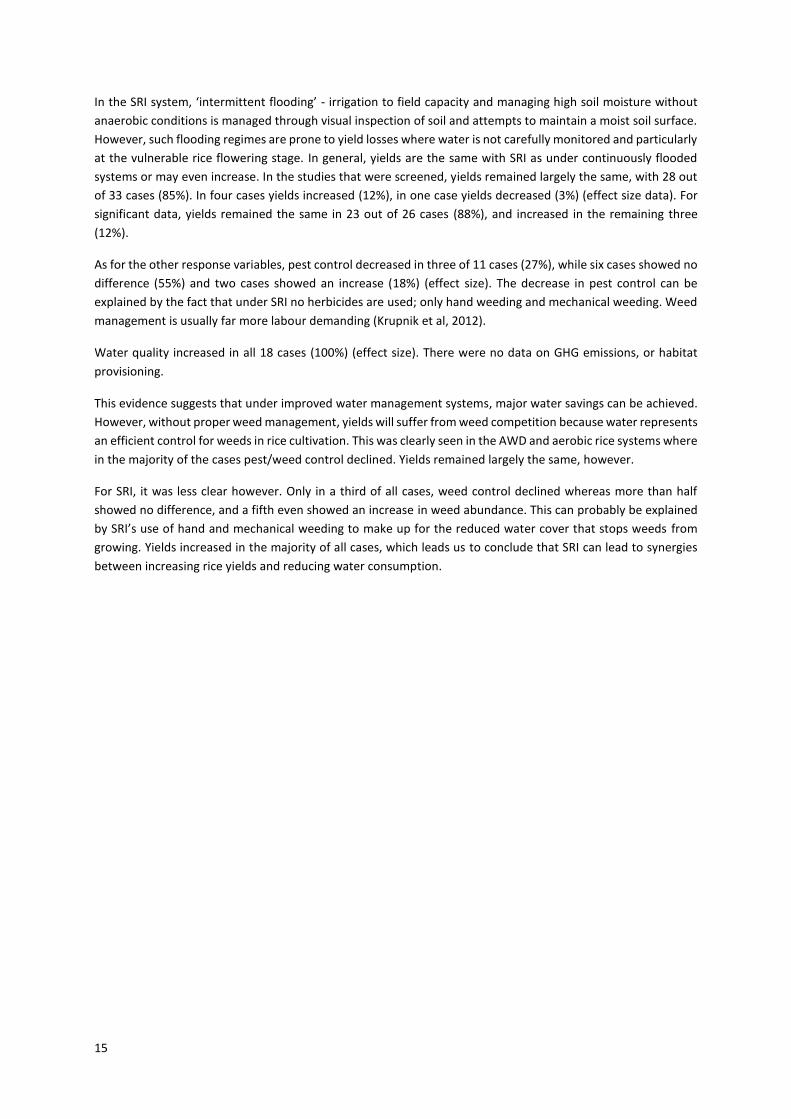
In the SRI system, ‘intermittent flooding’ - irrigation to field capacity and managing high soil moisture without
anaerobic conditions is managed through visual inspection of soil and attempts to maintain a moist soil surface.
However, such flooding regimes are prone to yield losses where water is not carefully monitored and particularly
at the vulnerable rice flowering stage. In general, yields are the same with SRI as under continuously flooded
systems or may even increase. In the studies that were screened, yields remained largely the same, with 28 out
of 33 cases (85%). In four cases yields increased (12%), in one case yields decreased (3%) (effect size data). For
significant data, yields remained the same in 23 out of 26 cases (88%), and increased in the remaining three
(12%).
As for the other response variables, pest control decreased in three of 11 cases (27%), while six cases showed no
difference (55%) and two cases showed an increase (18%) (effect size). The decrease in pest control can be
explained by the fact that under SRI no herbicides are used; only hand weeding and mechanical weeding. Weed
management is usually far more labour demanding (Krupnik et al, 2012).
Water quality increased in all 18 cases (100%) (effect size). There were no data on GHG emissions, or habitat
provisioning.
This evidence suggests that under improved water management systems, major water savings can be achieved.
However, without proper weed management, yields will suffer from weed competition because water represents
an efficient control for weeds in rice cultivation. This was clearly seen in the AWD and aerobic rice systems where
in the majority of the cases pest/weed control declined. Yields remained largely the same, however.
For SRI, it was less clear however. Only in a third of all cases, weed control declined whereas more than half
showed no difference, and a fifth even showed an increase in weed abundance. This can probably be explained
by SRI’s use of hand and mechanical weeding to make up for the reduced water cover that stops weeds from
growing. Yields increased in the majority of all cases, which leads us to conclude that SRI can lead to synergies
between increasing rice yields and reducing water consumption.
16
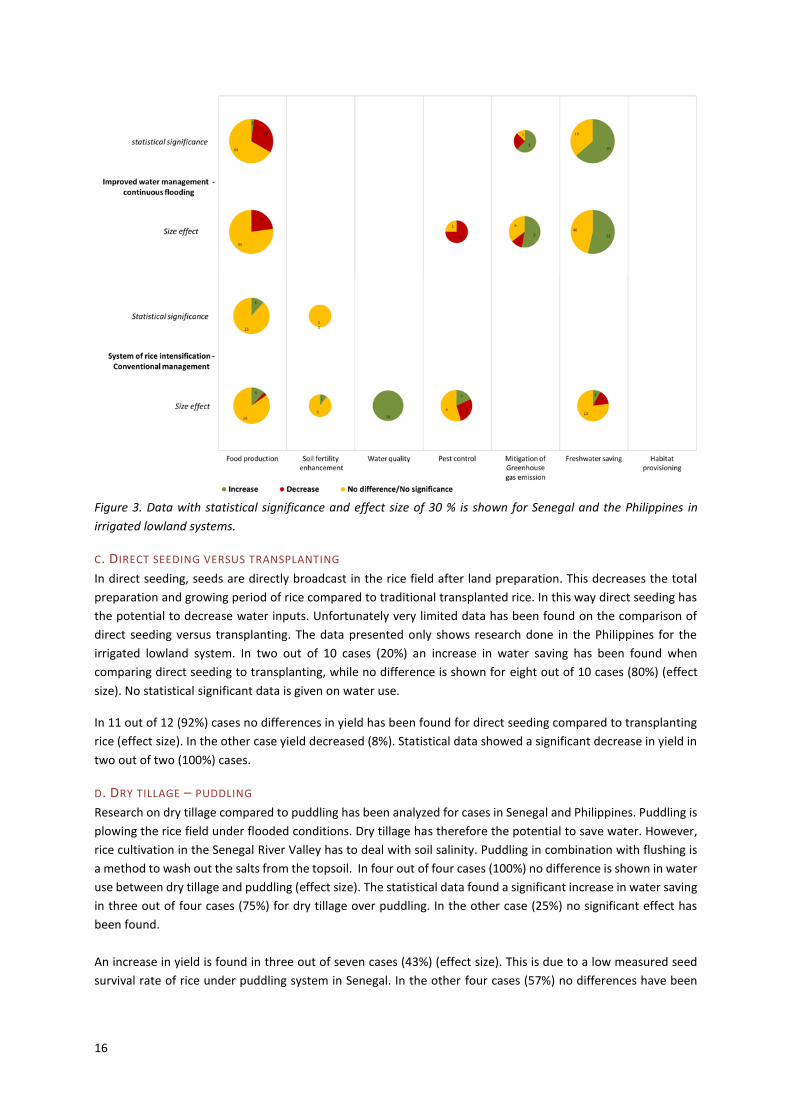
Figure 3. Data with statistical significance and effect size of 30 % is shown for Senegal and the Philippines in
irrigated lowland systems.
C. DIRECT SEEDING VERSUS TRANSPLANTING
In direct seeding, seeds are directly broadcast in the rice field after land preparation. This decreases the total
preparation and growing period of rice compared to traditional transplanted rice. In this way direct seeding has
the potential to decrease water inputs. Unfortunately very limited data has been found on the comparison of
direct seeding versus transplanting. The data presented only shows research done in the Philippines for the
irrigated lowland system. In two out of 10 cases (20%) an increase in water saving has been found when
comparing direct seeding to transplanting, while no difference is shown for eight out of 10 cases (80%) (effect
size). No statistical significant data is given on water use.
In 11 out of 12 (92%) cases no differences in yield has been found for direct seeding compared to transplanting
rice (effect size). In the other case yield decreased (8%). Statistical data showed a significant decrease in yield in
two out of two (100%) cases.
D. DRY TILLAGE – PUDDLING
Research on dry tillage compared to puddling has been analyzed for cases in Senegal and Philippines. Puddling is
plowing the rice field under flooded conditions. Dry tillage has therefore the potential to save water. However,
rice cultivation in the Senegal River Valley has to deal with soil salinity. Puddling in combination with flushing is
a method to wash out the salts from the topsoil. In four out of four cases (100%) no difference is shown in water
use between dry tillage and puddling (effect size). The statistical data found a significant increase in water saving
in three out of four cases (75%) for dry tillage over puddling. In the other case (25%) no significant effect has
been found.
An increase in yield is found in three out of seven cases (43%) (effect size). This is due to a low measured seed
survival rate of rice under puddling system in Senegal. In the other four cases (57%) no differences have been
17
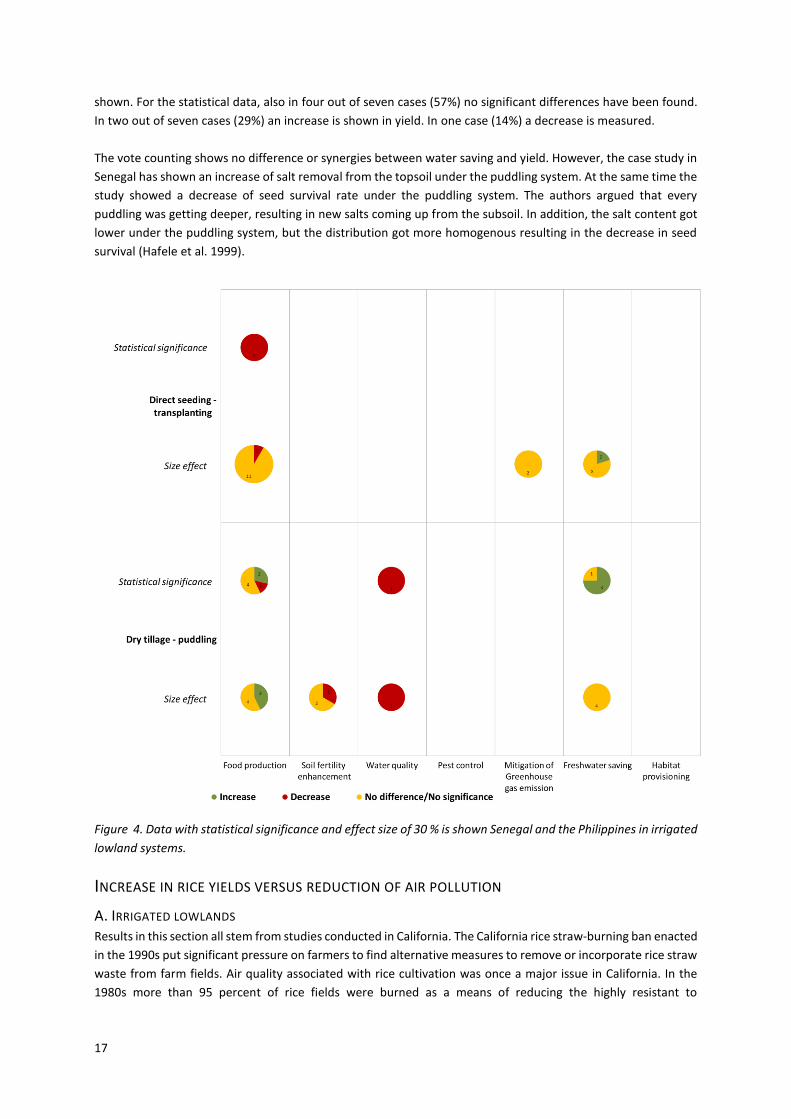
shown. For the statistical data, also in four out of seven cases (57%) no significant differences have been found.
In two out of seven cases (29%) an increase is shown in yield. In one case (14%) a decrease is measured.
The vote counting shows no difference or synergies between water saving and yield. However, the case study in
Senegal has shown an increase of salt removal from the topsoil under the puddling system. At the same time the
study showed a decrease of seed survival rate under the puddling system. The authors argued that every
puddling was getting deeper, resulting in new salts coming up from the subsoil. In addition, the salt content got
lower under the puddling system, but the distribution got more homogenous resulting in the decrease in seed
survival (Hafele et al. 1999).
Figure 4. Data with statistical significance and effect size of 30 % is shown Senegal and the Philippines in irrigated
lowland systems.
INCREASE IN RICE YIELDS VERSUS REDUCTION OF AIR POLLUTION
A. IRRIGATED LOWLANDS Results in this section all stem from studies conducted in California. The California rice straw-burning ban enacted
in the 1990s put significant pressure on farmers to find alternative measures to remove or incorporate rice straw
waste from farm fields. Air quality associated with rice cultivation was once a major issue in California. In the
1980s more than 95 percent of rice fields were burned as a means of reducing the highly resistant to
18
decomposition rice straw; currently 90 percent of rice fields incorporate the straw and use flooding to facilitate
straw decomposition.
There are several alternative management options to burning residues, with effects on several response
variables. All of these lead to clean air, although some still result in GHG emissions as discussed in the next
section. Straw might be rolled with a heavy roller to crush the straw into the soil surface, it might chopped and
then incorporated using a chisel plow or disc, or it can baled and removed. The latter frees the straw - next to
rice grain another provisioning service of rice production – for other potential uses.
A. INCORPORATION, ROLLING OR REMOVAL OF RICE RESIDUES
The majority of California rice is dependent on synthetic fertilizers with application rates on the order of 120-180
kg nitrogen per hectare and 30-80 kg P per hectare. Eagle et al (2000) provide a comprehensive five-year study
of the effect of residue management on yield. When fertilizer is applied at these rates, there is no impact of
residue management on yield. This includes no significant differences between burning, incorporation with and
without flooding, and removal.
Looking at effect size data, in almost all cases, there was no difference between burning and the three alternative
management options in terms of yield, irrespective. Rolling showed no difference in 31 out of 32 cases (97%),
incorporation showed no difference in 28 out of 32 cases (88%), and baling and removal showed no difference
in all cases, 32 out of 32 (100%). For statistically significant data, rolling showed no difference in 12 out of 14
cases (86%), incorporation showed no difference in nine out of 14 cases (64%), and baling and removal showed
no difference in 12 out of 14 (86%). Four cases out of 14 showed reduced yields when straw was incorporated
compared to burning straw (29%).
This means that in the majority of all cases, yield was not affected when alternative crop residue management
practices to rice straw burning were chosen and significant air pollution was avoided – a clear synergistic effect.
However, one needs to carefully look at the other variables in the equation. Synthetic fertilizer application
subsidizes any effect of residue management and yields are on the order of eight to ten tons per hectare. When
no fertilizers are applied, yield is reduced by half, from eight to ten tons ha to four to six tons per hectare. Under
these conditions, incorporated rice straw can bring yields back up to nine tons per hectare after three to four
years of residue incorporation. In this same study however, yields dropped again to five tons per hectare in the
fifth and final year of study year. Long term results beyond the five year mark were not recorded.
But not in all cases did rice incorporation results in increased yields or maintained its status quo. For instance,
Pheng et al (2010) found that application of straw residues actually inhibited rice growth. This may be
attributable to allelopathy, except that similar results were found for both allelopathic and non-allelopathic
materials. In other cases where rice residues have been shown to have a negative yield effect on following crops,
such as wheat, this has been attributed to phytotoxins in the rice residues (e.g. Bacon and Cooper 1985).
The yield of a rice crop is closely linked to soil fertility. For effect size data, soil fertility increased in only 1 out of
four cases (25%) when straw was rolled into the soil, while in the other three cases there was no difference
(75%). When straw was incorporated, in eight of 16 cases, there was no difference in soil fertility (50%), while in
six cases there was a decrease (38%) and in two cases an increase (12%).
For statistically significant data, soil fertility decreased in six out of ten cases (60%), increased in two (20%) and
remained the same in another two cases (20%) when straw was rolled into the soil compared to burning it. When
straw was incorporated, in six of ten cases (60%), there was a decrease in soil fertility, while in three cases (30%)
there was no difference and in one case an increase (10%).
As the results show, there are neutral to positive effects of incorporation into fields regarding soil fertility.
Residues incorporated in the soil increase microbial activity, they help to prevent erosion, positively affect soil
structure and add carbon and organic matter to the soil (Mandal et al, 2004). Incorporating straw for soil nutrition

19
can be an important source of carbon, mineralizable nitrogen, phosphorus and potassium. While burning rice
straw volatilizes most of its N and sulfur, and 75 % of K and 20 % of P are retained in the soil (Eagle et al 2000).
The addition of straw can drive optimum nitrogen fertilization levels down by 20 kg per hectare (Linquist et al.
2006).
In more than half of the cases each of these management interventions also had important negative impacts.
These are especially visible in the first three years after straw incorporation. While rice straw incorporation leaves
the majority of nutrients on site, evidence suggests that it takes three years for this impact to be reflected in
yield increases (see study by Eagle et al 2000 above). Incorporating rice straw into the wet soil results in
temporary immobilization of N (Sander et al 2014; Wassman et al 2000 a,b). This is because the C:N ratio of rice
straw is rather high (>80) and result in higher immobilization which may not make the N available at critical stages
of rice crop growth (Mohanty et al, 2010). An additional factor to consider is the pH of the soil. Van Asten et al
(2005) compared the effect of straw incorporation on rice yields on pH-neutral soils and acid soils. Nitrogen
uptake and the recovery efficiency were found to be higher on acid soils. In general, it needs to be noted that
effects of rice straw addition on soil fertility are poorly studied and - in the case of rice systems in California and
other intensive production areas – are largely overshadowed by the large fertilizer additions made to fields.
Compared to rice straw burning, one expects less nutrients to remain in the field when straw is bailed and
removed, at least for K and P, as compared to a complete removal of all nutrients. The results showed the
opposite however. When straw was bailed and removed, there was no difference in three cases out of four
(75%), while in one case there was an increase in soil fertility (25%) (effect size data). Where statistically
significant data was available, there was no difference in two of four cases (50%), while in two cases (50%) there
was an increase in soil fertility when straw was bailed and removed. The latter result, which is surprising, supports
findings by Dormaar et al. (1997), showing that that burning can actually decrease soil fertility, especially NH4-N
and P.
The results indicate that for both residue burning and many other crop residue management practice soil fertility
decreases – at least in the first three years, albeit at different rates, and lost nutrients need to be replaced by
fertilizers. One can assume that this is likely to have effects on water quality as documented in the water quality
section.
Another impact on water quality may stem from dissolved organic carbon and total dissolved soilds, as
investigated by one study completed by Ruark et al, 2010. When straw was incorporated and flooded, rather
than burned water quality remained the same in six of seven cases, and declined in one case. There was only one
statistically significant result, showing a decrease in water quality when straw was incorporated. The authors
noted that despite a decrease in water quality, water quality remained above standards for drinking water.
According to Truc et al. (2012), farmers practice rice straw burning because they believe that it significantly
reduces pest and disease incidence. By changing from straw burning to other residue management practice, pest
control should therefore decline. This was confirmed by the results of this vote-counting analysis. For both effect
size and statistically significant data, pest control declined in all six cases (100%) when straw was rolled into the
soil. For baling and removing, five out of six cases showed a decline in pest control, while in one case it remained
the same.
When comparing the effect of straw burning and residue incorporation on GHG emissions, GHG emissions
declined in four out of eight (50%) cases when straw was incorporated, and remained the same in the other four
(50%). No statistically significant data for this practice comparison. The results on GHG emissions are discussed
in more depth in the next section.
20
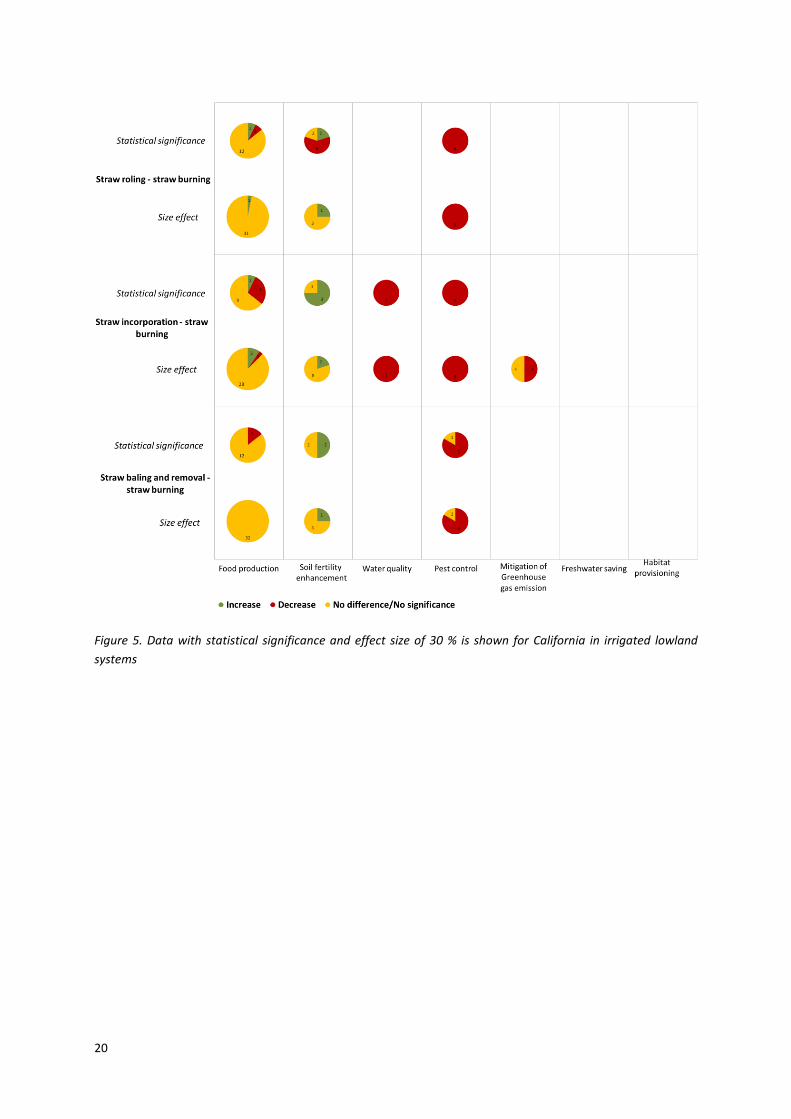
Figure 5. Data with statistical significance and effect size of 30 % is shown for California in irrigated lowland
systems
21
INCREASE IN RICE YIELDS VERSUS REDUCTION OF GHG EMISSIONS
Biological processes and input use on farms generate mostly CH4 and N2O, which are more potent greenhouse
gases per ton than CO2; CH4 is 25 times and N2O is 298 times more potent in carbon equivalent unit (IPCC 2007).
Decisions regarding the reduction of GHG emissions in rice production systems need to assess the different
management options related to rice residue management (i.e. burning versus alternative uses), soil fertility
management, and water management.
While there are no life cycle analyses of GHG emissions for rice available in the five case study countries, global
estimates attribute about 89% of rice global warming potential to CH4, and thus to flooding practices (Linquist et
al., 2012). Therefore, strategies to reduce GHG emissions from rice production need to primarily focus on water
management. However, practices that decrease CH4 emissions usually increase N2O emissions – a reason why
both gases need to be considered at the same time.
Other estimates based on life cycle emissions show different proportions yet still make CH4 emissions from
flooding the largest emitter in rice production. In Egypt, for instance, flooding constitutes 53% of all emissions,
while 36% is due to burning, and 10% due to fertilizer production and application. The remaining 1% relates to
mechanical activities that require the use of fossil fuels (Farag et al., 2013).
While the Egyptian case was calculated for lowland irrigated production systems, the situation in Ghana looks
very different. Ghana produces mostly in rainfed upland systems, in which rice is not produced in standing water.
Methane emissions are therefore less of an issue. Eshun et al. (2012) attribute most GHG emissions to fertilizer
application (72%), followed by emissions from transportation of rice to the mill (10%) and land preparation (7%),
harvesting (6%) and planting (5%). Although not explicitly stated, the authors assumed that rice residue burning
is not practiced in the country.
In addition to rice production being a major emitter of GHGs, rice systems also sequester carbon via soil organic
carbon in top soil (Minasny et al 2012). A number of management practices can be used to increase the capacity
of rice systems to sequester carbon. Results of the effect of different practices are very heterogeneous however.
Some studies have shown that no-tillage as compared to conventional tillage increases the storage of carbon in
the soil (e.g. Ghimire et al 2012), other report no difference (e.g. Rui & Zang 2009). Crop residue additions and
animal manure application were found to increase soil organic carbon, albeit only in the long term (e.g. Rui &
Zang 2009).
Most results from the five case study countries are from irrigated lowland systems and only a few have been
collected in rainfed lowlands systems. There have been none conducted in rainfed upland systems.
A. IRRIGATED LOWLANDS
A. ALTERNATE WETTING AND DRYING (AWD) OR AEROBIC SOILS VERSUS CONVENTIONAL WATER
MANAGEMENT
Under alternate wetting and drying (AWD) fields are flooded and the water is left to evaporate and to infiltrate
the soil until a critical level. Under aerobic soils, also known as aerobic monocultures, the crop is usually dry
direct seeded and soils are kept aerobic throughout the growing season. Supplementary irrigation is applied as
necessary and adapted rice cultivars that are responsive to fertilizers and with higher yield potential than upland
rice varieties are used (Kreye et al. 2009). When considering both of these improved water management
practices together, more than half of all cases led to reduced GHG emissions - in nine out of 17 cases (53%), while
in six cases (35%) there was no difference, and in two cases (12%) GHG emissions increased (effect size). Where
statistical data is available, five of nine cases (56%) showed a reduction in GHG emissions, one showed no
difference (11%) and two (33%) showed an increase in GHG emissions.
22
While AWD is a good management practice to reduce water consumption, it might not be the best option for
GHG emissions reductions however. Ortiz-Monasterio et al (2010) showed that field drainage at mid-tillering and
14 days before harvest (termed dual drainage) reduced methane emissions to between 15 and 80% of that in
found in continuously flooded fields (Wassman et al 2000). A study conducted in Central Luzon, the central rice
production area of the Philippines, showed that mid-season drainage reduced methane emission significantly
during the dry season compared to flooded controls (Corton et al 2000). In the wet season, heavy rainfalls may
keep fields from drying and thus offset the potential of mid-season drainage to reduce methane emissions
(Corton et al 2000, Wassmann et al 2000).
Estimates on the effect on yields vary. Using improved water management practices, yields remained the same
in 95 of 123 cases (77%) and decreased in 28 cases (23%) (effect size data). In cases with statistical data, 64 of
96 (67%) cases, yields remained the same, while in 32 cases (33%) yields decreased. This is mostly due the case
in aerobic rice systems as was demonstrated in a long-term experiment in the Philippines. Aerobic rice yields
were consistently lower than in conventional, flooded rice, and yield differences increased over eight seasons of
continuous cropping (Peng et al. 2006). Yield failures, or zero harvest, occur occasionally and were attributed to
‘soil sickness’: potentially the combined effect of allelopathy, nutrient depletion, buildup of soil-borne pests and
diseases and soil structural degradation (Ventura & Watanabe 1978). Key pathogens include the Rice Root Knot
Nematode (RRKN) (Meloidogyne graminicola), which is known to cause yield declines ranging from 12 to 80%
(Padgham et al. 2004 and others in Kreye et al. 2009). Furthermore, Pythium arrhenomanes has been isolated
from soil following aerobic rice monocropping in the Philippines and was linked to reduced seedling growth (Van
Buyten et al. 2013). Rice in aerobic soils also suffers from a lower availability of Fe and Mn due to positive redox
potential (Kreye et al. 2009) as well as a lower availability of phosphorus, which is less mobile in unsaturated soils
(Kato & Katsura 2014).
As for the other response variables, improved water management practices reduced water needs in 53 from 99
cases (54%), while in the remaining 46 cases (46%) there was no difference (effect size data). Where we found
statistically significant data, 33 of 52 cases (63%) demonstrated a reduced water need, while the remaining 19
(37%) showed no significant difference. This has been discussed in length in the water consumption section.
As for other response variables, pest and weed control decreased in three of four cases (75%), while the
remaining case showed no difference (25%) (effect size data). There were no studies with statistically significant
data on this response variable. Weed control decreased because water represents an efficient control for weeds
in rice cultivation. Most of the water saving technologies have therefore concomitant problems with weeds,
which is likely to lead to increased problems of water contamination and declining water quality because of
increased herbicide use.
B. RICE STRAW BURNING COMPARED TO ALTERNATIVE RESIDUE MANAGEMENT PRACTICES
The CO2 emitted through straw burning has less impact on climate change than the CH4 emissions from rice
cultivation (McCarty 2011) since CH4 has 21 to 34 times the Global Warming Potential (GWP) of CO2.
Data on GHG emissions from different residue management practices were very scarce. When comparing straw
incorporation with burning, GHG emissions declined in four out of eight (50%) cases when straw was
incorporated, and remained the same as in the case of burning in the other four (50%). No statistically significant
data are available for this practice comparison.
Straw rolling or straw removal versus burning did not yield any effect size or statistically significant data.
As for yields, looking at effect size data, in almost all cases, there was no difference between burning and the
three alternative management options in terms of yield. Rolling showed no difference in 31 out of 32 cases (97%),
incorporation showed no difference in 28 out of 32 cases (88%), and baling and removal showed no difference
in all 32 cases (100%).

23
For statistically significant data, rolling showed no difference in 12 of 14 cases (86%), incorporation showed no
difference in nine of 14 cases (64%), and baling and removal showed no difference in most cases, 12 out of 14
(86%). Four cases out of 14 showed reduced yields when straw was incorporated compared to burning it (29%).
Beyond yields and GHG emissions, these practices also had effects on the other response variables and led to
additional trade-offs. Soil fertility increased in only one of four cases (25%) when straw was rolled into the soil,
while in the other three cases there was no difference (75%) observed. When straw was incorporated, in eight
of 16 cases, there was no difference in soil fertility (50%), while in six cases there was a decrease (38%) and in
two cases an increase (12%). When straw was bailed and removed, there was no difference in three cases out of
four (75%), while in one case there was an increase in soil fertility (25%) (effect size data).
For statistically significant data, soil fertility decreased in six out of ten cases (60%), increased in two (20%) and
remained the same in another two cases (20%) when straw was rolled into the soil. When straw was
incorporated, in six of ten cases (60%), there was a decrease in soil fertility, while in three cases (30%) there was
no difference and in one case an increase (10%). When straw was bailed and removed, there was no difference
in two cases out of four (50%), while in two cases (50%) there was an increase in soil fertility.
For effect size data, water quality remained the same in six out of seven cases when straw was incorporated, and
declined in one case. For the other treatments there was no effect size data.
For statistically significant data, there was only one result, showing a decrease in water quality when straw was
incorporated.
For both effect size and statistically significant data, pest control declined equally in all six cases (100%) when
straw was rolled into the soil. For baling and removing, five out of six cases showed a decline in pest control,
while in one case it remained the same.
C. DIFFERENT FERTILIZER REGIMES
Soil nitrogen additions can increase both the food production potential and the climate change impact of rice
production. In addition to the global warming potential of synthesizing nitrogen fertilizers, increased net primary
productivity of crop and weed biomass impacts the amount of carbon stored in dry cultivation systems, and the
amount of methane produced in flooded systems.
Reducing the rate of synthetic fertilizer application showed no difference in terms of GHG emissions when
compared to the standard rate of fertilization in all four cases (100%) (effect size data). There was no statistically
significant data. Adviento-Borbe et al (2013) provided a comprehensive analysis of the impact of nitrogen
fertilization in drill seeded systems and concluded that while N fertilizer rate applications are correlated with
methane production in flooded systems, fertilizer N rate had no significant effect on global warming potential
when application rates were on the order of 160-200 kg per hectare. However, the global warming potential
increased above the 200 kg N/ha application rate.
The same study by Adviento-Borbe et al (2013) showed a sharp yield increase (four tons per hectare to eight tons
per hectare) as N was added from 0 kg to 140 kg per hectare. There were no changes in yield above 140 kg N
however. This explains the results of the vote counting analysis which is mainly based on this study: As for
statistically significant data, in 20 out of 28 cases, there was no difference in yields between the two treatments
(71%) (reducing mineral fertilizer rates), while in eight cases there was a decrease in yield (29%) with decreased
application rates. For effect size data, in 13 of 28 cases yields decreased with decreased fertilizer application
rates (46%), in 12 cases there was no difference (43%) and in three cases there was an increase in yields (11%).
The authors conclude that achieving the highest productivity is not at the cost of higher global warming potential
because of the disassociation between yield and increased fertilizer application above the 140 kg per hectare
level. Similar results were found by Pittelkow et al. (2013) who conclude that fertilizer applications rates above
140 kg per hectare have an insignificant impact on yield (12-13 Mg per hectare), but a disproportionate impact
24
on global warming (>108 kg CH4-C and 620 kg N2O-N per hectare). The results of this study suggest that optimal
N rates can produce maximum yields while reducing annual yield- scaled GWP by 46 to 52 %.
When comparing the difference between synthetic fertilizer alone with a mix of organic and mineral fertilizer,
there were 19 out of 26 cases that showed no difference in emissions (73%). In seven cases, however, GHG
emissions increased and the mitigation potential was reduced when combining mineral and organic fertilizer
(27%) (effect size data). There were no statistically significant data.
As for yields, there was no difference in yield between the two treatments in all 25 cases for effect size data
(100%). For statistically significant data, there was no difference in 13 out 15 cases (87%), and a reduction in yield
when a mix of organic and mineral fertilizer was applied in two cases (13%).
As for other response variables, soil fertility was increased in two out of six cases when fertilizers were mixed
(33%), and showed no difference in the remaining four cases (67%) (effect size data). For statistically significant
data, there was no difference in three cases (75%) and a decrease in one case (25%).
Water quality remained the same in nine out of ten cases (90%). In one case it increased when fertilizers were
mixed (10%) (effect size and statistically significant data).
None of the studies included GHG emissions from fertilizer production.
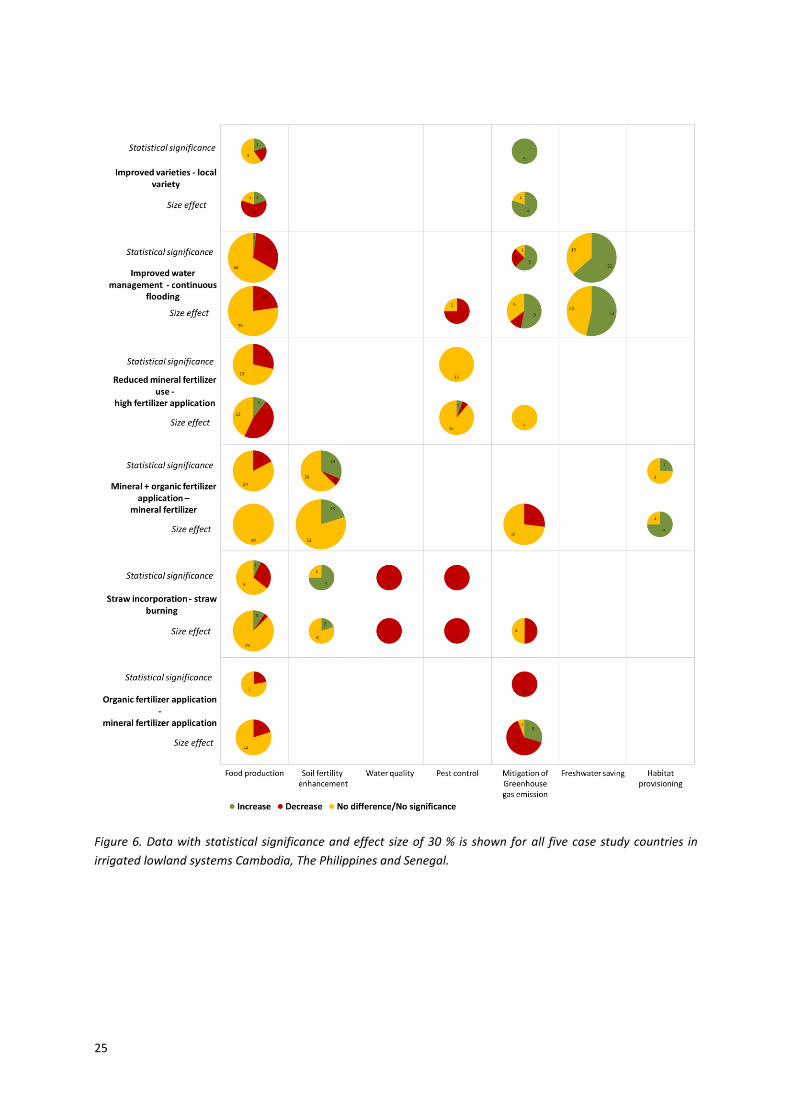
D. IMPROVED RICE VARIETIES
A study by Wassmann et al (2000) in the Philippines showed a comparison of improved rice varieties with the
local rice variety IR 72. They measured whether CH4 emissions were affected by cultivar. The improved rice
varieties showed a reduction in GHG emissions compared to the local variety in 4 out of 5 cases (80%) for the
effect size data. In 1 out of 5 cases (20%) no difference in CH4 emissions was found. In 5 out of 5 cases (100%) a
statistical significant reduction in GHG emissions have been found. Although the local variety gave the highest
CH4 emissions, the authors could not determine a specific plant trait that causes the higher emission potential.
Plant parameters were statistically analyzed for two growing seasons and Wassmann et al (2000) noted that
“about 86% in the change of cumulative emission (EMcum) was explained by the combined effect of plant height
(PHT), tiller number (TNO), root length (RLT), root weight (RWT), and biomass (BIO)”.
Although GHG emissions might reduce when cultivating the improved rice varieties, yields reduce as well in 3 out
5 cases (60%) (size effect). In 1 case (20%) yield increases and in 1 case (20%) yield shows no difference. For the
statistical data, yield shows a significant reduction in 1 out of 5 cases (20%). In 1 case (20%) there is a significant
increase and in 3 out of 5 cases (60%) there is no significant difference between improved rice varieties and the
local variety.
25
Figure 6. Data with statistical significance and effect size of 30 % is shown for all five case study countries in
irrigated lowland systems Cambodia, The Philippines and Senegal.
26
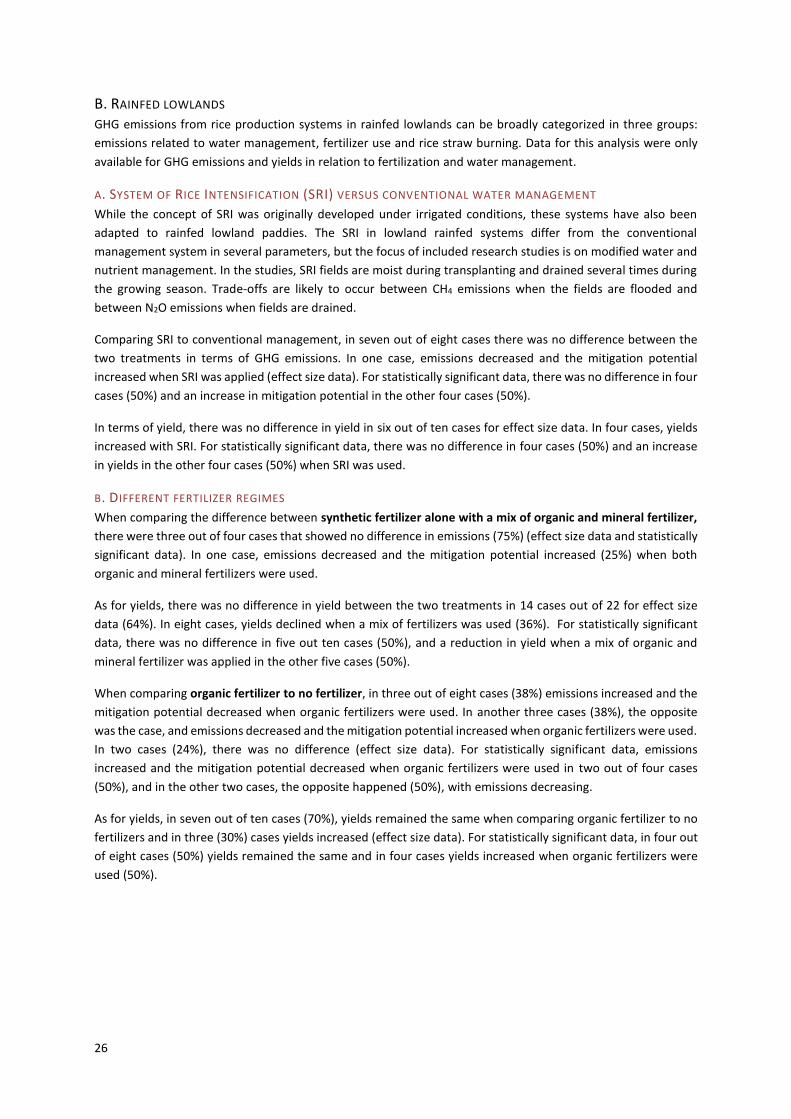
B. RAINFED LOWLANDS GHG emissions from rice production systems in rainfed lowlands can be broadly categorized in three groups:
emissions related to water management, fertilizer use and rice straw burning. Data for this analysis were only
available for GHG emissions and yields in relation to fertilization and water management.
A. SYSTEM OF RICE INTENSIFICATION (SRI) VERSUS CONVENTIONAL WATER MANAGEMENT
While the concept of SRI was originally developed under irrigated conditions, these systems have also been
adapted to rainfed lowland paddies. The SRI in lowland rainfed systems differ from the conventional
management system in several parameters, but the focus of included research studies is on modified water and
nutrient management. In the studies, SRI fields are moist during transplanting and drained several times during
the growing season. Trade-offs are likely to occur between CH4 emissions when the fields are flooded and
between N2O emissions when fields are drained.
Comparing SRI to conventional management, in seven out of eight cases there was no difference between the
two treatments in terms of GHG emissions. In one case, emissions decreased and the mitigation potential
increased when SRI was applied (effect size data). For statistically significant data, there was no difference in four
cases (50%) and an increase in mitigation potential in the other four cases (50%).
In terms of yield, there was no difference in yield in six out of ten cases for effect size data. In four cases, yields
increased with SRI. For statistically significant data, there was no difference in four cases (50%) and an increase
in yields in the other four cases (50%) when SRI was used.
B. DIFFERENT FERTILIZER REGIMES
When comparing the difference between synthetic fertilizer alone with a mix of organic and mineral fertilizer,
there were three out of four cases that showed no difference in emissions (75%) (effect size data and statistically
significant data). In one case, emissions decreased and the mitigation potential increased (25%) when both
organic and mineral fertilizers were used.
As for yields, there was no difference in yield between the two treatments in 14 cases out of 22 for effect size
data (64%). In eight cases, yields declined when a mix of fertilizers was used (36%). For statistically significant
data, there was no difference in five out ten cases (50%), and a reduction in yield when a mix of organic and
mineral fertilizer was applied in the other five cases (50%).
When comparing organic fertilizer to no fertilizer, in three out of eight cases (38%) emissions increased and the
mitigation potential decreased when organic fertilizers were used. In another three cases (38%), the opposite
was the case, and emissions decreased and the mitigation potential increased when organic fertilizers were used.
In two cases (24%), there was no difference (effect size data). For statistically significant data, emissions
increased and the mitigation potential decreased when organic fertilizers were used in two out of four cases
(50%), and in the other two cases, the opposite happened (50%), with emissions decreasing.
As for yields, in seven out of ten cases (70%), yields remained the same when comparing organic fertilizer to no
fertilizers and in three (30%) cases yields increased (effect size data). For statistically significant data, in four out
of eight cases (50%) yields remained the same and in four cases yields increased when organic fertilizers were
used (50%).
27
Figure 7. Data with statistical significance and effect size of 30 % is shown for all five case study countries in
rainfed lowland systems in Cambodia, The Philippines and Senegal.
28
INCREASE IN RICE YIELD VERSUS HABITAT PROVISIONING
Over 90 percent of the world’s rice is grown under flooded conditions, providing habitat not solely for the crop
alone but also for wide range of aquatic and other organisms (Halwart & Gupta 2004). Rice-fish farming is
practiced in many countries in the world, particularly in Asia where consumption is largely dependent on rice as
the staple crop and fish (inclusive of fin-fish and crustaceans) as the main source of animal protein. In these
countries, food security and prosperity long have been associated with the availability and diversity of both rice
and fish. The rice and fish production systems on which these societies depend are quite varied and greatly
influenced by seasonal rainfall and flood inundation patterns, particularly in river floodplains and deltaic
lowlands. Many traditional systems in Asia are based on concurrent cultivation of rice and fish, whereas other
systems alternate between rice cultivation in one season and fish culturing in the other.
Fish in rice-fish systems does not refer only to fin-fish; it includes the wide variety of aquatic animals living in rice
fields: shrimp, crayfish, crabs, turtles, bivalves, frogs, and even insects. Farmers may also allow aquatic weeds,
which they harvest for food (Datta & Banerjee 1978). Surveys in Cambodia, for example, have documented the
harvest of over ninety different organisms from rice paddies and used daily by rural households (Balzer et al.
2002; Halwart and Gupta 2004). These wild and gathered foods from the aquatic habitat provide important
diversity, nutrition and food security, as food resources from rice-field environments which supply essential
nutrients that are otherwise not adequately found in diets (Hunter et al. 2015).Nutrients such as Vitamin A, B,
calcium, iron or zinc, or different amino acids which are often lacking in the diet of rural people could be supplied
by rice agro-ecosystems and their aquatic biodiversity (Burlingame et al 2006). Many rural households depend
on monotonous diets that are too high in carbohydrates and too low in animal source foods and micronutrient-
rich fruits, fish and vegetables. Access to a diversified diet is often constrained by lack of purchasing power,
limited expertise and limited availability. Experience has shown that more diversified farming systems that
contain horticultural or aqua cultural components are one way to improve households’ availability and access to
such animal source foods, fruits and vegetables.
It is also important to acknowledge that rice agro-ecosystems not only differ in terms of species diversity, but
also regarding genetic diversity of rice itself. Evidence has shown that individual cultivars, strains and breeds of
the same (rice) species do have significantly different nutrient contents (Kennedy and Burlingame 2003). In fact,
there are thousands of different rice varieties, some of which have been around for centuries while others are
new hybrids bred to increase rice yields or reduce the susceptibility to rice pests.
A. IRRIGATED AND RAINFED LOWLANDS
A. PESTICIDE FREE RICE PRODUCTION
There was no peer-reviewed study in the case five study countries that quantified the differences between those
rice systems that use agro-chemicals and those that do not in terms of habitat provisioning and yield increases
at the same time. Studies that only looked at habitat impacts showed clear results, however. For example, Mullie
et al (1991) studied the toxicity of irrigation water after Carbofuran application (which used to control rice stem
borers) on aquatic organisms in Senegal. They found a significant decrease of aquatic macro invertebrates after
Carbofuran application, meaning that Carbofuran is highly toxic for non-target species. Parsons et al (2010)
conducted research on the effect of different pesticides on birds in rice fields on a global scale and concluded
that various pesticides are highly toxic for birds. Pesticides in waterways can be widespread and besides the
direct effects, several indirect effects are reported (e.g. reduced prey).
Furthermore, some literature sources document the importance of habitat provisioning for rice-fish farming as
a crucial livelihood activity for Asian rice farmers. A recent literature review (Griffith, 2015, unpublished) on
ecosystem services provided by aquatic organisms in global rice production systems lists more than 30 papers
that have assigned a value to the provision of food by aquatic organisms in rice fields.
29
For example, in Cambodia, de Silva et al. (2013) point out that fishing and foraging are a crucial source for food
and seasonal income for parts of the year. In addition to vegetables, rice fields provide 50 to 250 kg of fish and
other aquatic animals per family and year, with a value of about 100 to 150 USD per hectare (Hortle et al. 2008).
Often these are the primary sources of protein for rural rice farming communities, and therefore of immense
nutritional value - not just for the rice farmers alone, but also for landless members of the community.
Beyond the provision of food and income, aquatic species also provide important (biological) pest control
services. Naturally occurring frogs or toads, or carnivorous fish keep rice pests at a low level. A study conducted
in China reported 68% fewer expenses for pesticides and 24% less chemical fertilizer application when rice-fish
culture was practiced as compared to monocultures (Xie et al. 2011).
A study completed in Laos examined the use of aquatic organisms in rice fields and identified their roles in
household economy (Yamada et al., 2004). The average amount of biological resources sold was the highest in
the mountain villages, US$ 85 year-1 household-1, followed by the hillside villages at USD 41/year/household, and
lowland villages at US$ 23/year-1 household-1. These amounts represent 53, 27 and 18 % of total household cash
income, respectively.
This and other studies have shown that the income from aquatic organisms can significantly complement, if not
double, the revenue from rice farming. A study by Muthmainnah (2015) showed that the income from aquatic
organisms in rice paddies was indeed more than that of rice farming only (1100 US$ per local community as
compared to 800 US$ per local community).
Beyond the direct benefit of increasing the farmers’ income through the cultivation of aquatic species, there are
also seems to be an indirect benefit through the increase of rice yields. Halwart and Gupta (2004) analyzed data
from five different countries from Asia, including the Philippines, and found that in 80% of the cases, the
introduction of fish led to higher yields (by at least 2.5 %) than without fish. The authors explain this increase by
a decreased likelihood of weeds and stemborers which inevitably leads to healthier rice plants.
B. WINTER FLOODING
Studies from California documented the different effect of winter flooding versus no flooding on the provision
of habitat to aquatic water fowl with its concomitant benefits for recreational activities such as hunting (i.e.
cultural ecosystem services). There was no difference in yield between winter flooded and non-flooded fields in
57 of 58 cases (98%) (effect size). In one case (2%), there was a yield increase in flooded fields. For statistically
significant data, there was an increase in yields when fields were flooded in 5 out of 6 cases (83%). In the
remaining case, there was no difference (17%).
For effect size data, habitat decreased in six out of 33 cases when fields were flooded (18%). In nine cases there
was no difference (24%). In 18 cases (58%), habitat provisioning increased when fields were flooded. For
statistically significant data, habitat increased in nine out of 35 cases (26%) when fields were flooded. In 19 cases
there was no difference (54%). In seven cases (20%), habitat provisioning decreased when field were flooded.

30
Figure 8. Data with statistical significance and effect size of 30 % is shown for California in irrigated lowland
systems.
31
INCREASE IN RICE YIELD VERSUS NUTRIENT CYCLING AND SOIL FERTILITY
“An adequate and balanced supply of elements necessary for life, provided through the ecological processes of
nutrient cycling underpins all other ecosystem services” (Millenium Assessment, 2005, p. 333)
Agricultural management impacts nutrient cycling and soil fertility leading to either nutrient excess or nutrient
deficiencies. Especially the cycles of four key elements Nitrogen (N), Phosphorus (P), Sulfur (S) and Carbon (C)
have been strongly affected through human interventions. Nutrient excess can have detrimental impacts on soils
or waterways, when high nutrient loads lead to eutrophication or GHG emissions. This section is therefore closely
linked to section 1 on water quality and section 4 on GHG emissions.
While the increased production and use of N has led to increased yields, there has been an increase in GHG
emissions and an increase in water and soil pollution. A global study estimates N-input in croplands at 169 Tg N
per year. Synthetic fertilizer, biological N fixation through N fixing crops, atmospheric deposition, animal manure
and crop residues account for 46%, 20%, 12%, 11% and 7% respectively (Smil 1999). While synthetic N fertilizer
has led to significant yield increases in the past, much of the N is lost to the environment via denitrification, NH3
volatilization, surface runoff and leaching (Raun and Johnson 1999). Also P is accumulating in ecosystems, leading
to eutrophication of waterways.
Additional to the issue of nutrient oversupply through fertilization practises, also other agricultural management
practises interfere with natural nutrient cycling processes. Tillage disrupts nutrient cycling, and so does the use
of pesticides by reducing affecting essential soil biota. Cover crops, soil rotations, no-till practises and the use of
hedge rows, for example, have shown to be good indicators for healthy nutrient cycles (Millennium Assessment,
2005).
While there were hardly any data on these latter factors in the research papers screened for this study, there
has been a lot of work on different fertilizer regimes with regards to yield increases and nutrient cycling and soil
fertility, as discussed below. Indicators that have been use to describe soil fertility are listed in the Annex.
A. IRRIGATED LOWLANDS
A. USING MINERAL AND ORGANIC FERTILIZER TOGETHER INSTEAD OF MINERAL FERTILIZER ONLY
There was a suite of different studies that compared the use of mineral fertilizer only to a joint application of
mineral and organic fertilizer. The studies used different indicators ranging from a count of nutrients in the soil,
to bulk density, straw decomposition and N recovery efficiency.
The N recovery efficiency is a widely used proxy for nutrient cycling and soil fertilty, i.e. the N that is actually
taken up by the crop species or stored in the soil, instead of being lost to waterways and the atmosphere (Krupnik
et al., 2014). For instance in China, N recovery efficiency was as a low as 27% in the period of 2001 to 2005 for
major cereal crops, including rice (Zhang et al. 2007). During the same period, the USA had average rates of 52%
while in Europe average values were 68% (Ladha et al. 2005).
There are many factors that can lead to an increase in N recovery efficiency. The fertilizer amount applied, and
the timing and application methods play important roles together with environmental and climatic factors such
as precipitation regime, soil texture (clay particles can fix ammonium) and soil quality (e.g. pH level). Also plant
physiological aspects play a role, like rooting depth.
The vote counting study included a paper that showed the effect of C inputs on N recovery efficiency through an
addition of organic fertilizer. When the C balance increases, it can also affect the N balance, because the C/N
ration in soils is relatively constant (Cassman et al., 2002). Other indicators showed effects such as bulk density
increases or nutrient counts.

32
In total, out of 16 comparisons showing soil fertility impacts, in 3 cases there was an increase in soil fertility when
organic fertilizer was added to the mineral one. In 13 cases there was no difference when comparing both
treatments (effect size). For statistically significant data, there was no difference in 12 cases, 1 increase and 1
decrease. It is difficult to draw any conclusions from the results. Not only is the sample size very small, but also
the time of the experiments seems to be too short to see any changes take place after the organic amendment
has been added to the soil.
As for yields, in all cases (25 out of 25, 100%), there was no difference between the two treatments (effect size
data). For statistically significant data, yields declined in 2 cases out of 15 (20%), while in the other cases (80%)
there was no difference.
Studies that compared synthetic fertilizer only and a mix of synthetic fertilizers and rice straw also analyzed the
effect on GHG emissions. There were 19 out of 26 cases that showed no difference in emissions (73%). In seven
cases, however, GHG emissions increased and the mitigation potential was reduced when combining mineral
and organic fertilizer (27%) (effect size data). There were no statistically significant data.
As for habitat provisioning, for effect size data, there was an increase in habitat in three of four cases when
fertilizers were mixed (75%). When considering the statistically significant data, there was no statistical
difference in three cases, while there was an increase in habitat provisioning in one case (25%).
B. USING ORGANIC FERTILIZER INSTEAD OF NO ADDITION
Several studies analyzed the use of organic fertilizer to no addition of fertilizer. In terms of nutrient cycling and
soil fertility, they found that in two of four cases there was an increase in soil fertility when organic fertilizer was
used. In the other two cases there was no difference between using organic fertilizer and no treatment (effect
size data). For statistical significant data, there was an increase in nutrient cycling and soil fertility in all cases
(two out of two). As for yield, in five out of 14 cases there was an increase in yield while in the remaining nine
cases there was no difference (both effect size and statistical significant data).
Please see also results from section 3 a where straw incorporation was compared to rice straw burning.
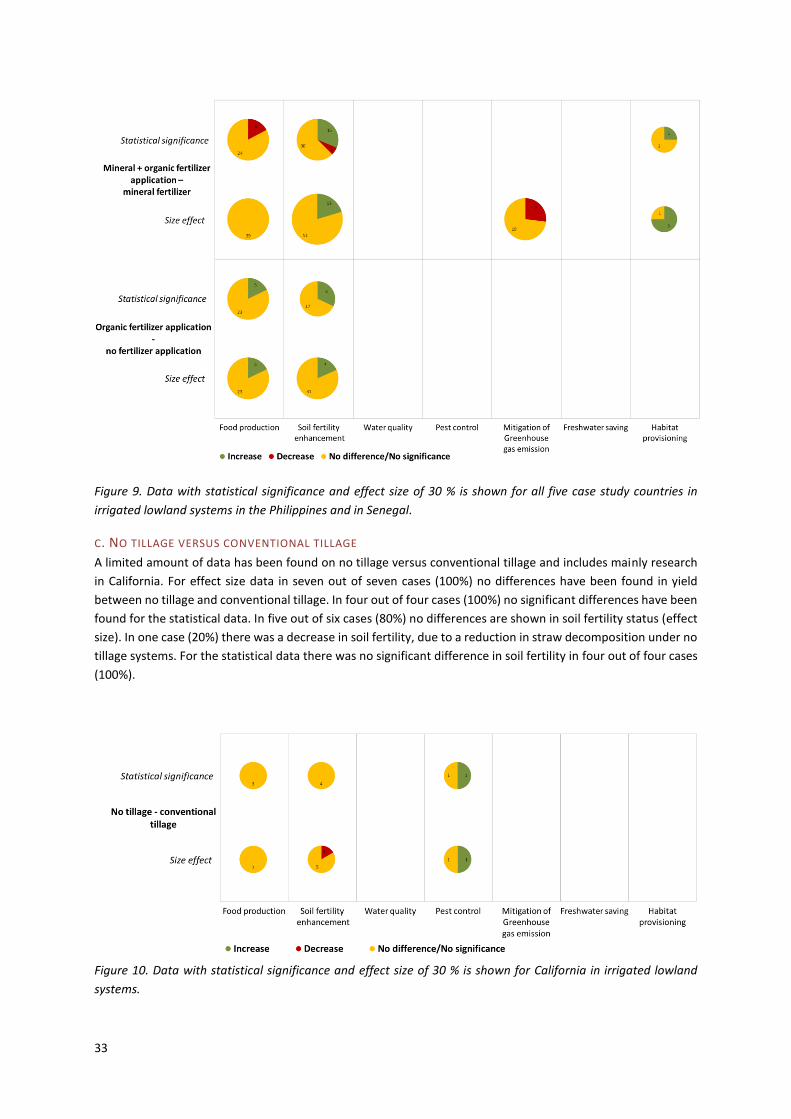
33
Figure 9. Data with statistical significance and effect size of 30 % is shown for all five case study countries in
irrigated lowland systems in the Philippines and in Senegal.
C. NO TILLAGE VERSUS CONVENTIONAL TILLAGE
A limited amount of data has been found on no tillage versus conventional tillage and includes mainly research
in California. For effect size data in seven out of seven cases (100%) no differences have been found in yield
between no tillage and conventional tillage. In four out of four cases (100%) no significant differences have been
found for the statistical data. In five out of six cases (80%) no differences are shown in soil fertility status (effect
size). In one case (20%) there was a decrease in soil fertility, due to a reduction in straw decomposition under no
tillage systems. For the statistical data there was no significant difference in soil fertility in four out of four cases
(100%).
Figure 10. Data with statistical significance and effect size of 30 % is shown for California in irrigated lowland
systems.
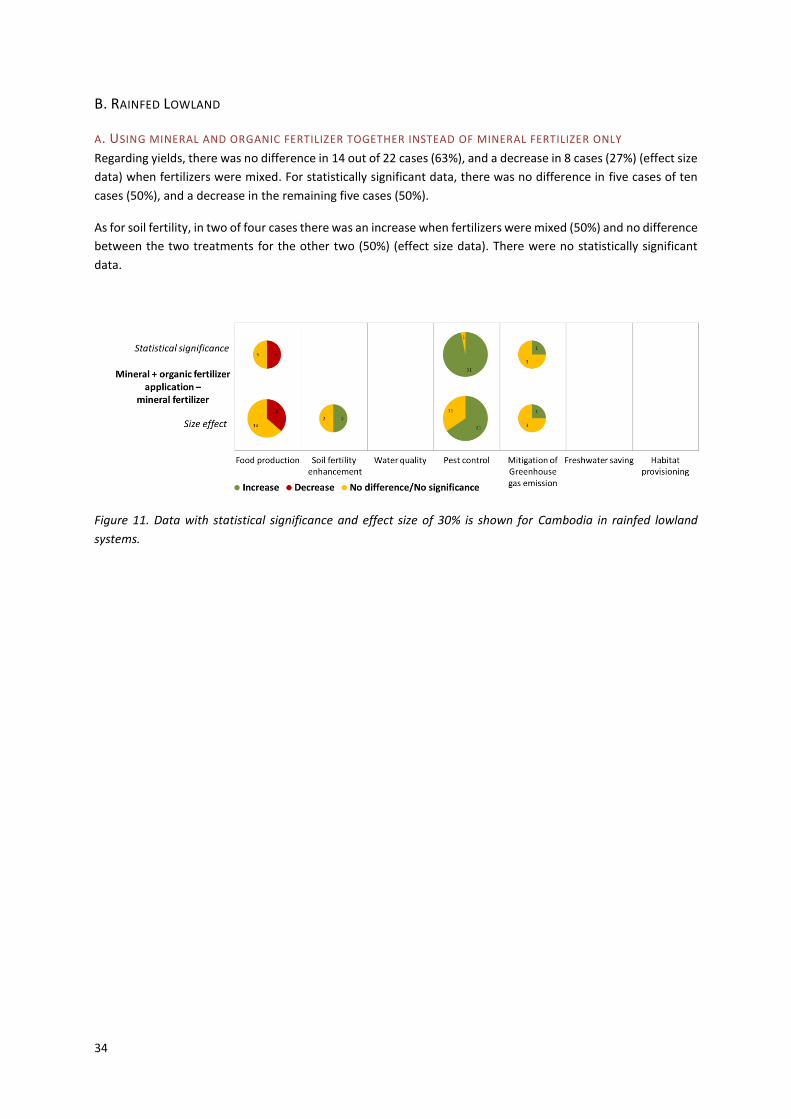
34
B. RAINFED LOWLAND
A. USING MINERAL AND ORGANIC FERTILIZER TOGETHER INSTEAD OF MINERAL FERTILIZER ONLY
Regarding yields, there was no difference in 14 out of 22 cases (63%), and a decrease in 8 cases (27%) (effect size
data) when fertilizers were mixed. For statistically significant data, there was no difference in five cases of ten
cases (50%), and a decrease in the remaining five cases (50%).
As for soil fertility, in two of four cases there was an increase when fertilizers were mixed (50%) and no difference
between the two treatments for the other two (50%) (effect size data). There were no statistically significant
data.
Figure 11. Data with statistical significance and effect size of 30% is shown for Cambodia in rainfed lowland
systems.
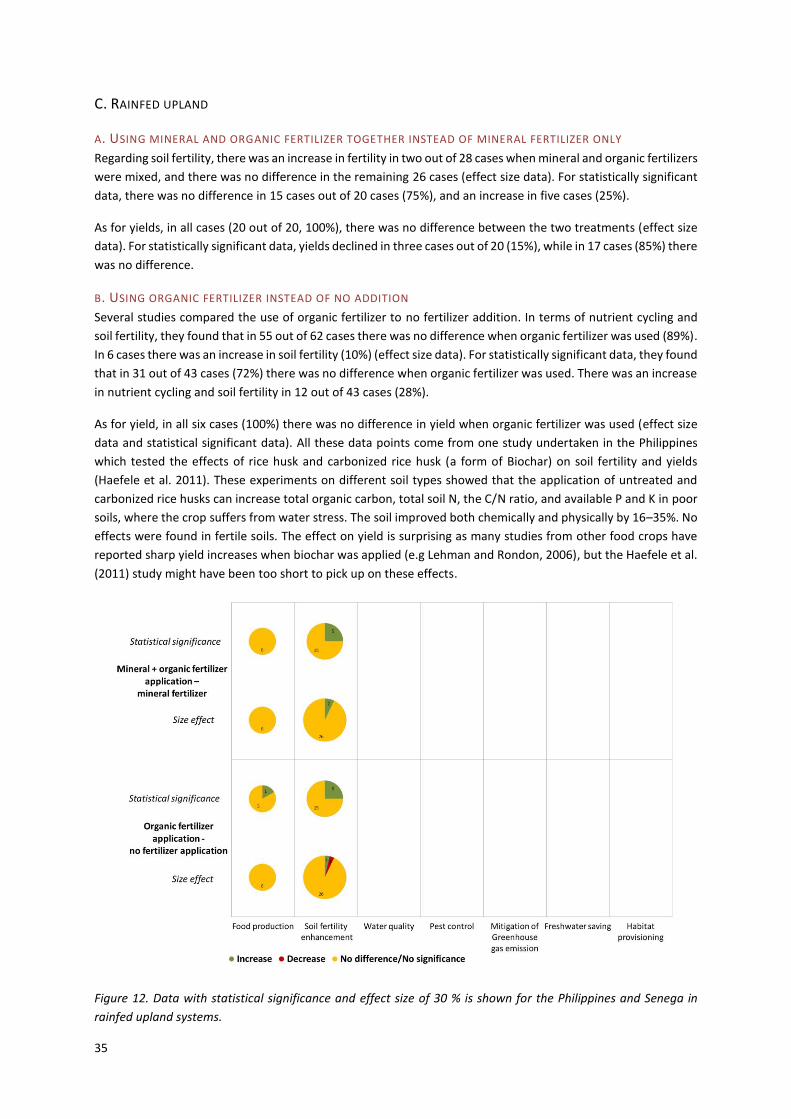
35
C. RAINFED UPLAND
A. USING MINERAL AND ORGANIC FERTILIZER TOGETHER INSTEAD OF MINERAL FERTILIZER ONLY
Regarding soil fertility, there was an increase in fertility in two out of 28 cases when mineral and organic fertilizers
were mixed, and there was no difference in the remaining 26 cases (effect size data). For statistically significant
data, there was no difference in 15 cases out of 20 cases (75%), and an increase in five cases (25%).
As for yields, in all cases (20 out of 20, 100%), there was no difference between the two treatments (effect size
data). For statistically significant data, yields declined in three cases out of 20 (15%), while in 17 cases (85%) there
was no difference.
B. USING ORGANIC FERTILIZER INSTEAD OF NO ADDITION
Several studies compared the use of organic fertilizer to no fertilizer addition. In terms of nutrient cycling and
soil fertility, they found that in 55 out of 62 cases there was no difference when organic fertilizer was used (89%).
In 6 cases there was an increase in soil fertility (10%) (effect size data). For statistically significant data, they found
that in 31 out of 43 cases (72%) there was no difference when organic fertilizer was used. There was an increase
in nutrient cycling and soil fertility in 12 out of 43 cases (28%).
As for yield, in all six cases (100%) there was no difference in yield when organic fertilizer was used (effect size
data and statistical significant data). All these data points come from one study undertaken in the Philippines
which tested the effects of rice husk and carbonized rice husk (a form of Biochar) on soil fertility and yields
(Haefele et al. 2011). These experiments on different soil types showed that the application of untreated and
carbonized rice husks can increase total organic carbon, total soil N, the C/N ratio, and available P and K in poor
soils, where the crop suffers from water stress. The soil improved both chemically and physically by 16–35%. No
effects were found in fertile soils. The effect on yield is surprising as many studies from other food crops have
reported sharp yield increases when biochar was applied (e.g Lehman and Rondon, 2006), but the Haefele et al.
(2011) study might have been too short to pick up on these effects.
Figure 12. Data with statistical significance and effect size of 30 % is shown for the Philippines and Senega in
rainfed upland systems.
36
INCREASE IN YIELD VERSUS PREVENTING PEST AND DISEASE OUTBREAKS
As described in the previous sections, in most parts of the world, rice agriculture is heavily dependent on
agricultural inputs. Pesticides and herbicides are applied to address pest outbreaks and weed manifestation.
While effective in the short run, the use of pesticides over time will have negative impacts on the natural enemy
community that can provide natural forms of pest control, and have led to massive outbreaks from pests that
have become resistant.
For example, the greatest single cause of brown planthopper (Nilaparvata lugens (Stål)) outbreaks is pesticide
use. Ample evidence shows that these planthoppers are an insecticide-induced resurgent pest, which has
adapted itself even to rice varieties which were developed to be resistant against this rice pest (e.g. Settle et al
1996, Heong et al., 2015). In a healthy rice system, the number of invading and reproducing plant hoppers is
controlled by natural enemies (e.g. spiders, insectivorous bats, parasitic wasps), yet when such predators and
parasitoids are reduced or absent through early pesticide spraying, invading pest populations grow
exponentially, which results in pest outbreaks and consequent crop damage.
There were no study results in the case study countries that documented the building of a natural enemy
community to prevent pest, disease and weed outbreaks in order to avoid the use of chemical inputs – yet
evidence of this effect exists from other parts of the world as discussed below. Studies in the included case study
countries, more broadly, focused on different aspects of pest control, comparing the effect of chemical, cultural,
mechanical, genetic and biological pest, weed and disease control mechanisms.
Cultural, genetic and mechanical pest and disease control generally harm natural enemy communities have a
reduced to positive impact on water quality when compared to chemical interventions. Most pest management
practices apart from pesticide and herbicide use increase the probability that natural enemy communities build
up over time clear understanding of the habitat requirements of natural enemy communities is important to
increase the impact of these disease control mechanisms.
By means of so-called “conservation biological control” this probability can be increased: additional to the
elimination of negative influences that suppress natural enemies, such as pesticides, it involves the intentional
enhancement of systems to provide habitat for natural enemy populations (IRRI, n.d; Veres et al. 2013, Chaplin‐
Kramer et al. 2011).
Integrated Pest Management (IPM) is an approach that builds on these principles. It is an ecosystem approach
to crop production and protection that combines different management strategies and practices to grow healthy
crops and minimize the use of pesticides. According to the FAO, definition it means “the careful consideration of
all available pest control techniques and subsequent integration of appropriate measures that discourage the
development of pest populations and keep pesticides and other interventions to levels that are economically
justified and reduce or minimize risks to human health and the environment. IPM emphasizes the growth of a
healthy crop with the least possible disruption to agro-ecosystems and encourages natural pest control
mechanisms” (FAO, 2015).
Work by Settle (1995) describes how the building of organic matter enhances the habitat of natural enemy
communities, thereby supporting high levels of natural biological control. If organic matter is increased early in
the growing season, abundant populations of detritus- feeding and plankton-feeding insects will be fostered,
usually peaking and declining in the first third of the season. These insects have no impact on rice yields, either
positive or negative- but their populations provide natural enemies of rice pests a “head start” – to build up their
populations early in the season so as to be able to strongly suppress the pest populations which enter the paddy
in mid-season. Pesticides early in the season will prevent the strong build-up of natural enemies, killing both
them and their early-season food source.
37
Apart from promoting a strong natural enemy community from resident populations, agricultural management
can actively introduce biological control agents that control insects, diseases and weeds. IRRI (n.d.) has done
several test of controlling rice diseases with agents such a bacterial antagonists of the genus Pseudomonas and
Bacillus, and fungal organisms of the genus Penicillinum and Myrothecium. For example, laboratory experiments
have shown that a treatment with antagonistic bacteria can reduce bakanae disease (Fusarium fujikuroi) by 72
to 96% (IRRI, n.d.).
However, while there is ongoing research on biological control in rice, there is little adoption of these biological
management practices (Lou et al., 2013). In the Philippines, conventional farms are encouraged to use Integrated
Pest Management (IPM) to combat pests. As in much of Asia, IPM is currently rarely practiced among Filipino
farmers, however. Proper IPM demands that farmers monitor their fields for pests and take actions against pest
damage once a threshold is reached. Farmers are encouraged to apply non chemical control measures including
traps, lures or biocontrol agents, before resorting to chemical pesticides. Whether IPM can increase rice yields
depends on the potential for insects to reduce yields. Estimates of yield losses from insects vary greatly, but at
normal levels insect damage to rice in the Philippines is very low, such that management actions may have little
contribution to overall rice yield (Heong et al. 2015).
In Costa Rica, CONARROZ is exploring IPM with biological control methods to suppress the Panicle Rice Mite using
Hirsutella nodulosa, Bacillus thuringiensis, or predatory mites (Sanchez, 2011). In Senegal, FAO promotes
Integrated Production and Pest Management (IPPM) programs which aim to provide farmers with new skills and
knowledge to increase yields by using ecological methods, including biological pest control (FAO, n.d.; Settle &
Hama Garba, 2009). In Cambodia, there has been no published research on biological control mechanisms. Yet a
recent newspaper article in the Cambodian Post (http://www.phnompenhpost.com/special-reports/studies-
biocontrol-agents-yields-high-results) documented the implementation of some ASEAN national guidelines to
regulate the trade and use of biological control agents. Keng Sophea, deputy director of the Department of
Horticulture and Subsidiary Crops, presented some positive results from trials that were using the fungus
Trichoderma in rice. He also acknowledged, however, that the use of biological control might require initial
training and capacity building among farmers.
Another way of biological pest and weed control which used to be an ancient rice-growing practice is currently
being rediscovered in Asia: the introduction of ducks to rice fields, which not only feed on weeds and insect
larvae, but also provide natural fertilizer through their droppings. A book by the Japanese author Takao (2001)
called “The power of duck” on this subject area even made it into some of the prominent European newspapers,
e.g into The Guardian (http://www.theguardian.com/science/2012/jan/24/japan-farming-technique-duck-
pesticide ).
A. IRRIGATED LOWLANDS The following practices fall under the category of “Cultural control” which aim to modify production practices in
a way that allow for better control of pests, weeds and diseases. At the same time, many of these control
mechanisms also strengthen natural enemy communities over time, or make rice plants more resilient against
pest attacks. However, a change of production practices may affect yield. Each type of intervention therefore
needs to be weighted carefully.
A. RICE STRAW BURNING
Rice straw burning is a common measure for controlling pests, weeds and diseases. However, as described in an
earlier section, the air pollution linked to burning has led policy makers to forbid rice straw burning in many parts
of the world, particular adjacent to large human settlements. The alternative measures eliminate the incidence
of air pollution, yet pest, weed and disease control can be a problem in these cases. In a study on stem rot disease
Sclerotium orzae (Cintas & Webster 2001) where straw burning was replaced by either straw crushing and rolling
into the soil, soil incorporation or by straw baling and removal, pest control decreased drastically in all cases,
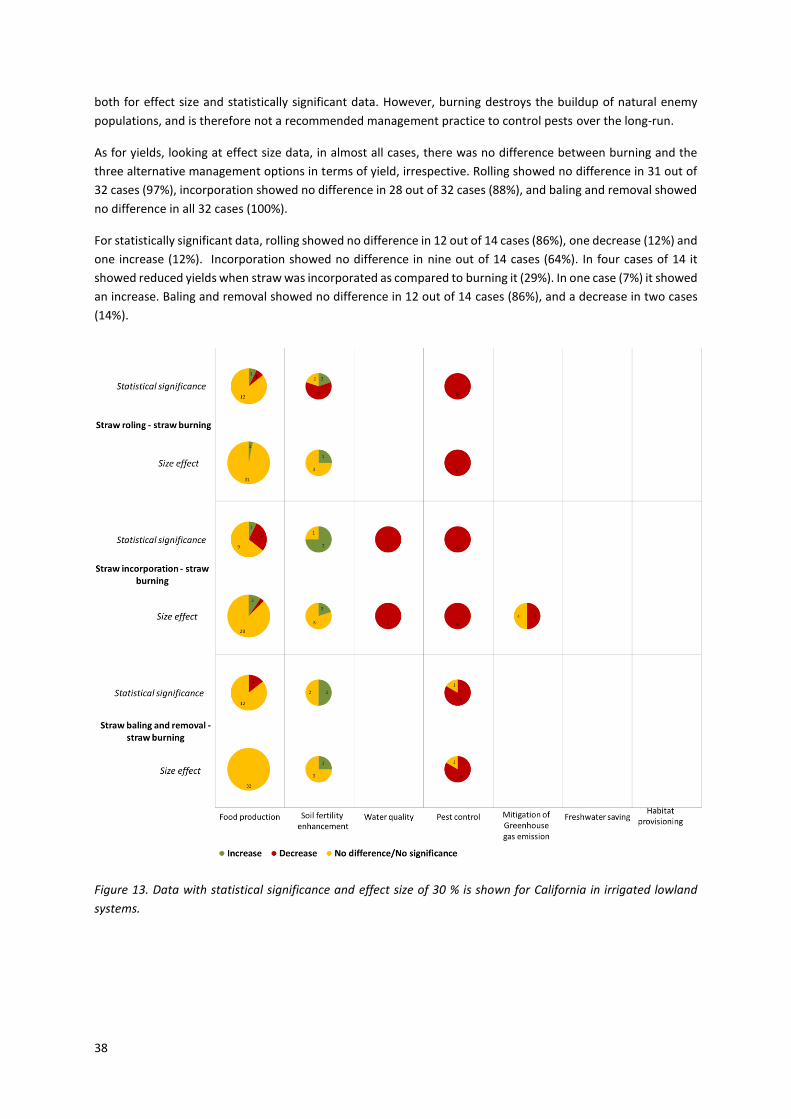
38
both for effect size and statistically significant data. However, burning destroys the buildup of natural enemy
populations, and is therefore not a recommended management practice to control pests over the long-run.
As for yields, looking at effect size data, in almost all cases, there was no difference between burning and the
three alternative management options in terms of yield, irrespective. Rolling showed no difference in 31 out of
32 cases (97%), incorporation showed no difference in 28 out of 32 cases (88%), and baling and removal showed
no difference in all 32 cases (100%).
For statistically significant data, rolling showed no difference in 12 out of 14 cases (86%), one decrease (12%) and
one increase (12%). Incorporation showed no difference in nine out of 14 cases (64%). In four cases of 14 it
showed reduced yields when straw was incorporated as compared to burning it (29%). In one case (7%) it showed
an increase. Baling and removal showed no difference in 12 out of 14 cases (86%), and a decrease in two cases
(14%).
Figure 13. Data with statistical significance and effect size of 30 % is shown for California in irrigated lowland
systems.

39
B. WINTER FLOODING
Winter flooding was found to be a good alternative to straw burning in order to control the disease Sclerotium
orzae. Both for effect size and statistically significant data, the disease incidence decreased in five of six cases
(83%) and pest control increased. In one case there was no difference (17%).
As to be expected, this had a positive effect on yields as the disease was controlled better. For statistically
significant data, yields were higher in five out of six cases (83%) when fields were winter flooded. In the remaining
case, there was no difference (17%). For effect size data, there were no difference in yield in 57 out of 58 cases
(98%). In one case, yields increased with winter flooding (2%).
Figure 14. Data with statistical significance and effect size of 30 % is shown for California in irrigated lowland
systems.
Weeds can be effectively controlled by continuous flooding. In an experiment in the Philippines (Bhagat et al
1999), weed biomass increased when improved water management practices were applied instead of continuous
flooding. In three out of four cases weed control was compromised when soils were no longer covered by water
(effect size data). In one case there was no difference. Yields decreased in four out of eight cases (50%); and no
difference was shown for the other four cases (50%) (statistically significant data).
However, one needs to be aware that while flooding is a good control mechanism for some diseases or weeds,
in other cases the opposite might be the case. Experience has shown that temporary drainage of rice paddies
can successfully combat pest such as grasshoppers, water weevils, or whorl maggots by affecting their respiration
(IRRI, n.d. b). There was no data in this respect in any of the five case study countries however.
Researchers have found that by changing the nutrient content of crops, the rate of fertilizer use can influence
plant defenses (Chen & Ni, 2011). The research shows that there is more plant damage from pests in nitrogen-
fertilized crops, as high nitrogen levels in plant tissue can decrease resistance and increase susceptibility to pest
attacks. The use of no or lower fertilizer rates can therefore be highly effective in suppressing certain pests, yet
yields may be lower. There was no data showing these effects in any of the five case study countries however.
While decreasing the use of fertilizers can increase the plant resistance to pests, fertile soils, on the other hand,
have positive effects on pest and weed resistance of rice crops. Research in upland systems has shown that
improving soil fertility through the introduction of leguminous shrubs and trees or the incorporation of crop
residues and green manure, for instance, enables rice crops to better compete with parasitic weeds such as Striga
(Elezein & Kroschel 2003; Kayeke et al. 2007). There were no data in this respect in any of the five case study
countries.

40
Many other cultural mechanisms that suppress pests, weeds and diseases are available. Planting trap crops, crop
rotations or intercropping are just a few more examples. Yet as our literature research has shown there is hardly
any scientific evaluation of these practices available. Likewise, hardly any studies covered biological, mechanical
or genetic control in the five case study countries.
C. NO TILLAGE AND STALE SEEDBEDS VERSUS CONVENTIONAL TILLAGE (IL)
A limited amount of data has been found on practicing no tillage in combination with stale seedbeds versus
conventional tillage and includes only research in California. For effect size data in seven out of seven cases
(100%) no differences have been found in yield between no tillage and conventional tillage. In four out of four
cases (100%) no significant differences have been found for the statistical data.
In one out of two cases (50%) no differences in weed control were found (effect size). In the other case (50%)
there was an increase in weed control (both for effect size and statistical significant data), showing that no-till
practices in combination with stale seedbeds can control better for weeds than conventional tillage. The sample
size is too small however to draw any conclusion from this experiment.
Figure 15. Data with statistical significance and effect size of 30 % is shown for studies from California in irrigated
lowland systems.
D. WEED COMPETITIVE VARIETY SAHEL 202 - VARIETY SAHEL 108 (IL)
A study conducted in Senegal by Rodenburg et al (2014) tested two local rice varieties on their yield and weed
competitiveness. Sahel 202 is known as a relative strong competitor against weeds, while Sahel 108 is identified
as a relative weak weed competitor. The advantage of Sahel 108 is a shorter growing period (113 days versus
125 days for Sahel 202). For both size effect and statistical significant data no differences in weed biomass have
been found.
In 2 out of 5 cases (40%) yield was higher for Sahel 108 compared to Sahel 202. In 3 out of 5 cases (60%) Sahel
202 yielded higher (size effect). Statistical data showed a significant increase in yield for Sahel 202 over Sahel 108
in 3 out of 5 cases (60%). In 1 case (20%) no significant difference were found and in 1 case (20%) a decrease in
yield.
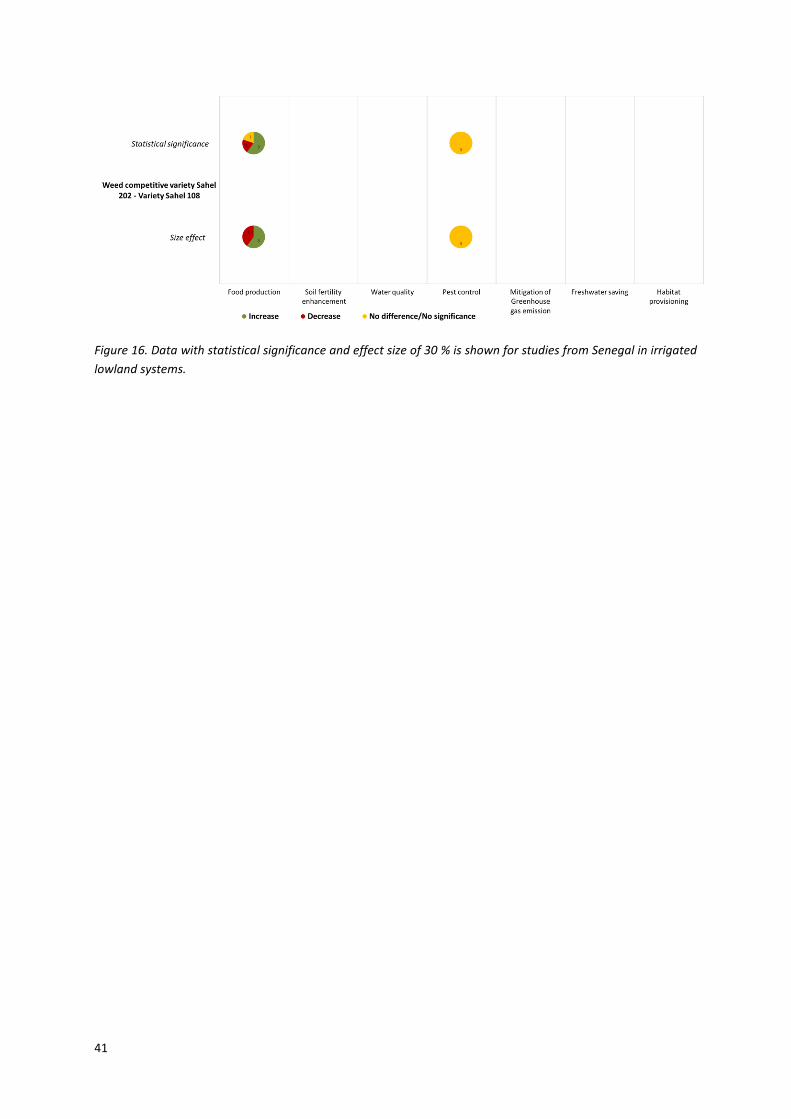
41
Figure 16. Data with statistical significance and effect size of 30 % is shown for studies from Senegal in irrigated
lowland systems.
42
5. CONCLUSIONS The study set out to determine the trade-offs resulting from different management objectives of rice production
systems. It aimed to identify impacts caused by rice production as well as the dependencies of the rice production
systems on natural resources, ecosystem services and man-made inputs.
In a second step, the study looked into available rice management options which address the identified trade-
offs, particularly those that lead to synergies when trying to reach different management objectives at the same
time.
This was done through a narrative report and a biophysical assessment based on a vote-counting analysis. The
analysis showed the effect of a specific management practice or management system on different response
variables such as food production, water consumption or soil fertility which either increased, decreased or
maintained it status quo with the change of a management practice or system.
As a general conclusion and before going into more detail, it is important to remark that:
1. Most research on rice is currently focused on yield increase. Little has been published on the impact of rice
production on natural resources and human health. The role of ecosystem services in rice production is widely
under researched and often mentioned only indirectly, if at all.
2. Within the limited literature on environmental impacts, most has been published on the effect of rice
production on water consumption.
3. The role of ecosystem services in rice other than food production is not a common area of research. Ecosystem
services are either portrayed as an integral part of an alternative management practice replacing man-made
inputs to production, or they are documented as a response variable which is being affected by a specific
management practice.
4. Most research has been undertaken in irrigated lowland systems, while there is little information on rainfed
lowland and rainfed upland systems.
5. The studies covered a large variety of different rice management practices, which clearly shows the diversity
of how rice farming is practiced around the world. However, few of the same rice management practices were
repeated and compared often enough, to draw firm conclusions on their impacts - apart from yields which are
relatively well researched.
INCREASE IN RICE YIELD VERSUS MAINTENANCE IN WATER QUALITY
In most parts of the world, rice agriculture is heavily dependent on agricultural inputs. Synthetic fertilizers are
used to boost yields, while pesticides and herbicides are applied to address pest outbreaks and weed
manifestation. Weed outbreaks can cause losses in rice production and thereby lower the income of farmers,
while it is still unclear whether pesticides (particularly insecticides) actually increase rice yields (Heong et al.
2015). While the occurrence of pest species as such is not a problem, it becomes problematic when pest species
rise to epidemic levels beyond the control of biological, cultural, or mechanical systems.
One of the main reasons for uncontrolled pest outbreaks is the misuse of pesticides. Not only is rice production
itself affected, but also the adjoining waterways, their wildlife such as fish and birds, and the supply of drinking
water. Finding alternative ways to address pests is therefore very important.
Another reason is the increased use of fertilizer. Increasing fertilizer use often leads to higher disease incidence
and a greater abundance of herbivorous insects and mites. This, in turn, often leads farmers to apply higher
levels of pesticides and thereby reduce ecosystem efficiency and reduce water quality (Horgan and Crisol 2013;
Spangenberg et al. 2015).
43
This study sought to analyse the difference in impact between practices that a. omitted the use of chemical
pesticides and herbicides, and b. that used different rates of pesticides and herbicides.
Conclusions can only be drawn for irrigated lowland systems, since there was insufficient data for rainfed systems
from the five case study countries. The evidence suggests that pesticides, in this vote counting analysis mostly
insecticides, and herbicides have a positive impact on yields, and at the same time, a strong negative effect on
water quality.
While the sample size is not large enough for any firm conclusions to be drawn, there is evidence that biological
control mechanisms, in combination with manual or mechanical control, can replace herbicide applications.
Studies show that both have the same strong positive effects on rice yield. Meanwhile, water quality is only
affected when herbicides are used. Other weed management practises that rely on hand or mechanical weeding
only are not only very labour intensive, but have shown to lead to reduced yields. Studies that examine these
effects as parts of integrated systems are largely unavailable, however.
INCREASE IN RICE YIELD VERSUS REDUCTION IN WATER USE
Worldwide, about 80 million hectares of irrigated lowland rice provide 75% of the world’s rice production. This
predominant type of rice system receives about 40% of the world’s total irrigation water and 30% of the world’s
developed freshwater resources. While water usage is high, in some flood based systems, irrigation water is
returned to river systems and contributes to environmental flows. The dependence on water of the rice farming
sector is a huge challenge as freshwater resources are also becoming increasingly depleted due to competing
water uses from the residential and industrial sector and as rainfall is increasingly erratic due to climate change
and variability. More efficient water use is therefore a must, yet it carries a number of trade-offs as this study
has shown.
Improved water use efficiency has become a central topic for research. While the primary aim of improved water
management is to improve irrigation water use efficiency, rice yields may in some cases be compromised. As our
study has shown, in two third of all cases, yields were not affected when water consumption for irrigation was
reduced. However, in the remaining third, the results showed decreased yields. This outcome strongly depends
on the type of improved water management that is practised though. While alternate wetting and drying does
not have an effect in most cases, rice yield in aerobic soils can be significantly compromised. The System of Rice
Intensification (SRI) includes intermittent flooding as part of a production package. Also here, by large, yields are
not affected by the water saving regime.
In terms of water savings, almost two third of all studies found that improved water management led to
significant water savings. Yet, more than a third of the studies found no large differences in water consumption
compared to continuously flooded systems. This was explained by a range of context specific factors such as low
water tables, low percolation rates and small water inputs, in the first place. Surprisingly, in our study, water use
was not reduced in most of the cases when SRI was practiced. Although it needs to be noted that the sample size
of this study was not large enough for any firm conclusions regarding SRI, and that no statistically significant data
was available.
One also needs to be aware that water saving measures in these studies have been confined to field level. For
comprehensive conclusions regarding water savings, one would need to implement a water accounting
framework that includes measurements that go beyond the local level alone. None of the studies included in this
analysis did such a comprehensive assessment.
Furthermore, one also needs to take the trade-offs into account that might be linked to water savings. For
example, water saving regimes will increase the weed biomass as flood irrigation suppresses weeds. Our study
showed that pest and weed control indeed decreased in the majority of all case although the sample size was
not large enough to draw any firm conclusions. On the positive side, GHG emissions tend to decrease with
44
improved water management. Nonetheless, due to an insufficient sample size, this could not be demonstrated
in this vote counting analysis. There was also not sufficient data that demonstrated the effects of improved water
management on habitat provisioning, but evidence from other countries clearly shows effects on this response
variable as natural habitat for aquatic organisms and water birds diminishes when continuous flooding is not
provided.
INCREASE IN RICE YIELDS VERSUS REDUCTION OF AIR POLLUTION
In Asia alone, 60% of the continent’s 550 million tons of rice straw are being burnt in the field each year. Air
pollution can be easily addressed by substituting straw burning with an alternative management practice. There
are several alternative management options to burning residues, with effects on several response variables.
Straw might be rolled with a heavy roller to crush the straw into the soil surface, it might chopped and then
incorporated using a chisel plow or disc, or it can baled and removed.
The results of the vote counting analysis showed that in the majority of all cases, yield was not affected when
alternative crop residue management practices to rice straw burning were chosen and significant air pollution
was avoided – a clear synergistic effect. However, this was only the case when sufficient mineral fertilizers were
applied to the field. When no fertilizers were used, yield dropped by half. Under these conditions, incorporation
of rice straw proved to bring the yields back up to almost maximum levels – however only after a couple of years.
These positive effects are clearly linked to the effect of rice straw incorporation on nutrient cycling and soil
fertility. Residues incorporated in the soil increase microbial activity, they help to prevent erosion, positively
affect soil structure and add carbon and organic matter to the soil. However, it takes time until these effects
show as incorporating rice straw into the wet soil results in temporary immobilization of N through high C levels.
In general, it needs to be noted that effects of rice straw addition on soil fertility are poorly studied – also this
analysis did not have a large enough sample size to draw firm conclusions.
An important trade-off linked to changing from straw burning to other management practices is the incidence of
pest and disease outbreaks. While straw burning is often used as a cost-effective pest and disease control
practice, all other residue management strategies need alternative pest control mechanisms. California, for
instance, reverted to residue incorporation in combination with winter flooding to suppress weed growth.
Removing and baling rice straw is another promising practice that has found particular interest within the global
discourse on bioeconomy. Rice straw is often thought to be a free (waste) resource available to produce energy,
be it for bioelectricity, biogas or even liquid fuels for transport. Ongoing studies clearly show however, that
logistics are most likely to be too expensive to make rice straw energy a profitable business. Rice husks, on the
other hand, have been shown to be a valuable resource when used directly at the milling sites – as raw material
which can fuel part of the milling or rice-drying operations.
Some integrated farming systems that have both crops and livestock, also rely on rice straw as bedding material
or as (supplementary) animal feed, albeit of low nutritional value.
INCREASE IN RICE YIELD VERSUS REDUCTION OF GHG EMISSIONS
Global estimates attribute about 89 % of rice global warming potential to CH4 emissions which are due to flooding
practices in irrigated and rainfed lowland systems (Linquist et al., 2012). To a smaller degree, emissions from rice
straw burning impact global climate change through CO2 emissions. And also the production and application of
N-fertilizers contributes to the rice global warming potential. In addition to rice production being a major emitter
of GHGs, rice systems also sequester carbon via soil organic carbon in top soil. Yet overall, rice production is a
net producer of greenhouse gas emissions. Global rice production has been estimated to emit between 500 and
800 million tons of CO₂ equivalent per year, which represents around 10 percent of total agricultural GHG
emissions and 1 percent of global GHG emissions (Searchinger et al. 2014).

45
Practices that reduce water consumption and hence also reduce the flooding time of irrigated lowland systems
tend to also reduce GHG emissions. While this study showed a trend in this direction, the results were largely
heterogeneous and no firm conclusions could be drawn. Data on GHG emissions from different residue
management practices was very scarce. In some cases, straw incorporation decreased GHG emissions compared
to rice straw burning, while in other cases emissions remained the same as the reduction in CO2 emissions from
burning was substituted by CH4 emissions from decomposing organic matter in standing water. Organic fertilizers
seem to lead to larger emissions than mineral fertilizers, yet again, the sample size was not sufficient enough to
draw firm conclusions.
Practices that reduce water consumption had also heterogeneous effects in yields, albeit in two thirds of the
cases yields remained the same, while in one third yields declined.
The effect of different residue management practices on yields is less clear, and it would be wrong to draw
general conclusions from the one (and only) paper) ( Eagle et al. 2000) that compared different alternatives to
rice straw burning in this section. In this study, the yields were clearly not significantly affected when different
residue management practices were chosen, be it burning of rice straw, incorporation or removal as long as
mineral fertilizers were consistently applied. When mineral fertilizers were not applied, there was a drop in
yields. In the case of rice straw incorporation, yields recovered however after three years, before dropping again
in year five. The long term effects, both for mineral and rice straw, beyond year five were not studied. Looking
at long term experiments from other parts of the world showed that fertilizer use, both organic and mineral, do
increase rice yields.
INCREASE IN RICE YIELD VERSUS HABITAT PROVISIONING
The practice of flooding fields for rice production has existed for many hundreds of years providing habitat for a
wide range of organisms such as aquatic plants, fish and waterfowl. These occur naturally or as a result of
cultivating aquatic organisms within the available water (Halwart & Gupta, 2004). Rice-fish production can be
done concurrently or as rotational crops and can involve many species beyond fish including crabs, prawns,
turtles, and mollusks. The breadth of biodiversity in rice fields however, extends far beyond what is intentionally
cultivated. A study in 1979 recorded 589 total species of organisms in a rice field in Thailand, of which 18 were
species of fish and 10 were species of reptiles and amphibians (Halwart & Gupta, 2004). Thus, the value of aquatic
biodiversity in flooded-rice production extends far beyond the traditional interpretation of rice cultivation.
While out of the five case study countries there was only one reported case in the peer reviewed literature which
documented and quantified the importance of habitat provisioning of rice systems for overwintering winter fowl
(see narrative review, California) with its concomitant benefits for recreational activities such as hunting (i.e.
cultural ecosystem services), there are plenty of studies around the globe that report on rice as an important
wetland habitat. Tonle Sap in Cambodia for example, is a major rice producing region, and at biosphere reserve
at the same time.
The specific study from California showed clear synergies between rice production and the provision of habitat.
In almost three quarters of all cases, rice yields increased with habitat provisioning through winter flooding.
There were no studies that compared the effect of pesticides and herbicides on yields and on habitat provisioning
for aquatic species and water fowl at the same time. Studies that only looked at habitat impacts showed clear
results, however. For example, Mullie et al (1991) studied the toxicity of irrigation water after Carbofuran
application (which used to control rice stem borers) on aquatic organisms in Senegal. They found a significant
decrease of aquatic macro invertebrates after Carbofuran application, meaning that Carbofuran is highly toxic
for non-target species. Parsons et al (2010) conducted research on the effect of different pesticides on birds in
rice fields on a global scale and concluded that various pesticides are highly toxic for birds. Pesticides in
waterways can be widespread and besides the direct effects, several indirect effects are reported (e.g. reduced
prey).
46
INCREASE IN RICE YIELD VERSUS NUTRIENT CYCLING AND SOIL FERTILITY
Nutrient cycling and soil fertility underpin many ecosystem services, and are hence one of the essential “inputs”
for sustaining rice production as such. It is therefore logical that an increase in rice yield is closely linked to the
well-functioning regulation of nutrient cycling and soil fertility, which depend on a suite of biological, chemical
and physical processes over space and time. Studies on this essential ecosystem service are scare however. The
few studies that exist compare the effect of different fertilizer regimes on crop yields and to a lesser degree on
soil fertility. Research revolves around the question whether mineral fertilizers can be partially replaced by
organic ones without compromising soil fertility and yields. Or whether certain organic amendments such as rice
straw actually increase soil fertility at all. While the effect of rice straw incorporation does have a positive effect
on soil fertility and yields on the long run as discussed above, the sample size of this vote counting analysis was
too small to draw any clear conclusions. The effect of other organic fertilizers such as green and animal manure
(e.g the water fern azolla, or duck droppings), intercropping or crop rotations is hardly documented and
quantified in any of the five case study countries.
INCREASE IN YIELD VERSUS PREVENTING PEST AND DISEASE OUTBREAKS
There were no peer reviewed studies that documented the building of an ecological community of natural enemy
species that prevent pest and disease outbreaks. Although this is an integral part of Integrated Pest Management,
the little that has been published on the subject area was not published in any of the five case study countries.
The same holds true for the deliberate introduction of biological control agents. While this seems to be a
promising way to avoid chemical plant protection measures, there has been no peer reviewed study in any of
the five countries.
To some extent, the study showed alternative management practices to chemical pest control such as the
cultural mechanisms or mechanical practices. These – while not actively promoting a natural enemy community
– passively provide a favourable environment for the development of an ecological infrastructure that can host
natural enemy species. Other advantages are the usually low expenses, the low(er) environmental impacts and
the fact that pests are not likely to develop resistances as compared to chemical interventions.
On the negative side, some of the chemical free practices decrease yields. Also, many of these approaches
require the adoption by the entire community in order to make them effective.
CHALLENGES OF THE VOTE COUNTING ANALYSIS
Further meta-analytical research is needed to fully understand the tradeoffs among different rice management
approaches. To conduct a comprehensive meta-analysis, data extraction from peer reviewed studies should be
consistent. The comparison of farm practices should be equal for each study as well as the response variables
(Pittelkow et al. 2015). This TEEB study compared a large variety of rice farming practices. In total around 1500
data points over 28 different farm practice comparisons have been extracted (see Annex 2). In addition, these
data points covered a variety of response variables: seven categories of high level response variable (e.g. food
production, soil fertility) and 43 low level response variables (e.g. yield, CH4 emission, bulk density, water use,
etc.). This shows that the collected data is too variable to conduct a comprehensive meta-analysis.
As a meta-analysis is quite strict in terms of the data that is required, the vote counting has been chosen as
analysis for this project. Vote counting analyses require less data, have more simplicity and are broader
applicable (Koricheva et al. 2013). However, several challenges have been faced for conducting the vote counting
analysis. First of all, the selection of papers was rather strict. Within the comparison of two farm practices, only
one input had to be different. This resulted in the exclusion of several studies in which more than one farm input
was changed. To be clear on what practices could be included, and under what category, a list of rules has been
created, which can be found in Annex 2.
47
Second, there was a lack of statistical data which is needed to conduct a vote counting analysis. Size effect data
has been introduced based on a 30% difference rule. However, this 30 % rule led to some limitations for our
study. An example of this is water use, which is a controlled farm input in the irrigated systems. Although water
use was reduced manually, in various cases this was not a reduction of more than 30%. In the vote counting
analysis it resulted in ‘no difference’ in comparison to continuous flooded systems, while even 10 or 20%
reduction in water use is already a great achievement.
This vote counting analysis gives a general overview of trade-offs and synergies between different
environmental, agronomic and ecosystem variables in rice production. It should be noted though, that the variety
of farm practices is large and are therefore subdivided in broader categories. As example, the comparison
category ‘improved water management’ contains different stages of water use reduction. A large reduction in
water use might give a reduction of yield, while a smaller reduction in water use might keep up yield. These slight
differences in amount of water use between treatments within a practice comparison category are not clearly
visible from the vote counting analysis.
48
6. REFERENCES Adviento-Borbe, M.A., Pittelkow, C.M., Anders, M., van Kessel, C., Hill, J.E., McClung, A.M., Six, J., & Linquist,
B.A. 2013. Optimal Fertilizer Nitrogen Rates and Yield-Scaled Global Warming Potential in Drill Seeded Rice.
Amano, H. 2006. Status of migratory birds that use mud flats. Chikyu Kankyo, 11: 215-226 (in Japanese).
Amano, T., Yamaura, Y. 2007. Ecological and life-history traits related to range contractions among breeding
birds in Japan. Biol. Conser. 137: 271-282.
Amano, T., Li M-H., & Yoshida, H. 2010. Silent night in Japanese rice fields? A population decline in the greater
painted snipe. Orn. Science, 9: 49-53.
Atlin, G. N., Lafitte, H. R., Tao, D., Laza, M., Amante, M., & Courtois, B. 2006. Developing rice cultivars for high-
fertility upland systems in the Asian tropics. Field Crops Res., 97(1): 43-52.
Bacon, P. E., & Cooper, J. L. 1985. Effect of rice stubble and nitrogen fertilizer management techniques on yield
of wheat sown after rice. Field Crops Res., 10: 241-250.
Bado, B., Traore, K., Devries, M., Sow, A., & Gaye, S. 2011. Integrated Management of Fertilizers, Weed and Rice
Genotypes Can Improve Rice Productivity. In "Innovations as Key to the Green Revolution in Africa". pp. 175-182.
Springer. 410 pp.
Balzer, T., Balzer, P., & Pon, S. 2002. Traditional use and availability of aquatic biodiversity in rice-based
ecosystems. Kampong Thom Province, Kingdom of Cambodia. Biodiversity and the ecosystem approach in
agriculture forestry and fisheries.
Bernier, J., Atlin, G. N., Serraj, R., Kumar, A., & Spaner, D. 2008. Breeding upland rice for drought resistance. J.
Sci. Food Agric., 88(6): 927-939.
Bouman, B.A.M., Castaneda, A.R., & Bhuiyan, S.I. 2002. Nitrate and pesticide contamination of groundwater
under rice-based cropping systems: past and current evidence from the Philippines. Agric. Ecosyst. Environ., 92
(2-3): 185-199.
Bronson, K. F., Neue, H.-U., Singh, U., & Abao, E. B. J. 1997. Automated Chamber Measurements of Methane
and Nitrous Oxide Fluxin a Flooded Rice Soil: I. Residue, Nitrogen, and Water Management. Soil Sci. Soc. AM. J.,
61: 981-987.
Burlingame, B, Charondierre, R., and M. Halwart. 2006. Basic human nutrition and dietary diversity in rice-based
aquatic ecosystems. Journal of Food Composition and Analysis 19, 660.
Cassman, K G., Dobermann, A. R., & Walters, D. T. 2000. Agroecosystems, Nitrogen-use Efficiency, and Nitrogen
Management. Agronomy & Horticulture. Faculty publication, 365.
Chaplin‐Kramer, R., O'Rourke, M.E., Blitzer, E.J. & Kremen, C. 2011. A meta‐analysis of crop pest and natural enemy response to landscape complexity. Ecol. letters, 14(9): 922-932.
Chen, Y., & Ni, X. 2011. Nitrogen Modulation on Plant Direct and Indirect Defenses. In T. Liu, & L. Kang, eds. Recent Advances in Entomological Research, pp 86-102. Berlin, Springer Links. 500 pp.
Corton, T., Bajita, J., Grospe, F., Pampolona, R., Asis Jr., C., Wassmann, R., Lantin, R., & Buendia, L. 2000. Methane emission from irrigated and intensively managed rice fields in Central Luzon (Philippines). Nutr. Cycl. Agroecosys, 58: 37-53.

49
Cintas, N. A., & Webster, R.K. 2001. Effects of rice straw management on Sclerotium oryzae Inoculum, stem rot severity, and yield of rice in California. Plant Dis., 85: 1140-1144.
Datta, S. C., & Banerjee, A. K. 1978. Useful weeds of West Bengal rice fields. Econ. Bot., 32(3): 297-310.
De Ponti, T., Rijk, B. & van Ittersum, M. K. 2012. The crop yield gap between organic and conventional
agriculture. Agric. Sys., 108: 1–9.
De Silva, S., Johnstone, R ., & Try, T. 2013. Rice and Fish: Impacts of Intensification of Rice Cultivation. IWMI -
ACIAR Investing in Water Management to Improve Productivity of Rice-Based Farming Systems in Cambodia
Project. Issue brief #4, June 2013
Dormaar, J. F., Pittman, U. J., & Spratt, E. D. 1979. Burning crop residues: Effect on selected soil characteristics
and long-term wheat yields. Can. J. Soil Sci., 59(2): 79-86.
Eagle, A. J., Bird, J.A., Horwath, W.R., Linquist, B.H., Brouder, S.M., Hill, J.E., & van Kessel, C. 2000. Rice yield and nitrogen utilization efficiency under alternative straw management practices. Agron. J., 92: 1096-1103. Eshun, J., Apori, S., & Wereko, E. 2013. Greenhouse gaseous emission and energy analysis in rice production
systems in Ghana. Afr. Crop Sci. J., 21(2): 119–126.
Elzein, A., & Kroschel, J. 2003. Progress on management of parasitic weeds. FAO Plant Production and Protection Paper (FAO). FAO. n.d. Plant Production and Protection Division: Integrated Production and Pest Management Programme in
West Africa. Retrieved 27.01.2015, from http://www.fao.org/agriculture/crops/thematic-
sitemap/theme/pests/ipm/ipmwestafrica/en/
FAO. 2015. AGP – Integrated Pest Management. Retrieved 19.8.2015, from
http://www.fao.org/agriculture/crops/thematic-sitemap/theme/pests/ipm/en/
Farag, A.A., Radwan, H.A., Abdrabbo, M.A.A., Heggi, M.A.M., & McCarl B.A. 2013. Carbon Footprint for Paddy
Rice Production in Egypt. Nat. and Sci., 11 (12).
Farmers, D., & Gueli, L. 2009. The potential of rice intensification in Paoy Char, Banteay Meanchey province,
western Cambodia: Case study in in Trapeang Thma. SLUSE REPORT 2009. University of Kopenhagen.
Gaihre, Y. K., Wassmann, R., & Villegas-Pangga, G. 2013. Impact of elevated temperatures on greenhouse gas
emissions in rice systems: interaction with straw incorporation studied in a growth chamber experiment. Plant
Soil, 373(1-2): 857–875.
Ghimire, R., Adhikari, K., Chen, Z., Shah, S., & Dahal, K. 2012. Soil organic carbon sequestration as affected by
tillage, crop residue, and nitrogen application in rice–wheat rotation system. Paddy Water Environ., 2 (10): 95.
Griffith, D. 2015. Economic value of ecosystem services provided by aquatic organisms in flooded-rice
production: a literature review. Unpublished report for the FAO TEEB Rice study.
Häfele, S., Wopereis, M., Boivin, P., & N’Diaye, A. 1999. Effect of puddling on soil desalinization and rice seedling
survival in the Senegal River Delta. Soil and Tillage Res., 51(1): 35–46.
Haefele, S. M., Konboon, Y., Wongboon, W., Amarante, S., Maarifat, A. A., Pfeiffer, E. M., & Knoblauch, C.
2011. Effects and fate of biochar from rice residues in rice-based systems. Field Crops Res., 121(3): 430-440.
Haefele, S., & Wopereis, M. 2005. Spatial variability of indigenous supplies for N, P and K and its impact on
fertilizer strategies for irrigated rice in West Africa. Plant Soil, 270(1): 57–72.
50
Halwart, M., Gupta, M.V. 2004. Culture of fish in rice fields. FAO and World Fish Centre, Rome and Penang. pp
77.
Heong, K.L., Escalada, M.M., Van Chien, H., Reyes, J.H.D. 2015. Are there productivity gains from insecticide
applications in rice production? In K.L. Heong, M.M. Escalada, J. Cheng, eds. Rice Planthoppers, pp. 179-189.
Beijing, Springer. 231 pp.
Hortle, K., Troeung, R., Lieng, S. 2008. Yield and value of the wild fishery of rice fields in Battambang Province,
near the Tonle Sap Lake, Cambodia. MRC Technical Paper No. 18, Mekong River Commission.
Horgan, F. G., & Crisol, E. 2013. Hybrid rice and insect herbivores in Asia. Entomologia Experimentalis Et
Applicata, 148(1) : 1-19.
Hunter, D., Burlingame, B., Remans, R., Borelli, T., Cogill, B., Coradin, L., & Valenti, R. 2015. Biodiversity and
nutrition. World Health Organisation/Secretariat of the UN Convention on Biological Diversity.
IRRI. 2009. Rice Growing Environments. Retrieved 24.8.2015 from
http://www.knowledgebank.irri.org/submergedsoils/index.php/rice-growing-environments/lesson-2
IRRI. n.d. Control of rice diseases. Retrieved 13.8.2015 from
http://www.knowledgebank.irri.org/ericeproduction/PDF_&_Docs/Control_of_Rice_Diseases.pdf
IRRI. n.d. b. Control of rice insect pests. Retrieved 18.8.2015 from
http://www.knowledgebank.irri.org/ericeproduction/PDF_&_Docs/Control_of_rice_insect_pests.pdf
Javier, E. L. 1997. Rice ecosystems and varieties. Rice production in Cambodia. Los Baños, Philippines, IRRI, pp.
39-81.
Jongdee, B., Pantuwan, G., Fukai, S., & Fischer, K. 2006. Improving drought tolerance in rainfed lowland rice: an
example from Thailand. Agricul. Water Manage., 80(1): 225-240.
Kato, Y., & Katsura, K. 2014. Rice adaptation to aerobic soils: physiological considerations and implications for
agronomy. Plant Prod. Sci., 17(1): 1-12.
Kayeke, J., Sibuga, P.K., Msaky, J. J., & Mbwaga, A. 2007. Green Manure and inorganic Fertiliser as Management
Strategies for Witchweed and Upland Rice. Afr. Crop Sci. J., 15 (4): 161-171.
Kennedy, G., Burlingame, B. 2003. Analysis of food composition data on rice from a plant genetic resources
perspective. Journal of Food Chemistry, 80 (4), 589-596(8).
Kreye, C., Bouman, B.A.M., Castañeda, A.R., Lampayan, R.M., Faronilo, J.E., Lactaoen, A.T., & Fernandez, L.
2009. Possible causes of yield failure in tropical aerobic rice. Field Crops Res., 111: 197-206.
Krupnik, T. J., Shennan, C., Settle, W. H., Demont, M., Ndiaye, A. B., & Rodenburg, J. 2012. Improving irrigated
rice production in the Senegal River Valley through experiential learning and innovation. Agricul. Sys., 109: 101–
112.
Krupnik, T.J., Six, J., Ladha, J.K., Paine, M.J., & van Kessel, C. 2004. An Assessment of Fertilizer Nitrogen Recovery
Efficiency by Grain. In A.R. Mosier, K.J. Syers, & J.R. Freney, eds. Agriculture and the Nitrogen Cycle, pp. 193–207.
Covelo, California, USA, The Scientific Committee Problems of the Environment Island Press. 344 pp.
Koricheva, J., & Gurevitch, J. 2013. Place of meta-analysis among other methods of research synthesis.
Handbook of meta-analysis in ecology and evolution, 3-13.
51
Le Mer, J., & Roger, P. 2001. Production, oxidation, emission and consumption of methane by soils: a review.
Eur. J. Soil Biol., 37(1): 25–50.
Lehmann, J, & Rondon, M. 2006. Bio-char soil management on highly weathered soils in the humid tropics. In
Uphoff N et al., eds. Biological Approaches to Sustainable Soil Systems, pp.517-530. Boca Raton , FL, CRC Press.
784 pp.
Lou, Y. G., Zhang, G. R., Zhang, W. Q., Hu, Y., & Zhang, J. 2013. Biological control of rice insect pests in China. Biol.
Control, 67(1): 8-20.
Makara, O., Sarom, M., Nesbitt, H. J., Fukai, S., & Basnayake, J. 2001. Rice production systems in Cambodia. In
Increased lowland rice production in the Mekong Region: Proceedings of an International Workshop held in
Vientiane, Laos, 30 October-2 November 2000. pp. 43-51. Australian Centre for International Agricultural
Research (ACIAR).
McCarty, J. L. 2011. Remote Sensing-Based Estimates of Annual and Seasonal Emissions from Crop Residue Burning in the Contiguous United States. J. Air Waste Manage. Ass., 61:22-34. Millennium Ecosystem Assessment. 2015. Chapter 12: Nutrient Cycling, Volume 1: Current State and Trends,
Global Assessment Reports, 2005, Millennium Ecosystem Assessment. Retrieved 10.8.2015 from
http://www.millenniumassessment.org/documents/document.281.aspx.pdf
Minasny, B., McBratney, A. B., Hong, S. Y., Sulaeman, Y., Kim, M. S., Zhang, Y. S., & Han, K. H. 2012. Continuous
rice cropping has been sequestering carbon in soils in Java and South Korea for the past 30 years. Global
Biogeochem. Cycles, 26(3).
Ladha, J. K. (Ed.). 1998. Rainfed lowland rice: advances in nutrient management research. IRRI.
Ladha, J. K., Pathak, H., Krupnik, T. J., Six, J. & van Kessel, C. 2005. Efficiency of fertilizer nitrogen in cereal
production: retrospects and prospects, Adv. Agron., 87: 85–156.
Lehmann, J. & Rondon, M. 2006. Bio-char soil management on highly weathered soils in the humid tropics. In N.
Uphoff et al, eds. Biological Approaches to Sustainable Soil Systems, pp. 517-530. Boca Raton, FL, CRC Press. 874
pp.
Linquist, B. A., Brouder, S.M. & Hill, J.E. 2006. Winter straw and water management effects on soil nitrogen dynamics in California rice systems. Agron. J., 98:1050-1059.
Lou, Y., Zhang, G. , Zhang, W., Hu, Y., & Zhang, J. 2013. Biological control of rice insect pests in China. Biol.
Control, 67 (1): 8–20.
Mohanty, M., Probert, M.E., Reddy, K.S., Dalal, R.C., Rao, A.S., & Menzies, N.W. 2010. Modelling N
mineralization from high C: N rice and wheat crop residues. In 19th World Congress of Soil Science.
Mullie, W., Verwey, P., Berends, A., Sene, F., Koeman, J., & Everts, J. 1991. The impact of Furadan 3G
(carbofuran) applications on aquatic macroinvertebrates in irrigated rice in Senegal. Arch. Environ. Contam.
Toxicol., 20(2): 177–182.
Muthmainnah, D. 2015. Integrated swamp management to promote sustainability of fish resources: Case Study
in Pampangan Swamp. Presentation at the FAO Global Conference on Inland Fisheries, Freshwater, Fish and the
Future, 26-28 Jan 2015, Rome Italy.
Ortiz-Monasterio, I., Wassmann, R., Govaerts, B., Hosen, Y., Katayanagi, N. & Verhulst, N. 2010. Greenhouse
gas mitigation in the main cereal systems: Rice, wheat and maize.
52
Parsons, K. C., Mineau, P., & Renfrew, R. B. 2010. Effects of pesticide use in rice fields on birds. Waterbirds,
33(sp1): 193–218.
Pheng, S., Olofsdotter, M., Jahn, G., & Adkins, S. 2010. Use of phytotoxic rice crop residues for weed
management. Weed Biol. Manage., 10(3): 176-184.
Peng, S., Bouman, B., Visperas, R.M., Castañeda, A., Nie, L. & Park, H-K. 2006. Comparison between aerobic and
flooded rice in the tropics: Agronomic performance in an eight-season experiment. Field Crops Res., 96: 252-259
Pittelkow, C. M., Adviento-Borbe, M. A., Hill, J. E., Six, J., van Kessel, C. & Linquist, B.A. 2013. Yield-scaled global warming potential of annual nitrous oxide and methane emissions from continuously flooded rice in response to nitrogen input. Agricul. Ecosys. Environ., 177: 10-20. Pittelkow, C.M., Liang, X., Linquist, B.A., Van Groenigen, K.J., Lee, J., Lundy, M.E., van Gestel, N., Six, J.,
Venterea, R.T. & van Kessel, C. 2015. Productivity limits and potentials of the principles of conservation
agriculture. Nature, 517(7534): 365-368.
Raun, W. R. & Johnson, G.V. 1999. Improving nitrogen use efficiency for cereal production, Agron. J., 91: 357–
63.
Rickman, J. F., Pyseth, M., Bunna, S., and Sinath, P. 2001. Direct seeding of rice in Cambodia. In Increased Rice
Production in The Mekong Region, ACIAR Proceedings 101.
Rizo-Patrón, V, F., Kumar, A., McCoy Colton, M. B., Springer, M., & Trama, F. A. 2013. Macroinvertebrate
communities as bioindicators of water quality in conventional and organic irrigated rice fields in Guanacaste,
Costa Rica. Ecol. Ind., 29: 68-78.
Rui, W. & Zhang, W. 2010. Effect size and duration of recommended management practices on carbon
sequestration in paddy field in Yangtze Delta Plain of China: A meta-analysis. Agricul. Ecosys. Environ., (135): 199-
205.
Ruark, M. D., Linquist, B.A., Six, J., van Kessel, C., Greer, C.A., Mutters, R.G. & Hill, J.E. 2010. Seasonal Losses of Dissolved Organic Carbon and Total Dissolved Solids from Rice Production Systems in Northern California. J. Environ. Qual., 39: 304-313.
Saleh, A. F. M., & Bhuiyan, S. I. 1995. Crop and rain water management strategies for increasing productivity of
rainfed lowland rice systems. Agricul. Sys., 49(3): 259-276.
Sanchez, M. 2011. Ácaro de la vaina del arroz (Steneotarsonemus spinki). CONARROZ, Costa Rica.
Sander, B. O., Samson, M., & Buresh, R. J. 2014. Methane and nitrous oxide emissions from flooded rice fields
as affected by water and straw management between rice crops. Geoderma, 235: 355-362.
Searchinger, T., Adhya, T., Linquist, B., Wassmann, R. & Yan, X. 2014. Wetting and Drying: Reducing
Greenhouse Gas Emissions and Saving Water from Rice Production. World Resources Report, WRI.
Settle, W.H., Ariawan, H., Astuti, E.T., Cahyana, W., Hakim, A.L., Hindayana, D. & Lestari, A.S. 1996. Managing
Tropical Rice Pests Through Conservation of Generalist Natural Enemies and Alternative Prey. Ecology, 77: 1975–
1988.
Settle, W., & Hama Garba, M. 2009. The West African regional integrated production and pest management
programme. Rome, FAO.
Singleton, G.R., Belmain, S.R., Brown, P.R., Hardy, B. 2010. Rodent outbreaks: ecology and impacts. IRRI. pp289.

53
De Silva, S., Johnstone, R . & Try, T. 2013. Rice and Fish: Impacts of Intensification of Rice Cultivation. IWMI -
ACIAR Investing in Water Management to Improve Productivity of Rice-Based Farming Systems in Cambodia
Project. Issue brief #4, June 2013.
Smil, V. 1999. Nitrogen in crop production: An account of global flows. Global Biogeochem. Cycles, 13: 647-662.
Spangenberg, J.H., Douguet, J.M., Settele, J., Heong, K.L. 2015. Escaping the lock-in of continuous insecticide
spraying in rice: Developing an integrated ecological and socio-political DPSIR analysis. Ecol. Modell., 295: 188-
195.
Tilman, D. 1999. Global environmental impacts of agricultural expansion: the need for sustainable and efficient
practices. Proc. Natl. Acad. Sci. USA., 96: 5995–6000.
Truc, N.T.T., Sumalde, Z.M., Espaldon, M.V.O., Pacardo, E.P., Rapera, C.L., & Palis, F.G. 2012. Farmers’
Awareness and Factors Affecting Adoption of Rapid Composting in Mekong Delta, Vietnam and Central Luzon,
Philippines. J. Environ. Sci. Manage., 15(2).
Van Asten, P., Van Bodegom, P., Mulder, L., & Kropff, M. 2005. Effect of straw application on rice yields and
nutrient availability on an alkaline and a pH-neutral soil in a Sahelian irrigation scheme. Nutr. Cycl. Agroecosys.,
72(3): 255–266.
Van Buyten, E., Banaay, C.G.B., Vera Cruz, C. & Háfte, M. 2013. Identity and variability of Pythium species
associated with yield decline in aerobic rice cultivation in the Philippines. Plant Pathol., 62: 139-153.
Ventura, W. & Watanabe, I. 1978. Growth inhibition due to continuous cropping of dryland rice and other crops.
Soil Sci. Plant Nutr., 24: 375-389.
Veres, A., Petit, S., Conord, C., & Lavigne, C. 2013. Does landscape composition affect pest abundance and their
control by natural enemies? A review. Agricul. Ecosys. Environ., 166: 110-117.
Wade, L.J., Fukai, S., Samson, B.K., Ali, A., & Mazid, M.A. 1999. Rainfed lowland rice: physical environment and
cultivar requirements. Field Crops Res., 64(1): 3-12.
Wassmann, R., Buendia, L. V., Lantin, R. S., Bueno, C. S., Lubigan, L. A., Umali, A., Nocon, N., Javellana, A. &
Neue, H. U. 2000a. Mechanisms of crop management impact on methane emissions from rice fields in Los Baños,
Philippines. Nutr. Cycl. Agroecosys., 58(1-3): 107-119.
Wassmann, R., Lantin, R. S., Neue, H. U., Buendia, L. V., Corton, T. M., & Lu, Y. 2000b. Characterization of
methane emissions from rice fields in Asia. III. Mitigation options and future research needs. Nutr. Cycl.
Agroecosys., 58(1-3): 23-36.
Xie, J, Hu, L., Tang, L., Wu, X., Li, N., Yuan, J., Yang, H., Zhang, J., Luo, S. & Chen, X. 2011. Ecological mechanisms
underlying the sustainability of the agricultural heritage rice–fish coculture system. PNAS 2011 108 (50) E1381–
E1387.
Yamada, K., Yanagisawa, M., Kono, Y., & Nawata, E. 2004. Use of Natural Biological Resources and Their Roles
in Household Food Security in Northwest Laos (Special Issue: Sustainable Agro-resources Management in the
Mountainous Region of Mainland Southeast Asia).
Zhang, F.S., Cui, Z.L., Wang, J.Q., Li, C.J. & Chen, X.P. 2007. Current status of soil and plant nutrient management
in China and improvement strategies. Chin. Bull. Bot., 24: 687–94.
54
ANNEX 1
STUDIES THAT WERE INCLUDED IN THE VOTE COUNTING ANALYSIS
Alazard, D., & Becker, M. 1987. Aeschynomene as green manure for rice.Plant Soil, 101 (1): 141-143.
Belder, P., Bouman, B. A. M., Cabangon, R., Guoan, L., Quilang, E. J. P., Yuanhua, L., & Tuong, T. P. 2004. Effect
of water-saving irrigation on rice yield and water use in typical lowland conditions in Asia. Agr. Water
Manage., 65(3): 193-210.
Bhagat, R. M., Bhuiyan, S. I., & Moody, K. 1999. Water, tillage and weed management options for wet seeded
rice in the Philippines. Soil Till. Res., 52(1): 51-58.
Bird, J. A., Pettygrove, G. S., & Eadie, J. M. 2000. The impact of waterfowl foraging on the decomposition of rice
straw: mutual benefits for rice growers and waterfowl. J Appl. Ecol., 37(5): 728-741.
Bossio, D. A., Horwath, W. R., Mutters, R. G., & van Kessel, C. 1999. Methane pool and flux dynamics in a rice
field following straw incorporation. Soil Biol. Biochem., 31(9): 1313-1322.
Bouman, B. A. M., Peng, S., Castaneda, A. R., & Visperas, R. M. 2005. Yield and water use of irrigated tropical
aerobic rice systems. Agr. Water Manage., 74(2): 87-105.
Bronson, K. F., Neue, H. U., Abao, E., & Singh, U. 1997. Automated chamber measurements of methane and
nitrous oxide flux in a flooded rice soil: II. Fallow period emissions. Soil Sci. Am. J., 61(3): 988-993.
CARDI. 2010. Annual Report 2010. Cambodian Agricultural Research and Development Institute. Phnom Penh,
Cambodia.
Chaudhary, R. C. & Nesbitt, H. J. 1993. Modern varieties MVs yield more than traditional varieties TVs in
Cambodia regardless of fertilizer use. In IRRI, eds. International Rice Research Notes, 18 (2), pp 24-25. Manilla,
Philippines, International Rice Research Institute. 46 pp.
Cintas, N. A., & Webster, R. K. 2001. Effects of rice straw management on Sclerotium oryzae inoculum, stem rot
severity, and yield of rice in California. Plant dis., 85(11): 1140-1144.
Corton, T. M., Bajita, J. B., Grospe, F. S., Pamplona, R. R., Asis Jr, C. A., Wassmann, R., & Buendia, L. V. 2000.
Methane emission from irrigated and intensively managed rice fields in Central Luzon (Philippines). In R.
Wassmann, R.S. Lantin & H.U. Neue, eds. Methane Emissions from Major Rice Ecosystems in Asia, pp. 37-53.
Netherlands, Springer. 398 pp.
Day, J. H., & Colwell, M. A. 1998. Waterbird communities in rice fields subjected to different post-harvest
treatments. Colon. Waterbird., 185-197.
de Vries, M. E., Rodenburg, J., Bado, B. V., Sow, A., Leffelaar, P. A., & Giller, K. E. 2010. Rice production with
less irrigation water is possible in a Sahelian environment. Field Crop. Res., 116(1): 154-164.
Dumas-Johansen, M. K. 2009. Effect of the system of rice intensification on livelihood strategies for Cambodian
farmers and possible carbon storage and mitigation possibilities for greenhouse gas emissions. Master Thesis,
University of Copenhagen.

55
Eagle, A. J., Bird, J. A., Horwath, W. R., Linquist, B. A., Brouder, S. M., Hill, J. E., & van Kessel, C. 2000. Rice yield
and nitrogen utilization efficiency under alternative straw management practices. 1096-1103.
Eagle, A. J., Bird, J. A., Hill, J. E., Horwath, W. R., & van Kessel, C. 2001. Nitrogen dynamics and fertilizer use
efficiency in rice following straw incorporation and winter flooding. Agron. J., 93(6): 1346-1354.
Gibson, K. D., Hill, J. E., Foin, T. C., Caton, B. P., & Fischer, A. J. 2001. Water-seeded rice cultivars differ in ability
to interfere with watergrass. Agron. J., 93(2): 326-332.
Haefele, S. M., Konboon, Y., Wongboon, W., Amarante, S., Maarifat, A. A., Pfeiffer, E. M., & Knoblauch, C.
2011. Effects and fate of biochar from rice residues in rice-based systems. Field Crop. Res., 121(3): 430-440.
Häfele, S., Wopereis, M. C. S., Boivin, P., & N'Diaye, A. M. 1999. Effect of puddling on soil desalinization and rice
seedling survival in the Senegal River Delta. Soil Till. Res., 51(1): 35-46.
Ikeda, H., Kamoshita, A., Yamagishi, J., Ouk, M., & Lor, B. 2008. Assessment of management of direct seeded
rice production under different water conditions in Cambodia. Paddy Water Environ., 6(1): 91-103.
Kanfany, G., El-Namaky, R., Ndiaye, K., Traore, K., & Ortiz, R. 2014. Assessment of Rice Inbred Lines and Hybrids
under Low Fertilizer Levels in Senegal. Sustainability, 6(3): 1153-1162.
Koma, Y. S. 2002. Ecological System of Rice Intensification (SRI) in Cambodia. CEDAC Field Document.
Koricheva, J., Gurevitch, J. & Mengersen, K. 2013. Handbook of meta-analysis in ecology and evolution.
Princeton University Press.
Kreye, C., Bouman, B. A. M., Reversat, G., Fernandez, L., Cruz, C. V., Elazegui, F., & Llorca, L. 2009. Biotic and
abiotic causes of yield failure in tropical aerobic rice. Field Crop. Res., 112(1): 97-106.
Kreye, C., Bouman, B. A. M., Castañeda, A. R., Lampayan, R. M., Faronilo, J. E., Lactaoen, A. T., & Fernandez, L.
2009b. Possible causes of yield failure in tropical aerobic rice. Field Crop. Res., 111(3): 197-206.
Krupnik, T. J., Rodenburg, J., Shennan, C., Mbaye, D., & Haden, V. R. 2010. Trade-offs between rice yield, weed
competition and water use in the Senegal River Valley.
Krupnik, T. J., Shennan, C., & Rodenburg, J. 2012a. Yield, water productivity and nutrient balances under the
System of Rice Intensification and Recommended Management Practices in the Sahel. Field Crop. Res.,130: 155-
167.
Krupnik, T. J., Shennan, C., Settle, W. H., Demont, M., Ndiaye, A. B., & Rodenburg, J. 2012b. Improving irrigated
rice production in the Senegal River Valley through experiential learning and innovation. Agr. Sys., 109: 101-112.
Lampayan, R. M., Samoy-Pascual, K. C., Sibayan, E. B., Ella, V. B., Jayag, O. P., Cabangon, R. J., & Bouman, B. A.
M. 2014. Effects of alternate wetting and drying (AWD) threshold level and plant seedling age on crop
performance, water input, and water productivity of transplanted rice in Central Luzon, Philippines. Paddy Water
Environ., 1-13.
Lampayan, R. M., Rejesus, R. M., Singleton, G. R., & Bouman, B. A. 2015. Adoption and economics of alternate
wetting and drying water management for irrigated lowland rice. Field Crop. Res., 170: 95-108.
Linquist, B. A., Brouder, S. M., & Hill, J. E. 2006. Winter straw and water management effects on soil nitrogen
dynamics in California rice systems. Agron. J., 98(4): 1050-1059.
56
Lundy, M. E., Fischer, A. J., Van Kessel, C., Hill, J. E., Ruark, M. D., & Linquist, B. A. 2010. Surface-applied calcium
phosphate stimulates weed emergence in flooded rice. Weed Technol., 24(3): 295-302.
Ly, P., Jensen, L. S., Bruun, T. B., Rutz, D., & de Neergaard, A. 2012. The system of rice intensification: adapted
practices, reported outcomes and their relevance in Cambodia. Agr. Sys., 113: 16-27.
Ly, P., Jensen, L. S., Bruun, T. B., & de Neergaard, A. 2013. Methane (CH4) and nitrous oxide (N2O) emissions
from the system of rice intensification (SRI) under a rain-fed lowland rice ecosystem in Cambodia. Nutr. Cycl.
Agroecosys., 97(1-3): 13-27.
Molina, E., & Rodríguez, J. H. 2012. Fertilización con N, P, K y S, y curvas de absorción de nutrimentos en arroz
var. CFX 18 en Guanacaste. Agron. Costarric., 36(1).
Mullie, W. C., Verwey, P. J., Berends, A. G., Sene, F., Koeman, J. H., & Everts, J. W. 1991. The impact of Furadan
3G (carbofuran) applications on aquatic macroinvertebrates in irrigated rice in Senegal. Arch. Environ. Contam.
Toxicol., 20(2): 177-182.
Miyazato, T., Mohammed R.A., Lazaro R.C. 2010. Irrigation management transfer (IMT) and system of rice
intensification (SRI) practice in the Philippines. Paddy and Water Environment 8(1):91-97.
Ndoye, I., Dreyfus, B., & Becker, M. 1996. Sesbania rostrata as green manure for lowland rice in Casamance
(Senegal). Trop. Agric., 73(3): 234-237.
Nguyen, Y. T. B., Kamoshita, A., Araki, Y., & Ouk, M. 2011. Farmers' Management Practices and Grain Yield of
Rice in Response to Different Water Environments in Kamping Puoy Irrigation Rehabilitation Area in Northwest
Cambodia. Plant Prod. Sci., 14(4): 377-390.
Peng, S., Bouman, B., Visperas, R. M., Castañeda, A., Nie, L., & Park, H. K. 2006. Comparison between aerobic
and flooded rice in the tropics: agronomic performance in an eight-season experiment. Field Crop. Res., 96(2):
252-259.
Pheav, S., Bell, R. W., White, P. F., & Kirk, G. J. D. 2005. Phosphorus mass balances for successive crops of
fertilised rainfed rice on a sandy lowland soil. Nutr. Cycl. Agroecosys., 73(2-3): 277-292.
Peng, S., Olofsdotter, M., Jahn, G., & Adkins, S. 2010. Use of phytotoxic rice crop residues for weed
management. Weed Boil. Manag., 10(3): 176-184.
Pittelkow, C. M., Fischer, A. J., Moechnig, M. J., Hill, J. E., Koffler, K. B., Mutters, R. G., & Linquist, B. A. 2012.
Agronomic productivity and nitrogen requirements of alternative tillage and crop establishment systems for
improved weed control in direct-seeded rice. Field Crop. Res., 130: 128-137.
Quirós-Herrera, R., & Ramírez-Martínez, C. 2006. Evaluation of nitrogen fertilization in a flooded rice
field. Agronomía Mesoamericana, 17(2): 179-188.
Redeker, K. R., Wang, N. Y., Low, J. C., McMillan, A., Tyler, S. C., & Cicerone, R. J. 2000. Emissions of methyl
halides and methane from rice paddies. Science, 290(5493): 966-969.
Riara, H. F., Van Brandt, H., Diop, A. M., & Van Hove, C. 1987. Azolla and its use in rice culture in West Africa.
In Workshop on Azolla Use, Fuzhou, Fujian (China), 31 Mar-5 Apr 1985.
Rickman, J. F., Pyseth, M., Bunna, S., Sinath, P., Fukai, S., & Basnayake, J. 2001. Direct seeding of rice in
Cambodia. In S. Fukai, eds. Increased lowland rice production in the Mekong Region: Proceedings of an
International Workshop held in Vientiane, Laos, 30 October-2 November 2000, pp. 60-65. Australian Centre for
International Agricultural Research (ACIAR).
57
Rinaudo, G., Dreyfus, B., & Dommergues, Y. 1983. Sesbania rostrata green manure and the nitrogen content of
rice crop and soil. Soil Biol. Biochem., 15(1): 111-113.
Rizo-Patron, F. V., Kumar, A., Colton, M. B. M., Springer, M., & Trama, F. A. 2013. Macroinvertebrate
communities as bioindicators of water quality in conventional and organic irrigated rice fields in Guanacaste,
Costa Rica. Ecol. Indic., 29: 68-78.
Rodenburg, J., Demont, M., Sow, A., & Dieng, I. 2014. Bird, weed and interaction effects on yield of irrigated
lowland rice. Crop Prot., 66: 46-52.
Ruark, M. D., Linquist, B. A., Six, J., Van Kessel, C., Greer, C. A., Mutters, R. G., & Hill, J. E. 2010. Seasonal losses
of dissolved organic carbon and total dissolved solids from rice production systems in northern California. J.
Environ. Qual, 39(1): 304-313.
Sander, B. O., Samson, M., & Buresh, R. J. 2014. Methane and nitrous oxide emissions from flooded rice fields
as affected by water and straw management between rice crops. Geoderma, 235: 355-362.
Satyanarayana, A., Thiyagarajan, T. M., & Uphoff, N. 2007. Opportunities for water saving with higher yield from
the system of rice intensification. Irrigation Sci., 25(2): 99-115.
Schmidt, A., John, K., Arida, G., Auge, H., Brandl, R., Horgan, F. G., Hotes, S., Marquez, L., Radermacher, N.,
Settele, J., Wolters, V. & Schädler, M. Unpublished. Short-term effects of residue management on
decomposition in irrigated rice fields are not related to changes in decomposer community structure.
Shackley, S., Carter, S., Knowles, T., Middelink, E., Haefele, S., Sohi, S., & Haszeldine, S. 2012. Sustainable
gasification–biochar systems? A case-study of rice-husk gasification in Cambodia, Part I: Context, chemical
properties, environmental and health and safety issues. Energy Policy, 42: 49-58.
Sokchea, H., Borin, K., & Preston, T. 2013. Effect of biochar from rice husks (combusted in a downdraft gasifier
or a paddy rice dryer) on production of rice fertilized with biodigester effluent or urea. Livest. Res. Rural Dev, 25.
Sudhir-Yadav, Evangelista G, Faronilo J, Humphreys E, Henry A, Fernandez L. 2014. Establishment method
effects on crop performance and water productivity of irrigate rice in the tropics. Field Crops Research.
Tabbal, D. F., Bouman, B. A. M., Bhuiyan, S. I., Sibayan, E. B., & Sattar, M. A. 2002. On-farm strategies for
reducing water input in irrigated rice; case studies in the Philippines. Agr. Water Manage., 56(2): 93-112.
Van der Gon, D. H. A. C., & Neue, H. U. 1994. Impact of gypsum application on the methane emission from a
wetland rice field. Global Biogeochem. Cy., 8(2): 127-134.
Vang, S., Vanndy, L., Pros, K., Bell, R. W., & White, P. 2010. Trends in productivity and nutrient dynamics under
improved soil nutrient management techniques for rice in the rainfed lowlands of Cambodia.
Vang, S. 2011. Country report on rice cultivation practice: cultivation practice: Cambodia. Expert Meeting 2‐3
June 2011. Cambodian Agricultural Research & Development Institute. Bangkok, Thailand.
Vang, S. 2013. Sustainable agricultural production – Focus on rice production in (Cambodia). Capacity Building
Workshop 29‐31 May 2013. Cambodian Agricultural Research & Development Institute. Bangkok, Thailand.
Wassmann, R., Buendia, L. V., Lantin, R. S., Bueno, C. S., Lubigan, L. A., Umali, A., & Neue, H. U. 2000.
Mechanisms of crop management impact on methane emissions from rice fields in Los Baños, Philippines. Nutr.
Cycl. Agroecosys., 58(1-3): 107-119.

58
Wiangsamut, B., Lafarge, T., & Mendoza, T. C. 2013. Water productivity of 2 rice genotypes grown in different
soil textures and irrigated through continuous flooding and alternate wetting and drying irrigation methods. J.
.Agr. Techn., 9(6).
Wu, G. W., & Wilson, L. T. 1997. Growth and yield response of rice to rice water weevil injury. Environ.
Entomol., 26(6): 1191-1201.
Yadav, S., Evangelista, G., Faronilo, J., Humphreys, E., Henry, A., & Fernandez, L. 2014. Establishment method
effects on crop performance and water productivity of irrigated rice in the tropics. Field Crop. Res., 166: 112-127.
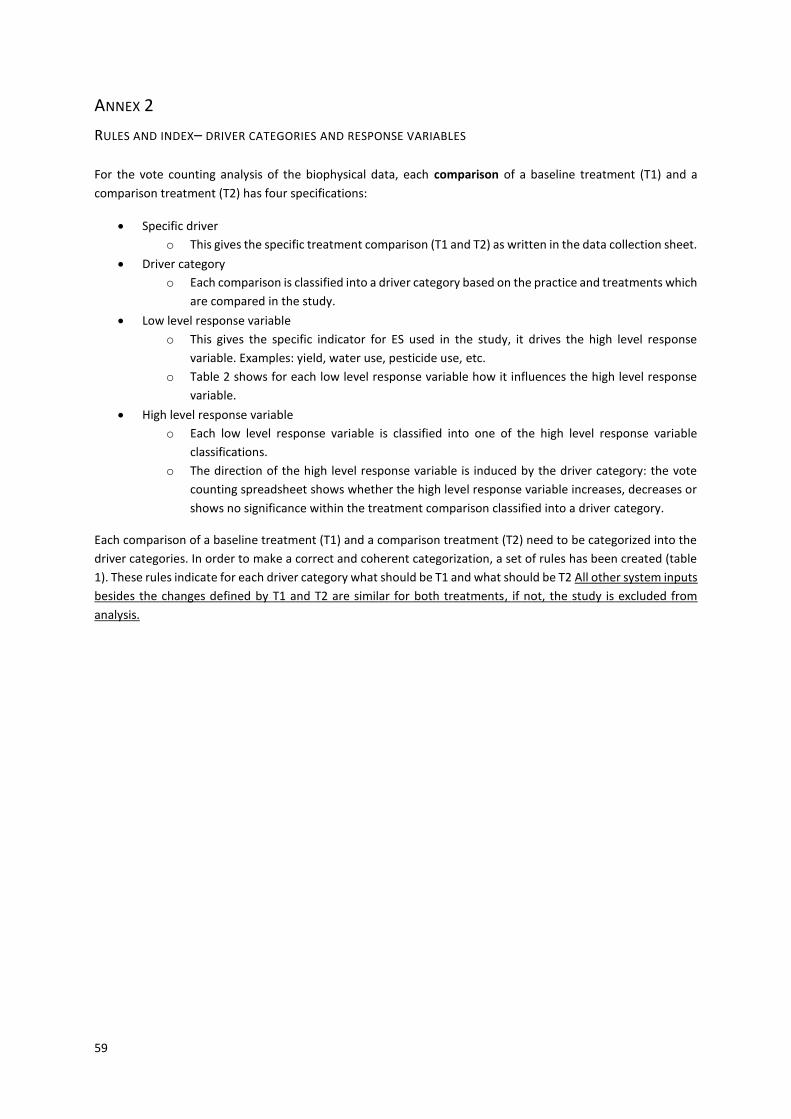
59
ANNEX 2
RULES AND INDEX– DRIVER CATEGORIES AND RESPONSE VARIABLES
For the vote counting analysis of the biophysical data, each comparison of a baseline treatment (T1) and a
comparison treatment (T2) has four specifications:
Specific driver
o This gives the specific treatment comparison (T1 and T2) as written in the data collection sheet.
Driver category
o Each comparison is classified into a driver category based on the practice and treatments which
are compared in the study.
Low level response variable
o This gives the specific indicator for ES used in the study, it drives the high level response
variable. Examples: yield, water use, pesticide use, etc.
o Table 2 shows for each low level response variable how it influences the high level response
variable.
High level response variable
o Each low level response variable is classified into one of the high level response variable
classifications.
o The direction of the high level response variable is induced by the driver category: the vote
counting spreadsheet shows whether the high level response variable increases, decreases or
shows no significance within the treatment comparison classified into a driver category.
Each comparison of a baseline treatment (T1) and a comparison treatment (T2) need to be categorized into the
driver categories. In order to make a correct and coherent categorization, a set of rules has been created (table
1). These rules indicate for each driver category what should be T1 and what should be T2 All other system inputs
besides the changes defined by T1 and T2 are similar for both treatments, if not, the study is excluded from
analysis.
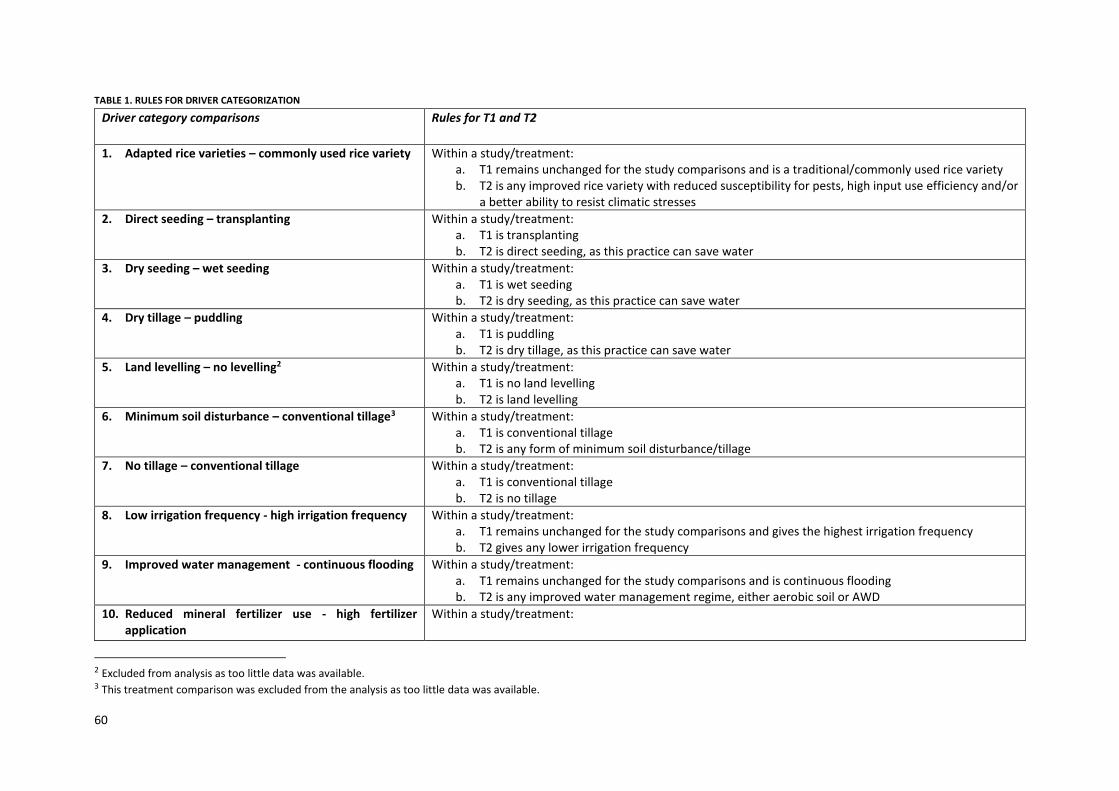
60
TABLE 1. RULES FOR DRIVER CATEGORIZATION
Driver category comparisons Rules for T1 and T2
1. Adapted rice varieties – commonly used rice variety Within a study/treatment: a. T1 remains unchanged for the study comparisons and is a traditional/commonly used rice variety b. T2 is any improved rice variety with reduced susceptibility for pests, high input use efficiency and/or
a better ability to resist climatic stresses
2. Direct seeding – transplanting Within a study/treatment: a. T1 is transplanting b. T2 is direct seeding, as this practice can save water
3. Dry seeding – wet seeding Within a study/treatment: a. T1 is wet seeding b. T2 is dry seeding, as this practice can save water
4. Dry tillage – puddling Within a study/treatment: a. T1 is puddling b. T2 is dry tillage, as this practice can save water
5. Land levelling – no levelling2 Within a study/treatment: a. T1 is no land levelling b. T2 is land levelling
6. Minimum soil disturbance – conventional tillage3 Within a study/treatment: a. T1 is conventional tillage b. T2 is any form of minimum soil disturbance/tillage
7. No tillage – conventional tillage Within a study/treatment: a. T1 is conventional tillage b. T2 is no tillage
8. Low irrigation frequency - high irrigation frequency Within a study/treatment: a. T1 remains unchanged for the study comparisons and gives the highest irrigation frequency b. T2 gives any lower irrigation frequency
9. Improved water management - continuous flooding Within a study/treatment: a. T1 remains unchanged for the study comparisons and is continuous flooding b. T2 is any improved water management regime, either aerobic soil or AWD
10. Reduced mineral fertilizer use - high fertilizer application
Within a study/treatment:
2 Excluded from analysis as too little data was available. 3 This treatment comparison was excluded from the analysis as too little data was available.
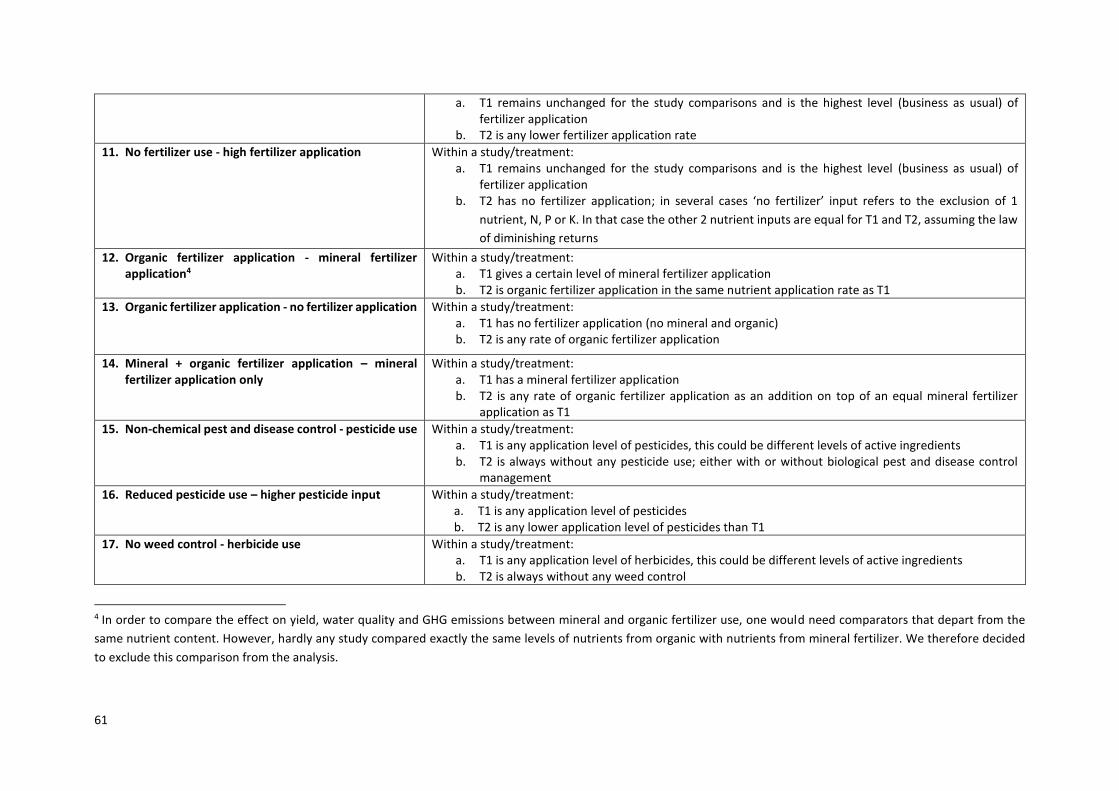
61
a. T1 remains unchanged for the study comparisons and is the highest level (business as usual) of fertilizer application
b. T2 is any lower fertilizer application rate
11. No fertilizer use - high fertilizer application Within a study/treatment: a. T1 remains unchanged for the study comparisons and is the highest level (business as usual) of
fertilizer application b. T2 has no fertilizer application; in several cases ‘no fertilizer’ input refers to the exclusion of 1
nutrient, N, P or K. In that case the other 2 nutrient inputs are equal for T1 and T2, assuming the law
of diminishing returns
12. Organic fertilizer application - mineral fertilizer application4
Within a study/treatment: a. T1 gives a certain level of mineral fertilizer application b. T2 is organic fertilizer application in the same nutrient application rate as T1
13. Organic fertilizer application - no fertilizer application Within a study/treatment: a. T1 has no fertilizer application (no mineral and organic) b. T2 is any rate of organic fertilizer application
14. Mineral + organic fertilizer application – mineral fertilizer application only
Within a study/treatment: a. T1 has a mineral fertilizer application b. T2 is any rate of organic fertilizer application as an addition on top of an equal mineral fertilizer
application as T1
15. Non-chemical pest and disease control - pesticide use Within a study/treatment: a. T1 is any application level of pesticides, this could be different levels of active ingredients b. T2 is always without any pesticide use; either with or without biological pest and disease control
management
16. Reduced pesticide use – higher pesticide input Within a study/treatment: a. T1 is any application level of pesticides b. T2 is any lower application level of pesticides than T1
17. No weed control - herbicide use Within a study/treatment: a. T1 is any application level of herbicides, this could be different levels of active ingredients b. T2 is always without any weed control
4 In order to compare the effect on yield, water quality and GHG emissions between mineral and organic fertilizer use, one would need comparators that depart from the
same nutrient content. However, hardly any study compared exactly the same levels of nutrients from organic with nutrients from mineral fertilizer. We therefore decided
to exclude this comparison from the analysis.

62
18. Biological weed control and hand weeding - herbicide use
Within a study/treatment: a. T1 is any application level of herbicides, this could be different levels of active ingredients b. T2 is always without any herbicide use and includes any form of biological weed control together
with hand weeding
19. Hand weeding – herbicide use Within a study/treatment: a. T1 is any application level of herbicides, this could be different levels of active ingredients b. T2 is always without any herbicide use and includes hand weeding
20. Reduced herbicide use – higher herbicide input Within a study/treatment: a. T1 is any application level of herbicides b. T2 is any lower application level of herbicides than T1
21. System of rice intensification - Conventional management practices
Within a study/treatment: a. T1 is conventional/recommended management practices b. T2 is system or rice intensification
22. Organic - conventional agriculture Within a study/treatment: a. T1 is conventional agriculture b. T2 is organic agriculture
23. Ducks – no ducks Within a study/treatment: a. T1 is a rice field without ducks b. T2 is a rice field with ducks
24. Stripped harvest – conventional harvest5 Within a study/treatment: a. T1 is conventional harvest b. T2 is stripped harvest
25. Winter flooding – no winter flooding (California) Within a study/treatment: a. T1 is no winter flooding (including dry or puddled flooding) b. T2 is winter flooding
26. Straw incorporation – straw burning (California) Within a study/treatment: a. T1 is straw burning b. T2 is straw incorporation in the soil
27. Straw baling and removal – straw burning (California) Within a study/treatment: a. T1 is straw burning b. T2 is straw baling and removal
28. Straw rolling – straw burning (California) Within a study/treatment: a. T1 is straw burning b. T2 is straw rolling
5 This treatment comparison was excluded from the analysis as too little data was available.

63
TABLE 2. INDEX: HIGH LEVEL AND LOW LEVEL RESPONSE VARIABLES
High level response variable classifications Low level response variables of ES: How an increase in the following low level response variables (indicators of ES) affect the high level response variables
1. Soil fertility enhancement a. Total Carbon content: Increase in soil fertility b. Total N content: Increase in soil fertility c. Soil available P status: Increase in soil fertility d. Soil exchangeable K status: Increase in soil fertility e. Soil exchangeable Ca status: Increase in soil fertility f. Soil exchangeable Mg status: Increase in soil fertility g. Soil exchangeable Na status: Increase in soil fertility h. Bulk density: Decrease in soil fertility; the lower the bulk density the better the physical soil fertility status. i. Nutrient balance: Increase in soil fertility j. Reduction in salt content: Increase in soil fertility k. Straw decomposition: Increase in soil fertility, nutrient become available for plants l. Nitrogen recovery efficiency: Increase in soil fertility
2. Pest control a. Weed biomass: decrease pest control b. Weed cover: decrease pest control c. Pythium frequency: decrease pest control d. Fusarium frequency: decrease pest control e. Pythium frequency: decrease pest control f. Root nematode galls: decrease pest control g. Sclerotium oryzae inoculum: decrease pest control
3. Food production a. Yield: Increase in food production b. Seed survival rate: Potential to increase in yield and therefore in food production c. Dry biomass of the rice produced: Increase in food production
4. Water quality a. Pesticide use: Decrease water quality; pesticides can end up in the water and cause pollution6 b. Electral Conductivity drainage water: Decrease of water quality by increasing the salinity level c. Biomass aquatic macroinvertebrates: Increase of water quality, as water pollution could decrease aquatic fauna
abundance d. Mean Macroinvertabrates family richness: Increase of water quality, as water pollution could decrease (aquatic)
fauna abundance
6 Although pesticide use is an input and not a direct response variable, we considered pesticide use as a low level response variable because data on water pollution was limited. Especially when rice is grown under flooded conditions pesticides get in direct contact with open water resulting in water contamination. Research has shown a negative relation between pesticide input in flooded systems and water quality.
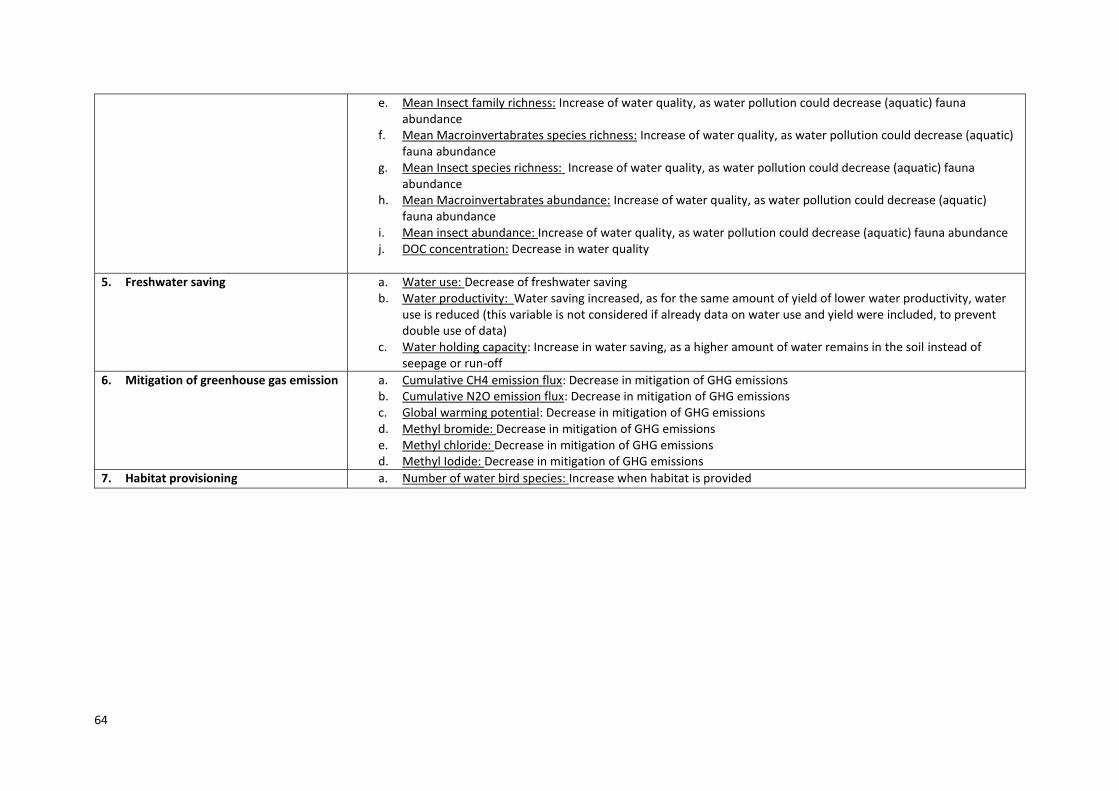
64
e. Mean Insect family richness: Increase of water quality, as water pollution could decrease (aquatic) fauna abundance
f. Mean Macroinvertabrates species richness: Increase of water quality, as water pollution could decrease (aquatic) fauna abundance
g. Mean Insect species richness: Increase of water quality, as water pollution could decrease (aquatic) fauna abundance
h. Mean Macroinvertabrates abundance: Increase of water quality, as water pollution could decrease (aquatic) fauna abundance
i. Mean insect abundance: Increase of water quality, as water pollution could decrease (aquatic) fauna abundance j. DOC concentration: Decrease in water quality
5. Freshwater saving a. Water use: Decrease of freshwater saving b. Water productivity: Water saving increased, as for the same amount of yield of lower water productivity, water
use is reduced (this variable is not considered if already data on water use and yield were included, to prevent double use of data)
c. Water holding capacity: Increase in water saving, as a higher amount of water remains in the soil instead of seepage or run-off
6. Mitigation of greenhouse gas emission a. Cumulative CH4 emission flux: Decrease in mitigation of GHG emissions b. Cumulative N2O emission flux: Decrease in mitigation of GHG emissions c. Global warming potential: Decrease in mitigation of GHG emissions d. Methyl bromide: Decrease in mitigation of GHG emissions e. Methyl chloride: Decrease in mitigation of GHG emissions d. Methyl Iodide: Decrease in mitigation of GHG emissions
7. Habitat provisioning a. Number of water bird species: Increase when habitat is provided