Embed Size (px)
Citation preview
Analysis of Cell Death in the TrochlearNucleus of the Chick Embryo: Calibrationof the Optical Disector Counting Method
Reveals Systematic Bias
WILLIAM J. HATTON AND CHRISTOPHER S. VON BARTHELD*Department of Physiology and Cell Biology, University of Nevada School of Medicine,
Reno, Nevada 89557
ABSTRACTDetection of changes in numbers of neurons is essential for an understanding of neuronal
development, function, and death. Optical disector counting is claimed to be the most efficienttechnique to estimate accurate numbers of neurons in microscopic sections. We calibrated theoptical disector by comparison with three-dimensional reconstructions from serial sectionsand determined how accurate this technique is relative to conventional profile countingmethods. The calibration was performed on the trochlear nucleus in developing chicks.Optical disector estimates, when obtained as generally recommended, were about 25% lowerthan the actual number of neurons. This underestimate was caused by a nonuniform(bimodal) distribution of neuronal nuclei in paraffin and plastic (glycolmethacrylate) sections,but not in cryosections. The density of neurons in the core of the paraffin and plastic sectionswas substantially lower than in the upper and lower margins of these sections. Accurateestimates of neuronal numbers were obtained with a modified optical disector method thatsampled the entire extent of tissue sections. Previous estimates of numbers of trochlearneurons in the developing chick have been controversial. The modified (calibrated) opticaldisector method revealed that the number of trochlear neurons decreased from about 1,600 atday 8.5 of incubation (embryonic day, [E]8.5) to about 900 at the time of hatching. Numbers ofpyknotic nuclei peaked at E6 and at E9, revealing an additional early, but postproliferative,period of cell death. Taken together, these data emphasize the need for calibration ofstereological counting techniques and the need to examine sampling strategies for potentialbias. J. Comp. Neurol. 409:169–186, 1999. r 1999 Wiley-Liss, Inc.
Indexing terms: stereology; motor neuron; serial reconstruction; profile counting; sampling;
nucleolus
Changes in the number of neurons are essential for thematching of neuronal numbers with the size of their targetand a proper function of neuronal circuits. The regulationof neuronal numbers by programmed developmental celldeath (apoptosis) has been recognized as an importantfeature of neurodevelopment (Oppenheim, 1991; Clarkeand Oppenheim, 1995). Accurate assessment of neuronalnumbers during development or during disease states iscritical for an understanding of biological processes. Yetthe accuracy of techniques used for quantitation of neuro-nal numbers is controversial, and fundamental questionsabout the generality of developmental cell death amongspecific populations of neurons remain to be answered.
Numerous studies have quantified neuronal populationsover the past decades by using conventional countingtechniques. With the introduction of new stereological
methods (Howard et al., 1985; Gundersen, 1986; Williamsand Rakic, 1988; Bolender et al., 1991; Coggeshall, 1992;Coggeshall and Lekan, 1996; Howard and Reed, 1998), it isnecessary to determine how accurate the new techniquesare compared to conventional ones by calibration withresults from three-dimensional reconstructions of serialsections. The extent of differences between the conven-
Grant sponsor: Howard Hughes Medical Institute Undergraduate Biologi-cal Sciences Education Program; Grant number: 71192-516901; Grantsponsor: NIH; Grant number: NS 35931.
*Correspondence to: Dr. C.S. von Bartheld, Department of Physiologyand Cell Biology, Mailstop 352, University of Nevada School of Medicine,Reno, NV 89557. E-mail: [email protected]
Received 18 December 1998; Revised 12 March 1999; Accepted 26 March1999
THE JOURNAL OF COMPARATIVE NEUROLOGY 409:169–186 (1999)
r 1999 WILEY-LISS, INC.
tional and the modern counting methods is currentlycontroversial (Coggeshall et al., 1990; Nurcombe et al.,1991; Pakkenberg et al., 1991; Coggeshall, 1992; Clarke,1992, 1993; Clarke and Oppenheim, 1995; Popken andFarel, 1996, 1997). The optical disector or ‘‘3D-countingbox’’ is claimed to be the most efficient method for thecounting of neurons in microscopic sections (Williams andRakic, 1988; West et al., 1991; Coggeshall and Lekan,1996; Hedreen, 1998a; Howard and Reed, 1998). Whereasthe physical disector has been calibrated (Coggeshall etal., 1990; Pover and Coggeshall, 1991; Popken and Farel,1996, 1997), to our knowledge there is no informationavailable about the accuracy of the optical disector.
Here, we quantified motoneurons in the trochlear nucleusof the developing chicken and examined the timing andextent as well as morphological and immunological fea-tures of their cell death. The trochlear nucleus providesseveral advantages for the comparison and calibration ofcounting methods, including a relatively small number ofneurons, a homogeneous cell population, a nucleus withwell-defined borders, and a known period of normal devel-opmental cell death (Cowan and Wenger, 1967; Steljeset al., 1999). Accurate assessment of neuronal num-bers is essential for the identification of trophic fac-tors and their evaluation on motoneuron survival, inboth the basic and clinical neurosciences (Oppenheim,1996).
We compared the conventional profile counting methodwith the optical disector method which is thought to be anunbiased stereological technique, and with the number ofneurons as determined by three-dimensional reconstruc-tions from serial sections through the entire nucleus. Wereport a major flaw in the optical disector method whenapplied to paraffin or plastic sections as generally recom-mended, and we describe a modification of the techniquewhich minimizes the bias that is introduced by samplingonly the core of the tissue section. Using a modified opticaldisector technique, we established the extent and timing oftrochlear neuronal death during embryogenesis. We alsodetermined the percentages of pyknotic cells in the devel-oping trochlear nucleus and the percentages of motorneurons with one and two nucleoli. We verified that asubstantial amount of cell death occurs in the trochlearnucleus at embryonic day (E)9–15, and we showed inaddition that this period of cell death is preceded by anearlier period of cell death at E6. Our data help to evaluatethe accuracy of conventional, profile-based counting meth-ods, to compare them with those of new stereologicaltechniques, and to precisely reveal the advantages andlimitations of each of these methods.
MATERIALS AND METHODS
Animals
Fertilized White Leghorn chicken eggs were obtainedfrom local suppliers and were incubated in humidifiedincubators at 37.0–37.5°C. Approximately 500 chickeneggs were used. The ages of chick embryos were verified atthe time of killing according to Hamburger and Hamilton(1951). When animals were perfused, they were anesthe-tized with sodium-pentobarbital (Nembutal, 50 mg/kgbody weight) prior to surgery. Experimental procedureswere conducted in compliance with the Policy on the Use ofAnimals in Neuroscience Research and were approved bythe local animal care committee.
Profile counting
Embryos from ages E8 to postnatal day (P)1 weredecapitated and the brains were fixed in Methacarn (metha-nol, chloroform, and acetic acid at volume ratios of 6:3:1),or they were anesthetized and perfused with 4% parafor-maldehyde (PFA). The brains were dissected, dehydrated,embedded in paraffin, and sectioned with disposable metalblades on an AO Spencer 820 rotary microtome with anominal setting at 12, 15, or 25 µm. The section thicknesswas verified to be accurate within 8%. Every fourth sectionwas collected on silane-coated slides and stained withthionin. Every nuclear neuronal profile or every nuclearneuronal profile containing at least one nucleolus wascounted using a 1003 oil objective with a numericalaperture of 1.25. The height of the nucleus or the stainednucleolar material was measured in the z-axis on a NikonOptiphot microscope using a microcator. The averageparticle height (measured in the z-axis) was applied to theAbercrombie correction factor (Abercrombie, 1946) to cor-rect for overcounting due to split nuclei or split nucleoli.
Traditional optical disector counts
Embryos from ages E7 to P1 were fixed in Methacarn,the brains were dissected, dehydrated in methanol, clearedin xylene, and embedded in paraffin (Paraplast Plus,Oxford Labware, St. Louis, MO) at 58°C, solidified at 4°C,and sectioned at 25 µm at room temperature. Everysection through the trochlear nucleus was collected onsilane-coated slides and stained with thionin. Cavalieri’smethod (Cavalieri, 1635) was employed for volume estima-tion. Every other section of known thickness (t) containingtrochlear neuronal nuclei was examined after the firstsection was selected from a random starting point (sam-pling constant k 5 2; Howard and Reed, 1998). Sectionsthus selected were viewed with a 403 objective on a NikonOptiphot microscope equipped with a drawing tube (Nikon1.25). A two-dimensional (2D) point intersect overlay (agrid with 100 points situated in the eye piece) wascalibrated so that the area associated with each point (Ap)was known (20 3 20 µm 5 400 µm2). The grid was thensuperimposed over each selected section and the totalnumber of points (Sp) falling on regions containing troch-lear neurons in each section was counted. The volume ofthe trochlear nucleus (Vnucleus) was then estimated by:Vnucleus 5 Sp 3 Ap 3 t 3 k.
The numerical density (Nv) of neuronal nuclei wasestimated by using the optical disector. Every other sectionwas selected as described above (Howard and Reed, 1998).Sections were viewed using a 1003 oil objective with anumerical aperture of 1.25 on the same microscope previ-ously described. The microscope was fitted with a microca-tor (MFC-1 focus controller and DRV-1-OPTI drive, Ap-plied Scientific Instrumentation, Inc., Eugene, OR),allowing a digital reading of the z-axis to be made forsection thickness with a resolution of 0.1µm. In a definedoptical disector of 80 µm in the x and y axes and 10 µm inthe z-axis, positioned centrally within the section thick-ness (< 23 µm after coverslipping), every nucleus with adiameter larger than 6 µm falling within the countingframe and not intersecting the exclusion line anywherealong its infinite boundaries was counted using an unbi-ased counting rule (Gundersen et al., 1988; Yaegashi et al.,1993; Howard and Reed, 1998). The upper and the lower4–5 µm of the tissue sections were avoided to minimize the
170 W.J. HATTON AND C.S. VON BARTHELD
impact of cutting artifacts and uneven surfaces, as recom-mended (Gundersen et al., 1988; Williams and Rakic,1988; Nurcombe et al., 1991; West et al., 1991; West, 1993;Hedreen, 1998b). For each sample, the thickness of thesection was determined by focusing from the upper to thelower surface of the tissue section at 1003 oil, and theaverage section thickness was used to define the referencevolume. The numerical density (Nv) of neuronal nuclei wasaveraged for the samples (about 100 neurons were sampledfor each nucleus) and calculated by combining the refer-ence volume (VRef) of the trochlear nucleus (estimated bythe Cavalieri method) to obtain the total number (N) oftrochlear motor neurons: N 5 Vref 3 Nv.
Modified optical disector counts: Samplingthe entire tissue section
Instead of using only the core 5–15 µm of the tissuesection for sampling the density of neuronal nuclei, theentire tissue section (0–23 µm) was sampled. Using anunbiased counting rule, neurons were scored only whenthe center of the neuronal nucleus was within the countingframe and within the tissue section, as determined byfocusing through the tissue section using a microcatorwith a resolution of 0.1 µm. The center of the nucleus wasdefined by focusing on the clear nuclear edge and the mostclearly defined nuclear chromatin (Nurcombe et al., 1991;Howard and Reed, 1998). It was confirmed empirically bysampling in the core that counting centers of nucleiresulted in the same numerical density as counting wholenuclei. Scoring the position of the center of nuclei ratherthan the borders of nuclei allows one to effectively utilizethe radius of the nucleus as a ‘‘guard space’’ to betteridentify fragments of nuclei and their position within thesection. The aforementioned processed tissue sectionswere also utilized for serial 3D reconstruction.
3D reconstructions of the trochlear nucleusat P1 and E12.5
The heads of two hatchling animals (P1) and one 12.5-day-old chicken embryo were fixed with Methacarn, thebrains were dissected and embedded in paraffin. One P1brain was sectioned at 12 µm, the other two brains weresectioned at 25 µm. Every section through the trochlearnucleus was collected in uniform orientation on silane-coated slides, stained with thionin, and examined under403 and 1003 oil immersion on a Nikon Optiphot micro-scope as described above. A grid with 100 squares in theeye piece was used at 403 to prepare camera lucidadrawings of each neuron within the trochlear nucleus,provided its nucleus was larger than 6 µm in diameter.Separate drawings of neurons were made on three sets oftransparencies to document the position of their nucleiwithin the tissue section. Different colors were used fordifferent sets of transparencies to identify nuclei intersect-ing the upper surface, the lower surface, and for the nucleinot intersecting with either surface. The tracings from theupper focal plane in one section and the lower focal planein the next were overlaid to identify neurons with nuclearfragments in both sections. Blood vessels were used aslandmarks to unambiguously define the position of theoverlays. Split neuronal nuclei were drawn in a cameralucida at 1003 oil for verification. This was done touniquely identify those neurons which would have beencounted twice with profile counting methods. The totalnumber of positively identified neurons was determined
for each section. One P1 trochlear nucleus with 922 motorneurons was reconstructed entirely from 25-µm sections,another P1 nucleus was partially reconstructed (123 neurons)from 12-µm sections. Four sections from the E12.5 embryowith 207 neurons were reconstructed and compared withestimates obtained by the modified optical disector (see below).
Tissue processing for density measurements
The position of nuclei in the z-axis of tissue sections wasdetermined for trochlear nuclei from P1 animals fixed withMethacarn or 4% PFA and embedded in paraffin, glycol-methacrylate, or frozen in optimal cutting temperature(OCT) compound. Embedding in paraffin followed proce-dures described above. In addition to the basic procedure,some paraffin-embedded tissue was sectioned on two otherrotary microtomes, and some tissue was sectioned by usingresharpenable steel knives (obtained from AO Spencer orJung, Heidelberg, Germany).
For embedding in plastic, brains were fixed in Meth-acarn, the midbrain containing the trochlear nucleus wastrimmed to the appropriate size (about 4 3 4 3 4 mm3),and was dehydrated through graded ethanols (30 minutesin 70%, 95%, 100%). The tissue was infiltrated in glycol-methacrylate monomer in three changes overnight on atissue rotator according to the manufacturer’s protocol(H700 embedding kit, Energy Beam Sciences, Agawam,MA). The tissue was polymerized overnight in a 1.5-mlplastic Eppendorf microfuge tube filled to the top withpolymerizing agent (to exclude air). All of the above stepswere carried out at room temperature. Tissue was sec-tioned at about 25 or 40 µm on an AO Spencer 820 rotarymicrotome using disposable steel blades (low profile Ac-cuedge microtome blades from Sakura Finetek USA, Inc,Torrance, CA). Prior to sectioning with metal blades, thesurface of the block was wetted as described (Yaegashi etal., 1993). Some brains were cut with a glass knife on aSorvall Porter Blum MT2-B Ultramicrotome at about20–30 or 35–40µm. Sections were floated in a cold waterbath, collected on silane-coated slides, and dried for 20minutes at 45°C. The sections were stained with thioninfor 5 minutes, washed in running tap water and dehy-drated through graded alcohols. Sections were cover-slipped with Corning #1–1/2 cover glasses using DPXmounting medium (BDH Laboratory Supplies, Toronto,Canada) or left without coverslips (40-µm sections only).
For cryosectioning, embryos were perfused with 4%PFA, the brains were dissected, postfixed 4 hours, washedin phosphate-buffered saline (PBS, pH 7.4, 30 minutes),and sunk overnight in 30% sucrose. Brains were embeddedin Tissue-Tekt OCT compound (Sakura Finetek USA,Inc.), frozen on dry ice, and cut at 40–60 µm in a Leica CM3500 cryostat using disposable metal blades. Sections werethawed onto gelatine-coated slides, dried at room tempera-ture, washed with PBS, and stained with thionin. Slideswere washed in water, dehydrated through ethanols,cleared in xylene, and coverslipped with DPX.
Measurements of the distribution ofneuronal nuclei in tissue sections
The nominal section thickness on the microtome wasadjusted so that the final dehydrated and coverslippedsections were 20- to 30- or 35- to 40-µm-thick. Randomsamples were taken and for each neuronal nucleus withinthe counting frame, the z-axis position of the center of thenucleus was recorded as seen in the digital read-out of the
CALIBRATION OF THE OPTICAL DISECTOR 171
microcator. Split nucleoli were counted only when thecenter of the nucleus was clearly within the tissue section.This was established by comparing the radius (half of thediameter measured in the x/y axes) with the z-axis frag-ment of the nucleus. For each condition, 4–8 groups of150–200 neurons each were scored and grouped in 10histograms from the percentiles 0–100 through the tissuesection from the upper surface (0%) to the lower surface(100%). The upper and the lower surfaces were defined byfocusing on any stained particles; the abundant small glialcells proved particularly useful to avoid potential biaseswhich could have been introduced by considering only theneuronal nuclei. The percentile transformation was neces-sary for comparison between conditions and sections be-cause the section thickness varied in the dehydrated,coverslipped sections. In addition to measurements of‘‘centers of nuclei,’’ the distribution of centers of nucleoliwas determined in paraffin and plastic sections (totalnumber of particles counted 5 374), because nucleoli areless likely than nuclei to be split by the knife and thereforeprovide better resolution (Coggeshall and Chung, 1984). Inaddition to trochlear neurons, the density distribution ofPurkinje cells in the cerebellum of one P1 chick wasdetermined. The density distribution analyses were usedto calculate the predicted bias of the optical disectormethod resulting from sampling in different regions of thecore (30–70% of 20- to 30-µm sections; 20–80% of 20- to30-µm or 35- to 40-µm sections; or 10–90% of 35- to 40-µmsections, as summarized in Table 1).
Nuclear diameters
Tissue from the same preparations (P1 trochlear nuclei)was used to determine the diameters of neuronal nuclei inthe x-, y-, and z-axes. Tissue was fixed in Methacarn andembedded in paraffin or glycolmethacrylate, or fixed in 4%PFA and cryosectioned in OCT compound. Measurementswere made in sections of 20–40 µm. For each sampledneuron, the position of the center of the neuronal nucleuswithin the tissue section was recorded. Diameters weremeasured in the x- and y-axes by projection of a stagemicrometer through the camera lucida. Diameters in the
z-axis were measured by focusing the microcator. Whennuclei were truncated at the surface and the z-axis frag-ment was smaller than the radius, they were discarded.When nuclei were truncated at the surface and the z-axisfragment was larger than the radius (r), the diameter (d)was calculated as d 5 2r. The average diameters measuredin the x/y and z-axes were compared for the paraffin,plastic, and the cryosections. To detect possible differentialcompression of nuclei in the margins versus the core, theaverage diameters of nuclei in the margins (0–30 and70–100 percentiles) and the core (40–60 percentile) werecompared for the readings in the z-axis and the x-y axes.Between 15 and 20 randomly selected neuronal nucleiwere examined for each type of tissue. Statistical signifi-cance of differences was determined by Student’s t-test.
Tracing with 125I-labeled BDNF
Human recombinant brain-derived neurotrophic factor(BDNF) was obtained from Regeneron (Tarrytown, NY;courtesy of Dr. R. Lindsay). BDNF was radio-iodinatedwith lactoperoxidase to a specific activity of 95 cpm/pg asdescribed (von Bartheld, 1998). Disposable insulin sy-ringes were used to inject about 10–50 ng 125I-BDNF in thesuperior oblique eye muscle of 16- to 18-day-old chickembryos. Embryos were perfused with 4% PFA 20 hourslater, the brains were dissected, dehydrated, and embed-ded in paraffin. Serial sections of 10 µm through thetrochlear nucleus were collected on slides, dipped in NTB-2emulsion (Kodak, Rochester, NY) and processed for autora-diography with exposure times of 5–7 weeks. Sectionswere developed, counterstained with thionin, and thenumber of silver grains over each cell in three sectionsthrough the trochlear nucleus was counted, provided thatthe nucleus of the cell could be clearly identified. Thediameter of the nucleus was measured for 100 cells and thepercentage of unlabeled and labeled cells (more than fivegrains overlying the cell body) was plotted in histogramsas a function of the nuclear diameter. The labeling inten-sity of 5 grains/cell was chosen as a cut-off based on thebackground labeling seen in the contralateral trochlearnucleus within the same tissue sections.
Pyknotic counts
Embryos from ages E4.5–E17 (n 5 24) were fixed withMethacarn or 4% PFA. The brains were dissected, embed-ded in paraffin, and sectioned at 25 µm. Some of thePFA-fixed brains were frozen in OCT and were cryosec-tioned. Sections through the trochlear nucleus were col-lected on silane- or gelatin-coated slides, stained withthionin, and examined under 1003 oil immersion on aNikon Eclipse E600 microscope. Pyknotic nuclei werecounted only when nucleoli were clearly identified ascondensed or were swollen and enlarged (Clarke, 1990;Clarke and Oppenheim, 1995). Red blood cells which canresemble pyknotic nuclei (Coggeshall et al., 1993) wereexcluded from these counts due to their different morphol-ogy and position within blood vessels or capillaries. Twoseries of cryosections at E6 were processed with 0.05%diaminobenzidine (DAB) and 0.015% hydrogen peroxide tolabel endogenous peroxidase present in red blood cells.These sections were counterstained with thionin and thepyknotic cells quantified as described above. The numberof pyknotic nuclei in the entire nucleus (E8.5–E17) orsample sections (E4.5–E8) were divided by the total num-ber of healthy neurons in the same material as determined
TABLE 1. Influence of Fixatives, Embedding Media, Section Thickness,and Cutting Devices on the Distribution of Neuronal Nuclei in Tissue
Sections and Predicted Bias of the Optical Disector Method
Fixative Paraformaldehyde Methacarn
Embedding Methacrylate (Cryo)3 Methacrylate Paraffin
Knife Metal Metal Metal Glass Metal1 Glass
Distribution ofneuronalnuclei
Bimodal x x x x xUniform x
Predicted bias of theoptical disectormethod [%]
20 to 30-µmsection2
Core 5 30–70% 223.5 10.5 215.9 210.5 216.5 26.8Core 5 20–80% 214.0 13.6 26.4 216.7 214.5 23.6
35- to 40-µmsection2
Core 5 30–70% 23.6 23.8 27.7Core 5 20–80% 21.6 25.9 29.2Core 5 10–90% 28.9 24.0
1Disposable blades and resharpenable blades showed the same result.2Section thickness after dehydration and coverslipping.3Cryo, cryostat; embedding in Tissue-Tekt OCT compound.
172 W.J. HATTON AND C.S. VON BARTHELD
by profile counting or by the optical disector method (seeabove) in the same material. A total of 7,556 healthy neuronsin E4.5–E8.5 embryos, and 7,175 neurons from E9–E17 em-bryos were examined. The ratio of pyknotic figures/healthyneuron was plotted as a function of age to determine the onset,peak, and end of normal developmental cell death.
Nucleolar counts
Embryos from ages E7 to P1 were fixed with Methacarn,the brains were dissected, embedded in paraffin, andsectioned at 25µm. Sections through the trochlear nucleuswere collected on silane-coated slides, stained with thi-onin, and examined under 403 and 1003 oil immersion ona Nikon Optiphot microscope as described above. A gridwith 100 squares in the eye piece was used at 1003 oil andevery nucleus in the randomly placed counting framewithin the core of the 25-µm section was examined. Thenumber of nucleoli was determined only when the entirenucleus was within the tissue section.
Choline acetyltransferase (ChAT)immunocytochemistry
Embryos from E6–10 were anesthetized with Nembutaland perfused with 1.5–4% PFA. Whole heads or the brainswere dissected, postfixed, and cryoprotected overnight in30% sucrose. Cryosections of 30-µm thickness were cutand every third, sixth, or tenth section through the troch-lear nucleus was collected on gelatine-coated slides. Alter-nating sections from each animal were stained with thi-onin. Nonspecific binding was blocked by preincubation in2% normal goat serum and 0.1% Triton X-100 in PBS for 1hour. Polyclonal antibody to ChAT (#1465) was obtainedfrom Dr. Epstein, University of Wisconsin, Madison(Johnson and Epstein, 1986; von Bartheld et al., 1991).After preincubation with 2% normal goat serum, theantibody was used at 1:1,000, 1:4,000, or 10,000 dilutionsin PBS containing 2% normal goat serum, 1% bovineserum albumin, and 0.1% Triton X-100, for 24 hours at4°C. Secondary antibody was biotinylated goat-anti-rabbitIgG (Jackson Immunoresearch Labs, West Grove, PA),diluted 1:500 in PBS. Sections were incubated with strep-tavidin-peroxidase complex (Zymed Labs, South San Fran-cisco, CA), diluted 1:500 in PBS, for 1 hour at roomtemperature (RT), and the peroxidase was visualized with0.05% DAB in 0.05 M Tris-HCl buffer, pH 7.6, and 0.015%H2O2, for 5–10 minutes. Following each incubation, thesections were rinsed for approximately 30–60 minutes inseveral changes of PBS. The specificity of labeling wastested by omitting the primary antibody or antiserum.Sections were dehydrated and coverslipped with DPX.
NADPH enzyme histochemistry
Embryos were deeply anesthetized with Nembutal (50mg/kg body weight) and perfused intracardially with 4%PFA in 0.1 M PBS, pH 7.4. The brains were removed fromthe skull and postfixed in the same fixative for 2–12 hours,followed by cryoprotection in PBS containing 30% sucrose.The brains were embedded in OCT compound (Tissue-Tekt, Sakura Finetek USA, Inc.), frozen on dry ice andsectioned in the transverse plane on a cryostat. Thesections (25 µm) were collected on gelatine-coated glassslides and dried for 20 minutes. Sections were rinsed 3times in PBS. Nitric oxide synthase was localized histo-chemically by the nicotinamide adenine dinucleotide phos-phate (NADPH)-diaphorase staining technique (Scherer-
Singler et al., 1983; von Bartheld and Schober, 1997).Sections were incubated in a reaction medium containing0.1 M PBS, pH 7.4, 0.2% Triton X-100, 0.1–0.5% beta-nicotinamide adenine dinucleotide phosphate reduced Na4-salt (NADPH, Sigma, St. Louis, MO), and 0.03–0.15%nitro blue tetrazolium chloride (NBT, Sigma) for 1 hour at37°C. The slides were rinsed 3 times in PBS, some sectionswere counterstained with neutral red, dehydrated andembedded in DPX.
RESULTS
Trochlear nucleus: Comparisonof counting methods
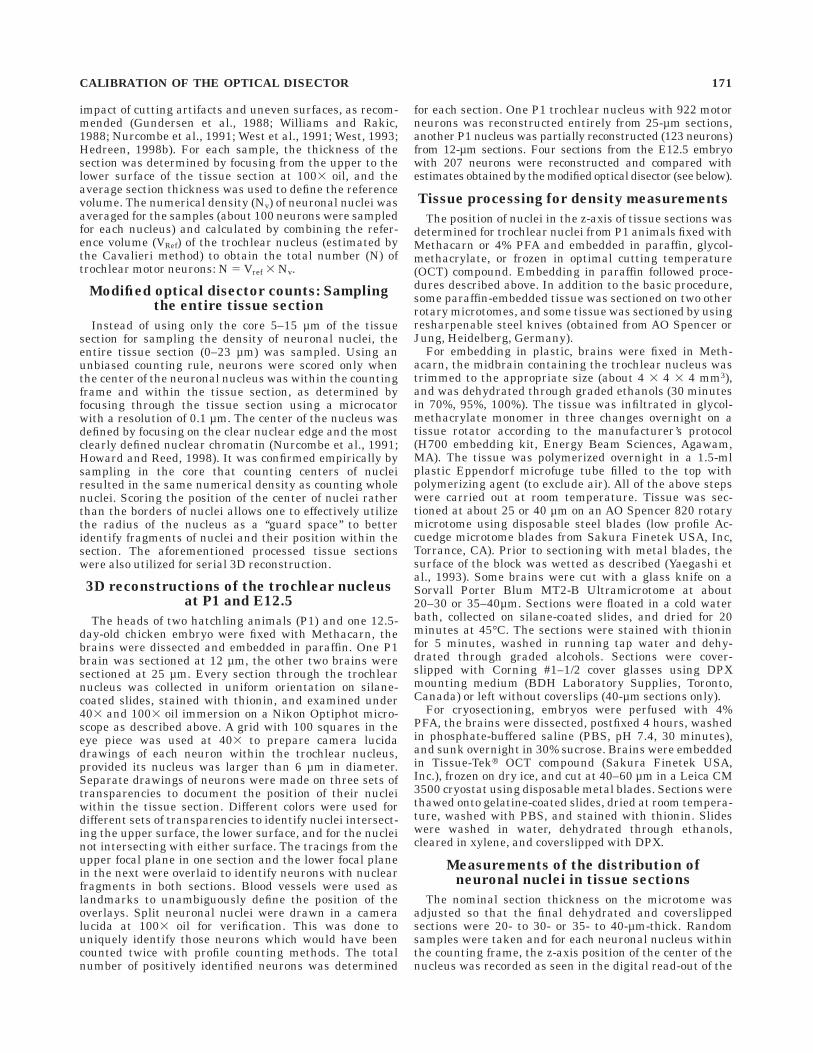
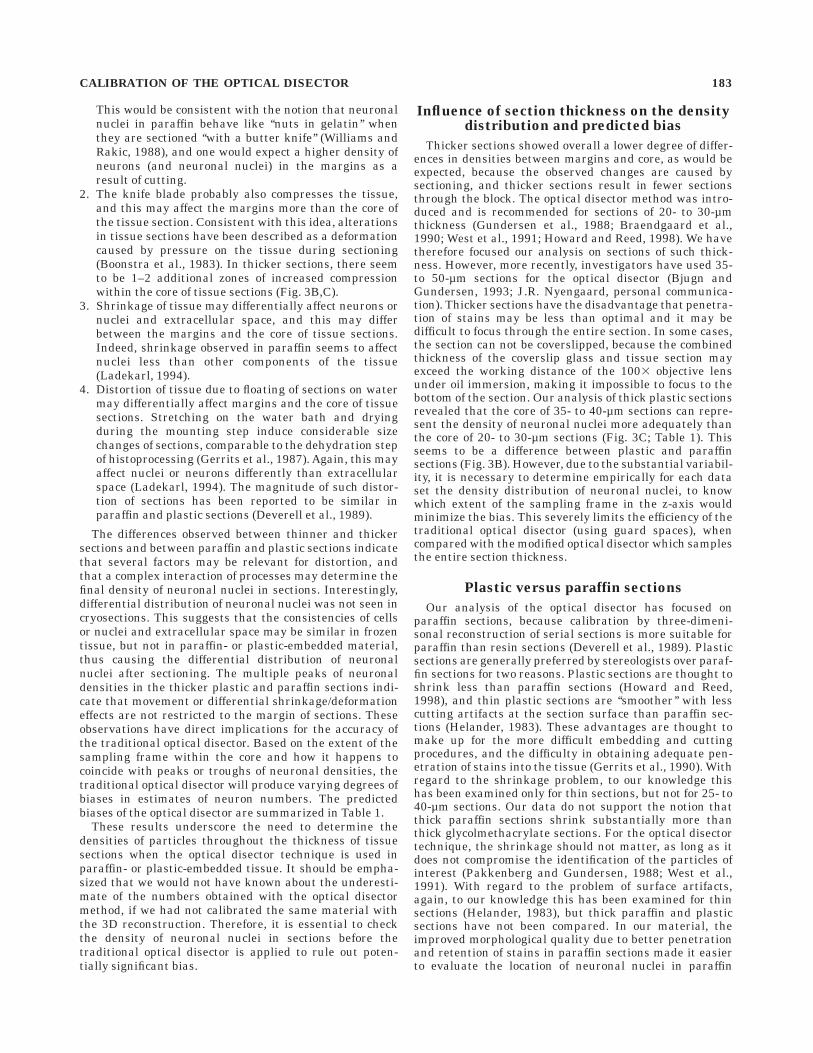
The trochlear nucleus (MIV) of the hatchling chick is awell-demarcated, compact nucleus at the dorsomedialventricular surface of the midbrain tegmentum (Fig. 1A).The MIV contains relatively large neurons with coarseNissl bodies (Fig. 1B). The MIV nucleus is distinct fromthe oculomotor nuclear complex which is located furtherrostrally. To evaluate the accuracy of different countingmethods, the number of motoneurons in the MIV of thehatchling chick (P1) was determined by profile counting,by optical disector counting, and by three-dimensional(3D) serial reconstructions of the entire nucleus.
Profile counting is usually done in 10- to 15-µm sections.Profile-counting of trochlear neuronal nuclei in paraffinsections of P1 chicks resulted in 1,084 identifiable nuclearprofiles in 15-µm sections and 1,452 profiles in 12-µmsections. Nuclei with diameters of less than 6µm (presump-tive interneurons, nuclear diameters of 5–6µm, or glialcells, nuclear diameters of 3–4µm) were not included inthese counts. Using an average nuclear diameter of 9.47and 9.96 µm, respectively, the values for motor neuronstransform into estimates of 665 and 793 neurons with theAbercrombie correction factor (Abercrombie, 1946). Whenonly those profiles of motoneuronal nuclei were countedwhich contained at least one nucleolus in the 12-µmsections, 1,212 profiles were counted. Using an averagenucleolar height of 3 µm, these profiles transform into932 neurons with the Abercrombie formula to account fordouble-counting of split nucleoli. When the same analysiswas performed for a P1 trochlear nucleus sectionedat 25 µm, the estimates were 740 (611, S.E.M.) for thenuclear profile counts and 838 (614, S.E.M.) for the nucleolarprofile counts (afterAbercrombie-correction, Fig. 1C).
A partial reconstruction of the trochlear nucleus (123neurons) was made for a series of 12-µm sections. Splitneuronal nuclei which resulted in fragments on either sideof two adjacent sections were identified and were found toaccount for 6.5% of the neuronal nuclei in these sections.The 3D reconstruction of parts of the nucleus (3 sections)revealed 123 neurons. The estimate from profile countsusing nuclear fragments (Abercrombie corrected) was 99neurons. The estimate based on nucleolar profile counts(Abercrombie corrected) was 118 neurons. Taken together,these data indicate that true numbers are greatly underes-timated by profile counts of nuclei, and to a lesser degreeunderestimated by profile counts of nucleoli.
To determine the accuracy of the optical disector method,we used 25-µm paraffin sections, collected serially throughthe trochlear nucleus. For the application of the opticaldisector method, we determined the reference volume byCavalieri point counting (5 15,891,744–16,522,792 µm3
(range; average 5 16,207,268 µm3) and sampled through
CALIBRATION OF THE OPTICAL DISECTOR 173
the core (10µm) of the paraffin sections to obtain thenumerical density according to recommended protocols(Gundersen et al., 1988; Williams and Rakic, 1988; Braend-gaard et al., 1990; West, 1993; Howard and Reed, 1998).The density of neuronal nuclei in the 64,000 µm3 countingbox was 2.71–2.92 (range), and the total number of neu-rons in the MIV was calculated to be 712 (627, S.E.M.,685–739, range, Fig. 1C).
To calibrate the optical disector counts, a 3D reconstruc-tion of serial sections through the entire nucleus wasprepared from the same material that was used for thedisector counts (25-µm paraffin sections). Split neuronalnuclei which would have been double-counted on eitherside of two adjacent sections were identified and werefound to account for 2.2–2.5% of all neuronal nuclei inthese sections. The 3D reconstruction of 25-µm sections
revealed that 922 motoneurons were present in the MIV atP1 (Fig. 1C). This number was about 30% higher than theestimate from the optical disector count (average of 712).
The substantially lower count with the optical disectorcould be due to an underestimate of either the truereference volume or an underestimate of the true densityof neuronal nuclei in the tissue sections. We tested thehypothesis that our sampling strategy introduced a bias bysampling only the core of the tissue sections. It is generallyrecommended to exclude the margins for sampling to avoidproblems associated with uneven surfaces and other cut-ting artifacts (Helander, 1983; Gundersen et al., 1988;Williams and Rakic, 1988; Nurcombe et al., 1991; West etal., 1991; West, 1993). Does a lower density of neuronalnuclei in the core of the tissue section than in the marginsof the sections account for the lower counts?
Fig. 1. Morphology and quantification of motoneurons in thetrochlear nucleus (MIV) of the hatchling chick. A: The MIV iswell-demarcated below the ventricular surface of the midbrain andabove the medial longitudinal fascicle (MLF). B: The MIV neurons arelarge with coarse Nissl bodies and 1–2 nucleoli in a pale nucleus ofabout 8–12µm diameter. C: Estimates of neuronal numbers in the MIVnucleus based on different counting methods from the same series of
Methacarn-fixed, paraffin-embedded 25-µm sections through the MIVsectioned with a disposable knife blade. Nu, profile counting of nuclei;Ni, profile counting of nucleoli; ODt, traditional optical disectorcounts, ODm, modified optical disector counts; 3DR, three-dimen-sional reconstruction of serial sections. Dashed line, accurate number(based on 3DR data). Error bars are S.E.M. Scale bars 5 100 µm for A;20 µm for B.
174 W.J. HATTON AND C.S. VON BARTHELD
Density of neuronal nuclei in 25-mmtissue sections
To determine whether or not neuronal nuclei are uni-formly distributed throughout the extent of the tissuesections, the position of randomly sampled neuronal nuclei(with diameters .6 µm) was recorded by focusing andreading the position of the center of the neuronal nucleusin the z-axis, using a microcator with a resolution of0.1µm. Each readout was then transformed into a percen-tile value, based on the section thickness of the samplingarea measured at the same time. The position of the centerof the neuronal nucleus was then plotted as a function ofthe percentile section thickness. Several parameters weretested for their possible influence on the distribution of
neuronal nuclei, including the fixative, the embeddingmedium, the sectioning device (microtomes and blades),and the section thickness (Table 1).
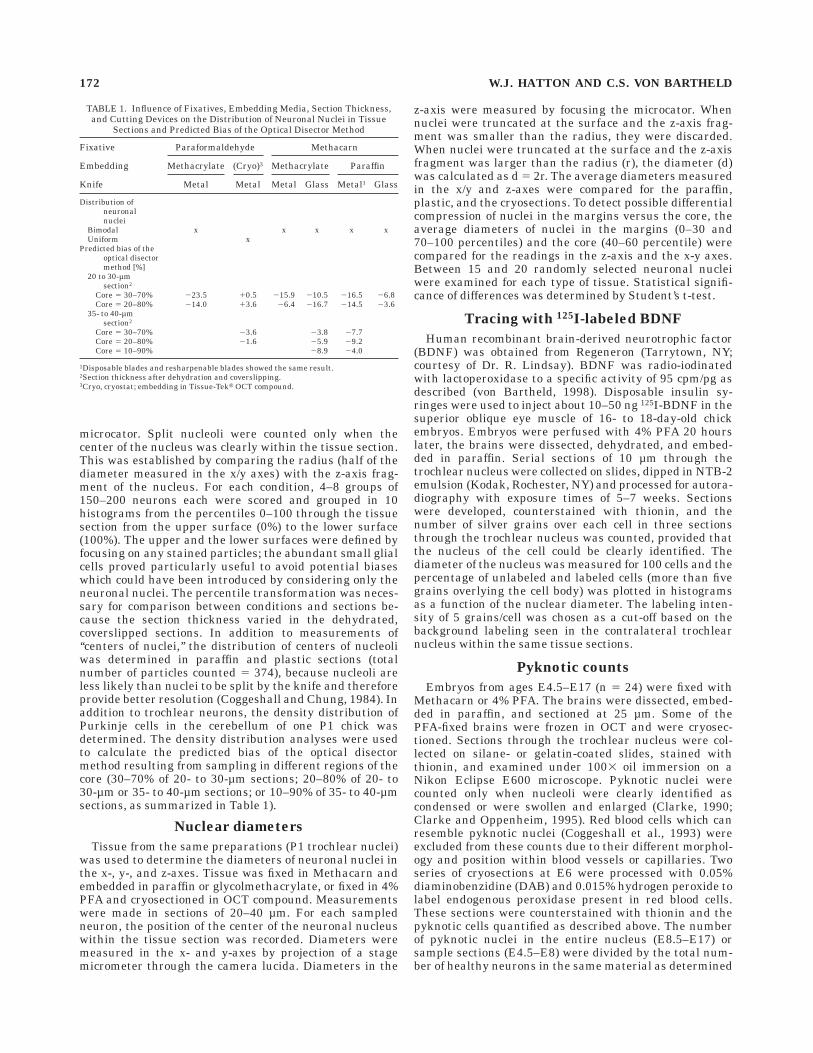
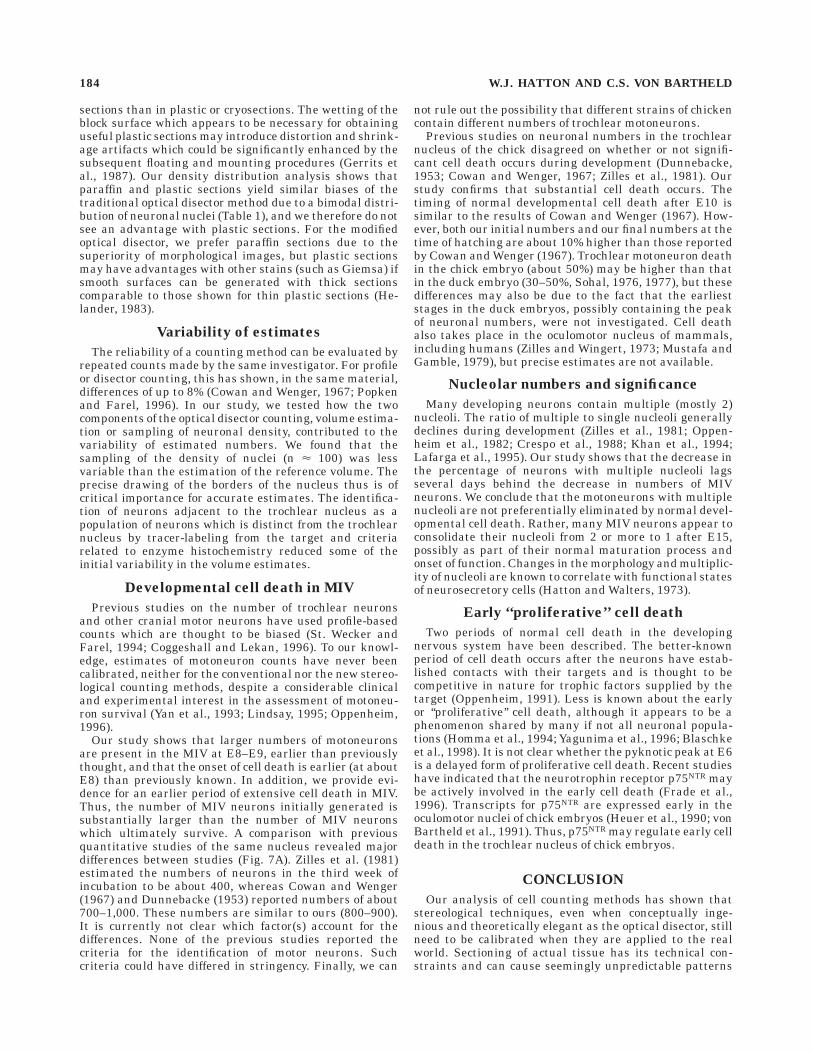
The analysis showed that the neuronal nuclei have abimodal distribution in sections after embedding in paraf-fin or glycolmethacrylate and sectioning at 20–30 µmwith metal blades, regardless of the fixative (paraformalde-hyde or Methacarn). These sections consistently showed ahigher density of neuronal nuclei in the upper and lower0–20% of the tissue section, and a lower density in thecore 30–70th percentiles (Fig. 2A). This bimodal distribu-tion was not due to double-counting of split neuronalnuclei because an unbiased counting rule was used. Fur-thermore, in the same material, split neuronal nuclei
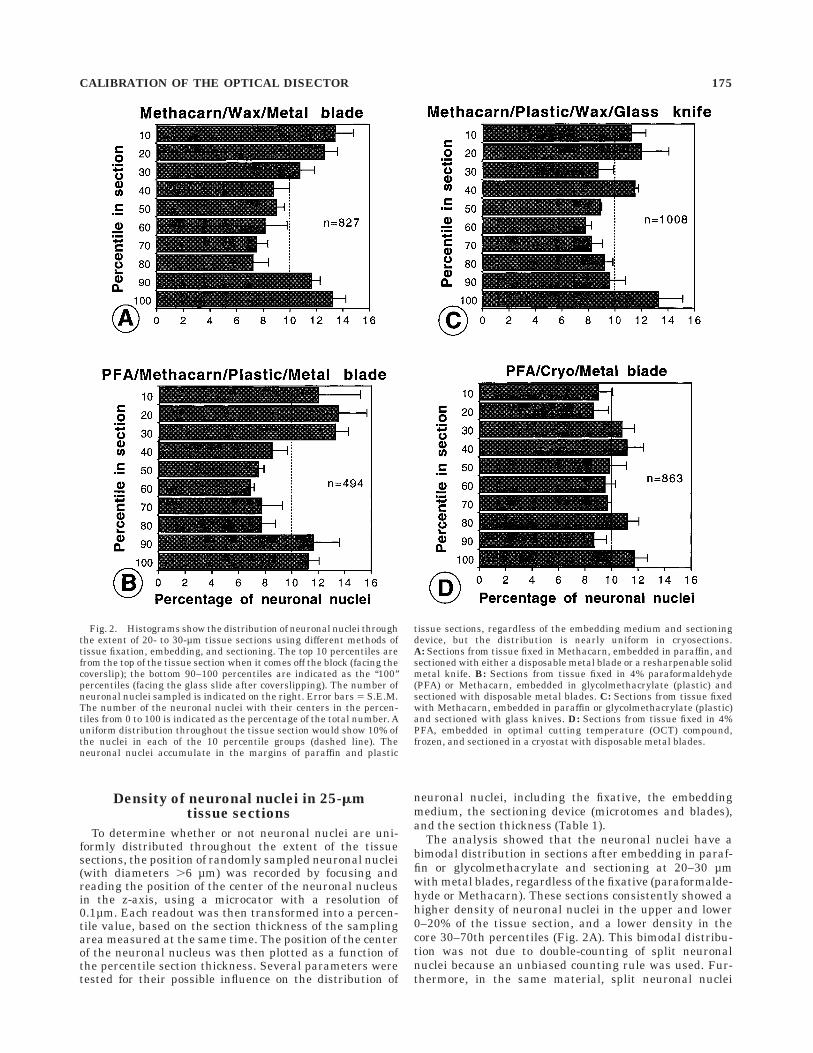
Fig. 2. Histograms show the distribution of neuronal nuclei throughthe extent of 20- to 30-µm tissue sections using different methods oftissue fixation, embedding, and sectioning. The top 10 percentiles arefrom the top of the tissue section when it comes off the block (facing thecoverslip); the bottom 90–100 percentiles are indicated as the ‘‘100’’percentiles (facing the glass slide after coverslipping). The number ofneuronal nuclei sampled is indicated on the right. Error bars 5 S.E.M.The number of the neuronal nuclei with their centers in the percen-tiles from 0 to 100 is indicated as the percentage of the total number. Auniform distribution throughout the tissue section would show 10% ofthe nuclei in each of the 10 percentile groups (dashed line). Theneuronal nuclei accumulate in the margins of paraffin and plastic
tissue sections, regardless of the embedding medium and sectioningdevice, but the distribution is nearly uniform in cryosections.A: Sections from tissue fixed in Methacarn, embedded in paraffin, andsectioned with either a disposable metal blade or a resharpenable solidmetal knife. B: Sections from tissue fixed in 4% paraformaldehyde(PFA) or Methacarn, embedded in glycolmethacrylate (plastic) andsectioned with disposable metal blades. C: Sections from tissue fixedwith Methacarn, embedded in paraffin or glycolmethacrylate (plastic)and sectioned with glass knives. D: Sections from tissue fixed in 4%PFA, embedded in optimal cutting temperature (OCT) compound,frozen, and sectioned in a cryostat with disposable metal blades.
CALIBRATION OF THE OPTICAL DISECTOR 175
which could have caused double-counting accountedfor only 2.2–2.5% of neuronal nuclei in the 25-µm paraffinsections (see section on 3D serial reconstruction).The density was similar in the upper and the lowermargins of the tissue section, but it was up to 50% lower inthe core when compared with the margins of the sections(Fig. 2A). Similar data were obtained for 25-µm paraffinsections through the MIV nuclei from younger ages(data not shown), for paraffin sections cut on two otherrotary microtomes (data not shown), and in plastic sec-tions (12–25 µm) prepared from Methacarn- or PFA-fixed tissue embedded in glycolmethacrylate (Fig. 2B,C).Similar results were obtained when tissue was sectionedwith resharpenable metal knives or disposable metalblades (data not shown), or when the position of centers ofnucleoli rather than that of nuclei was measured (Fig. 3A).A similar bimodal distribution of neuronal nucleiof Purkinje cells was seen in 25-µm paraffin sectionsthrough the cerebellum of hatchling chicks (data notshown). When PFA-fixed tissue was embedded in OCT,frozen, and sectioned at 40–60 µm (final thickness on theslide <15–25 µm after coverslipping), there was no consis-tent difference in the distribution of neuronal nucleibetween the core and the margins of the cryosections (Fig.2D).
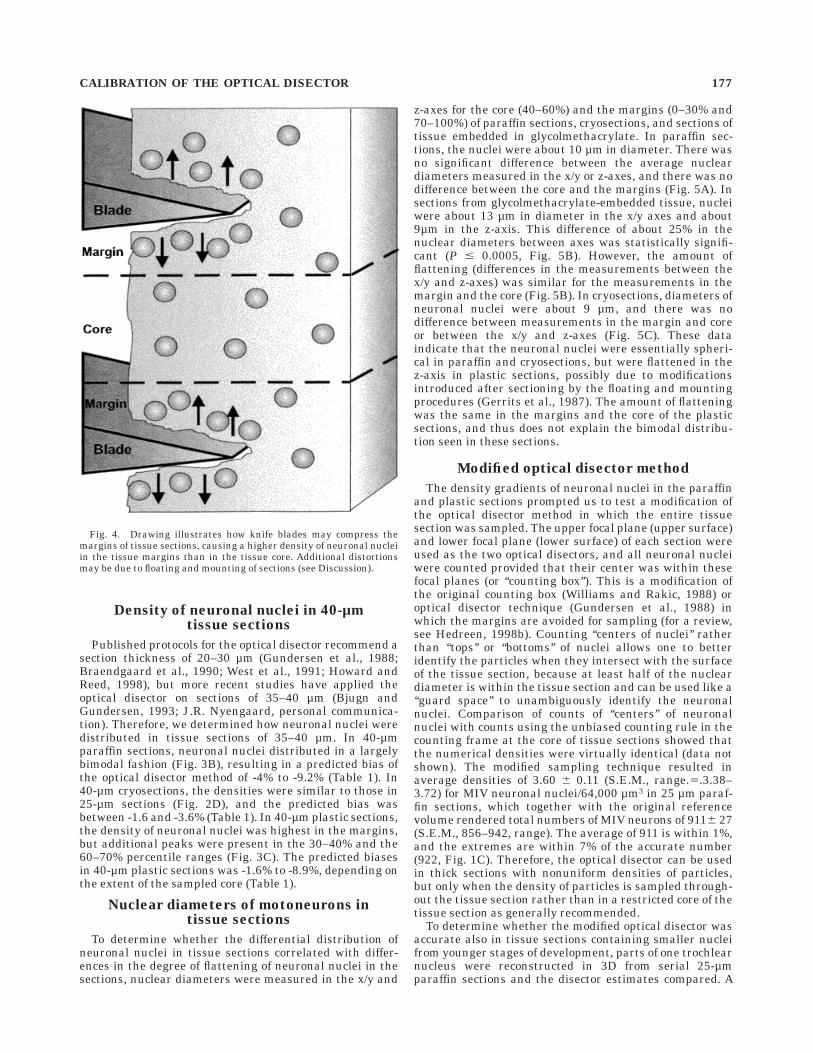
These data show that the differential distribution ofnuclei in paraffin and plastic sections is not an artifact ofthe measuring procedure (e.g., due to nonoptimal identifi-cation of particles), but that real differences exist betweenprocedures in the displacement of nuclei as a result of thesectioning. When PFA- or Methacarn-fixed tissue wasembedded in glycolmethacrylate and sectioned with aglass knife at 15–25 µm on an ultramicrotome, the distri-bution of neuronal nuclei was not uniform throughout thesection thickness, but it showed 1–2 peaks of densities oneither margin. These differences indicate that the knifeblade can compress tissue and may result in permanentchanges in the density of neuronal nuclei in tissue sections(Fig. 4). The degree of compression may be influenced bythe sharpness of the knife and the angle in which thesection is taken from the block. Apparently, this rendersbimodal differences in the density of neuronal nucleithroughout the tissue section. Such parameters directlyaffect the estimates of particle numbers and lead to biasesof neuronal estimates when the density in sampled areasis not representative for the whole tissue section. Thepredicted biases of the optical disector method as a result
of differences in densities between the core and the mar-gins of tissue sections is indicated for several differentparameters in Table 1.
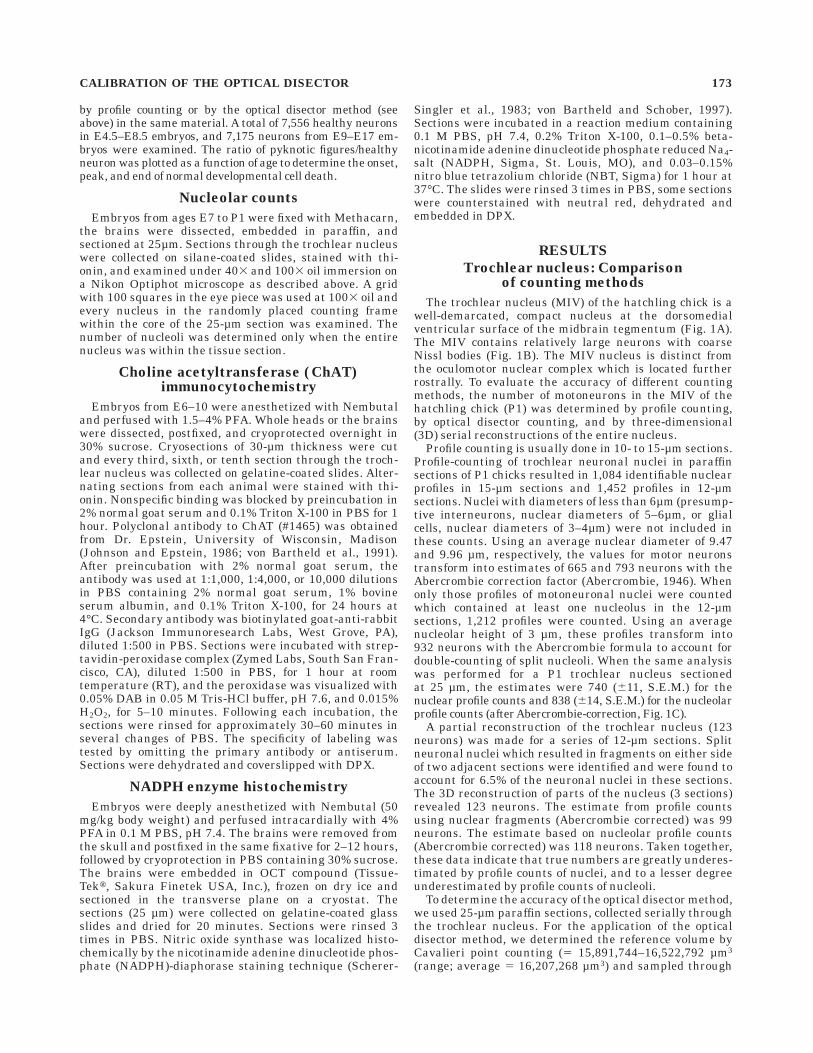
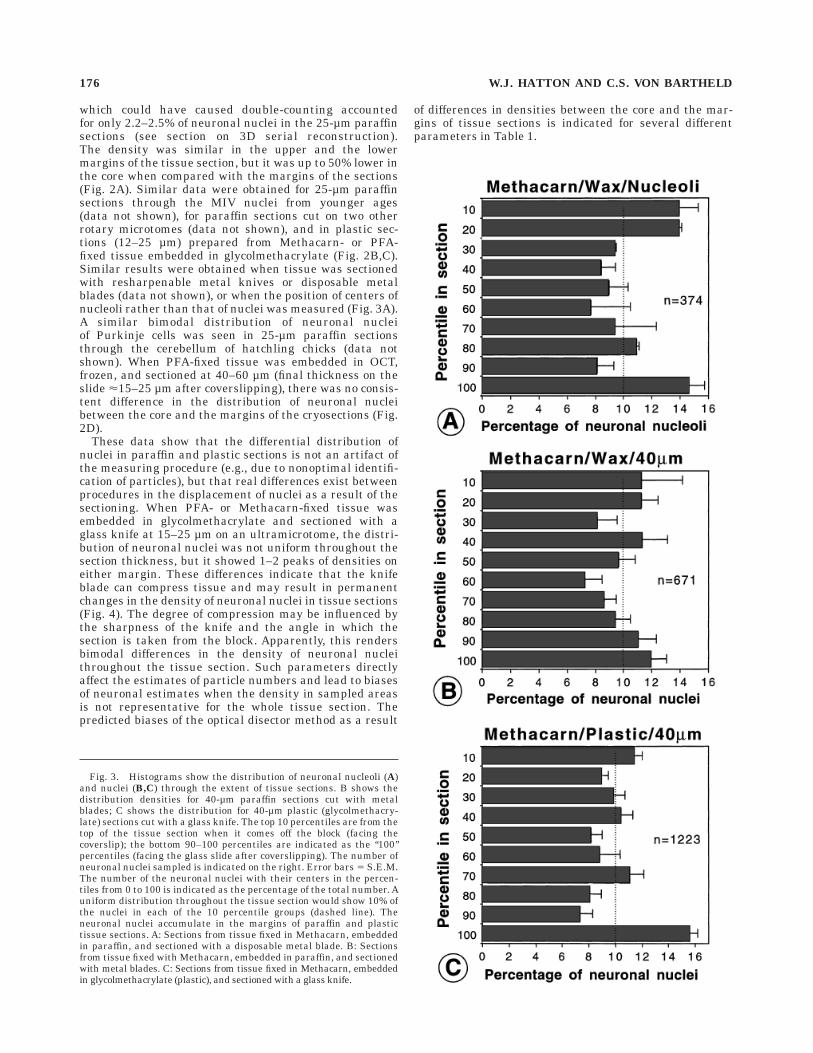
Fig. 3. Histograms show the distribution of neuronal nucleoli (A)and nuclei (B,C) through the extent of tissue sections. B shows thedistribution densities for 40-µm paraffin sections cut with metalblades; C shows the distribution for 40-µm plastic (glycolmethacry-late) sections cut with a glass knife. The top 10 percentiles are from thetop of the tissue section when it comes off the block (facing thecoverslip); the bottom 90–100 percentiles are indicated as the ‘‘100’’percentiles (facing the glass slide after coverslipping). The number ofneuronal nuclei sampled is indicated on the right. Error bars 5 S.E.M.The number of the neuronal nuclei with their centers in the percen-tiles from 0 to 100 is indicated as the percentage of the total number. Auniform distribution throughout the tissue section would show 10% ofthe nuclei in each of the 10 percentile groups (dashed line). Theneuronal nuclei accumulate in the margins of paraffin and plastictissue sections. A: Sections from tissue fixed in Methacarn, embeddedin paraffin, and sectioned with a disposable metal blade. B: Sectionsfrom tissue fixed with Methacarn, embedded in paraffin, and sectionedwith metal blades. C: Sections from tissue fixed in Methacarn, embeddedin glycolmethacrylate (plastic), and sectioned with a glass knife.
176 W.J. HATTON AND C.S. VON BARTHELD
Density of neuronal nuclei in 40-µmtissue sections
Published protocols for the optical disector recommend asection thickness of 20–30 µm (Gundersen et al., 1988;Braendgaard et al., 1990; West et al., 1991; Howard andReed, 1998), but more recent studies have applied theoptical disector on sections of 35–40 µm (Bjugn andGundersen, 1993; J.R. Nyengaard, personal communica-tion). Therefore, we determined how neuronal nuclei weredistributed in tissue sections of 35–40 µm. In 40-µmparaffin sections, neuronal nuclei distributed in a largelybimodal fashion (Fig. 3B), resulting in a predicted bias ofthe optical disector method of -4% to -9.2% (Table 1). In40-µm cryosections, the densities were similar to those in25-µm sections (Fig. 2D), and the predicted bias wasbetween -1.6 and -3.6% (Table 1). In 40-µm plastic sections,the density of neuronal nuclei was highest in the margins,but additional peaks were present in the 30–40% and the60–70% percentile ranges (Fig. 3C). The predicted biasesin 40-µm plastic sections was -1.6% to -8.9%, depending onthe extent of the sampled core (Table 1).
Nuclear diameters of motoneurons intissue sections
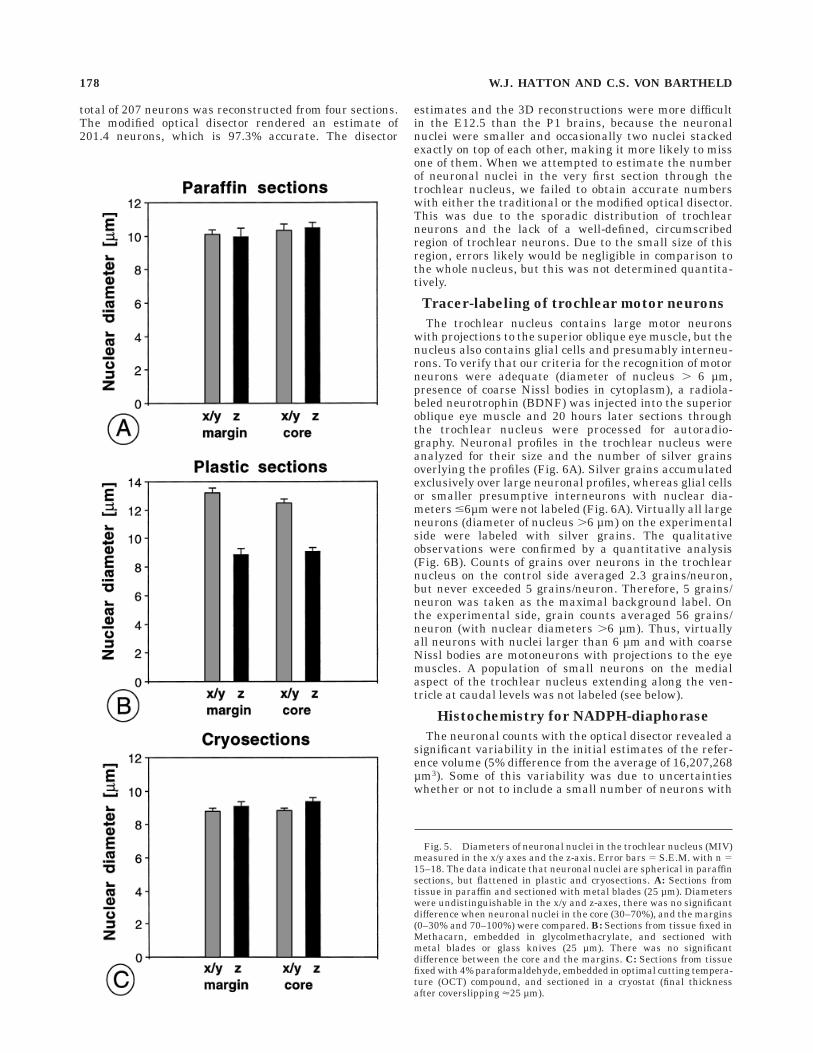
To determine whether the differential distribution ofneuronal nuclei in tissue sections correlated with differ-ences in the degree of flattening of neuronal nuclei in thesections, nuclear diameters were measured in the x/y and
z-axes for the core (40–60%) and the margins (0–30% and70–100%) of paraffin sections, cryosections, and sections oftissue embedded in glycolmethacrylate. In paraffin sec-tions, the nuclei were about 10 µm in diameter. There wasno significant difference between the average nucleardiameters measured in the x/y or z-axes, and there was nodifference between the core and the margins (Fig. 5A). Insections from glycolmethacrylate-embedded tissue, nucleiwere about 13 µm in diameter in the x/y axes and about9µm in the z-axis. This difference of about 25% in thenuclear diameters between axes was statistically signifi-cant (P # 0.0005, Fig. 5B). However, the amount offlattening (differences in the measurements between thex/y and z-axes) was similar for the measurements in themargin and the core (Fig. 5B). In cryosections, diameters ofneuronal nuclei were about 9 µm, and there was nodifference between measurements in the margin and coreor between the x/y and z-axes (Fig. 5C). These dataindicate that the neuronal nuclei were essentially spheri-cal in paraffin and cryosections, but were flattened in thez-axis in plastic sections, possibly due to modificationsintroduced after sectioning by the floating and mountingprocedures (Gerrits et al., 1987). The amount of flatteningwas the same in the margins and the core of the plasticsections, and thus does not explain the bimodal distribu-tion seen in these sections.
Modified optical disector method
The density gradients of neuronal nuclei in the paraffinand plastic sections prompted us to test a modification ofthe optical disector method in which the entire tissuesection was sampled. The upper focal plane (upper surface)and lower focal plane (lower surface) of each section wereused as the two optical disectors, and all neuronal nucleiwere counted provided that their center was within thesefocal planes (or ‘‘counting box’’). This is a modification ofthe original counting box (Williams and Rakic, 1988) oroptical disector technique (Gundersen et al., 1988) inwhich the margins are avoided for sampling (for a review,see Hedreen, 1998b). Counting ‘‘centers of nuclei’’ ratherthan ‘‘tops’’ or ‘‘bottoms’’ of nuclei allows one to betteridentify the particles when they intersect with the surfaceof the tissue section, because at least half of the nucleardiameter is within the tissue section and can be used like a‘‘guard space’’ to unambiguously identify the neuronalnuclei. Comparison of counts of ‘‘centers’’ of neuronalnuclei with counts using the unbiased counting rule in thecounting frame at the core of tissue sections showed thatthe numerical densities were virtually identical (data notshown). The modified sampling technique resulted inaverage densities of 3.60 6 0.11 (S.E.M., range.5.3.38–3.72) for MIV neuronal nuclei/64,000 µm3 in 25 µm paraf-fin sections, which together with the original referencevolume rendered total numbers of MIV neurons of 9116 27(S.E.M., 856–942, range). The average of 911 is within 1%,and the extremes are within 7% of the accurate number(922, Fig. 1C). Therefore, the optical disector can be usedin thick sections with nonuniform densities of particles,but only when the density of particles is sampled through-out the tissue section rather than in a restricted core of thetissue section as generally recommended.
To determine whether the modified optical disector wasaccurate also in tissue sections containing smaller nucleifrom younger stages of development, parts of one trochlearnucleus were reconstructed in 3D from serial 25-µmparaffin sections and the disector estimates compared. A
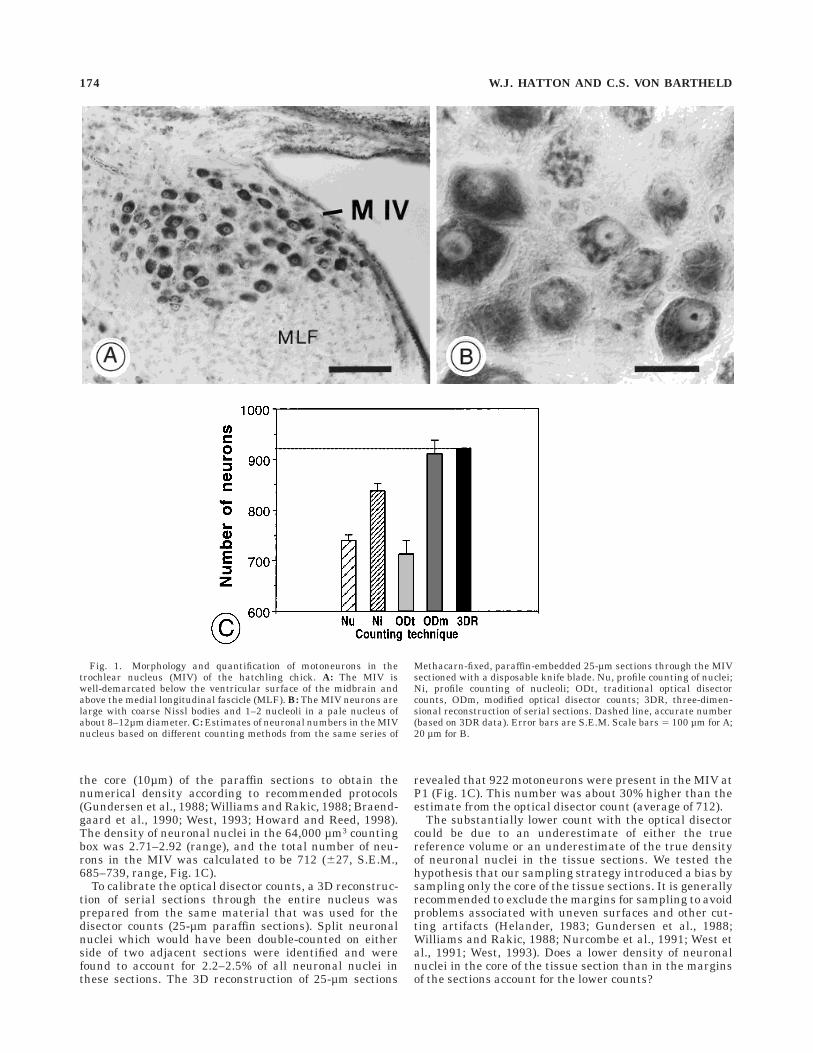
Fig. 4. Drawing illustrates how knife blades may compress themargins of tissue sections, causing a higher density of neuronal nucleiin the tissue margins than in the tissue core. Additional distortionsmay be due to floating and mounting of sections (see Discussion).
CALIBRATION OF THE OPTICAL DISECTOR 177
total of 207 neurons was reconstructed from four sections.The modified optical disector rendered an estimate of201.4 neurons, which is 97.3% accurate. The disector
estimates and the 3D reconstructions were more difficultin the E12.5 than the P1 brains, because the neuronalnuclei were smaller and occasionally two nuclei stackedexactly on top of each other, making it more likely to missone of them. When we attempted to estimate the numberof neuronal nuclei in the very first section through thetrochlear nucleus, we failed to obtain accurate numberswith either the traditional or the modified optical disector.This was due to the sporadic distribution of trochlearneurons and the lack of a well-defined, circumscribedregion of trochlear neurons. Due to the small size of thisregion, errors likely would be negligible in comparison tothe whole nucleus, but this was not determined quantita-tively.
Tracer-labeling of trochlear motor neurons
The trochlear nucleus contains large motor neuronswith projections to the superior oblique eye muscle, but thenucleus also contains glial cells and presumably interneu-rons. To verify that our criteria for the recognition of motorneurons were adequate (diameter of nucleus . 6 µm,presence of coarse Nissl bodies in cytoplasm), a radiola-beled neurotrophin (BDNF) was injected into the superioroblique eye muscle and 20 hours later sections throughthe trochlear nucleus were processed for autoradio-graphy. Neuronal profiles in the trochlear nucleus wereanalyzed for their size and the number of silver grainsoverlying the profiles (Fig. 6A). Silver grains accumulatedexclusively over large neuronal profiles, whereas glial cellsor smaller presumptive interneurons with nuclear dia-meters #6µm were not labeled (Fig. 6A). Virtually all largeneurons (diameter of nucleus .6 µm) on the experimentalside were labeled with silver grains. The qualitativeobservations were confirmed by a quantitative analysis(Fig. 6B). Counts of grains over neurons in the trochlearnucleus on the control side averaged 2.3 grains/neuron,but never exceeded 5 grains/neuron. Therefore, 5 grains/neuron was taken as the maximal background label. Onthe experimental side, grain counts averaged 56 grains/neuron (with nuclear diameters .6 µm). Thus, virtuallyall neurons with nuclei larger than 6 µm and with coarseNissl bodies are motoneurons with projections to the eyemuscles. A population of small neurons on the medialaspect of the trochlear nucleus extending along the ven-tricle at caudal levels was not labeled (see below).
Histochemistry for NADPH-diaphorase
The neuronal counts with the optical disector revealed asignificant variability in the initial estimates of the refer-ence volume (5% difference from the average of 16,207,268µm3). Some of this variability was due to uncertaintieswhether or not to include a small number of neurons with
Fig. 5. Diameters of neuronal nuclei in the trochlear nucleus (MIV)measured in the x/y axes and the z-axis. Error bars 5 S.E.M. with n 515–18. The data indicate that neuronal nuclei are spherical in paraffinsections, but flattened in plastic and cryosections. A: Sections fromtissue in paraffin and sectioned with metal blades (25 µm). Diameterswere undistinguishable in the x/y and z-axes, there was no significantdifference when neuronal nuclei in the core (30–70%), and the margins(0–30% and 70–100%) were compared. B: Sections from tissue fixed inMethacarn, embedded in glycolmethacrylate, and sectioned withmetal blades or glass knives (25 µm). There was no significantdifference between the core and the margins. C: Sections from tissuefixed with 4% paraformaldehyde, embedded in optimal cutting tempera-ture (OCT) compound, and sectioned in a cryostat (final thicknessafter coverslipping <25 µm).
178 W.J. HATTON AND C.S. VON BARTHELD
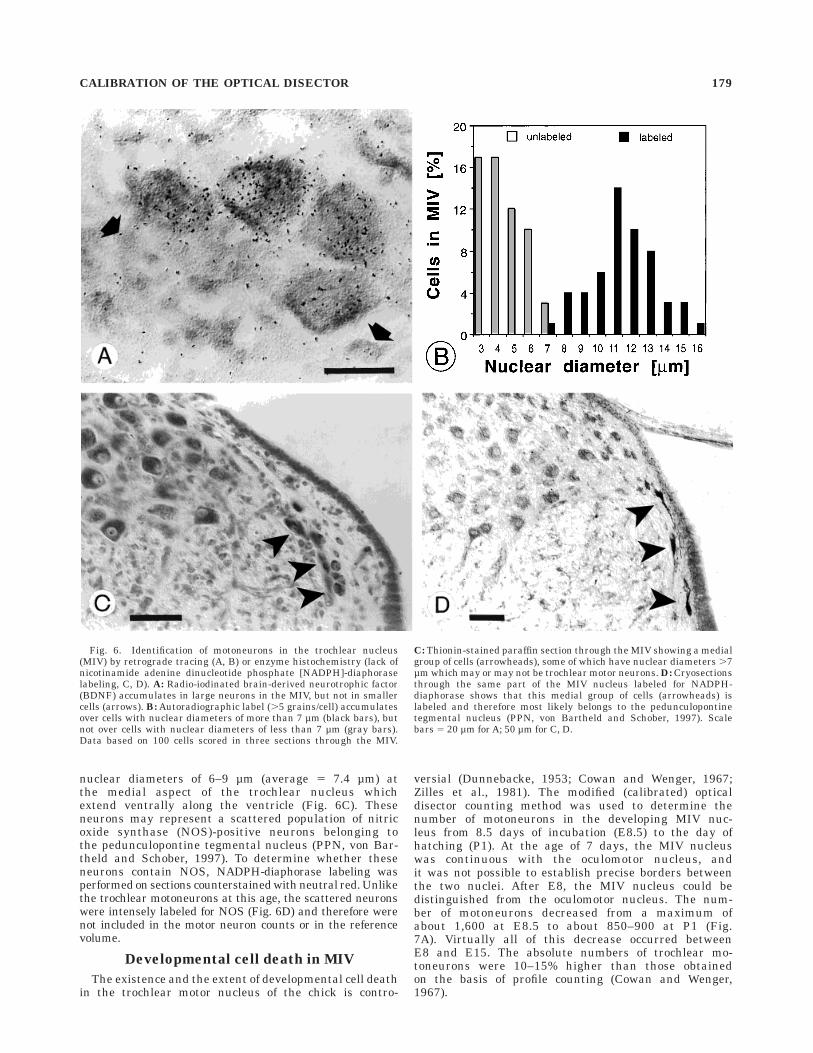
nuclear diameters of 6–9 µm (average 5 7.4 µm) atthe medial aspect of the trochlear nucleus whichextend ventrally along the ventricle (Fig. 6C). Theseneurons may represent a scattered population of nitricoxide synthase (NOS)-positive neurons belonging tothe pedunculopontine tegmental nucleus (PPN, von Bar-theld and Schober, 1997). To determine whether theseneurons contain NOS, NADPH-diaphorase labeling wasperformed on sections counterstained with neutral red. Unlikethe trochlear motoneurons at this age, the scattered neuronswere intensely labeled for NOS (Fig. 6D) and therefore werenot included in the motor neuron counts or in the referencevolume.
Developmental cell death in MIV
The existence and the extent of developmental cell deathin the trochlear motor nucleus of the chick is contro-
versial (Dunnebacke, 1953; Cowan and Wenger, 1967;Zilles et al., 1981). The modified (calibrated) opticaldisector counting method was used to determine thenumber of motoneurons in the developing MIV nuc-leus from 8.5 days of incubation (E8.5) to the day ofhatching (P1). At the age of 7 days, the MIV nucleuswas continuous with the oculomotor nucleus, andit was not possible to establish precise borders betweenthe two nuclei. After E8, the MIV nucleus could bedistinguished from the oculomotor nucleus. The num-ber of motoneurons decreased from a maximum ofabout 1,600 at E8.5 to about 850–900 at P1 (Fig.7A). Virtually all of this decrease occurred betweenE8 and E15. The absolute numbers of trochlear mo-toneurons were 10–15% higher than those obtainedon the basis of profile counting (Cowan and Wenger,1967).
Fig. 6. Identification of motoneurons in the trochlear nucleus(MIV) by retrograde tracing (A, B) or enzyme histochemistry (lack ofnicotinamide adenine dinucleotide phosphate [NADPH]-diaphoraselabeling, C, D). A: Radio-iodinated brain-derived neurotrophic factor(BDNF) accumulates in large neurons in the MIV, but not in smallercells (arrows). B: Autoradiographic label (.5 grains/cell) accumulatesover cells with nuclear diameters of more than 7 µm (black bars), butnot over cells with nuclear diameters of less than 7 µm (gray bars).Data based on 100 cells scored in three sections through the MIV.
C: Thionin-stained paraffin section through the MIV showing a medialgroup of cells (arrowheads), some of which have nuclear diameters .7µm which may or may not be trochlear motor neurons. D: Cryosectionsthrough the same part of the MIV nucleus labeled for NADPH-diaphorase shows that this medial group of cells (arrowheads) islabeled and therefore most likely belongs to the pedunculopontinetegmental nucleus (PPN, von Bartheld and Schober, 1997). Scalebars 5 20 µm for A; 50 µm for C, D.
CALIBRATION OF THE OPTICAL DISECTOR 179
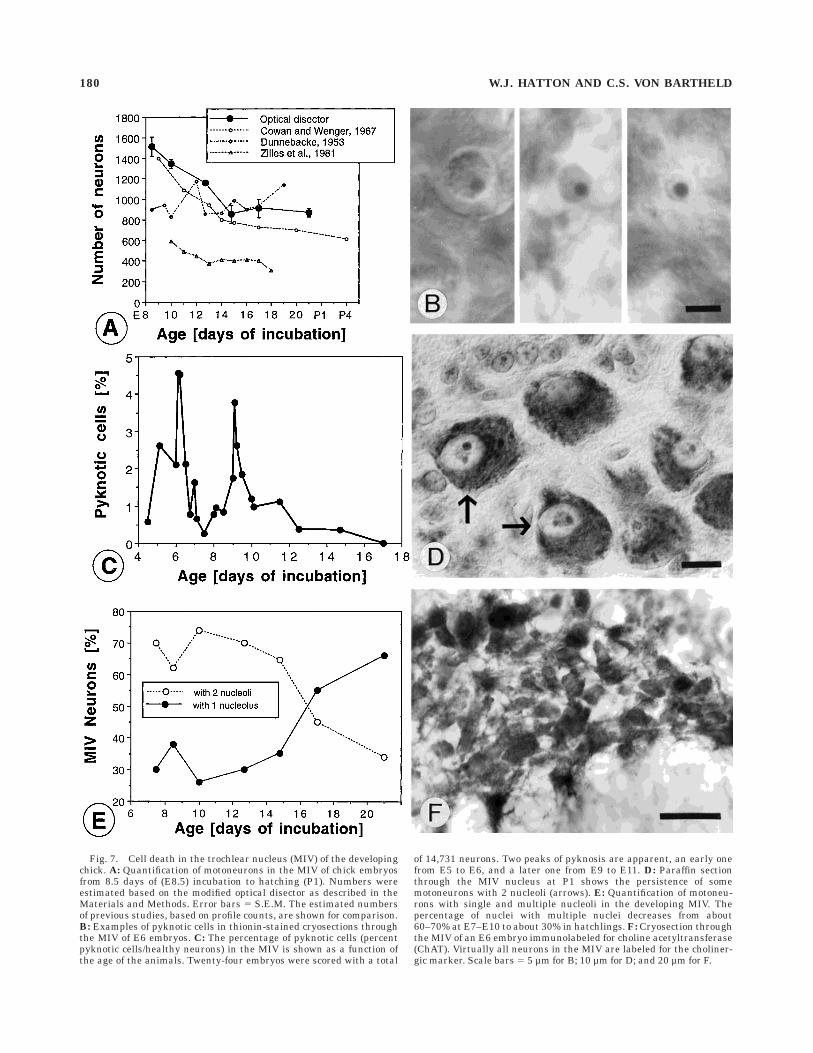
Fig. 7. Cell death in the trochlear nucleus (MIV) of the developingchick. A: Quantification of motoneurons in the MIV of chick embryosfrom 8.5 days of (E8.5) incubation to hatching (P1). Numbers wereestimated based on the modified optical disector as described in theMaterials and Methods. Error bars 5 S.E.M. The estimated numbersof previous studies, based on profile counts, are shown for comparison.B: Examples of pyknotic cells in thionin-stained cryosections throughthe MIV of E6 embryos. C: The percentage of pyknotic cells (percentpyknotic cells/healthy neurons) in the MIV is shown as a function ofthe age of the animals. Twenty-four embryos were scored with a total
of 14,731 neurons. Two peaks of pyknosis are apparent, an early onefrom E5 to E6, and a later one from E9 to E11. D: Paraffin sectionthrough the MIV nucleus at P1 shows the persistence of somemotoneurons with 2 nucleoli (arrows). E: Quantification of motoneu-rons with single and multiple nucleoli in the developing MIV. Thepercentage of nuclei with multiple nuclei decreases from about60–70% at E7–E10 to about 30% in hatchlings. F: Cryosection throughthe MIV of an E6 embryo immunolabeled for choline acetyltransferase(ChAT). Virtually all neurons in the MIV are labeled for the choliner-gic marker. Scale bars 5 5 µm for B; 10 µm for D; and 20 µm for F.
180 W.J. HATTON AND C.S. VON BARTHELD
Pyknotic counts
Previous reports on developmental cell death in thechick trochlear nucleus have examined only ages olderthan E9.5, and the earliest age (E9.5–E10.0) showed thehighest number of neurons (Cowan and Wenger, 1967).Therefore, it was not clear whether the maximal number ofmotoneurons may be reached in the MIV prior to E9.5.Because the MIV nucleus does not become clearly distinctfrom the MIII nucleus until E8.5, it was not possible todetermine the number of neurons in MIV prior to E8.5.Another method to identify the timing of cell death is tomeasure the percentage of dying cells within a nucleus(Fig. 7B). The number of dying (pyknotic) cells can beexpressed as the ratio of dying to healthy neurons. For thisanalysis, it is not necessary to know the absolute numberof motoneurons in the nucleus. The ratio of pyknotic cells/healthy motoneurons was determined in 24 chick embryosfrom ages E4.5 to E17. A total of 14,731 motoneurons wasanalyzed. This analysis revealed two peaks in pyknosis, anearly one at E5–E6, and a later one at E9–E11, with asubsequent gradual decline (Fig. 7C). The later peak hasbeen observed previously (von Bartheld and Rubel, 1989)and it correlated with the onset of normal developmentalcell death at about E8 and its gradual decrease until aboutE15, as determined by cell counts (Fig. 7A). It is unlikelythat our analysis of pyknotic cells was biased by theinclusion of red blood cells which can, in some cases, bemistaken for pyknotic nuclei (Coggeshall et al., 1993). Redblood cells were present in blood vessels and capillaries inour sections, but their morphology generally differed fromthat of true pyknotic nuclei (Fig. 7B), as argued in lengthelsewhere (Clarke and Oppenheim, 1995). Furthermore,when red blood cells were labeled by the DAB peroxidasereaction in Nissl-stained cryosections (data not shown),the ratios of pyknotic cells lacking endogenous peroxidaseactivity were similar to ratios of pyknotic cells/healthyneurons obtained from normal Nissl stained-material (datanot shown).
Percentages of trochlear neurons withmultiple nucleoli
Many developing oculomotor neurons contain twonucleoli (Fig. 7D). Consistent with a previous report (Zilleset al., 1981), the percentages of trochlear neurons withmultiple nucleoli decreased from 60–70% at E8–E10 to30% at P1. To test whether the decrease in the number ofmotoneurons with two or more nucleoli may be due todifferential (increased) cell death among motoneuronswith two nucleoli, their percentages were recorded at E8.5,E10, E12.5, E14.5, and E17. The results showed that thedecrease in the number of motoneurons with multiplenucleoli lagged several days behind the decrease in totalmotoneuron numbers (Fig. 7E). Thus, the motoneuronswith multiple nucleoli were not more sensitive to normaldevelopmental cell death than motoneurons with onenucleolus.
Immunocytochemistry for ChAT
To determine whether or not the early cell death oc-curred in differentiated motoneurons, the expression of thecholinergic marker ChAT was examined in trochlear neu-rons. At E6, the large majority of trochlear motoneuronswas ChAT-positive (Fig. 7F). Mitotic figures were observedrarely at and after E6, consistent with the observation inother avian embryos that proliferation in the oculomotor
nuclei ceases at about 5 days of incubation (Sohal, 1977).Thus, the early period of cell death observed here occurs indifferentiated trochlear motoneurons several days afterthey become postmitotic.
DISCUSSION
The accuracy of neuronal counting methods is currentlycontroversial (Coggeshall, 1992; Clarke and Oppenheim,1995; Hedreen, 1998a,b). The optical disector method isthought to be the most efficient of the modern stereologicaltechniques for the counting of particles in microscopicsections. Our main claim is that this technique can have asignificant bias when it is applied to paraffin or plasticsections as currently recommended. We show how this biasis introduced, how it can be avoided, and we describe how amodified optical disector method can more accuratelyestimate the number of motoneurons in the developingtrochlear nucleus.
Accuracy of counting methods
It is currently not clear to what extent the conventionalprofile-based counting methods differ in accuracy from themodern, design-based stereological methods. Some investi-gators claim that the conventional profile counts arereasonably accurate, within less than a few percentagepoints when certain conditions are met (Clarke, 1992,1993; Clarke and Oppenheim, 1995). Others report inaccu-racies of up to 40% (Schmalbruch, 1987; Coggeshall et al.,1990; Pakkenberg et al., 1991). The modern stereologicaltechniques were introduced as being unbiased and accu-rate on the basis of mathematical/stereological grounds.Theoretically, there is no need for calibration, and someinvestigators believe that calibration is not possible (Cruz-Orive, 1994; Howard and Reed, 1998).
Calibration of the physical disector by 3D-serial recon-struction, however, revealed that, under certain condi-tions, it was disturbingly inaccurate when the look-upsection and the reference sections were too close together,a feature not predicted on theoretical grounds (Pover andCoggeshall, 1991; but see Hedreen, 1998b). In other calibra-tion studies, it was found that the orientation of the tissueinfluenced the results of physical disector counts (Popkenand Farel, 1996) and that in some tissues the number ofsampled particles needed to be significantly higher forreasonably accurate estimates than initially postulated(Popken and Farel, 1996). Furthermore, lost caps canintroduce a bias in the physical disector (Hedreen, 1998b).These studies support the notion that both the conven-tional as well as the modern counting methods should becalibrated. The optical disector has not previously beencalibrated by serial 3D reconstruction.
Conventional profile counting
Profile counting may lead to an overestimate of numbersbecause of double-counting of split nuclei or nucleoli. Forthis reason, correction factors have been applied to controlfor the overcount (Abercrombie, 1946; reviewed in He-dreen, 1998a). However, profile counting may also lead toan underestimate of true numbers, as evidenced by calibra-tion with 3D reconstruction of serial sections (St. Weckerand Farel, 1994; Hedreen, 1998b). It is thought thatnucleoli or caps of particles are lost in the cutting process,and that this can cause an underestimate of 8–30% inprofile-based counts. In our study, profile counting ofnuclei led to an underestimate of 15–20%, whereas profile
CALIBRATION OF THE OPTICAL DISECTOR 181
counting of nucleoli was remarkably accurate in 12-µmsections (within 6%), but less so in 25-µm sections (under-estimate of 9%, Fig. 1C). The significant underestimateobtained by counting of nuclear profiles appears to be dueto the loss of smaller nuclear fragments (Helander, 1983).The 3D reconstruction of serial sections showed that mostof the nuclei which appeared to be split by the knife in onesection could not be identified in the adjacent section.Theoretically, the percentage of split nuclei in two adjacentsections should have been about 30% in the 25-µm sections(using 9 µm as the average nuclear diameter). The actualpercentage was only 2.2–2.5%, much lower than theoreti-cally expected. This is presumably due to the loss ofsmaller fragments of split nuclei or the failure to identifysmall fragments (Jones, 1937; Williams and Rakic, 1988).In summary, our data support the notion that nuclearprofile counting is inaccurate, presumably due to theproblems associated with the identification of lost caps (fora review, see Hedreen, 1998b). The estimates based onprofile counting of nucleoli in 12- µm sections, on the otherhand, compared more favorably with the modified opticaldisector technique (see below).
Optical disector technique
The optical disector or ‘‘counting box’’ method requiresthick sections. It is thought to render accurate numbersregardless of tissue shrinkage before, during, or afterprocessing (West et al., 1991). One of the hallmarks of thistechnique is the use of ‘‘guard spaces’’ at the upper and/orlower surfaces (Gundersen et al., 1988; Williams andRakic, 1988; Braendgaard et al., 1990; West et al., 1991;West, 1993; Howard and Reed, 1998) when the density ofparticles is sampled. This is thought to be necessary for theproper identification of the particles of interest. However,because the unsampled margins are also used for theestimation of the reference volume, this procedure makesthe implicit assumption that the density of particles isuniform throughout the tissue section. Our study nowshows that this assumption is largely met in cryosections,but not in paraffin sections or in plastic (glycolmethacry-late) sections. The density of neuronal nuclei in the tissuesections is low in the core of paraffin and plastic sectionscut with either metal blades or glass knives (Figs. 2, 3).Therefore, the optical disector, when used as currentlyrecommended in paraffin or plastic sections, underesti-mates true numbers by about 4–24% (Table 1). Theseresults may explain why previous studies obtained esti-mates from plastic sections which were 10–20% lower thanexpected (Nurcombe et al., 1991; see also Marrable, 1962),but expected numbers were obtained when the opticaldisector was applied to cryosections (Tramontin et al.,1998).
Based on our 3D serial reconstruction, it appears thatthe guard spaces are not essential for the identification ofneuronal nuclei. Neuronal nuclei can be relatively easilyidentified. Furthermore, rather than identifying tops andbottoms of nuclei, we identified and counted ‘‘centers’’ ofnuclei, ‘‘when the sharpest nuclear profile falls within thedisector counting frame’’ (Gundersen et al., 1988, p. 862;Howard and Reed, 1998). The counting of a theoreticalconstruct rather than a particle was suggested previouslyfor the ‘‘center’’ of multiple nucleoli (Clarke, 1985). Count-ing of nuclear centers allows one to effectively utilize aguard space of the size of the radius (half the diameter) ofthe nucleus to decide whether or not the center of the
nucleus is within the counting frame. Neuronal nuclei arespherical in paraffin sections (Fig. 5A), and the informa-tion in the x/y axes helps to localize the position of thecenter of the nucleus in 3D space. As an alternative, theextent of the guard spaces should be reduced as much aspossible, to 1–2 µm, to minimize the bias due to thenonuniform density of neuronal nuclei. Another practicalimprovement of the sampling is the use of a 10 3 10 gridsquare in the eye piece to demarcate the counting box. Thishelps to avoid ‘‘losing track of densely packed cells’’ (Clarke,1993) and facilitates the counting process. We find thatcounting in the microscope provides better resolution thancounting on a video monitor (Williams and Rakic, 1988).When we used the entire section thickness for sampling,our estimates obtained by the optical disector were signifi-cantly more accurate than when only the core of thesection was sampled (Fig. 1C). The improved accuracy(and thus the improved efficiency) of the optical disectorshould prove particularly useful for the detection of subtledevelopmental, experimental, or pathological changes inneuronal populations (Williams and Rakic, 1988).
Distribution of neuronal nuclei in sections
The differential distribution of neuronal nuclei in paraf-fin and plastic sections can not be simply explained by anapparent increased number of neuronal nuclei due to splitnuclei (in the adjacent margins of two sections) which wereerroneously counted despite the use of an unbiased count-ing rule. This explanation was ruled out for the paraffinsections in which the same material was used to recon-struct each neuronal nucleus in serial sections. Thisanalysis showed that only 2.2–2.5% of neuronal nucleiwere ‘‘split,’’ such that fragments of neuronal nuclei couldbe identified in adjacent sections, and only a fraction ofthese nuclei (less than 1.0% of the total) could have beenerroneously scored in our measurement analysis as havingtheir center within the 0–10 or 90–100 percentile of thetissue section. Furthermore, a similar bimodal distribu-tion was seen in paraffin and plastic sections when thedistribution of neuronal nucleoli rather than nuclei wasdetermined. For the plastic sections cut with metal blades,double-counting of split nuclei can be ruled out because thehighest density was seen in the 10–20 and 80–90 percen-tiles (Fig. 2B), and not in the 0–10 and 90–100 percentilesas would be expected if double-counting of split nuclei werea significant source of error. The lower density of neuronalnuclei in the extreme percentiles is probably due to lostcaps or invisible fragments which are thought to havediameters less than 1 µm (Pover and Coggeshall, 1991).Only nuclei split in the center appear to be visible in twoadjacent sections. If our analysis underestimated thenumber of nuclear centers in the surface region due to lostcaps, the predicted bias of the traditional optical disectorwould be greater than indicated in Table 1.
Possible mechanisms of differential densitiesof neuronal nuclei
The differential distribution of neuronal nuclei in tissuesections was unexpected, as such a phenomenon has notbeen described previously. To our knowledge, it has notbeen investigated previously. Currently, we do not knowwhich factors cause the differential distribution, but sev-eral possibilities should be considered.
1. The knife blade may push neurons or neuronal nuclei toeither side when the blade ploughs through the tissue.
182 W.J. HATTON AND C.S. VON BARTHELD
This would be consistent with the notion that neuronalnuclei in paraffin behave like ‘‘nuts in gelatin’’ whenthey are sectioned ‘‘with a butter knife’’ (Williams andRakic, 1988), and one would expect a higher density ofneurons (and neuronal nuclei) in the margins as aresult of cutting.
2. The knife blade probably also compresses the tissue,and this may affect the margins more than the core ofthe tissue section. Consistent with this idea, alterationsin tissue sections have been described as a deformationcaused by pressure on the tissue during sectioning(Boonstra et al., 1983). In thicker sections, there seemto be 1–2 additional zones of increased compressionwithin the core of tissue sections (Fig. 3B,C).
3. Shrinkage of tissue may differentially affect neurons ornuclei and extracellular space, and this may differbetween the margins and the core of tissue sections.Indeed, shrinkage observed in paraffin seems to affectnuclei less than other components of the tissue(Ladekarl, 1994).
4. Distortion of tissue due to floating of sections on watermay differentially affect margins and the core of tissuesections. Stretching on the water bath and dryingduring the mounting step induce considerable sizechanges of sections, comparable to the dehydration stepof histoprocessing (Gerrits et al., 1987). Again, this mayaffect nuclei or neurons differently than extracellularspace (Ladekarl, 1994). The magnitude of such distor-tion of sections has been reported to be similar inparaffin and plastic sections (Deverell et al., 1989).
The differences observed between thinner and thickersections and between paraffin and plastic sections indicatethat several factors may be relevant for distortion, andthat a complex interaction of processes may determine thefinal density of neuronal nuclei in sections. Interestingly,differential distribution of neuronal nuclei was not seen incryosections. This suggests that the consistencies of cellsor nuclei and extracellular space may be similar in frozentissue, but not in paraffin- or plastic-embedded material,thus causing the differential distribution of neuronalnuclei after sectioning. The multiple peaks of neuronaldensities in the thicker plastic and paraffin sections indi-cate that movement or differential shrinkage/deformationeffects are not restricted to the margin of sections. Theseobservations have direct implications for the accuracy ofthe traditional optical disector. Based on the extent of thesampling frame within the core and how it happens tocoincide with peaks or troughs of neuronal densities, thetraditional optical disector will produce varying degrees ofbiases in estimates of neuron numbers. The predictedbiases of the optical disector are summarized in Table 1.
These results underscore the need to determine thedensities of particles throughout the thickness of tissuesections when the optical disector technique is used inparaffin- or plastic-embedded tissue. It should be empha-sized that we would not have known about the underesti-mate of the numbers obtained with the optical disectormethod, if we had not calibrated the same material withthe 3D reconstruction. Therefore, it is essential to checkthe density of neuronal nuclei in sections before thetraditional optical disector is applied to rule out poten-tially significant bias.
Influence of section thickness on the densitydistribution and predicted bias
Thicker sections showed overall a lower degree of differ-ences in densities between margins and core, as would beexpected, because the observed changes are caused bysectioning, and thicker sections result in fewer sectionsthrough the block. The optical disector method was intro-duced and is recommended for sections of 20- to 30-µmthickness (Gundersen et al., 1988; Braendgaard et al.,1990; West et al., 1991; Howard and Reed, 1998). We havetherefore focused our analysis on sections of such thick-ness. However, more recently, investigators have used 35-to 50-µm sections for the optical disector (Bjugn andGundersen, 1993; J.R. Nyengaard, personal communica-tion). Thicker sections have the disadvantage that penetra-tion of stains may be less than optimal and it may bedifficult to focus through the entire section. In some cases,the section can not be coverslipped, because the combinedthickness of the coverslip glass and tissue section mayexceed the working distance of the 1003 objective lensunder oil immersion, making it impossible to focus to thebottom of the section. Our analysis of thick plastic sectionsrevealed that the core of 35- to 40-µm sections can repre-sent the density of neuronal nuclei more adequately thanthe core of 20- to 30-µm sections (Fig. 3C; Table 1). Thisseems to be a difference between plastic and paraffinsections (Fig. 3B). However, due to the substantial variabil-ity, it is necessary to determine empirically for each dataset the density distribution of neuronal nuclei, to knowwhich extent of the sampling frame in the z-axis wouldminimize the bias. This severely limits the efficiency of thetraditional optical disector (using guard spaces), whencompared with the modified optical disector which samplesthe entire section thickness.
Plastic versus paraffin sections
Our analysis of the optical disector has focused onparaffin sections, because calibration by three-dimeni-sonal reconstruction of serial sections is more suitable forparaffin than resin sections (Deverell et al., 1989). Plasticsections are generally preferred by stereologists over paraf-fin sections for two reasons. Plastic sections are thought toshrink less than paraffin sections (Howard and Reed,1998), and thin plastic sections are ‘‘smoother’’ with lesscutting artifacts at the section surface than paraffin sec-tions (Helander, 1983). These advantages are thought tomake up for the more difficult embedding and cuttingprocedures, and the difficulty in obtaining adequate pen-etration of stains into the tissue (Gerrits et al., 1990). Withregard to the shrinkage problem, to our knowledge thishas been examined only for thin sections, but not for 25- to40-µm sections. Our data do not support the notion thatthick paraffin sections shrink substantially more thanthick glycolmethacrylate sections. For the optical disectortechnique, the shrinkage should not matter, as long as itdoes not compromise the identification of the particles ofinterest (Pakkenberg and Gundersen, 1988; West et al.,1991). With regard to the problem of surface artifacts,again, to our knowledge this has been examined for thinsections (Helander, 1983), but thick paraffin and plasticsections have not been compared. In our material, theimproved morphological quality due to better penetrationand retention of stains in paraffin sections made it easierto evaluate the location of neuronal nuclei in paraffin
CALIBRATION OF THE OPTICAL DISECTOR 183
sections than in plastic or cryosections. The wetting of theblock surface which appears to be necessary for obtaininguseful plastic sections may introduce distortion and shrink-age artifacts which could be significantly enhanced by thesubsequent floating and mounting procedures (Gerrits etal., 1987). Our density distribution analysis shows thatparaffin and plastic sections yield similar biases of thetraditional optical disector method due to a bimodal distri-bution of neuronal nuclei (Table 1), and we therefore do notsee an advantage with plastic sections. For the modifiedoptical disector, we prefer paraffin sections due to thesuperiority of morphological images, but plastic sectionsmay have advantages with other stains (such as Giemsa) ifsmooth surfaces can be generated with thick sectionscomparable to those shown for thin plastic sections (He-lander, 1983).
Variability of estimates
The reliability of a counting method can be evaluated byrepeated counts made by the same investigator. For profileor disector counting, this has shown, in the same material,differences of up to 8% (Cowan and Wenger, 1967; Popkenand Farel, 1996). In our study, we tested how the twocomponents of the optical disector counting, volume estima-tion or sampling of neuronal density, contributed to thevariability of estimated numbers. We found that thesampling of the density of nuclei (n < 100) was lessvariable than the estimation of the reference volume. Theprecise drawing of the borders of the nucleus thus is ofcritical importance for accurate estimates. The identifica-tion of neurons adjacent to the trochlear nucleus as apopulation of neurons which is distinct from the trochlearnucleus by tracer-labeling from the target and criteriarelated to enzyme histochemistry reduced some of theinitial variability in the volume estimates.
Developmental cell death in MIV
Previous studies on the number of trochlear neuronsand other cranial motor neurons have used profile-basedcounts which are thought to be biased (St. Wecker andFarel, 1994; Coggeshall and Lekan, 1996). To our knowl-edge, estimates of motoneuron counts have never beencalibrated, neither for the conventional nor the new stereo-logical counting methods, despite a considerable clinicaland experimental interest in the assessment of motoneu-ron survival (Yan et al., 1993; Lindsay, 1995; Oppenheim,1996).
Our study shows that larger numbers of motoneuronsare present in the MIV at E8–E9, earlier than previouslythought, and that the onset of cell death is earlier (at aboutE8) than previously known. In addition, we provide evi-dence for an earlier period of extensive cell death in MIV.Thus, the number of MIV neurons initially generated issubstantially larger than the number of MIV neuronswhich ultimately survive. A comparison with previousquantitative studies of the same nucleus revealed majordifferences between studies (Fig. 7A). Zilles et al. (1981)estimated the numbers of neurons in the third week ofincubation to be about 400, whereas Cowan and Wenger(1967) and Dunnebacke (1953) reported numbers of about700–1,000. These numbers are similar to ours (800–900).It is currently not clear which factor(s) account for thedifferences. None of the previous studies reported thecriteria for the identification of motor neurons. Suchcriteria could have differed in stringency. Finally, we can
not rule out the possibility that different strains of chickencontain different numbers of trochlear motoneurons.
Previous studies on neuronal numbers in the trochlearnucleus of the chick disagreed on whether or not signifi-cant cell death occurs during development (Dunnebacke,1953; Cowan and Wenger, 1967; Zilles et al., 1981). Ourstudy confirms that substantial cell death occurs. Thetiming of normal developmental cell death after E10 issimilar to the results of Cowan and Wenger (1967). How-ever, both our initial numbers and our final numbers at thetime of hatching are about 10% higher than those reportedby Cowan and Wenger (1967). Trochlear motoneuron deathin the chick embryo (about 50%) may be higher than thatin the duck embryo (30–50%, Sohal, 1976, 1977), but thesedifferences may also be due to the fact that the earlieststages in the duck embryos, possibly containing the peakof neuronal numbers, were not investigated. Cell deathalso takes place in the oculomotor nucleus of mammals,including humans (Zilles and Wingert, 1973; Mustafa andGamble, 1979), but precise estimates are not available.
Nucleolar numbers and significance
Many developing neurons contain multiple (mostly 2)nucleoli. The ratio of multiple to single nucleoli generallydeclines during development (Zilles et al., 1981; Oppen-heim et al., 1982; Crespo et al., 1988; Khan et al., 1994;Lafarga et al., 1995). Our study shows that the decrease inthe percentage of neurons with multiple nucleoli lagsseveral days behind the decrease in numbers of MIVneurons. We conclude that the motoneurons with multiplenucleoli are not preferentially eliminated by normal devel-opmental cell death. Rather, many MIV neurons appear toconsolidate their nucleoli from 2 or more to 1 after E15,possibly as part of their normal maturation process andonset of function. Changes in the morphology and multiplic-ity of nucleoli are known to correlate with functional statesof neurosecretory cells (Hatton and Walters, 1973).
Early ‘‘proliferative’’ cell death
Two periods of normal cell death in the developingnervous system have been described. The better-knownperiod of cell death occurs after the neurons have estab-lished contacts with their targets and is thought to becompetitive in nature for trophic factors supplied by thetarget (Oppenheim, 1991). Less is known about the earlyor ‘‘proliferative’’ cell death, although it appears to be aphenomenon shared by many if not all neuronal popula-tions (Homma et al., 1994; Yagunima et al., 1996; Blaschkeet al., 1998). It is not clear whether the pyknotic peak at E6is a delayed form of proliferative cell death. Recent studieshave indicated that the neurotrophin receptor p75NTR maybe actively involved in the early cell death (Frade et al.,1996). Transcripts for p75NTR are expressed early in theoculomotor nuclei of chick embryos (Heuer et al., 1990; vonBartheld et al., 1991). Thus, p75NTR may regulate early celldeath in the trochlear nucleus of chick embryos.
CONCLUSION
Our analysis of cell counting methods has shown thatstereological techniques, even when conceptually inge-nious and theoretically elegant as the optical disector, stillneed to be calibrated when they are applied to the realworld. Sectioning of actual tissue has its technical con-straints and can cause seemingly unpredictable patterns
184 W.J. HATTON AND C.S. VON BARTHELD
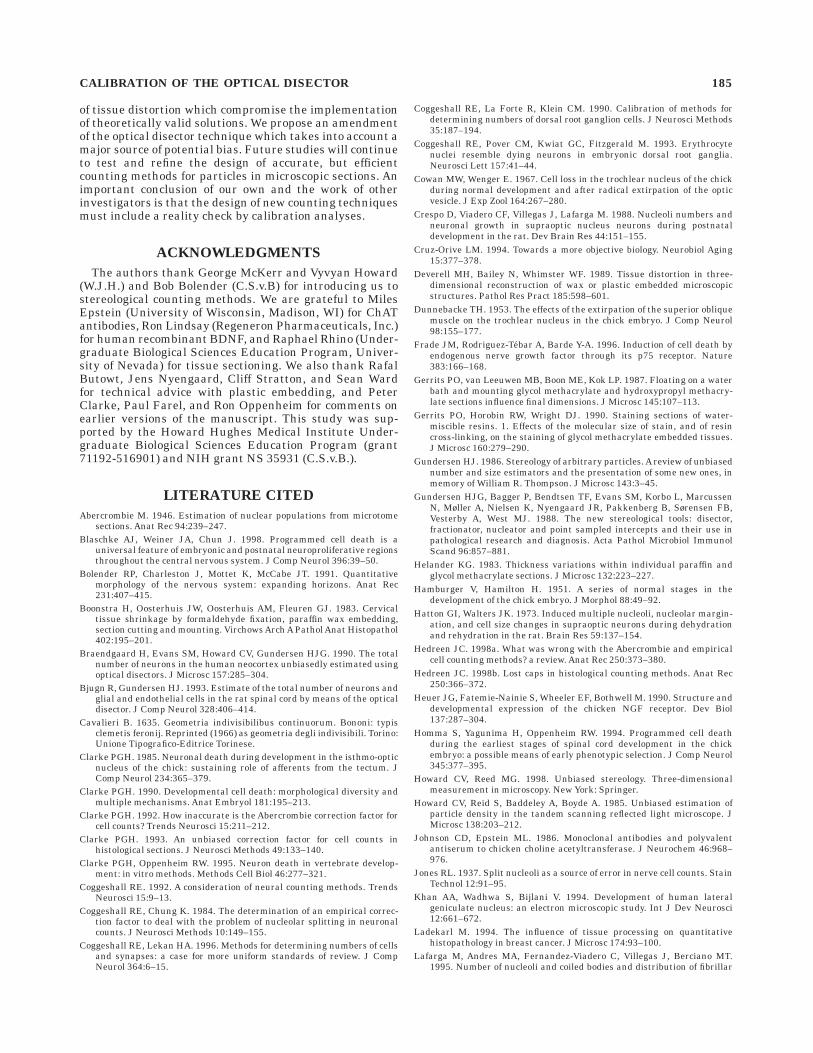
of tissue distortion which compromise the implementationof theoretically valid solutions. We propose an amendmentof the optical disector technique which takes into account amajor source of potential bias. Future studies will continueto test and refine the design of accurate, but efficientcounting methods for particles in microscopic sections. Animportant conclusion of our own and the work of otherinvestigators is that the design of new counting techniquesmust include a reality check by calibration analyses.
ACKNOWLEDGMENTS
The authors thank George McKerr and Vyvyan Howard(W.J.H.) and Bob Bolender (C.S.v.B) for introducing us tostereological counting methods. We are grateful to MilesEpstein (University of Wisconsin, Madison, WI) for ChATantibodies, Ron Lindsay (Regeneron Pharmaceuticals, Inc.)for human recombinant BDNF, and Raphael Rhino (Under-graduate Biological Sciences Education Program, Univer-sity of Nevada) for tissue sectioning. We also thank RafalButowt, Jens Nyengaard, Cliff Stratton, and Sean Wardfor technical advice with plastic embedding, and PeterClarke, Paul Farel, and Ron Oppenheim for comments onearlier versions of the manuscript. This study was sup-ported by the Howard Hughes Medical Institute Under-graduate Biological Sciences Education Program (grant71192-516901) and NIH grant NS 35931 (C.S.v.B.).
LITERATURE CITED
Abercrombie M. 1946. Estimation of nuclear populations from microtomesections. Anat Rec 94:239–247.
Blaschke AJ, Weiner JA, Chun J. 1998. Programmed cell death is auniversal feature of embryonic and postnatal neuroproliferative regionsthroughout the central nervous system. J Comp Neurol 396:39–50.
Bolender RP, Charleston J, Mottet K, McCabe JT. 1991. Quantitativemorphology of the nervous system: expanding horizons. Anat Rec231:407–415.
Boonstra H, Oosterhuis JW, Oosterhuis AM, Fleuren GJ. 1983. Cervicaltissue shrinkage by formaldehyde fixation, paraffin wax embedding,section cutting and mounting. Virchows Arch A Pathol Anat Histopathol402:195–201.
Braendgaard H, Evans SM, Howard CV, Gundersen HJG. 1990. The totalnumber of neurons in the human neocortex unbiasedly estimated usingoptical disectors. J Microsc 157:285–304.
Bjugn R, Gundersen HJ. 1993. Estimate of the total number of neurons andglial and endothelial cells in the rat spinal cord by means of the opticaldisector. J Comp Neurol 328:406–414.
Cavalieri B. 1635. Geometria indivisibilibus continuorum. Bononi: typisclemetis feronij. Reprinted (1966) as geometria degli indivisibili. Torino:Unione Tipografico-Editrice Torinese.
Clarke PGH. 1985. Neuronal death during development in the isthmo-opticnucleus of the chick: sustaining role of afferents from the tectum. JComp Neurol 234:365–379.
Clarke PGH. 1990. Developmental cell death: morphological diversity andmultiple mechanisms. Anat Embryol 181:195–213.
Clarke PGH. 1992. How inaccurate is the Abercrombie correction factor forcell counts? Trends Neurosci 15:211–212.
Clarke PGH. 1993. An unbiased correction factor for cell counts inhistological sections. J Neurosci Methods 49:133–140.
Clarke PGH, Oppenheim RW. 1995. Neuron death in vertebrate develop-ment: in vitro methods. Methods Cell Biol 46:277–321.
Coggeshall RE. 1992. A consideration of neural counting methods. TrendsNeurosci 15:9–13.
Coggeshall RE, Chung K. 1984. The determination of an empirical correc-tion factor to deal with the problem of nucleolar splitting in neuronalcounts. J Neurosci Methods 10:149–155.
Coggeshall RE, Lekan HA. 1996. Methods for determining numbers of cellsand synapses: a case for more uniform standards of review. J CompNeurol 364:6–15.
Coggeshall RE, La Forte R, Klein CM. 1990. Calibration of methods fordetermining numbers of dorsal root ganglion cells. J Neurosci Methods35:187–194.
Coggeshall RE, Pover CM, Kwiat GC, Fitzgerald M. 1993. Erythrocytenuclei resemble dying neurons in embryonic dorsal root ganglia.Neurosci Lett 157:41–44.
Cowan MW, Wenger E. 1967. Cell loss in the trochlear nucleus of the chickduring normal development and after radical extirpation of the opticvesicle. J Exp Zool 164:267–280.
Crespo D, Viadero CF, Villegas J, Lafarga M. 1988. Nucleoli numbers andneuronal growth in supraoptic nucleus neurons during postnataldevelopment in the rat. Dev Brain Res 44:151–155.
Cruz-Orive LM. 1994. Towards a more objective biology. Neurobiol Aging15:377–378.
Deverell MH, Bailey N, Whimster WF. 1989. Tissue distortion in three-dimensional reconstruction of wax or plastic embedded microscopicstructures. Pathol Res Pract 185:598–601.
Dunnebacke TH. 1953. The effects of the extirpation of the superior obliquemuscle on the trochlear nucleus in the chick embryo. J Comp Neurol98:155–177.
Frade JM, Rodriguez-Tebar A, Barde Y-A. 1996. Induction of cell death byendogenous nerve growth factor through its p75 receptor. Nature383:166–168.
Gerrits PO, van Leeuwen MB, Boon ME, Kok LP. 1987. Floating on a waterbath and mounting glycol methacrylate and hydroxypropyl methacry-late sections influence final dimensions. J Microsc 145:107–113.
Gerrits PO, Horobin RW, Wright DJ. 1990. Staining sections of water-miscible resins. 1. Effects of the molecular size of stain, and of resincross-linking, on the staining of glycol methacrylate embedded tissues.J Microsc 160:279–290.
Gundersen HJ. 1986. Stereology of arbitrary particles. A review of unbiasednumber and size estimators and the presentation of some new ones, inmemory of William R. Thompson. J Microsc 143:3–45.
Gundersen HJG, Bagger P, Bendtsen TF, Evans SM, Korbo L, MarcussenN, Møller A, Nielsen K, Nyengaard JR, Pakkenberg B, Sørensen FB,Vesterby A, West MJ. 1988. The new stereological tools: disector,fractionator, nucleator and point sampled intercepts and their use inpathological research and diagnosis. Acta Pathol Microbiol ImmunolScand 96:857–881.
Helander KG. 1983. Thickness variations within individual paraffin andglycol methacrylate sections. J Microsc 132:223–227.
Hamburger V, Hamilton H. 1951. A series of normal stages in thedevelopment of the chick embryo. J Morphol 88:49–92.
Hatton GI, Walters JK. 1973. Induced multiple nucleoli, nucleolar margin-ation, and cell size changes in supraoptic neurons during dehydrationand rehydration in the rat. Brain Res 59:137–154.
Hedreen JC. 1998a. What was wrong with the Abercrombie and empiricalcell counting methods? a review. Anat Rec 250:373–380.
Hedreen JC. 1998b. Lost caps in histological counting methods. Anat Rec250:366–372.
Heuer JG, Fatemie-Nainie S, Wheeler EF, Bothwell M. 1990. Structure anddevelopmental expression of the chicken NGF receptor. Dev Biol137:287–304.
Homma S, Yagunima H, Oppenheim RW. 1994. Programmed cell deathduring the earliest stages of spinal cord development in the chickembryo: a possible means of early phenotypic selection. J Comp Neurol345:377–395.
Howard CV, Reed MG. 1998. Unbiased stereology. Three-dimensionalmeasurement in microscopy. New York: Springer.
Howard CV, Reid S, Baddeley A, Boyde A. 1985. Unbiased estimation ofparticle density in the tandem scanning reflected light microscope. JMicrosc 138:203–212.
Johnson CD, Epstein ML. 1986. Monoclonal antibodies and polyvalentantiserum to chicken choline acetyltransferase. J Neurochem 46:968–976.
Jones RL. 1937. Split nucleoli as a source of error in nerve cell counts. StainTechnol 12:91–95.
Khan AA, Wadhwa S, Bijlani V. 1994. Development of human lateralgeniculate nucleus: an electron microscopic study. Int J Dev Neurosci12:661–672.
Ladekarl M. 1994. The influence of tissue processing on quantitativehistopathology in breast cancer. J Microsc 174:93–100.
Lafarga M, Andres MA, Fernandez-Viadero C, Villegas J, Berciano MT.1995. Number of nucleoli and coiled bodies and distribution of fibrillar
CALIBRATION OF THE OPTICAL DISECTOR 185
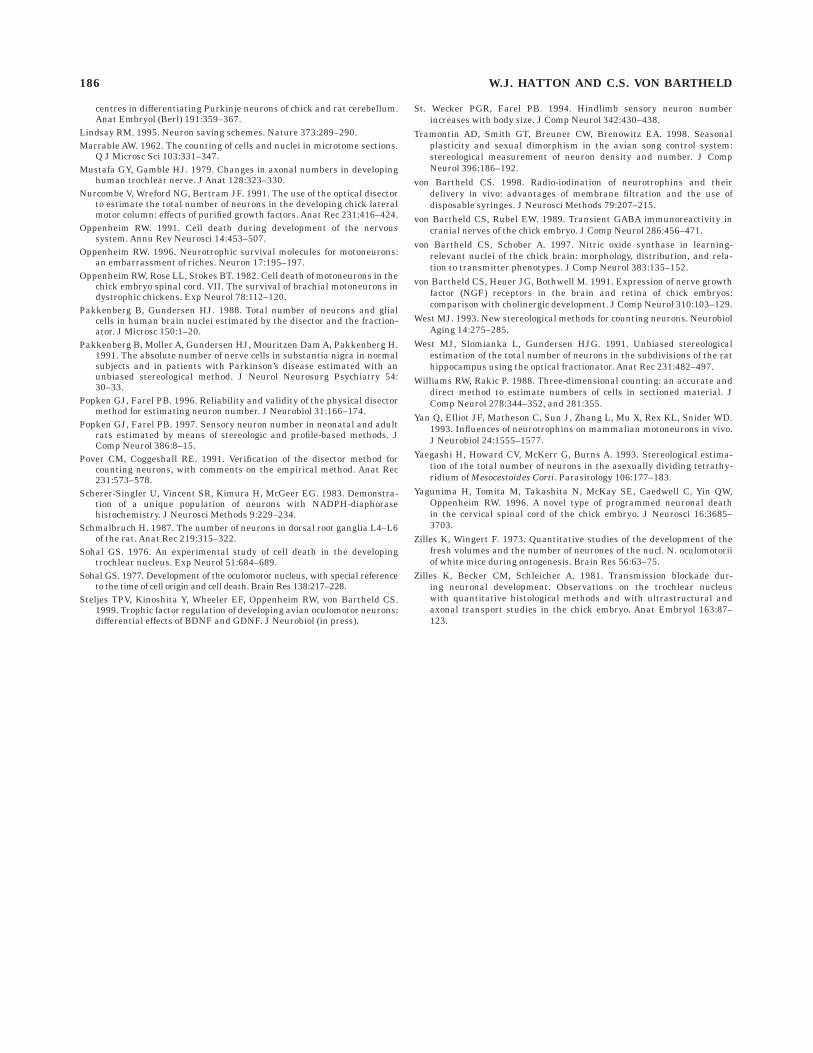
centres in differentiating Purkinje neurons of chick and rat cerebellum.Anat Embryol (Berl) 191:359–367.
Lindsay RM. 1995. Neuron saving schemes. Nature 373:289–290.Marrable AW. 1962. The counting of cells and nuclei in microtome sections.
Q J Microsc Sci 103:331–347.Mustafa GY, Gamble HJ. 1979. Changes in axonal numbers in developing
human trochlear nerve. J Anat 128:323–330.Nurcombe V, Wreford NG, Bertram JF. 1991. The use of the optical disector
to estimate the total number of neurons in the developing chick lateralmotor column: effects of purified growth factors. Anat Rec 231:416–424.
Oppenheim RW. 1991. Cell death during development of the nervoussystem. Annu Rev Neurosci 14:453–507.
Oppenheim RW. 1996. Neurotrophic survival molecules for motoneurons:an embarrassment of riches. Neuron 17:195–197.
Oppenheim RW, Rose LL, Stokes BT. 1982. Cell death of motoneurons in thechick embryo spinal cord. VII. The survival of brachial motoneurons indystrophic chickens. Exp Neurol 78:112–120.
Pakkenberg B, Gundersen HJ. 1988. Total number of neurons and glialcells in human brain nuclei estimated by the disector and the fraction-ator. J Microsc 150:1–20.
Pakkenberg B, Moller A, Gundersen HJ, Mouritzen Dam A, Pakkenberg H.1991. The absolute number of nerve cells in substantia nigra in normalsubjects and in patients with Parkinson’s disease estimated with anunbiased stereological method. J Neurol Neurosurg Psychiatry 54:30–33.
Popken GJ, Farel PB. 1996. Reliability and validity of the physical disectormethod for estimating neuron number. J Neurobiol 31:166–174.
Popken GJ, Farel PB. 1997. Sensory neuron number in neonatal and adultrats estimated by means of stereologic and profile-based methods. JComp Neurol 386:8–15.
Pover CM, Coggeshall RE. 1991. Verification of the disector method forcounting neurons, with comments on the empirical method. Anat Rec231:573–578.
Scherer-Singler U, Vincent SR, Kimura H, McGeer EG. 1983. Demonstra-tion of a unique population of neurons with NADPH-diaphorasehistochemistry. J Neurosci Methods 9:229–234.
Schmalbruch H. 1987. The number of neurons in dorsal root ganglia L4–L6of the rat. Anat Rec 219:315–322.
Sohal GS. 1976. An experimental study of cell death in the developingtrochlear nucleus. Exp Neurol 51:684–689.
Sohal GS. 1977. Development of the oculomotor nucleus, with special referenceto the time of cell origin and cell death. Brain Res 138:217–228.
Steljes TPV, Kinoshita Y, Wheeler EF, Oppenheim RW, von Bartheld CS.1999. Trophic factor regulation of developing avian oculomotor neurons:differential effects of BDNF and GDNF. J Neurobiol (in press).
St. Wecker PGR, Farel PB. 1994. Hindlimb sensory neuron numberincreases with body size. J Comp Neurol 342:430–438.
Tramontin AD, Smith GT, Breuner CW, Brenowitz EA. 1998. Seasonalplasticity and sexual dimorphism in the avian song control system:stereological measurement of neuron density and number. J CompNeurol 396:186–192.
von Bartheld CS. 1998. Radio-iodination of neurotrophins and theirdelivery in vivo: advantages of membrane filtration and the use ofdisposable syringes. J Neurosci Methods 79:207–215.
von Bartheld CS, Rubel EW. 1989. Transient GABA immunoreactivity incranial nerves of the chick embryo. J Comp Neurol 286:456–471.
von Bartheld CS, Schober A. 1997. Nitric oxide synthase in learning-relevant nuclei of the chick brain: morphology, distribution, and rela-tion to transmitter phenotypes. J Comp Neurol 383:135–152.
von Bartheld CS, Heuer JG, Bothwell M. 1991. Expression of nerve growthfactor (NGF) receptors in the brain and retina of chick embryos:comparison with cholinergic development. J Comp Neurol 310:103–129.
West MJ. 1993. New stereological methods for counting neurons. NeurobiolAging 14:275–285.
West MJ, Slomianka L, Gundersen HJG. 1991. Unbiased stereologicalestimation of the total number of neurons in the subdivisions of the rathippocampus using the optical fractionator. Anat Rec 231:482–497.
Williams RW, Rakic P. 1988. Three-dimensional counting: an accurate anddirect method to estimate numbers of cells in sectioned material. JComp Neurol 278:344–352, and 281:355.
Yan Q, Elliot JF, Matheson C, Sun J, Zhang L, Mu X, Rex KL, Snider WD.1993. Influences of neurotrophins on mammalian motoneurons in vivo.J Neurobiol 24:1555–1577.
Yaegashi H, Howard CV, McKerr G, Burns A. 1993. Stereological estima-tion of the total number of neurons in the asexually dividing tetrathy-ridium of Mesocestoides Corti. Parasitology 106:177–183.
Yagunima H, Tomita M, Takashita N, McKay SE, Caedwell C, Yin QW,Oppenheim RW. 1996. A novel type of programmed neuronal deathin the cervical spinal cord of the chick embryo. J Neurosci 16:3685–3703.
Zilles K, Wingert F. 1973. Quantitative studies of the development of thefresh volumes and the number of neurones of the nucl. N. oculomotoriiof white mice during ontogenesis. Brain Res 56:63–75.
Zilles K, Becker CM, Schleicher A. 1981. Transmission blockade dur-ing neuronal development. Observations on the trochlear nucleuswith quantitative histological methods and with ultrastructural andaxonal transport studies in the chick embryo. Anat Embryol 163:87–123.
186 W.J. HATTON AND C.S. VON BARTHELD