Embed Size (px)
Citation preview

science for a changing world
Prepared in cooperation with the National Guard Bureau
il l
Analysis of Carbon Isotopes, Determination of Ground-Water Age, and Estimated Characteristics of the Contaminant Source at Two Fuel-Spill Plumes, Western Cape Cod, Massachusetts, 1996
Water-Resources Investigations Report 98-4112
U.S. Department of the Interior U.S. Geological Survey


U.S. Department of the Interior U.S. Geological Survey
Analysis of Carbon Isotopes, Determination of Ground-Water Age, and Estimated Characteristics of the Contaminant Source at Two Fuel-Spill Plumes, Western Cape Cod, Massachusetts, 1996
By JENNIFER G.SAVOIE
Water-Resources Investigations Report 98-4112
Prepared in cooperation with the NATIONAL GUARD BUREAU
Northborough, Massachusetts 1999
U.S. DEPARTMENT OF THE INTERIOR
BRUCE BABBITT, Secretary
U.S. GEOLOGICAL SURVEY Charles G. Groat, Director
The use of trade or product names in this report is for identification purposes only and does not constitute endorsement by the U.S. Geological Survey.
For additional information write to:
Chief, Massachusetts-Rhode Island District U.S. Geological Survey Water Resources Division lOBearfoot Road Northborough, MA01532
Copies of this report can be purchased from:
U.S. Geological Survey Information Services Box 25286 Denver, CO 80225-0286

CONTENTS
Abstract .............................................................................................................................^ 1Introduction........................................................................................................................................................................... 2Acknowledgments............................................................^ 4Background..........................................................^ 4
Site Background.......................................................................................................................................................... 4Stable Carbon Isotopes................................................................................................................................................ 6Age Determination of Ground Water.......................................................................................................................... 8
Study Design......................................................................................................................................................................... 9Methods..... ............................................................. 10
Field........................................................................................^^ 10Laboratory .................................................................................................................................................................. 10
Analysis of Stable Carbon Isotopes and Determination of Ground-Water Age.................................................................... 11Isotope and Water Chemistry ...................................................................................................................................... 11Determination of Ground-Water Age.......................................................................................................................... 15
Estimated Characteristics of the Contaminant Source.......................................................................................................... 16Isotopic Evidence of Petroleum Hydrocarbon Source................................................................................................ 16Estimate of Source Isotopic Signature.....................................................................:.................................................. 17Possible Fuel Spill-28 Source Characteristics............................................................................................................. 17
Summary and Conclusions.................................................................................................................................................... 19References Cited ................................................................................................................................................................... 20
FIGURES
1,2. Maps showing:1. Location of Fuel Spill-12 and -28 study areas, and altitude of the water table, western Cape Cod,
Massachusetts.................................................................................................................................................... 32. Location of Fuel Spill-28 plume, monitoring wells used for water-quality sampling, and general
ground-water-flow direction, western Cape Cod, Massachusetts...................................................................... 53. Vertical distribution of Fuel Spill-28 plume in ground water along section A-A', western Cape Cod,
Massachusetts........................................................................................................^^ 64. Map showing location of Fuel Spill-12 plume, monitoring wells used for water-quality sampling, and
general ground-water-flow direction, western Cape Cod, Massachusetts.................................................................. 75. Graph showing relation between isotopic signature and dissolved inorganic carbon for ground-water
samples in and near the Fuel Spill-12 and -28 plumes and the Ashumet Valley, western Cape Cod, Massachusetts......................................................................................................_^ 15
TABLES
1. Location coordinates, land-surface and well-screen altitudes, and water levels for monitoring wells inand near the Fuel Spill-12 and -28 plumes, western Cape Cod, Massachusetts ........................................................ 9
2. Field water-quality analyses for ground-water samples in and near the Fuel Spill-12 and -28 plumes,western Cape Cod, Massachusetts, September and December 1996 ......................................................................... 11
3. Chemical composition and isotopic ratios for ground-water samples in and near the Fuel Spill-12 and -28plumes, western Cape Cod, Massachusetts, September and December 1996............................................................ 13
4. Age determination for ground-water samples in and near the Fuel Spill-28 plume, western Cape Cod,Massachusetts, September and December 1996......................................................................................................... 16
Contents III

CONVERSION FACTORS, VERTICAL DATUM, AND CHEMICAL ABBREVIATIONS
CONVERSION FACTORS
___ Multiply By To obtain
foot (ft) 0.3048 meter inch (in) 25.4 millimeter mile(mi) 1.609 kilometer
square mile (mi2) 12.590 square kilometergallon (gal) 3.785 liter
Temperature in degrees Fahrenheit (°F) can be converted to degrees Celsius (°C) ____________________as follows: °C=5/9(°F-32)______________
VERTICAL DATUM
Sea level: In this report, "sea level" refers to the National Geodetic Vertical Datum of 1929 (NGVD of 1929) a geodetic datum derived from a general adjustment of the first-order level nets of the United States and Canada, formerly called Sea Level Datum of 1929.
CHEMICAL ABBREVIATIONS
L liter
L/min liter per minutefig microgram\Lg/L microgram per literJim micrometermg/L milligram per litermL milliliterNTU Nephelometric Turbidity UnitjxS/cm microsiemen per centimeter at 25° C
IV Contents

Analysis of Carbon Isotopes, Determination of Ground-Water Age, and Estimated Characteristics of the Contaminant Source at Two Fuel-Spill Plumes, Western Cape Cod, Massachusetts, 1996
By Jennifer G. Savoie
Abstract
Carbon isotopes were analyzed and ground- water ages were determined for ground-water samples collected from two fuel-spill plumes near the Massachusetts Military Reservation, western Cape Cod, Massachusetts, to provide information on the chemical characteristics of the plumes and their contaminant sources. One contaminant found in the plumes is 1,2-dibromoethane (commonly known as ethylene dibromide, or EDB), which was once used as an additive to fuels. The EDB in the Fuel Spill-12 plume is found with the fuel- related compound benzene; however, in the Fuel Spill-28 plume the EDB has not been clearly identified with any other fuel-related compounds. In this study, alternative methods were sought to help understand the history and identify a potential source of the Fuel Spill-28 plume because the source could not be identified based on conventional approaches.
The U.S. Geological Survey collected ground-water samples from monitoring wells in the Fuel Spill-12 and -28 EDB plumes to analyze for carbon isotopes and to determine ground-water age. Samples were analyzed for carbon isotopes to determine if an isotopic signature similar to that of petroleum hydrocarbons could be observed in the dissolved inorganic carbon (DIC) of the ground water containing EDB. Ground-water samples were collected from the Fuel Spill-28 plume,
where EDB contamination is present and the source has not been identified, and from the Fuel Spill-12 plume, where EDB and benzene are present and the source is known to be a leak from a ruptured fuel pipeline. A fuel sample collected from the source area of the Fuel Spill-12 plume also was analyzed for carbon isotopes.
The carbon isotopic values of DIC in ground water in the two plumes and uncontaminated ground water were measured. The carbon isotopic content (813C) of the DIC in the ground water containing EDB averaged -28 parts per thousand; the values in uncontaminated ground water averaged -20.5 parts per thousand and were as much as 10 parts per thousand more depleted in 13C than the values in the water containing EDB. A trend of greater 13C-depletion, or lighter isotopic content, with greater concentration of DIC was indicated in the plumes. The isotopic trend in the plumes was similar to signatures typical of petroleum hydrocarbon compounds. This trend indicates that the Fuel Spill-28 plume could be a "shadow" of a former fuel plume in which other fuel-related compounds have been microbially degraded to other compounds, such as carbon dioxide. Carbon isotopic analysis can be a valuable tool to demonstrate that fuel contamination of an aquifer occurred and that the petroleum hydrocarbons have been naturally degraded to other compounds.
Abstract 1

Chlorofluorocarbon and tritium/helium ground-water age analyses al.so were performed to estimate the age of ground water in the Fuel Spill- 28 plume. The age determinations indicate that the ground water containing the EDB could have entered the ground-water system in the early 1950's, which is consistent with the time period when EDB was used in fuels and when large quantities of fuels are known to have been used at the Massachusetts Military Reservation. The age determinations also indicate that the contaminants may have continued entering the ground-water system until the 1970's.
INTRODUCTION
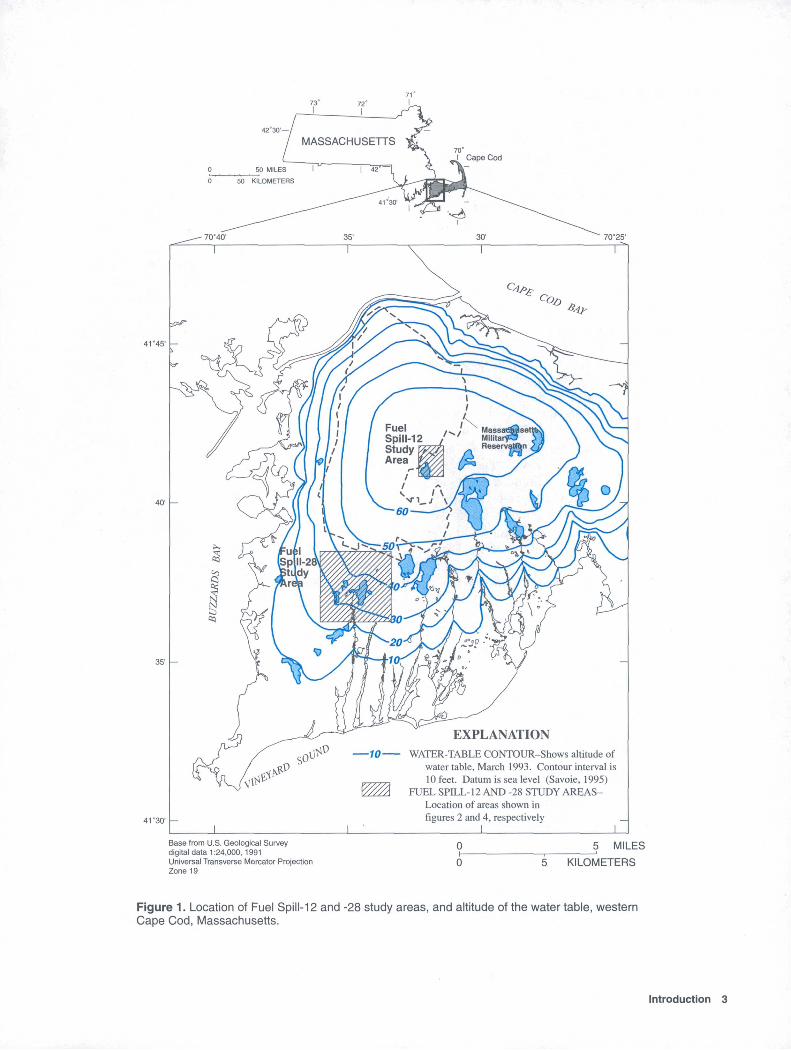
The western Cape Cod regional ground-water- flow system is characterized by a freshwater cell, or ground-water mound, where ground water flows radially from areas of recharge to areas of discharge. Ground water beneath and downgradient of the Massachusetts Military Reservation (MMR), on Cape Cod, Massachusetts, has been affected by various contaminants, such as fuels, chlorinated solvents, and landfill and sewage wastes, during decades of past military operations. These contaminants have entered the ground-water system and are flowing away from the MMR in the underlying sand-and-gravel aquifer toward streams, ponds, and coastal bays. Contaminants that enter the water table near the top of the ground- water mound can move deep within the aquifer until reaching areas of discharge, such as ponds and streams or the coastal saltwater interface, where they move upward. To date (1998), 11 contaminanfplumes have been identified on the MMR. One contaminant of particular interest, 1,2-dibromoethane (commonly known as ethylene dibromide, or EDB), has been detected in monitoring wells across the MMR and beyond the MMR boundaries, including the Fuel Spill- 12 (FS-12) and Fuel Spill-28 (FS-28) plumes (fig. 1). Detections of EDB have raised concerns because EDB is a toxic chemical that has a Massachusetts Department of Environmental Protection (MADEP) Drinking Water Standard of 0.02 ug/L (Massachusetts Department of Environmental Protection, 1997). The source of EDB in the FS-28 plume is suspected by the MMR Installation Restoration Program (IRP) to be
fuels; however, no record of a specific fuel spill on the MMR could be identified as the cause of the EDB contamination, and fuel compounds were not present with the EDB. Concerns developed about whether the source of the contamination was on the MMR or possibly at another location because the cause for the EDB plume could not be explained and the EDB was detected in ground water as far as 14,000 ft from the MMR.
In September and December 1996, the U.S. Geological Survey (USGS), in cooperation with the National Guard Bureau, conducted a small-scale study to determine if analysis of carbon isotopes could indicate whether EDB-contaminated ground water in the FS-28 plume was once associated with petroleum hydrocarbons. Ground-water ages were determined to identify the dates when the FS-28 contamination entered the ground-water system and to compare them with dates calculated from ground-water-flow-model simulations. Together, the carbon isotope analysis and age determinations were used to estimate source characteristics for the FS-28 contaminant plume.
Ground-water samples were collected by the USGS from 12 wells in the FS-12 and FS-28 plumes and in nearby uncontaminated ground water. Chemical constituents indicative of the redox conditions associated with contaminant biodegradation, such as dissolved oxygen, iron, manganese, sulfate, and methane, also were measured. A sample of the fuel collected from the source of the FS-12 plume was analyzed for its carbon isotopic content. The approximate age of the contaminated ground water was determined for ground-water samples collected in the FS-28 plume using chlorofluorocarbon (CFC) concentrations and tritium/helium ratios.
This report describes the results of analysis of stable carbon isotopes of DIG in the FS-12 and FS-28 plumes. The analysis is used to estimate the contaminant source characteristics for the two EDB plumes. The report also describes the use of CFC concentrations and tritium/helium ratios to determine the apparent age of the ground water measured in and near the FS-28 plume. These data may support the hypothesis that the FS-28 EDB plume is the remnant of an earlier fuel spill or spills and that the petroleum hydrocarbons have been microbially degraded to concentrations less than detection limits.
2 Carbon Isotopes, Ground-Water Age, and Characteristics of the Contaminant Source at Two Fuel-Spill Plumes, Cape Cod, Mass.
73°
35'
41 '30'
10EXPLANATION
WATER-TABLE CONTOUR-Shows altitude of water table, March 1993. Contour interval is 10 feet. Datum is sea level (Savoie, 1995)
FUEL SPILL-12 AND -28 STUDY AREAS- Location of areas shown in figures 2 and 4, respectively
________I______________LBase from U.S. Geological Survey digital data 1:24,000, 1991 Universal Transverse Mercator Projection Zone 19
MILES
KILOMETERS
Figure 1. Location of Fuel Spill-12 and -28 study areas, and altitude of the water table, western Cape Cod, Massachusetts.
Introduction 3

ACKNOWLEDGMENTS
The author thanks the Air Force Center for Environmental Excellence, Lauren E. Foster of Jacobs Engineering Group, Inc., and Binks Colby-George of ABB Environmental Services, Inc., for their contributions to this study. The author also thanks Denis R. LeBlanc and Timothy D. McCobb of the USGS for their assistance in project planning and the collection of water samples.
BACKGROUND
Site Background
EDB detections in the FS-28 plume have raised concerns about releases of fuel containing EDB on the MMR and potential sources of the EDB contamination. EDB is soluble in water and does not readily sorb to aquifer materials such as sand and gravel. Therefore, EDB can be transported at about the rate of ground- water flow (Katz, 1993). EDB was used in leaded and aviation fuels from about 1923 until the 1980's as a lead scavenger to reduce lead deposition in internal combustion engines. EDB concentrations in fuels ranged from 69 to 371 mg/L with about 1 part EDB to 20 parts benzene (Weaver and others, 1988). EDB also was used in soil treatment and post-harvest treatment of fruits, vegetables, and grains as an insecticide to kill nematodes and insects from the early 1950's to 1983, when it was banned for agricultural purposes by the U.S. Environmental Protection Agency (1983).
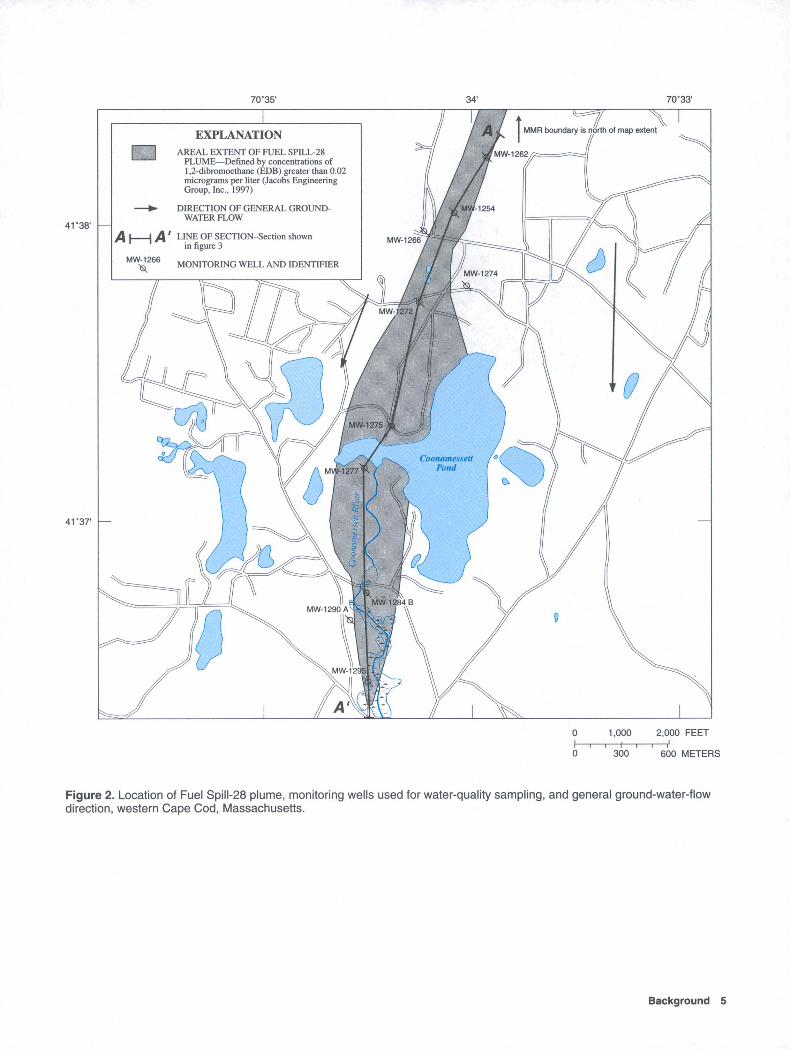
The contaminant plume designated as the FS-28 plume is believed to be a fuel spill (as opposed to an insecticide or solvent spill). The toe of the plume is about 14,000 ft south of the MMR boundary (fig. 2). The source area and northern extent of the plume are unknown and are under investigation by the MMR IRP. The FS-28 plume is deep in the aquifer, more than 100 ft below the water table, and passes beneath Coonamessett Pond (fig. 3). Because the plume is deep in the aquifer, the source area is assumed to be farther upgradient near the top of the ground-water mound.
The leading edge of the plume rises upward and discharges into the Coonamessett River, a local ground-water discharge area. Fuel-related compounds, such as benzene, toluene, ethylene, and xylene (BTEX compounds), and chlorinated solvent compounds have been detected sporadically in the FS-28 plume, but the plume generally contains EDB, with concentrations as high as 16 |lg/L (ABB Environmental Services, Inc., 1995,1996; Jacobs Engineering Group, Inc., 1997a). It has been hypothesized that other petroleum hydrocarbons that might have been released with the EDB have been preferentially degraded compared to EDB and are no longer present in the plume in high concentrations. Preliminary investigations by the IRP and particle-path simulations with a USGS numerical ground-water-flow model (Masterson and others, 1997) indicate that the source area for the FS-28 plume might be near the former motor pools on the MMR; however, there are no records of specific fuel spills or agricultural use of EDB in these potential source areas.
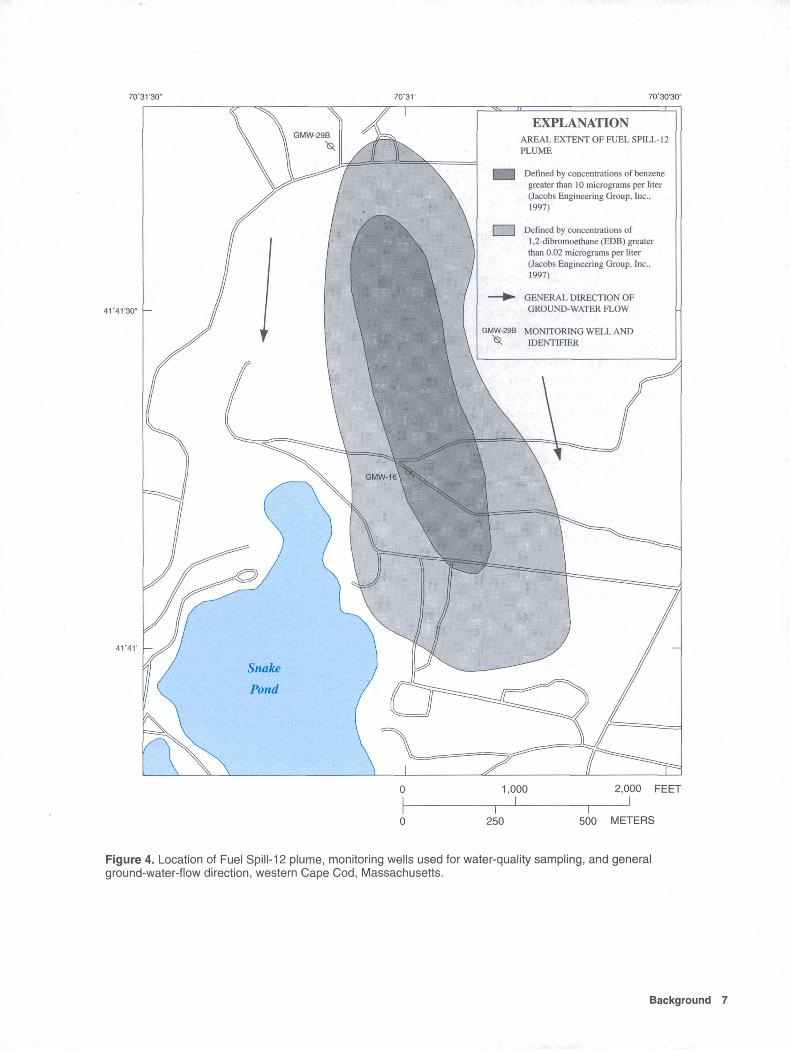
The FS-12 plume is another ground-water plume near the MMR that contains EDB (fig. 4). The source area of the FS-12 plume is known. In 1972, several thousand gallons of aviation fuel leaked from an underground pipeline that extended from the Cape Cod Canal to the MMR. An investigation of the site in 1991 revealed fuel floating on the water table and high concentrations of EDB and benzene in ground water downgradient from the source (Advanced Sciences, Inc., 1992, 1995). Efforts by the IRP have since removed the floating fuel from the water table and, in 1997, remediation of the contaminated ground water began with a pump-and-treat facility. The FS-12 plume provides the opportunity to compare the chemical and isotopic characteristics at sites where the source of EDB is unknown to a site where EDB and benzene were released together into the aquifer from a recent known source. The petroleum hydrocarbons at the FS-12 site have not biologically degraded to undetectable concentrations, and study of this site could aid understanding of the chemical and biological processes affecting other fuel- and EDB-contaminated ground water on the MMR.
4 Carbon Isotopes, Ground-Water Age, and Characteristics of the Contaminant Source at Two Fuel-Spill Plumes, Cape Cod, Mass.
70'35' 70'33'
4V38'
41'37'
MMR boundary is north of map extent
MW-1262
EXPLANATIONAREAL EXTENT OF FUEL SPILL-28
PLUME Defined by concentrations of 1,2-dibromoethane (EDB) greater than 0.02 micrograms per liter (Jacobs Engineering Group, Inc., 1997)
DIRECTION OF GENERAL GROUND- WATER FLOW
I | A LINE OF SECTION-Section shown in figure 3
MV\M266 MONITORING WELL AND IDENTIFIER
Coonamessett Pond
1,000 2,000 FEET I
300 600 METERS
Figure 2. Location of Fuel Spill-28 plume, monitoring wells used for water-quality sampling, and general ground-water-flow direction, western Cape Cod, Massachusetts.
Background 5

Coonamessett River Discharge Area
ILaroLsurface MW 1275 MW 1277
Sand with lenses of silty sand silt, silty clay, and grave
Fuel Spill-28 EDB Plume
-300Modified from written communication Jacobs Engineering Group, Inc. (1998) and ABB Environmental Services (1996).
MW 1254
1,000 2,000 FEET
EXPLANATION0 300 600 METERS
VERTICAL SCALE GREATLY EXAGGERATED
MONITORING WELL-Shows altitude of screened interval. Number is site identifier shown in figure 2
BOUNDARY OF GENERAL PLUME LOCATION
GENERAL DIRECTION OF GROUND-WATER FLOW
Figure 3. Vertical distribution of Fuel Spill-28 plume in ground water along section A-A', western Cape Cod, Massachusetts. (Location of section is shown in figure 2.) ; ,: ,,..: , <,;
Stable Carbon Isotopes
Isotopes are atoms of particular elements that contain the same number of protons and electrons but differing numbers of neutrons. The carbon atom has 6 protons and 6 electrons, and includes atoms that contain 6, 7, or 8 neutrons 12C, 13C, and 14C, respectively. Isotopes can be divided into stable isotopes and unstable or radioactive isotopes. Stable isotopes do not decay radioactively; the number of electrons and the electronic structure remain the same. Radioactive isotopes spontaneously emit nuclear particles, or electromagnetic radiation, and break down or decay. The stable carbon isotopes 12C and 13C account for 98.90 and 1.10 percent of terrestrial
carbon, respectively; radioactive 14C accounts for about 10" 10 percent of terrestrial carbon. Atomic mass differences among stable isotopes of a particular element affect the rate at which the isotopes react in chemical reactions. Isotopes with lighter atomic mass react faster than isotopes with a heavier atomic mass.
Natural substances contain varying ratios of stable isotopes; processes that alter the stable isotopic ratios in substances are referred to as isotopic fractionation. For example, carbon isotopes are fractionated naturally through processes such as photosynthesis and exchange reactions because of their differences in atomic mass. The fractionation process causes carbon in plants to be enriched in 12C and carbonate minerals to be enriched in 13C.
6 Carbon Isotopes, Ground-Water Age, and Characteristics of the Contaminant Source at Two Fuel-Spill Plumes, Cape Cod, Mass.
70'31'30" 70- 30'30"
GENERAL DIRECTION OF GROUND-WATER FLOW
GMW-29B MONITORING WELL AND IDENTIFIER . .:,.
41'41'30"
41'41'
EXPLANATIONAREAL EXTENT OF FUEL SPILL-12 PLUME : .-. :
BHB Defined by concentrations of benzene greater than 10 micrograms per liter (Jacobs Engineering Group, Inc., 1997)
| [ Defined by concentrations of1,2-dibromoethane (EDB) greater than 0.02 micrograms per liter (Jacobs Engineering Group, Inc., 1997)
1,000 2,000 FEET
250I
500 METERS
Figure 4. Location of Fuel Spill-12 plume, monitoring wells used for water-quality sampling, and general ground-water-flow direction, western Cape Cod, Massachusetts.
Background 7

Because petroleum hydrocarbons are derived from plant matter, they also are enriched in 12C. DIG in the form of carbon dioxide (COi) in ground water can be derived from atmospheric CC>2, dissolution of carbonate minerals, and the metabolism of organic carbon compounds by microorganisms, all of which have unique isotopic signatures. Therefore, CO2 derived from differing sources can potentially be differentiated by analysis of its stable isotopic ratio ( 13C/12C) (Faure, 1977).
The stable isotopic ratio of carbon in a ground- water sample is measured by a mass spectrometer after the carbon compounds in the sample have been converted to CO2- The relative difference between the carbon isotopic composition of the sample and a standard (Vienna PeeDee belemnite) is used in the analytical method and, therefore, is reported in a differential notation, delta (8). The 13C/12C isotopic ratio of a sample is calculated using the equation
813C(%0) = [RL ^
x 1,000standard
where R is the ratio of 13C/12C in the sample or standard. Values are reported in parts per thousand; therefore, the %o notation is commonly referred to as "perrmT'or"perrnille."
In ground- water systems where oxygen or other electron acceptors (such as iron (III), nitrate, and sulfate) are present and microbial oxidation of petroleum hydrocarbons has occurred, the CO2 produced (as measured in DIG) has been shown to have a carbon isotopic signature that is depleted in 13C (often referred to as lighter) relative to systems where oxygen or other electron acceptors are not present. This oxidation produces carbon isotopic values similar to the carbon isotopic value of the hydrocarbon being degraded because little kinetic fractionation occurs. Typical petroleum hydrocarbons have 8 13C values that range from about -26 to -30 %o (Aggarwal and Hinchee, 1991; Coleman and Fry, 1991; Landmeyer and others, 1996). When ground water is depleted of oxygen and other electron acceptors are not available, methanogenic conditions are present and degradation of petroleum hydrocarbons results in carbon isotopic signatures of CO2 (as measured in DIG) that are 13C- enriched (often referred to as heavier) and methane that are 13C-depleted (Baedecker and others, 1989; Landmeyer and others, 1996).
Age Determination of Ground Water
Age determination of ground water is based on the principle that recharge water has an atmospheric chemical and isotopic signature that is specific to the time it enters the saturated zone. Once the water is below the water table and is isolated from the atmosphere, the signature is preserved and the age of the ground water can be determined. By knowing the historical input of specific chemicals and the rate of decay of radioactive isotopes, the age of the uniquely "marked" ground water can be estimated by measuring the concentrations of these markers in the water and back-calculating the time of recharge. CFC compounds and tritium/helium (3H/3He) ratios were used to determine the ground-water age in and near the FS-28 plume in this study because the historical input of CFCs and 3H/3He is known. Also, they are conservative tracers that generally move at the average rate of ground-water flow.
CFC compound analyses are used to determine the ground-water age based on concentrations of syn thetic stable compounds, primarily dichlorodifluo- romethane, trichlorofluoromethane, and trichloro- trifluoroethane, in ground water. These compounds were introduced into the atmosphere as early as the 1930's, and atmospheric concentrations have since increased steadily. Atmospheric CFC concentrations have been monitored since the mid-1970's. Prior esti mates of concentrations are based on factors such as the rates at which the chemicals were manufactured and released and the expected rates of removal by pho tolysis and terrestrial processes. Concentrations of CFC compounds are measurable in post-1945 ground water worldwide; thus, CFC compound analyses are useful for determining the age of waters that entered ground-water systems during the past 50 years. Con centrations of these compounds in ground water can be related using known equilibrium constants to a corre sponding atmospheric concentration; these estimated atmospheric concentrations can be compared to histori cal data to determine approximate recharge dates of the ground water. The limitations of using CFC compound analyses to determine ground-water age include local atmospheric contamination, hydrodynamic dispersion, sorption, possible gas diffusion through a thick unsat- urated zone, and microbial degradation of the com pounds under anaerobic (methanogenic) conditions. Atmospheric dispersion has a minimal effect on CFC concentrations because the rate of CFC input into the atmosphere since the 1930's has been almost constant;
8 Carbon Isotopes, Ground-Water Age, and Characteristics of the Contaminant Source at Two Fuel-Spill Plumes, Cape Cod, Mass.
therefore, CFC concentrations in the atmosphere are unique for specific years and are useful tracers for determining the ground-water age (Busenberg and Plummer, 1992; Plummer and others, 1993).
The ratio of 3H (tritium) in a sample to 3He (helium-3) a radiogenic daughter product of tritium decay also is used to determine the ground-water age. Large amounts of tritium from above-ground nuclear testing entered the atmosphere in the early 1950's and reached a maximum during 1963-64; this tritium history is reflected in ground water. The production of 3He from tritium decay, which has a half-life of 12.43 years, can be used to estimate the approximate amount of time elapsed since a parcel of ground water became isolated from the atmosphere. Tritium and helium isotopes are unaffected by chemical and biological processes (other than radioactive decay) and, therefore, can be used to determine the age of waters that entered the ground-water system after the early 1950's. The limitations of using 3H/3He analyses to determine ground-water age include hydrodynamic dispersion, which can cause waters to appear younger or older in age than they actually are; the eventual dissipation of -^H from the mid-1960's bomb peak because of radioactive decay; and gas exchange between the unsaturated zone and the water table (Plummer and others, 1993).
STUDY DESIGN
Ground-water samples were collected by the USGS from monitoring wells in September and December 1996. These wells were previously installed by the consultants ABB Environmental Services, Inc. (ABB), Advanced Sciences, Inc. (ASI), and Jacobs Engineering Group, Inc. (JEG) working for the MMR IRP. Location coordinates, land-surface and well- screen altitudes, and water levels for the monitoring wells are shown in table 1.
The sampling design was based on the comparison of samples collected in the FS-28 plume with samples collected from uncontaminated ground water and the FS-12 plume. The majority of the wells sampled were located in and near the FS-28 plume because the source of contamination was unknown and understanding the plume chemical composition was the focus of the study. Based on sampling in 1993 by ABB and 1996 by JEG, 10 wells were sampled by the USGS in and near the FS-28 plume (fig. 2); four wells (MW- 1266, MW-1274, MW-1277, and MW-1290A) were not contaminated with EDB, and six wells (MW-1254, MW-1262, MW-1272, MW-1275, MW-1284B, MW- 1295) were contaminated with EDB (ABB Environmental Services, Inc., 1995, 1996; Jacobs Engineering Group, Inc., 1997a, and written commun.,
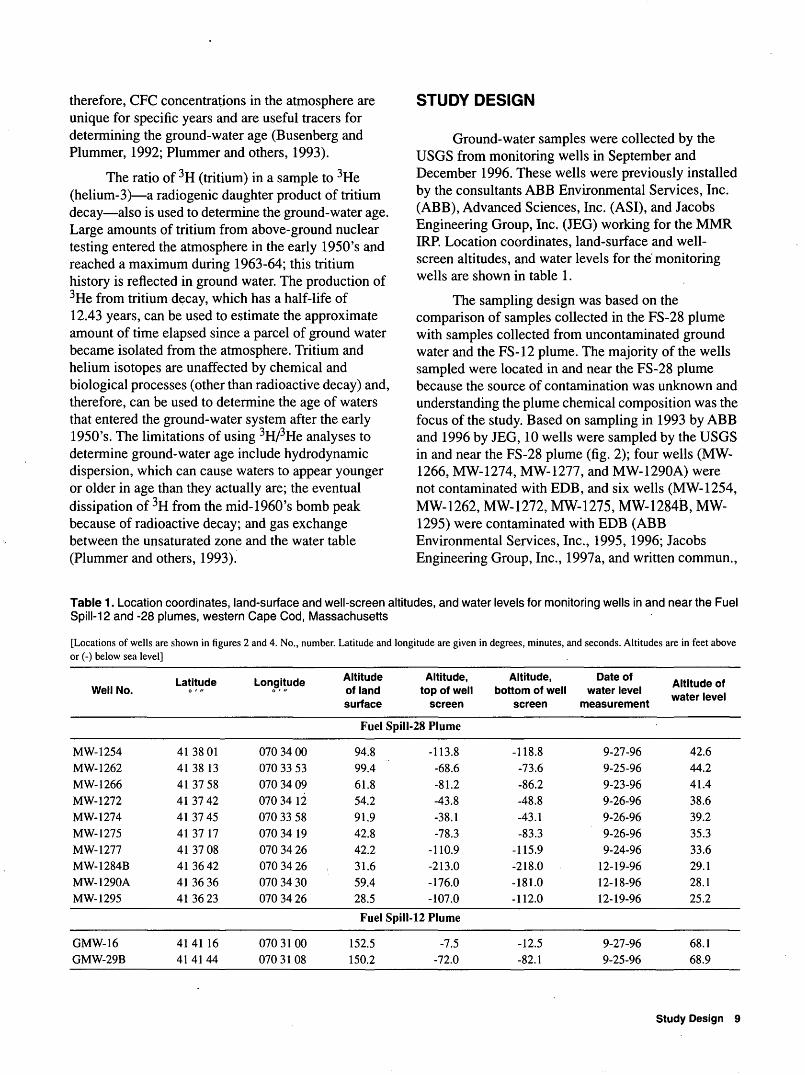
Table 1 . Location coordinates, land-surface and well-screen altitudes, and water levels for monitoring wells in and near the Fuel Spill-12 and -28 plumes, western Cape Cod, Massachusetts
[Locations of wells are shown in figures 2 and 4. No., number. Latitude and longitude are given in degrees, minutes, and seconds. Altitudes are in feet above or (-) below sea level]
Well No.Latitude Longitude Altitude
of land surface
Altitude, top of well
screen
Altitude, bottom of well
screen
Date of water level
measurement
Altitude of water level
Fuel Spill-28 Plume
MW-1254MW-1262MW-1266MW-1272MW-1274MW-1275MW-1277MW-1284BMW-1290AMW-1295
41380141 38 1341375841 37 4241 37 4541 37 1741370841364241 36 36413623
070 34 00070 33 53070 34 090703412070 33 58070 34 19070 34 26070 34 26070 34 30070 34 26
94.899.461.854.291.942.842.231.659.428.5
-113.8-68.6-81.2-43.8-38.1-78.3
-110.9-213.0-176.0-107.0
-118.8-73.6-86.2-48.8-43.1-83.3
-115.9-218.0-181.0-112.0
9-27-969-25-969-23-969-26-969-26-969-26-969-24-96
12-19-9612-18-9612-19-96
42.644.241.438.639.235.333.629.128.125.2
Fuel Spill-12 Plume
GMW-16GMW-29B
4141 1641 41 44
07031000703108
152.5150.2
-7.5-72.0
-12.5-82.1
9-27-969-25-96
68.168.9
Study Design 9
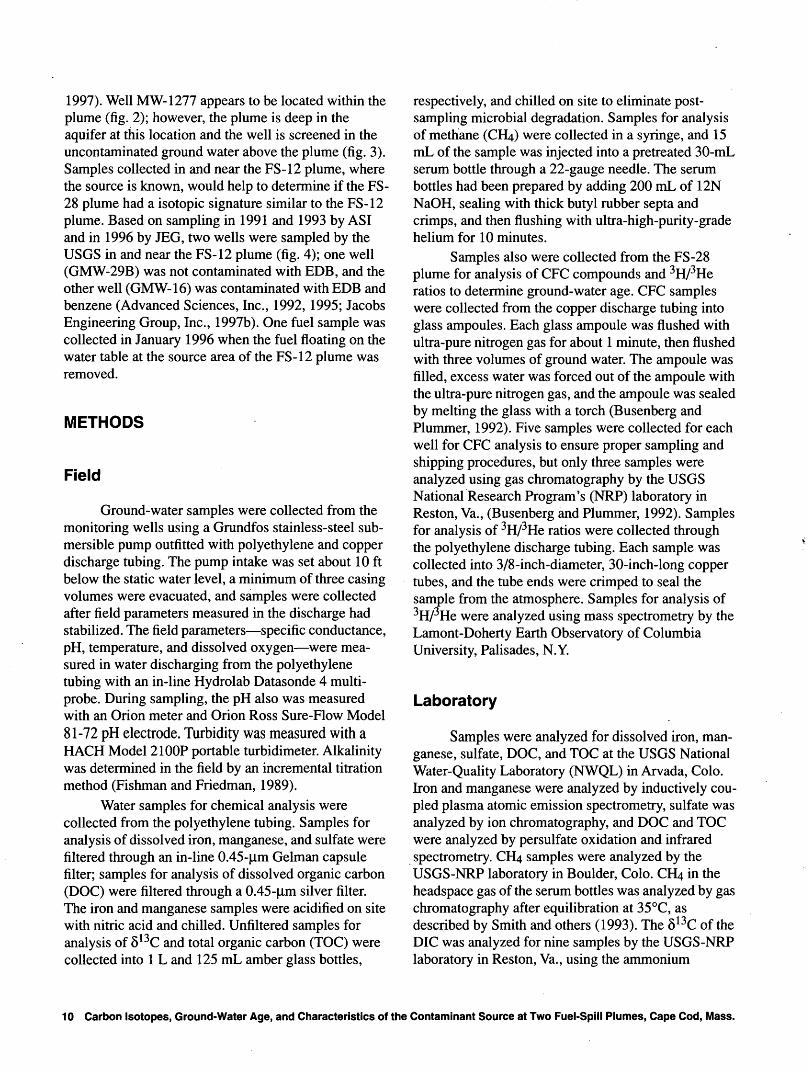
1997). Well MW-1277 appears to be located within the plume (fig. 2); however, the plume is deep in the aquifer at this location and the well is screened in the uncontaminated ground water above the plume (fig. 3). Samples collected in and near the FS-12 plume, where the source is known, would help to determine if the FS- 28 plume had a isotopic signature similar to the FS-12 plume. Based on sampling in 1991 and 1993 by ASI and in 1996 by JEG, two wells were sampled by the USGS in and near the FS-12 plume (fig. 4); one well (GMW-29B) was not contaminated with EDB, and the other well (GMW-16) was contaminated with EDB and benzene (Advanced Sciences, Inc., 1992, 1995; Jacobs Engineering Group, Inc., 1997b). One fuel sample was collected in January 1996 when the fuel floating on the water table at the source area of the FS-12 plume was removed.
METHODS
Field
Ground-water samples were collected from the monitoring wells using a Grundfos stainless-steel sub mersible pump outfitted with polyethylene and copper discharge tubing. The pump intake was set about 10 ft below the static water level, a minimum of three casing volumes were evacuated, and samples were collected after field parameters measured in the discharge had stabilized. The field parameters specific conductance, pH, temperature, and dissolved oxygen were mea sured in water discharging from the polyethylene tubing with an in-line Hydrolab Datasonde 4 multi- probe. During sampling, the pH also was measured with an Orion meter and Orion Ross Sure-Flow Model 81-72 pH electrode. Turbidity was measured with a HACK Model 21 OOP portable turbidimeter. Alkalinity was determined in the field by an incremental titration method (Fishman and Friedman, 1989).
Water samples for chemical analysis were collected from the polyethylene tubing. Samples for analysis of dissolved iron, manganese, and sulfate were filtered through an in-line 0.45-jam Gelman capsule filter; samples for analysis of dissolved organic carbon (DOC) were filtered through a 0.45-^tm silver filter. The iron and manganese samples were acidified on site with nitric acid and chilled. Unfiltered samples for analysis of 813C and total organic carbon (TOC) were collected into 1 L and 125 mL amber glass bottles,
respectively, and chilled on site to eliminate post- sampling microbial degradation. Samples for analysis of methane (CHU) were collected in a syringe, and 15 mL of the sample was injected into a pretreated 30-mL serum bottle through a 22-gauge needle. The serum bottles had been prepared by adding 200 mL of 12N NaOH, sealing with thick butyl rubber septa and crimps, and then flushing with ultra-high-purity-grade helium for 10 minutes.
Samples also were collected from the FS-28 plume for analysis of CFC compounds and 3H/3He ratios to determine ground-water age. CFC samples were collected from the copper discharge tubing into glass ampoules. Each glass ampoule was flushed with ultra-pure nitrogen gas for about 1 minute, then flushed with three volumes of ground water. The ampoule was filled, excess water was forced out of the ampoule with the ultra-pure nitrogen gas, and the ampoule was sealed by melting the glass with a torch (Busenberg and Plummer, 1992). Five samples were collected for each well for CFC analysis to ensure proper sampling and shipping procedures, but only three samples were analyzed using gas chromatography by the USGS National Research Program's (NRP) laboratory in Reston, Va., (Busenberg and Plummer, 1992). Samples for analysis of 3H/3He ratios were collected through the polyethylene discharge tubing. Each sample was collected into 3/8-inch-diameter, 30-inch-long copper tubes, and the tube ends were crimped to seal the sample from the atmosphere. Samples for analysis of 3H/3He were analyzed using mass spectrometry by the Lamont-Doherty Earth Observatory of Columbia University, Palisades, N.Y.
Laboratory
Samples were analyzed for dissolved iron, man ganese, sulfate, DOC, and TOC at the USGS National Water-Quality Laboratory (NWQL) in Arvada, Colo. Iron and manganese were analyzed by inductively cou pled plasma atomic emission spectrometry, sulfate was analyzed by ion chromatography, and DOC and TOC were analyzed by persulfate oxidation and infrared spectrometry. CH4 samples were analyzed by the USGS-NRP laboratory in Boulder, Colo. CH4 in the headspace gas of the serum bottles was analyzed by gas chromatography after equilibration at 35°C, as described by Smith and others (1993). The 5 13C of the DIC was analyzed for nine samples by the USGS-NRP laboratory in Reston, Va., using the ammonium
10 Carbon Isotopes, Ground-Water Age, and Characteristics of the Contaminant Source at Two Fuel-Spill Plumes, Cape Cod, Mass.

hydroxide strontium chloride precipitation method (Gleason and others, 1969). The 813C of the DIG for the fuel sample was analyzed by the USGS-NRP labo ratory in Reston, Va., using the combustion method (Revesz and others, 1995). The 813C of the DIG was analyzed for 11 samples at the University of Waterloo, Ontario, Canada, using the gas-evolution method (Heemskerk and Aravena, 1994). Results of replicate 513C analyses for eight wells (MW-1254, MW-1262, MW-1266, MW-1272, MW-1275, MW-1274, MW- 1277, and GMW-29B) performed by the two laborato ries differ by as much as 5.1 %o- 813C values obtained by the precipitation method generally were lighter than the values obtained by the gas-evolution method, although the values agreed more closely in samples with elevated alkalinity (for example, wells GMW-29B and MW-1266). The cause of the unexpected differ ence between the analyses by the two laboratories has not been determined; therefore, both values are reported here.
ANALYSIS OF STABLE CARBON ISOTOPES AND DETERMINATION OF GROUND-WATER AGE
Isotope and Water Chemistry
The water-chemistry data from the ground-water samples are organized and presented by the four types of water-chemistry conditions observed: (Type 1) oxic and no EDB detected; (Type 2) anoxic and no EDB detected; (Type 3) oxic and EDB detected; and (Type 4) anoxic and EDB detected. For the purposes of this report, "anoxic" denotes a dissolved oxygen concentration of less than or equal to 0.1 mg/L. EDB analyses from earlier sampling at the sites by ABB, ASI, and JEG were used to designate water-quality types. Field water-quality analyses of ground-water samples collected from monitoring wells in and near the Fuel Spill-12 and -28 plumes are shown in table 2.
Table 2. Field water-quality analyses for ground-water samples in and near the Fuel Spill-12 and -28 plumes, western Cape Cod, Massachusetts, September and December 1996
[Locations of wells are shown in figures 2 and 4. No., number; nS/cm, microsiemen per centimeter at 25 degrees Celsius; mg/L, milligram per liter; NTU, Nephelometric Turbidity Unit; EDB, 1,2-dibromoethane. CaCOs, calcium carbonate. °C, degrees Celsius]
Well No.Specific
Date conductance (uS/cm)
PH (standard
units)
Alkalinity (mg/L as CaCO3)
Oxygen, dissolved
(mg/L)
Temperature (°C)
Turbidity (NTU)
Fuel Spill-28 Plume
Type 1: Oxic and no EDB detected
MW-1274MW-1277
9-24-969-24-96
7778
5.96.3
1122
9.66.3
11.011.0
6.120
Type 2: Anoxic and no EDB detected
MW-1266MW-1290A
9-23-9612-19-96
218120
6.87.1
9136
.1
.011.012.0
1729
Type 3: Oxic and EDB detected
MW-1254MW-1262MW-1272MW-1275MW-1284BMW-1295
9-27-969-25-969-26-969-26-96
12-18-9612-19-96
779485777867
6.25.95.96.16.76.6
202220221816
4.47.76.86.31.55.0
11.011.011.010.511.511.0
197.25.01.9
1115
Fuel Spill-12 Plume
Type 1: Oxic and no EDB detectedGMW-29B 9-25-96
Type 4: Anoxic and EDB detectedGMW-16 9-27-96
89 9.2
6.0
26
26
4.4 11.5
10.5
15
.46
Analysis of Stable Carbon Isotopes and Determination of Ground-Water Age 11

The laboratory analyses for chemical composition and isotopic ratios of ground-water samples collected from monitoring wells in and near the Fuel Spill-12 and -28 plumes are shown in table 3. The 813C value of the fuel sample from the FS-12 source was -27.0 %o when analyzed by the combustion method (Revesz and others, 1995).
Type 1: Oxic and no EDB detected. Ground- water samples collected from wells MW-1274, MW-1277, and GMW-29B, which are located outside the FS-12 and FS-28 plumes, were oxic. Based on the results of the earlier sampling, ground-water samples from these wells did not contain EDB concentrations above the detection limit. The 613C values of the DIG ranged from -19.2 to -28.4 %o when analyzed by the precipitation method and -20.6 to -24.8 %o when analyzed by the gas-evolution method. Dissolved oxygen concentrations ranged from 4.4 to 9.6 mg/L and DIG concentrations ranged from 5.6 to 12.6 mg/L.
The average 513C for ground-water samples collected from shallow wells in a similar uncontaminated environment in the Ashumet Valley about 1 mi east of the FS-28 plume in 1988-89 was -22 %0 when analyzed by the precipitation method. The total inorganic carbon (TIC) concentrations of the Ashumet Valley samples averaged 9 mg/L. DIG concentrations were not determined in the 1988-89 Ashumet Valley sampling; however, TIC and DIG concentrations in the uncontaminated ground water of western Cape Cod are expected to be similar because of the naturally low inorganic carbon concentrations in the ground water in this area (R.W. Lee, U.S. Geological Survey, written commun., 1997).
Type 2: Anoxic and no EDB detected. Ground- water samples collected from wells MW-1266 and MW-1290A, which are located outside the FS-28 plume, were anoxic. Based on the results of the earlier sampling, ground-water samples from these wells did not contain EDB concentrations above the detection limit. The 513C value of DIG for well MW-1266 was-19.9 %o when analyzed by the precipitation method and -19.7 %o when analyzed by the gas-evolution method. The 813C value for well MW-1290A was-16.6 %o when analyzed by the gas-evolution method.
Ground-water samples collected from well MW-1290A were not analyzed by the precipitation method. Ground-water samples collected from both wells contained dissolved iron; CH4 and DIG concentrations were elevated in well MW-1266 compared to the uncontaminated ground water sampled in this study.
Type 3: Oxic and EDB detected. Ground-water samples collected from wells MW-1254, MW-1262, MW-1272, MW-1275, MW-1284B, and MW-1295, which are located within the FS-28 plume, were oxic. Based on the results of the earlier sampling, ground- water samples from these wells contained detectable concentrations of EDB. The 813C values of the DIG ranged from -26.5 to -29.3 %o when analyzed by the precipitation method and -20.5 to -25.3 %o when analyzed by the gas-evolution method. Ground- water samples collected from wells MW-1284B and MW-1295 were not analyzed by the precipitation method. Dissolved oxygen concentrations ranged from 1.5 to 7.7 mg/L, and DIG concentrations ranged from 6.6 to 23.9 mg/L. Previous investigations of the FS-28 plume also reported oxic ground water within the plume (ABB Environmental Services, Inc., 1996; Jacobs Engineering Group, Inc., 1997a). The DOC and TOC concentrations ranged from 0.1 to 1.9 mg/L and are similar to concentrations in uncontaminated ground water on Cape Cod. Therefore, the EDB contamination, which occurs at parts per billion levels, does not contribute appreciably to the total amount of organic carbon in the ground water in the FS-28 plume.
Type 4: Anoxic and EDB detected. Ground- water samples collected from well GMW-16, which is located within the FS-12 plume, were anoxic. Based on the results of the earlier sampling, ground- water samples from this well contained high concentrations of EDB and benzene. The 513C values of the DIG were -28.5 and -29.6 %o when analyzed by the precipitation method, the dissolved oxygen concentration was 0.1 mg/L, and the DIG concentration was 23.6 mg/L. Iron and manganese concentrations were slightly elevated, indicating slightly reducing conditions, but the CtLi concentration was low.
12 Carbon Isotopes, Ground-Water Age, and Characteristics of the Contaminant Source at Two Fuel-Spill Plumes, Cape Cod, Mass.

Table 3. Chemical composition and isotopic ratios for ground-water samples in and near Fuel Spill-12 and -28 plumes, western Cape Cod, Massachusetts, September and December 1996
[Location of wells are shown in figures 2 and 4. No., number; jig/L, microgram per liter; mg/L, milligram per liter; \iM, micromolar; -Dup, duplicate sample; --, no data available; EDB, 1,2-dibromoethane; 1,2-dibromoethane detection limits vary; Fe, iron; Mn, manganese; 864, sulfate; C, carbon; <, less than; ND, not detected]
Well No. Date
Iron, Manga'dis- "?.s®'
solved
££ S(Mg/tasMn)
Sulfate,dis
solved (mg/L
Carbon, _ . _ . Carbon, Carbon,Meth- *". ' organic, inorganic, ane . " total dissolved(uM) . (mg/L (mg/L (mg/L >\H. "^. p. as C) as C)
a )
13C/12C stable isotope ratio
Precipi tation
method(per mil)
Evolu tion
method(per mil)
1 2- t* Dibromo- ethane (M9/L)
Ben zene
(M9/L)
Fuel Spill-28 Plume
Type 1: Oxic and no EDB detectedMW-1274
MW-1277
9-24-96'5-22-96'2-08-96
9-24-96'5-21-96'2-22-96
<3.0 41 -
15 24....
8.4..~
2.9 -
0.4 0.20 .20 11.8_.-
.2 .10 .20 12.6....
-24.7 -
-28.4 -
-20.9 -
-24.8 ~
~
<.005<.005
_.<.005<.005
<.5
<2
<5
<2
Type 2: Anoxic and no EDB detectedMW-1266
MW-1290A
9-23-962 1 1-30-96
'5-29-96.'5-29-96
12-19-962 12-30-96
1,300 140 --
2,200 110
9.0 ~
10--
6.7 .40 .60 31.0 -
.3 .20 .50 10.4..
-19.9 ..-
..-
-19.7 ~
-16.6~
<.005<.005<.005
<.0039
<.5
<2
ND
Type 3: Oxic and EDB detectedMW-1254
MW-1262
MW-1272MW-1272-Dup
MW-1275
MW-1284B
MW-1295
9-27-96'6-02-96'6-24-93'5-27-93
9-25-96'6-03-96
'11-09-95
9-26-969-26-96
'5-22-96'1-26-96
9-26-96'5-21-96'1-12-96
12-18-962 1 1-21-96
12-19-962 12- 18-962 1 1-19-96
11 <1.0____..
4.0 4.0 -
3.0 44<3.0 44 ..
<3.0 210 -
760 150-
8.0 47 ..
4.3.._.~
6.0 ~
5.05.0 -
2.5 ~
7.9-
7.4
.4 .10 .20 13.1 ..
.2 .20 .20 23.9._..
.3 .10 .30 21.8
.2 .20 .20 21.8._-
.3 .10 .30 17.2 ..
<.2 .20 .20 6.8-
.4 .20 1.9 6.6..
-29.3.. ~
-26.5 -
-28.4-27.3 --
-26.7_.-
..-
_._..
-24.6 -
-24.6 ~
-23.3-23.3 -
-25.3..~
-20.5~
-21.3 ..
<0.02
.036
.048
.04.05
.09
.14
...05.072
...28
_.045.121
<0.5<1<1
..<.5
<2
<.5
<2
_<.5
<2
_ND
_ND<2
Analysis of Stable Carbon Isotopes and Determination of Ground-Water Age 13

Table 3. Chemical composition and isotopic ratios for ground-water samples in and near Fuel Spill-12 and -28 plumes, western Cape Cod, Massachusetts, September and December 1996 Continued
Well No. Date
Iron,dis
solved (M9/L asFe)
Manga-npep1 IC0C,
dis solved(H9/L
as Mn)
Sulfate,dis
solved (mg/L
as 804)
Carbon, organic, wietn- ..
* M ' (mg/L asC)
Carbon,organic,
total (mg/L asC)
Carbon,inorganic, dissolved
(mg/L asC)
13C/12C stable isotope ratio
Precipi tation
method (per mil)
Evolu tion
method (per mil)
1 2-'i^
Dibromo- ethane (M9/L)
Ben zene (P9/L)
Fuel Spill-12 Plume
Type 1: Oxic and no EDB detected
GMW-29B 9-25-962 1 1-22-96
33-29-93
55~-
<1.0._-
4.0 --
0.2 0.20._..
0.20 ~
5.6__-
-19.2_.-
-20.6 ~
<0.02<.02
ND<10
Type 4: Anoxic and EDB detected
GMW-16GMW-16-Dup
9-27-969-27-96
2 10-09-9633-22-9337-30-9134- 19-91
120 -
120
-
1.5 -
.2 7.5 ._ --
8.6 -
23.6
--
-29.6-28.5 --
~
41597588-
1,8001,600
_.
340
'Source of data: ABB Environmental Services, Inc. 2Source of data: Jacobs Engineering Group, Inc. 3Source of data: Advanced Sciences, Inc.
DOC and TOC concentrations were higher in samples from well GMW-16 than in samples from wells in the FS-28 plume, which is consistent with the much greater concentrations of EDB and benzene detected in this well during the earlier sampling. Ground water at this site is anoxic; however, other electron acceptors may be present, allowing for further oxidation of the organic carbon compounds to CO2 and, consequently, an isotopically lighter DIG.
The relation between the isotopic signature and DIG concentrations of all water-chemistry types is shown in figure 5. The isotopic signature generally becomes ^C-depleted (lighter) as the DIG concentra tions increase. The lighter signature as DIG concentra tions increase suggests that the DIG is derived from
degraded petroleum hydrocarbons. Ground-water samples collected from Ashumet Valley in 1988-89 (fig. 5) are representative of uncontaminated ground water in the Cape Cod aquifer. The 813C values for the Ashumet Valley samples generally have a 13C-enriched (heavier) signature that is similar to the 813C values of the uncontaminated water near the FS-28 and FS-12 plumes. Therefore, the data indicate that the 813C values of water from wells in the FS-28 and FS-12 plumes are lighter than the values in uncon taminated water in the aquifer. The data points associ ated with wells MW-1266 and MW-1290A are outliers in figure 5. The cause of the heavier isotopic signatures at these sites is unknown, but it could be related to the anoxic conditions observed at both sites.
14 Carbon Isotopes, Ground-Water Age, and Characteristics of the Contaminant Source at Two Fuel-Spill Plumes, Cape Cod, Mass.

-16
-18
-20
-22
-24
-26
-28
-30
MW-1290A
MW-1266
8
5 10 15 20 25 30
DISSOLVED INORGANIC CARBON, IN MILLIGRAMS PER LITER AS CARBON
35
EXPLANATION
GROUND-WATER SAMPLES FROM FUEL SPILL-12 AND -28SITES, SEPTEMBER AND DECEMBER 1996
A PRECIPITATION METHOD - NO 1,2-DIBROMOETHANE (EDB) DETECTED
D GAS-EVOLUTION METHOD - NO EDB DETECTED
* PRECIPITATION METHOD - EDB DETECTED
GAS-EVOLUTION METHOD - EDB DETECTED
GROUND-WATER SAMPLES FROM ASHUMET VALLEY, 1988-89
O PRECIPITATION METHOD - NO EDB DETECTED
Figure 5. Relation between isotopic signature and dissolved inorganic carbon for ground-water samples in and near the Fuel Spill-12 and -28 plumes and the Ashumet Valley, western Cape Cod, Massachusetts.
Determination of Ground-Water Age
The ground-water age represents the time at which recharge water arriving at the water table became isolated from the atmosphere. Age determina tions from CFC and 3H/3He concentrations in samples collected in the FS-28 plume range from the pre- 1940's to the mid-1970's (table 4). The CFC com
pound analyses are used to determine the ground- water age based on concentrations of the synthetic compounds <h'chlorodifluoromethane (CFC-12), trichlorofluoromethane (CFC-11), and trichlorotri- fluoroethane (CFC-113). Three CFC sample analyses were performed and used for each well to determine an estimated age. These ages reflect the different hori zontal and vertical positions of the sampling intervals within the ground-water-flow system. Ground-water ages generally are older when the sampling interval is deep in the aquifer and far below the water table than when the sampling interval is shallow and near the water table. Ground-water ages are older at these depths because the ground water has traveled longer distances from sources that are farther upgradient. Ground-water ages, using both CFC and 3H/3He anal yses, indicate that the leading edge of the FS-28 plume entered the aquifer in the mid-1950's.
Ground-water ages are estimates because of the assumptions involved in the age interpretation, as out lined by Busenberg and Plummer (1992) and Plummer and others (1993). CFC age determinations are sensi tive to processes such as contamination of the samples by present-day atmospheric CFCs, interference during the chemical analysis by other organic compounds in the sample, anaerobic microbial modifications of the CFC compounds in the aquifer, slow diffusion of CFC compounds through a thick unsaturated zone, and hydrodynamic dispersion. CFC dates are not reported for samples from wells MW-1262, MW-1274, MW-1275, and MW-1277 in. table 4 because the results are potentially biased by the pro cesses mentioned above. 3H/3He age determinations were not made for samples from wells MW-1284, MW-1290A, and MW-1295 because it was beyond the scope of the study.
Analysis of Stable Carbon Isotopes and Determination of Ground-Water Age 15

Table 4. Age determination for ground-water samples in and near the Fuel Spill-28 plume, western Cape Cod, Massachusetts, September and December 1996
[Location of wells are shown in figure 2. CFC, chlorofluorocarbon; 3H/3He, tritium/helium. Triplicate samples were analyzed for concentration of CFCs and are reported here. The three CFC analyses were used to assign a CFC recharge time. No., number; --, not sampled; x, sample contaminated and dates deter mined are not reliable; <, less than]
Well No.
MW-1254
MW-1262
MW-1266
MW-1272
MW-1274
MW-1275
MW-1277
MW-1284B
MW-1290A
MW-1295
Samplecollection date
9-27-96
9-25-96
9-23-96
9-26-96
9-24-96
9-26-96
9-24-96
12-18-96
12-19-96
12-19-96
CFC-11
1956.51956.51957.5
X
1957.01956.01957.5
1973.51973.51973.5
X
X
X
1952.51952.51952.5
<1945.0<1945.0<1945.0
1957.01957.01957.0
CFC-12
1961.51958.51958.5
X
1968.51968.01967.5
1976.01975.51974.5
X
X
X
1951.01950.51951.0
<1940.0<1940.0<1940.0
1955.51955.01955.0
Recharge date
CFC-11 3 Assigned CFC
1976.5 Late 1950's1975.01982.5
X X
1971.5 Late 1960's1970.51967.0
1981.5 Mid-1970's1975.51974.5
X X
X X
X X
1954.5 Early 1950's1954.51954.5
<1954.5 Pre-1940's< 1954.5 No CFCs present<1954.5
1954.5 Mid-1950's1954.51954.5
3H/3He
1958
1969
1968
1970
1976
1966
1966
-
ESTIMATED CHARACTERISTICS OF THE CONTAMINANT SOURCE
Isotopic Evidence of Petroleum Hydrocarbon Source
Concentrations of DIG typically are high in ground water that has been contaminated with petroleum hydrocarbons or that contains degradation products of petroleum hydrocarbons. This DIG has a distinct isotopic signature related to the contaminant source and prevailing oxidation-reduction (redox) conditions in the aquifer (Baedecker and others, 1989; Landmeyer and others, 1996). Aerobic microbial degradation of petroleum hydrocarbons produces 613C
values in DIG that are similar to the isotopic value of the degraded hydrocarbon. Petroleum hydrocarbons characteristically have 13C-depleted (light) isotopic signatures; thus, the isotopic signature of the DIG resulting from aerobic degradation of the hydrocarbons to CO2 also will have a light signature. As the geochemical environment becomes depleted of electron acceptors, microbial degradation produces 813C values in DIG that are 13C-enriched (heavier) compared to that of the hydrocarbon being degraded. Under anaerobic conditions, or conditions where electron acceptors are no longer present, the carbon in the fuel is metabolized to the intermediate compound acetate (CHaOOH) and then further metabolized to CO2 and CH4 . The CH4 is 13C-depleted and the CO2 is
16 Carbon Isotopes, Ground-Water Age, and Characteristics of the Contaminant Source at Two Fuel-Spill Plumes, Cape Cod, Mass.

13C-enriched because of the intramolecular isotope nonhomogeneity of the intermediate compound (acetate) (Revesz and others, 1995).
The carbon isotopic signature was light and concentrations of DIG increased in two EDB plumes the FS-28 plume that is contaminated with EDB and the FS-12 plume that is contaminated with EDB and benzene. The isotopic signature also was light in the fuel sample taken from the FS-12 source. The isotopic signature of the DIG in both plumes was lighter by as much as -10 %o (more negative) relative to the isotopic signature of the DIG in the uncontaminated ground water. The light isotopic signature in the FS-28 plume indicates that petroleum hydrocarbons might have been associated with the EDB and might have been degraded microbially under aerobic conditions to DIG. Ground-water samples from well GMW-16, which is in the center of the FS-12 plume, were nearly depleted of oxygen, yet a reducing environment was not evident. Even at the FS-12 plume, where fuels were once detected floating on the water table, the petroleum hydrocarbons seem to have degraded microbially under aerobic conditions and the DIG isotopic signature in the ground water also was similar to that of the source and other petroleum hydrocarbons.
The light isotopic signature also suggests that sewage or septic-tank effluents were not the source of the EDB contamination. Degradation of sewage- derived carbon compounds produces 8 13C values of the DIG that are heavier than in the uncontaminated ground water (Smith and others, 1991).
Estimate of Source Isotopic Signature
A simple mass-balance equation was used to estimate the 813C value of the contaminant source for comparison with the fuel sample analyzed in this study and reported values of 813C of petroleum hydrocarbons. The 813C value of the contaminant source was calculated based on 813C and DIG results from the samples of the uncontaminated ground water (the initial conditions) and contaminated ground water (the final conditions). The assumptions for this calculation are that (1) the contaminant thoroughly mixed with the uncontaminated ground water on entering the aquifer, (2) contaminated ground water was not dispersed or diluted further downgradient after the initial mixing, and (3) no biodegradation has occurred. The 8 13C values of the contaminant source were calculated by using the equation
8 13Cxi + xf
where the subscripts i and/refer to the initial and final conditions, respectively, and X refers to concentration of DIG.
The estimated 8 13C values of the contaminant sources were calculated using TIC and isotopic results from ground-water samples from the Ashumet Valley for the initial conditions because this water was considered representative of the native ground water. As described above, the TIC concentrations are expected to be similar to the DIG concentrations for these samples. The calculated 8 13C value for the contaminant source at the FS-12 plume was -27.5 %o- This value was calculated using isotopic results obtained by the precipitation method and DIG concentrations from the sample containing detectable EDB concentrations from well GMW-16 for the final conditions. The calculated 8 13C average value for the contaminant source at the FS-28 site was -26.1 %o- This value was calculated based on isotopic results obtained by the precipitation method and DIG concentrations from the samples containing detectable EDB concentrations from wells MW-1254, MW-1262, MW-1272, and MW-1275 for the final conditions. The calculated 813C values of -27.5 and -26.1 %o for the sources of the two plumes are similar to the 8 13C value of the FS-12 source hydrocarbon (-27.0 %o) ar>d characteristic 8 13C values of petroleum hydrocarbons described above (-26 to -30 %o)-
Possible Fuel Spill-28 Source Characteristics
The isotopic ratios indicate that ground water in the FS-28 plume has a signature similar to that of petroleum hydrocarbons. Petroleum hydrocarbons degrade rapidly under aerobic conditions similar to conditions in the FS-28 plume. Petroleum hydrocar bons also will degrade under anaerobic conditions if other electron acceptors (such as nitrate, sulfate, iron (III), manganese (IV), or carbon dioxide) are present (Chapelle, 1992). If petroleum hydrocarbons had degraded near the source in the saturated zone of the aquifer, a zone where the dissolved oxygen concentra tions are near zero in the plume would be expected, assuming sufficient amounts of fuel reached the water table. The oxic conditions in the plume indicate that
Estimated Characteristics of the Contaminant Source 17

dispersion and dilution could have mixed the oxygen- depleted zone with oxygenated ground water as the contaminated water moved downgradient. Another possibility is that fuel products degraded or are degrad ing microbially in the unsaturated zone, where there is an abundant supply of oxygen. For example, the source of the FS-28 plume may not have been one large fuel spill, but smaller, intermittent leaks and spills that did not reach the water table in large quantities. Thus, oxy genated recharge flowing through the contaminated unsaturated zone maintained the aerobic conditions. EDB, which has a low affinity for partitioning to sedi ments, could have been carried down with recharge water to the water table, whereas the fuel products were largely degraded in the unsaturated zone. The upgradient extent of the FS-28 plume is under investi gation by the MMRIRP, and additional data from this area (such as dissolved oxygen concentrations and other chemical analyses) are not yet available. There fore, only hypothetical scenarios of the source and movement of the contamination can be developed from the data at this time.
A regional ground-water-flow model of western Cape Cod, including the FS-28 area, was developed by the USGS (Masterson and others, 1997). Results of the ground-water-flow modeling indicate that the FS-28 plume probably originated on the MMR. A particle- tracking analysis was used to help determine if the FS- 28 plume could have originated on the MMR and if the observed path and shape of the plume are consistent with the three-dimensional-flow pattern simulated with the model. The observed plume path and shape were accurately simulated with the model. Potential source areas for the FS-28 plume were simulated with the application of reverse particle tracking, and include areas on the MMR that were once used for motor-pool activities.
CFC-determined ages indicate that ground water at the leading edge of the FS-28 plume recharged the aquifer in the early to mid-1950's. CFC and 3H/3He dates from ground water within the FS-28 plume indi cate that the source could have been contributing EDB to the ground-water system for more than two decades. For example, water from wells MW-1295 and MW-
1284, which are at the toe of the plume, date to the early to mid-1950's, and water from wells MW-1262 and MW-1272, which are farther upgradient, date to 1969 to the mid-1970's. The ages reflect the vertical positions of the individual well screens, which inter cept different flow paths. For example, the ages for ground-water samples from wells MW-1254 and MW- 1266 (fig. 2 and table 4) are older than for samples from downgradient wells because these wells are screened much deeper in the aquifer and intercept older water (fig. 3). These ages generally are consistent with the time period when EDB was used as an additive to fuels, and when large quantities of fuels are known to have been used at the MMR.
The ground- water ages also agree with estimated times of ground- water migration from potential source areas on the MMR to the sampling locations. Darcy's Law can be used to estimate the rate of contaminant migration from a potential source area to the toe of the plume. The average linear velocity of the contaminated water can be calculated by using the equation
where \) is the average linear velocity, K is the hydraulic conductivity, n is effective porosity, and / is the hydraulic gradient (A water-level / A distance). An average linear velocity of 1.4 ft/d can be calculated using this equation when K = 350 ft/d and n = 0.40 (LeBlanc and others, 1991), which are estimates for sand-and-gravel glacial outwash found in this area, and / = 35 ft / 22,000 ft. The hydraulic gradient was estimated based on water-level altitudes measured in March 1993 (Savoie, 1995), and the distance was estimated from the toe of the plume to a potential source area on the MMR calculated with reverse- particle tracking. Based on this equation, contaminated ground water would take 43 years to travel 22,000 ft (the distance from the potential source area to the toe of the plume) at an average linear velocity of 1.4 ft/d. This estimated traveltime generally agrees with the analysis of ground- water ages and results of the model simulations.
18 Carbon Isotopes, Ground-Water Age, and Characteristics of the Contaminant Source at Two Fuel-Spill Plumes, Cape Cod, Mass.

SUMMARY AND CONCLUSIONS
The U.S. Geological Survey collected ground- water samples to analyze carbon isotopes and to deter mine ground-water age using 10 wells in and near the FS-28 plume and to analyze carbon isotopes using 2 wells in and near the FS-12 plume near the Massachu setts Military Reservation, western Cape Cod, Massa chusetts. The FS-12 plume is composed primarily of benzene and 1,2-dibromoethane (EDB). The source of the plume was a break in an underground pipeline that leaked several thousand gallons of aviation fuel into the underlying aquifer. The FS-28 plume, whose specific source is unknown, is generally composed of EDB with only sporadic detections of fuel-related com pounds and chlorinated solvents. This study was designed to determine if stable carbon isotopes and CFC and 3H/3He ground-water ages could be used to provide information about the origin of the FS-28 plume. The chemical data, field and laboratory meth ods, and estimated characteristics of the contaminant source are presented in this report.
The carbon isotopic data indicate that the DIG in ground water containing EDB in the FS-12 and FS-28 plumes has a light isotopic signature that is similar to the isotopic value of the FS-12 source hydrocarbon and reported values for other petroleum hydrocarbons. The light isotopic signatures, increased DIG concentrations, and oxic conditions in the FS-28 plume are consistent with the hypothesis that fuels could have degraded microbially in an environment with an abundant supply of oxygen or other electron acceptors. The similarity among isotopic data collected in the FS-12 and FS-28 plumes further indicates that the EDB in the FS-28 plume was once associated with other petroleum hydrocarbons, such as fuel products. Ground-water ages in the FS-28 plume indicate that fuel contaminated with EDB could have entered the aquifer in the early- 1950's and could have continued to be a source for more than two decades.
The characteristics of the contaminant source of the FS-28 plume were estimated as part of this study. A simple mass-balance calculation indicates a 513C value for the FS-28 contaminant source similar to the 8 13C value of the fuel sample from the FS-12 source hydrocarbon and reported values for other petroleum hydrocarbons. Reverse-particle-tracking model simulations indicate that the source area of the FS-28 plume is on the MMR, and potential source areas include former motor-pool locations. The traveltime for contaminant migration from potential source areas on the MMR to the sampling locations at the toe of the FS-28 plume, as calculated from Darcy's Law, also agrees with the ground-water ages determined by the analysis of CFCs and 3H/3He.
Further investigation is needed to locate the source of the FS-28 plume and to confirm that the EDB is a remnant of aerobically degraded fuels. Detailed chemical profiles should be obtained at more locations in the FS-28 plume, and in other plumes where only EDB contamination is detected. The additional chemical and isotopic data and analysis of biodegradation processes using models could provide further insight into the nature of the FS-28 plume and the fate of petroleum hydrocarbons in the Cape Cod aquifer. Biodegradation of petroleum hydrocarbons is potentially an important natural remediation process in the aquifer. The processes involved in natural restoration need to be explained and methods need to be developed and tested to identify aquifer sites where natural restoration has been effective. Carbon isotopic analysis may be a valuable tool to find the inorganic carbon "shadow" of a fuel plume when petroleum hydrocarbons are suspected to have been degraded microbially to undetectable concentrations. This tool can help demonstrate that fuel contamination of the aquifer occurred and that the petroleum hydrocarbons have been naturally degraded to other compounds, such as carbon dioxide.
Estimated Characteristics of the Contaminant Source 19

REFERENCES CITED
ABB Environmental Services, Inc., 1995, Technical memorandum, monitoring well MW-1206Z, groundwater EDB investigation: Oak Ridge, Tenn., Hazardous Waste Remedial Actions Program, September 1995, various pagination.
___1996, Technical memorandum, ethylene dibromide phase II groundwater investigation: Oak Ridge, Term., Hazardous Waste Remedial Actions Program, December 1996, various pagination.
Advanced Sciences, Inc., 1992, Expanded site investigation report, Sandwich groundwater monitoring study: Oak Ridge, Term., Hazardous Waste Remedial Actions Program, January 1992, various pagination.
___1995, Remedial investigation report, FS-12 study area: Oak Ridge, Term., Hazardous Waste Remedial Actions Program, January 1995, various pagination.
Aggarwal, P.K., and Hinchee, R.E., 1991, Monitoring in situ biodegradation of hydrocarbons by using stable carbon isotopes: Environmental Science and Technology, v. 25, no. 6, p. 1178-1180.
Baedecker, M.J., Siegel, D.I., Bennett, Phillip, andCozzarelli, I.M., 1989, The fate and effects of crude oil in a shallow aquifer, I. The distribution of chemical species and geochemical facies, in Mallard, G.E., and Ragone, S.E., eds., U.S. Geological Survey Toxic Substances Hydrology Program Proceedings of the technical meeting, Phoenix, Ariz., September 26-30, 1988: U.S. Geological Survey Water-Resources Investigations Report 88-4220, p. 13-20.
Busenberg, Eurybiades, and Plummer, L.N., 1992, Use of chlorofluorocarbons (CClsF and CC12F2) as hydrologic tracers and age-dating tools: The alluvium and terrace . system of central Oklahoma: Water Resources Research, v. 28, no. 9, p. 2257-2283.
Chapelle, F.H., 1992, Ground-water microbiology and geochemistry: New York, John Wiley and Sons, Inc., 424 p.
Coleman, D.C., and Fry, Brian, 1991, Carbon isotope techniques: San Diego, Calif., Academic Press, Inc., 175 p.
Faure, Gunter, 1977, Principles of isotope geology: New York, John Wiley, 464 p.
Fishman, M.J., and Freidman, L.C., eds., 1989, Methods for determination of inorganic substances in water and fluvial sediments: U.S. Geological Survey Techniques of Water-Resources Investigations, book 5, chap. Al, 545 p.
Gleason, J.K., Friedman, I., and Hanshaw, B.B., 1969,Extraction of dissolved carbonate species from natural water for carbon-isotope analysis: U.S. Geological Survey Professional Paper 650-D, p. 248-250.
Heemskerk, A.R., and Aravena, R.O., 1994, Dissolved Inorganic Carbon (DIG), Environmental Isotope Laboratory, Department of Earth Sciences, University of Waterloo, Technical Procedure 5.0.
Jacobs Engineering Group, Inc., 1997'a, Fuel spill (FS-28) plume technical decision memorandum, (Draft): Jacobs Engineering Group, Inc., February 1997, various pagination.
__1997b, Inorganics investigation technical memorandum, (Draft): Jacobs Engineering Group, Inc., January 1997, various pagination.
20 Carbon Isotopes, Ground-Water Age, and Characteristics of the Contaminant Source at Two Fuel-Spill Plumes, Cape Cod, Mass.
__1997c, Massachusetts Military Reservation (MMR) Plume Areas: Jacobs Engineering Group, Inc., April 1997,1 sheet.
Katz, B.G., 1993, Biogeochemical and hydrological processes controlling the transport and fate of 1,2- dibromoethane (EDB) in soil and ground water, Central Florida: U.S. Geological Survey Water-Supply Paper 2402, 35 p.
Landmeyer, J.E., Vroblesky, D.A., and Chapelle, F.H., 1996, Stable carbon isotope evidence of biodegradation zonation in a shallow jet-fuel contaminated aquifer: Environmental Science and Technology, v. 30, no. 4, p. 1112-1128.
LeBlanc, D.R., Garabedian, S.P., Hess, K.M., Gelhar, L.W., Quadri, R.D., Stollenwerk, K.G., and Wood, W.W, 1991, Large-scale natural-gradient tracer test in sand and gravel, Cape Cod, Massachusetts 1. Experimental design and observed tracer movement: Water Resources Research, v. 27, no. 5, p. 895-910.
Massachusetts Department of Environmental Protection, 1997, Massachusetts drinking water standards and guidelines for chemicals in Massachusetts drinking waters, May 1997: Commonwealth of Massachusetts, Executive Office of Environmental Affairs, Department of Environmental Protection, chap. 22, sec. 7A.
Masterson, J.P., Walter, D.A., and Savoie, Jennifer, 1997, Use of particle tracking to improve numerical model calibration and to analyze ground-water flow and contaminant migration, Massachusetts Military Reservation, Western Cape Cod, Massachusetts: U.S. Geological Survey Water-Supply Paper 2482, 50 p.
Plummer, L.N., Michel, R.L., Thurman, E.M., and Glynn, P.D., 1993, Environmental tracers for age dating young ground water, in Alley, W.M., ed., Regional ground- water quality: New York, Van Nostrand Reinhold, chap. 11, p. 225-293.
Revesz, K.M., Coplen, T.B., Baedecker, M.J., Glynn, P.D., and Hull, M., 1995, Methane production and consumption monitored by stable H and C isotope ratios at a crude oil spill site, Bemidji, Minnesota: Applied Geochemistry, v. 10, p. 505-516.
Savoie, Jennifer, 1995, Altitude and configuration of the water table, western Cape Cod, Massachusetts, March 1993: U.S. Geological Survey Open-File Report 94- 462,1 sheet.
Smith, R.L., Howes, B.L., and Duff, J.H., 1991,Denitrification of nitrate-contaminated groundwater Occurrence in steep vertical geochemical gradients: Geochimica et Cosmochimica Acta, v. 55, no. 7, p. 1815-1825.
Smith, R.L., Miller, L.G., and Howes, B.L., 1993, The geochemistry of methane in Lake Fryxell, an amictic, permanently ice-covered, Antarctic Lake: Biogeochemistry, v. 21, p. 95-115.
U.S. Environmental Protection Agency, 1983, Ethylene dibromide, decision and emergency order suspending registrations of pesticide products containing ethylene dibromide for use as a soil fumigant: Federal Register, v. 48, no. 197, p. 46228-46248.
Weaver, M.F., Cohen, S.Z., and Pignatello, J.J., 1988, Environmental chemistry of ethylene dibromide, in Agricultural impacts on ground water: Dublin, Ohio, National Water Well Association, p. 169-190.
Estimated Characteristics of the Contaminant Source 21

District Chief,Massachusetts Rhode Island DistrictU.S. Geological SurveyWater Resources Division10 Bearfoot RoadNorthborough, MA 01532