Embed Size (px)
Citation preview
APPLIED AND ENVIRONMENTAL MICROBIOLOGY, May 2008, p. 2717–2727 Vol. 74, No. 90099-2240/08/$08.00�0 doi:10.1128/AEM.02195-07Copyright © 2008, American Society for Microbiology. All Rights Reserved.
Analysis of Bacterial Communities in Soil by Use of DenaturingGradient Gel Electrophoresis and Clone Libraries, as
Influenced by Different Reverse Primers�
Jolanda K. Brons and Jan Dirk van Elsas*Department of Microbial Ecology, Centre of Ecological and Evolutionary Studies, University of Groningen,
Kerklaan 30, 9751 NN Haren, The Netherlands
Received 26 September 2007/Accepted 20 February 2008
To assess soil bacterial diversity, PCR systems consisting of several slightly different reverse primerstogether with forward primer F968-GC were used along with subsequent denaturing gradient gel electro-phoresis (DGGE) or clone library analyses. In this study, a set of 13 previously used and novel reverseprimers was tested with the canonical forward primer as to the DGGE fingerprints obtained fromgrassland soil. Analysis of these DGGE profiles by GelCompar showed that they all fell into two mainclusters separated by a G/A alteration at position 14 in the reverse primer used. To assess differencesbetween the dominant bacteria amplified, we then produced four (100-membered) 16S rRNA gene clonelibraries by using reverse primers with either an A or a G at position 14, designated R1401-1a, R1401-1b,R1401-2a, and R1401-2b. Subsequent sequence analysis revealed that, on the basis of the about 410-bpsequence information, all four primers amplified similar, as well as different (including novel), bacterialgroups from soil. Most of the clones fell into two main phyla, Firmicutes and Proteobacteria. WithinFirmicutes, the majority of the clones belonged to the genus Bacillus. Within Proteobacteria, the majorityof the clones fell into the alpha or gamma subgroup whereas a few were delta and beta proteobacteria. Theother phyla found were Actinobacteria, Acidobacteria, Verrucomicrobia, Chloroflexi, Gemmatimonadetes,Chlorobi, Bacteroidetes, Chlamydiae, candidate division TM7, Ferribacter, Cyanobacteria, and Deinococcus.Statistical analysis of the data revealed that reverse primers R1401-1b and R1401-1a both producedlibraries with the highest diversities yet amplified different types. Their concomitant use is recommended.
Denaturing gradient gel electrophoresis (DGGE) is apowerful molecular technique in which DNA fragments ofthe same length but with different sequences can be sepa-rated (7, 8, 23, 24, 32). When applied to 16S rRNA genes,the method allows the dissection of microbial communitiesat the level of the phylogeny of their constituents. PCRapplied to regions of this gene with conserved primers al-lows the generation of a mixture of amplicons which can beseparated by DGGE. The technique was initially introducedinto microbial ecology by Muyzer et al. in 1993 and has beenwidely used since its inception (21). Whereas Muyzer andcoworkers originally proposed a system based on the V3region of the 16S rRNA gene, Heuer et al. (12) and Smallaet al. (34) described a PCR-DGGE system based on the V6region of this gene. This region has the highest variabilitywithin the whole rRNA gene, thus theoretically allowing forthe most nearly optimal dissection of bacterial communities.Since its concoction, several different reverse primers forregion V6-based DGGE have been described in the litera-ture, some of which show sequence differences (6, 15, 16, 25,26). Moreover, some of the reverse primers carrying thesame name had different nucleotide compositions whereas,on the other hand, primers were found to have the same
nucleotide order but to have different names. Hence, it islegitimate to question the comparability of the soil bacterialDGGE patterns generated by these different reverse prim-ers and, in addition, to interrogate which reverse primer canbe best used for DGGE to characterize soil bacterial com-munities to their fullest breadth. To elucidate these ques-tions, we analyzed, for a selected loamy sand soil, howprimer sets composed of the existing reverse primers, as wellas several novel different reverse primers, affect our pictureof soil bacterial community structure by two methods, (i)PCR-DGGE fingerprinting followed by cluster analysis and(ii) analysis of the partial rRNA gene sequences of clonesgenerated with different reverse primers. A species-richgrassland soil was used for this purpose, as previous re-search (9) has shown that this soil contains an elevatedmicrobial diversity. It was thus of interest to optimize themolecular tools for the analysis of the bacterial diversity andcommunity structure in this soil.
MATERIALS AND METHODS
Soil and soil sampling. The soil samples used in this experiment were collectedfrom a long-term ecological site at the Wildekamp field, located in Bennekom,The Netherlands. The soil in this field is a loamy sand rich in organic matter(2.5%) with a slightly acidic pH (5.5 to 6.5). The site sampled represented along-term (�54 years) permanent grassland field. Samples were taken fromreplicate plots of the rhizosphere compartments (designated RG) and the grass-land bulk soil (G). Specifically, 100 samples per plot (10 cm deep) were mixed toyield one composite sample per plot (10, 35, 37).
DNA extraction from soil. DNA was extracted from soil with the UltraCleanSoil DNA kit (Mo Bio Laboratories Inc.). DNA isolation was performed accord-ing to the manufacturer’s instructions, modified as follows. Extra glass beads
* Corresponding author. Mailing address: Department of MicrobialEcology, Centre of Ecological and Evolutionary Studies, University ofGroningen, Kerklaan 30, 9751 NN Haren, The Netherlands. Phone:31.50.3632151. Fax: 31.50.3632154. E-mail: [email protected].
� Published ahead of print on 29 February 2008.
2717
(0.15 to 0.30 g; bead size, 0.1 mm) were added to the soil samples, and the cellswere disrupted by bead beating (mini-bead beater; Bio Spec Products) two timesfor 30 s. Final purification of the extracted DNA was performed with the WizardDNA cleanup system (Promega).
Primers. Primers for PCR amplification were designed to be specific forbacterial 16S rRNA gene targets. A 17-mer forward primer, designated F-968(5�-AA CGC GAA GAA CCT TAC-3�), to which a 40-mer GC clamp (5�-CGCCCG GGG CGC GCC CCG GGC GGG GCG GGG GCA CGG GGG G) wasattached at the 5� end was combined with 13 different reverse primers situatedroughly around position 1400 (Table 1) to amplify the bacterial 16S rRNA genefragments (22).
Theoretical primer match. Ribosomal Database Collection II Release 9.50(option Probe Match; http://rdp.cme.msu.edu/probematch/search.jsp) was usedto collect the 16S rRNA gene sequences that matched the selected reverseprimers. In particular, differences in the theoretical primer match were checkedto allow selection of the best theoretical reverse primer for the amplificationsystem (4).
PCR amplification. PCR mixtures were composed as follows. Seven microli-ters of 10� Stoffel PCR buffer (Applera, Nieuwerkerk a/d IJssel, The Nether-lands), 100 nmol MgCl2 (Applera), 0.5 �l formamide, 0.5 �g T4 gene 32 protein(Roche, Almere, The Netherlands), 10 nmol of each deoxyribonucleosidetriphosphate, 10 pmol of each primer, and 3 U of 10 U/�l AmpliTaq DNApolymerase, Stoffel fragment (Applera), were combined with H2O (Applera) to50 �l in a 0.2-ml Microfuge tube. After the addition of 5 ng of template DNA,the mixtures were incubated in a Gene Amp PCR system 9700 (Applera) pro-grammed as follows: initial denaturation of double-stranded DNA for 5 min at94°C; 10 (touchdown) cycles consisting of 1 min at 94°C, 1 min at 60°C, and 2 minat 72°C with a decrease in the annealing temperature of 0.5°C per cycle; 25 cyclesconsisting of 1 min at 94°C, 1 min at 55°C, and 2 min at 72°C; and extension for30 min at 72°C. All amplification products were purified with the Wizard PCRDNA purification system (Promega, Madison, WI) and analyzed by electro-phoresis in 1.0% (wt/vol) agarose gels, followed by ethidium bromide staining(1.2 mg/liter ethidium bromide in 1� Tris-acetate-EDTA) (19, 28).
DGGE. Denaturing gradient gel electrophoresis (DGGE) was performed withthe Ingeny Phor-U system (Ingeny International, Goes, The Netherlands). ThePCR products were loaded onto a polyacrylamide gel (6% [wt/vol] acrylamide in0.5� TAE buffer [2.42 g Tris base, 0.82 g sodium acetate, 0.185 g EDTA, 1 literof H2O; pH adjusted to 7.8 with acetic acid]) with a 40 to 70% denaturantgradient (100% denaturant was 3.5 M urea and 32% [vol/vol] deionized form-amide). The wells were loaded with roughly equal amounts of DNA (about 500ng), and electrophoresis was carried out in 0.5� TAE buffer at 100 V for 16 h at60°C. The gels were stained for 90 min in 0.5� TAE buffer with SYBR gold (finalconcentration, 0.5 �g/liter; Invitrogen, Breda, The Netherlands). Images of thegels were obtained by Imagemaster VDS (Amersham Biosciences, Buckingham-shire, United Kingdom) and stored as TIFF files. The DGGE patterns werecompared by clustering the different lanes by Pearson’s product-moment corre-
lation coefficient with GelCompar II software (Applied Maths, Sint-Martens-Latem, Belgium) by the unweighted-pair group method with arithmetic mean,rolling-disk background subtraction, and no optimization (17, 27).
Preparation of clone libraries and sequencing. Cleaned PCR products derivedfrom the four reverse primers in conjunction with the forward primer with a GCclamp, F968-GC, were ligated into the pGEM-T easy vector (Promega, Madison,WI) and introduced into competent Escherichia coli MM294 cells (Sylphium LifeSciences, Groningen, The Netherlands) by transformation as described by thepGEM-T manufacturer’s protocol. Blue-white screening was used, and whitecolonies were randomly picked. Colony PCR was then performed with pGEM-Tprimers T7F (5�-TAATACGACTCACTATAGGG-3�) and SP6R (5�-GATTTAGGTGACACTATAG-3�). Clones that had yielded PCR products of the correctsizes, as determined by gel electrophoresis, were selected, and inserts weresequenced with standard primer T7F. Sequencing was performed on an ABI 377machine (Applied Biosystems) (28).
Sequence analysis, construction of trees, and statistical analyses. Analysis ofthe sequences was done with Chromas (Technelysium, Tewantin, Australia).Chimera check with Bellerophon was used to check for chimeric sequences(http://greengenes.lbl.gov/cgi-bin/nph-bel3_interface.cgi) (13). Bellerophon is aprogram for detecting chimeric sequences in a multiple-sequence data set bycomparative analysis. It was specifically developed to detect 16S rRNA genechimeras in PCR clone libraries but can be applied to other gene data sets.Chimeric sequences were not detected (13). The partial 16S rRNA gene se-quences were compared with sequences in GenBank with nucleotide-nucleotideBLAST (BLAST-N) to obtain the nearest phylogenetic neighbors (www.ncbi.nlm.nih.gov/BLAST/). Sequences showing more than 97% similarity were consideredto belong to the same operational taxonomic unit (OTU) (1). Trees were con-structed from libraries obtained with each reverse primer by neighbor joiningwithin the program MEGA 3.1 (The Biodesign Institute) and bootstrapped with500 repetitions. These trees were used to obtain broader groupings—supported bychecks with the Ribosomal Database Project (RDP) database—which served toprepare histograms revealing the compositions of the bacterial communities de-tected by each of the four reverse primers combined with the forward primer (18).
The program DOTUR (distance-based OTU and richness determination) wasused to create rarefaction curves and to determine the Shannon diversity index,as well as the bias-corrected Chao1 estimator of richness (http://www.plantpath.wisc.edu/fac/joh/dotur.html) (14, 29). The Shannon index (H�) was used todetermine the diversity of bacteria present in the clone libraries created with thefour reverse primers by the following equation:
H� � ��i � 1
s
pi ln pi
where s is the number of species (species richness) and pi is the proportion of thespecies i in sample i. The index measures diversity by incorporating both the
TABLE 1. Reverse primers used in PCR experiments in this study
Originalprimera name Primer code 5�–3� primer sequence (16S rRNA gene target)b Proposed new name
% Match withinRDP database
relative to a100% matchc
Reference(s)
R1378/R1401 1a CGG TGT GTA CAA GGC CCG GGA ACG (1378-1401) R1401-1a 23 12, 34—d 1b CGG TGT GTA CAA GAC CCG GGA ACG (1378-1401) R1401-1b 7 This study— 1c CGG TGT GTA CAA GRC CCG GGA ACG (1378-1401) 30 This study— 2a CGG TGT GTA CAA GGC CC (1378-1394) R1401-2a 24 This studyR1401/L1401 2b CGG TGT GTA CAA GAC CC (1378-1394) R1401-2b 7 6, 25— 2c CGG TGT GTA CAA GRC CC (1378-1394) 31 This study— 3a GTA CAA GGC CCG GGA ACG (1384-1401) 24 This study— 3b GTA CAA GAC CCG GGA ACG (1384-1401) 8 This study— 3c GTA CAA GRC CCG GGA ACG (1384-1401) 32 This study— 2*a GCG TGT GTA CAA GGC CC (1378-1394) �1e This studyR1401/L1401 2*b GCG TGT GTA CAA GAC CC (1378-1394) �1e 16, 26— 2*c GCG TGT GTA CAA GRC CC (1378-1394) �1e This study— 1378* GCG TGT GTA CAA GGC CCG GGA ACG (1378-1401) �1e This study
a Reverse primers.b Positions according to E. coli 16S rRNA gene sequence. Boldface type indicates nucleotides that differentiate primers.c Related to homologous 16S rRNA gene sequences in the Ribosomal Database Project II database.d —, own primers identified by primer code.e The match is �1% because of a GC mismatch at the 5� end.
2718 BRONS AND VAN ELSAS APPL. ENVIRON. MICROBIOL.
richness and the distribution (evenness) of types (31). Chao1 is the speciesrichness estimator and assesses the number of species present (3).
To compare the clone libraries for similarities, we used LIBSHUFF (30, 33).Differences between clone libraries were thus determined by calculating homol-ogous and heterologous coverage curves and assessing the difference between thetwo curves, with the Cramer-von Mises statistic according to the method de-scribed by Singleton et al. (30, 33). For each comparison, if the lowest of the twoP values calculated by LIBSHUFF is lower than or equal to the so-called criticalP value (value for four libraries, 0.0043; relaxed, 0.0075) given by the program,a significant difference in the composition of the communities sampled in eachlibrary is indicated. The analyses were performed with the web-based LIBSHUFFprogram (version 0.96; J. R. Henriksen; http://libshuff.mib.uga.edu).
Nucleotide sequence accession numbers. The nucleotide sequences obtainedin this study have been submitted to the GenBank database and assigned acces-sion numbers EU407826 to EU408221.
RESULTS
Theoretical primer match. Table 1 shows the 13 differentreverse primers that were designed between positions 1378 and1401 of the rRNA gene (E. coli numbering) and their charac-teristics. All primers were checked versus the sequences withinthe RDP database to indicate the theoretical coverage of bac-terial sequences within the database. These data were thenconverted to percentages of matching with the total 16S rRNAdatabase (data not shown). When no mismatches were al-lowed, none of the primers gave matches to 100% of thedatabase entries (Table 1), whereas at one or two mismatches,the theoretical match increased drastically to (close to) 100%.Of the four primers that were selected to create clone libraries(R1401-1a, -2a, -1b, and -2b), primer R1401-2a was found tomatch the largest fraction of the bacterial 16S rRNA genesequences in the database (24%), followed by primersR1401-1a (23%), R1401-2b (7%), and R1401-1b (7%). Hence,the G at position 14 of the reverse primer (counted from the 5�end), which corresponds to position 1391 of the small-subunitRNA gene (E. coli numbering system), apparently yielded ahigher degree of matching with bacterial database sequencesthan the alternative base, an A, at this site (Table 1). TheGC/CG shift (at position 1-2) had a dramatic influence on thepercent matching of all primers with bacterial sequences (de-creasing), whereas the GGGAACG extension at the 3� endseemed to have little influence on the matching within thedomain Bacteria.
DGGE fingerprints. High-molecular-weight DNA was re-covered from all replicates of the two grassland soil samples,RG and G. The mean molecular size was 25 kb, and an averageof about 15 to 20 �g DNA was obtained per g of soil, asindicated by electrophoresis on agarose gels and comparison toa marker. After Wizard DNA purification, the soil DNA prep-arations were colorless and sufficiently pure for PCR amplifi-cation, as evidenced by ready amplification with the canonical16S rRNA gene-based PCR system. The electrophoresis of thePCR products obtained with the 13 different reverse primersunder nondenaturating conditions in all cases revealed theexpected bands of approximately 450 bp (data not shown).
To validate the differences caused by using the differentreverse primers, a within-experiment check was needed to as-sess the method’s reproducibility. Therefore, the reproducibil-ity of the DGGE method was tested prior to the actual assess-ment of the profiles generated with the 13 different reverseprimers. This was done by performing PCR on the basis of the
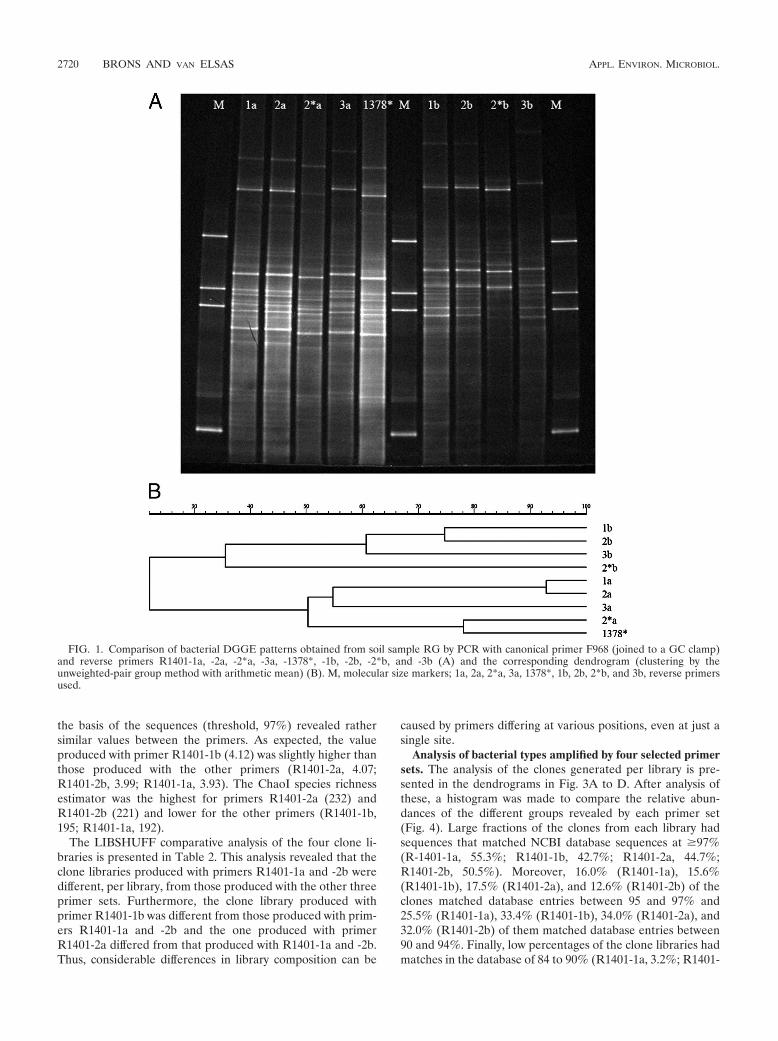
13 reverse primers in triplicate assays, running DGGE, andanalyzing the resulting patterns by GelCompar. Analysis of theDGGE patterns thus obtained yielded a clear clustering amongreverse primer types, as the within-treatment replicates clus-tered tightly together and were actually indistinguishable (datanot shown). Hence, the reproducibility of the PCR-DGGEtechnique was very high and there were clear effects of the typeof reverse primer used. We then compared the DGGE profilesgenerated with the 13 primer sets (one replicate each) in asingle gel to circumvent the problem of gel-to-gel variation.The clustering of the patterns on this gel revealed the appear-ance of two broad clusters, one cluster consisting of the pat-terns produced by all of the reverse primers containing a G atposition 14 (designated cluster a) and one cluster of thoseproduced by reverse primers with an A at this position (des-ignated cluster b). Since four primers contained an R degen-eracy (A or G) at position 14 (designated cluster c), these weretaken out of further analysis to remove any confounding effectsof this degeneracy on the clustering. Figure 1A shows theDGGE patterns of PCR products produced with the nine re-maining reverse primers (1378*, 1a, 2a, 2*a, 3a, 1b, 2b, 2*b,and 3b) in combination with the forward GC-clamped primeron DNA from grass rhizosphere sample RG. Analysis byGelCompar produced two main clusters, designated I and II, atlow levels of similarity (Fig. 1B). The patterns produced by allreverse primers with a G at position 14 clustered together, andso did those generated with the reverse primers with an A atposition 14. No other conspicuous pattern variations were dis-cerned. Thus, the G/A switch at position 14 was apparentlymore determinative than the GC/CG alteration at the 5� end ofthe primer and/or the GGGAACG addition to the 3� end. Toascertain whether this clustering was consistent across samples,a similar analysis was performed on soil DNA taken from thegrassland bulk soil (G). Analysis with GelCompar indeed sup-ported the clustering that was also seen for sample RG. Cal-culation of the Shannon diversity indices (GelCompar) showedthat primer R1401-1a yielded patterns with the highest diver-sity index (3.23), followed by R1401-1b (3.18), R1401-2a (3.16),and R1401-2b (2.68).
To examine the nature of the dominant bacterial types thatare targeted by the different primers used in the two clusters,two reverse primers from each cluster were taken (cluster I,R1401-1a and R1401-2a; cluster II, R1401-1b and R1401-2b)and clone libraries were produced.
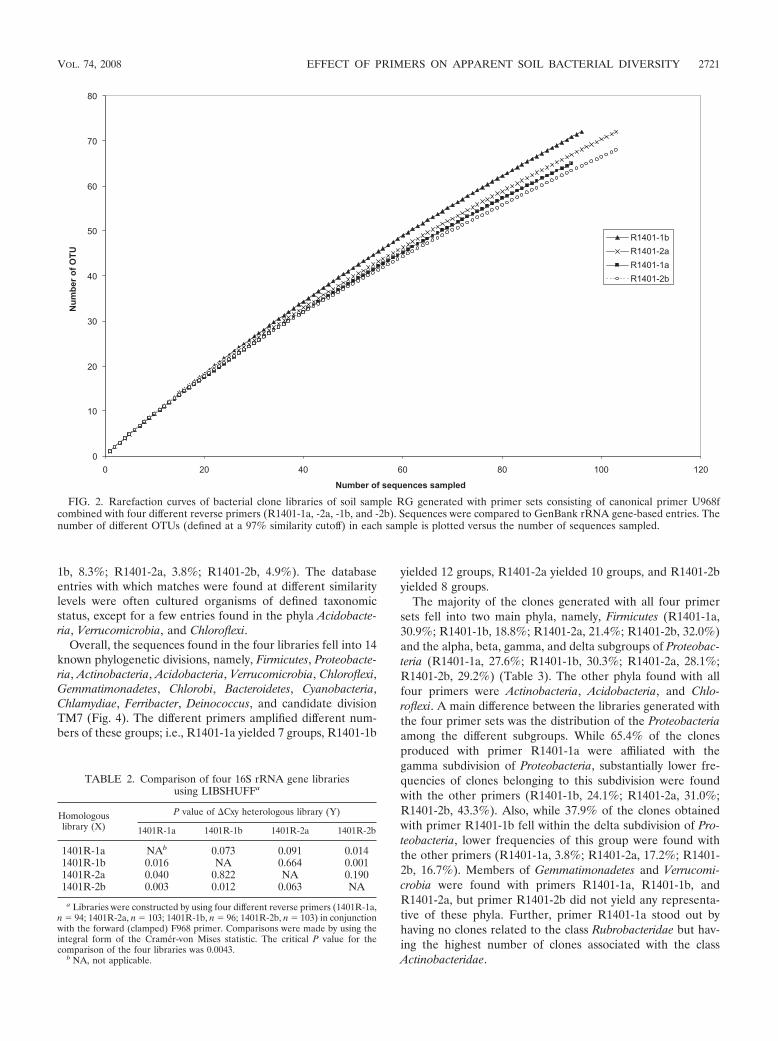
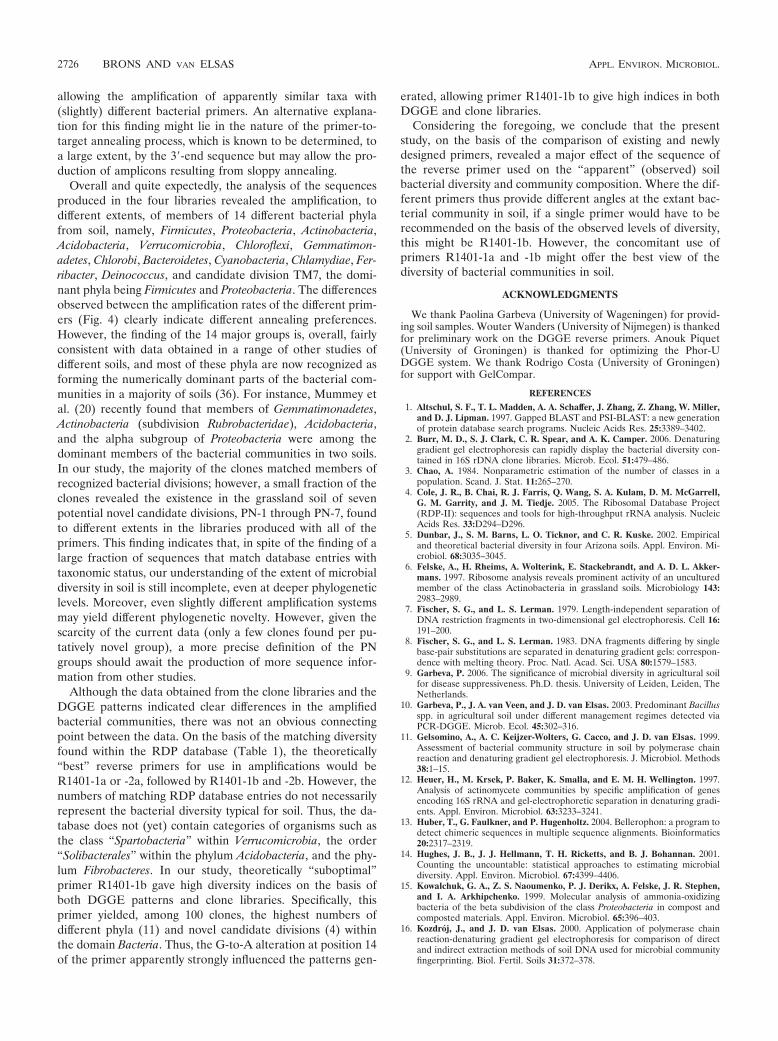
Clone libraries produced with four selected primer sets.Clone libraries were successfully produced from the same soilsample, RG, with each of the four reverse primers (R1401-1a,R1401-2a, R1401-1b, and R1401-2b) in combination with thecanonical forward primer. The clones obtained in the pGEM-Teasy vector system were then checked for the presence ofinserts of the expected size (about 450 bp) and a random set ofabout 100 clones with inserts per reverse primer was sequencedon the ABI377 apparatus. Rarefaction analysis (Fig. 2) of thesequences obtained revealed that coverage, as expected, wasnot complete; we estimated that a �10- to 30-fold increasedsampling effort would be required to achieve fair coverage. Thecoverage obtained with primer R1401-1b was conspicuouslylower than that produced with the other three primers,whereas that obtained with primer R1401-2b was the highest.On the other hand, the Shannon diversity index determined on
VOL. 74, 2008 EFFECT OF PRIMERS ON APPARENT SOIL BACTERIAL DIVERSITY 2719
the basis of the sequences (threshold, 97%) revealed rathersimilar values between the primers. As expected, the valueproduced with primer R1401-1b (4.12) was slightly higher thanthose produced with the other primers (R1401-2a, 4.07;R1401-2b, 3.99; R1401-1a, 3.93). The ChaoI species richnessestimator was the highest for primers R1401-2a (232) andR1401-2b (221) and lower for the other primers (R1401-1b,195; R1401-1a, 192).
The LIBSHUFF comparative analysis of the four clone li-braries is presented in Table 2. This analysis revealed that theclone libraries produced with primers R1401-1a and -2b weredifferent, per library, from those produced with the other threeprimer sets. Furthermore, the clone library produced withprimer R1401-1b was different from those produced with prim-ers R1401-1a and -2b and the one produced with primerR1401-2a differed from that produced with R1401-1a and -2b.Thus, considerable differences in library composition can be
caused by primers differing at various positions, even at just asingle site.
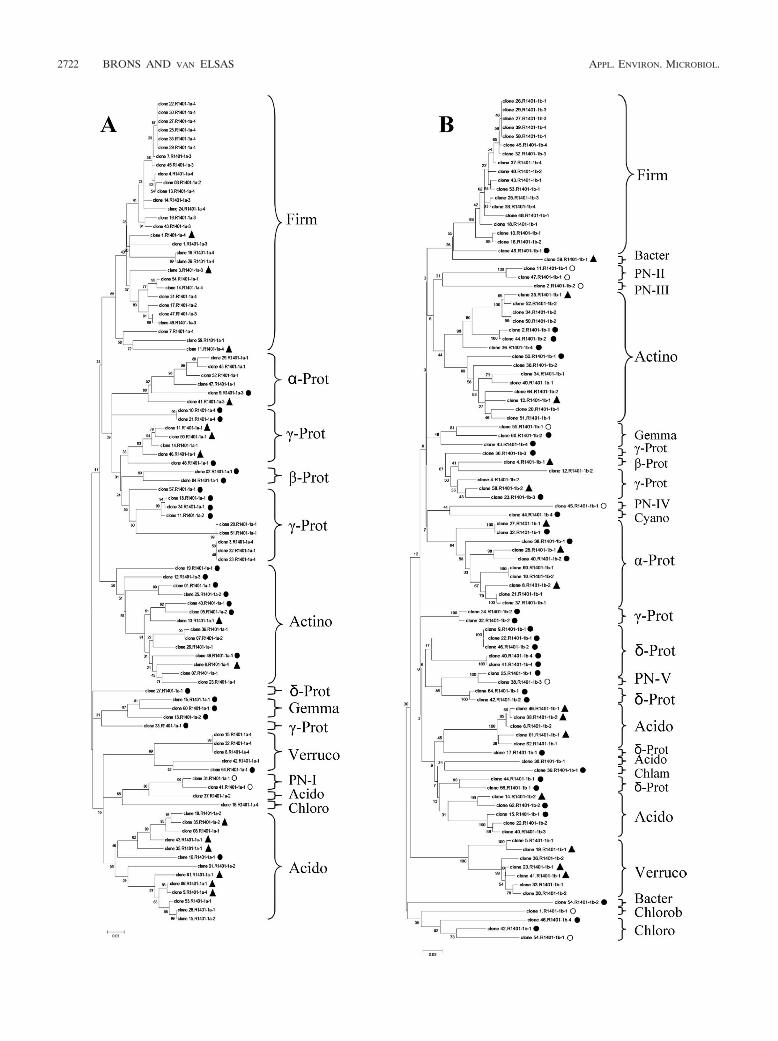
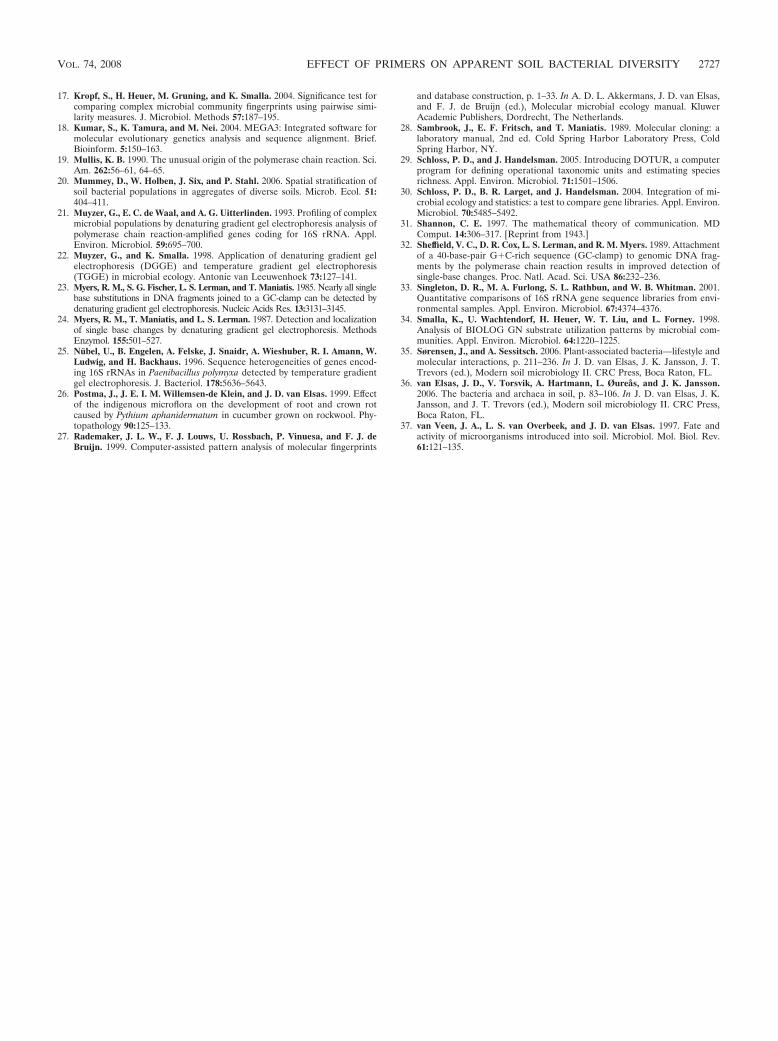
Analysis of bacterial types amplified by four selected primersets. The analysis of the clones generated per library is pre-sented in the dendrograms in Fig. 3A to D. After analysis ofthese, a histogram was made to compare the relative abun-dances of the different groups revealed by each primer set(Fig. 4). Large fractions of the clones from each library hadsequences that matched NCBI database sequences at �97%(R-1401-1a, 55.3%; R1401-1b, 42.7%; R1401-2a, 44.7%;R1401-2b, 50.5%). Moreover, 16.0% (R1401-1a), 15.6%(R1401-1b), 17.5% (R1401-2a), and 12.6% (R1401-2b) of theclones matched database entries between 95 and 97% and25.5% (R1401-1a), 33.4% (R1401-1b), 34.0% (R1401-2a), and32.0% (R1401-2b) of them matched database entries between90 and 94%. Finally, low percentages of the clone libraries hadmatches in the database of 84 to 90% (R1401-1a, 3.2%; R1401-
FIG. 1. Comparison of bacterial DGGE patterns obtained from soil sample RG by PCR with canonical primer F968 (joined to a GC clamp)and reverse primers R1401-1a, -2a, -2*a, -3a, -1378*, -1b, -2b, -2*b, and -3b (A) and the corresponding dendrogram (clustering by theunweighted-pair group method with arithmetic mean) (B). M, molecular size markers; 1a, 2a, 2*a, 3a, 1378*, 1b, 2b, 2*b, and 3b, reverse primersused.
2720 BRONS AND VAN ELSAS APPL. ENVIRON. MICROBIOL.
1b, 8.3%; R1401-2a, 3.8%; R1401-2b, 4.9%). The databaseentries with which matches were found at different similaritylevels were often cultured organisms of defined taxonomicstatus, except for a few entries found in the phyla Acidobacte-ria, Verrucomicrobia, and Chloroflexi.
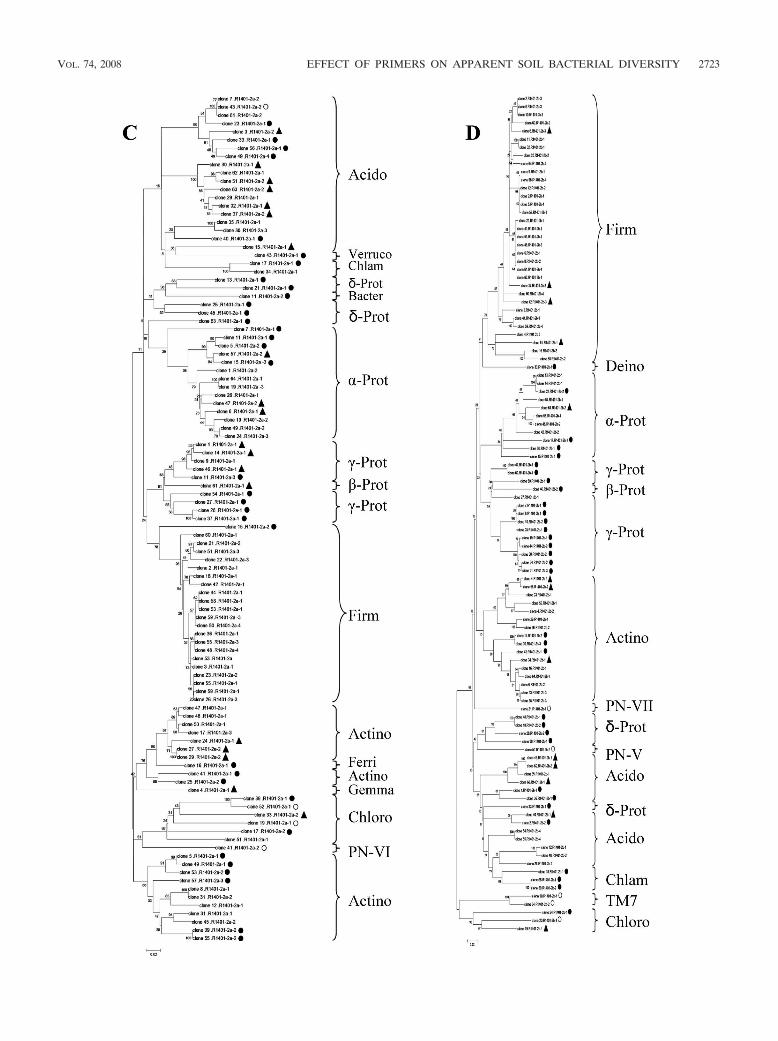
Overall, the sequences found in the four libraries fell into 14known phylogenetic divisions, namely, Firmicutes, Proteobacte-ria, Actinobacteria, Acidobacteria, Verrucomicrobia, Chloroflexi,Gemmatimonadetes, Chlorobi, Bacteroidetes, Cyanobacteria,Chlamydiae, Ferribacter, Deinococcus, and candidate divisionTM7 (Fig. 4). The different primers amplified different num-bers of these groups; i.e., R1401-1a yielded 7 groups, R1401-1b
yielded 12 groups, R1401-2a yielded 10 groups, and R1401-2byielded 8 groups.
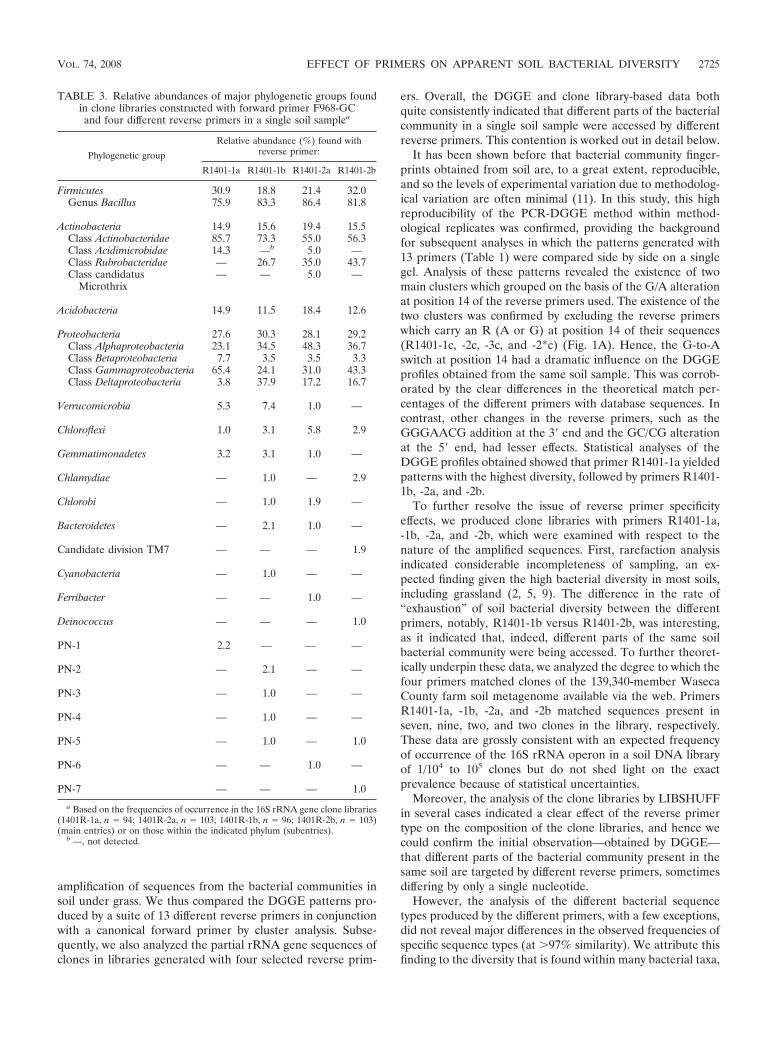
The majority of the clones generated with all four primersets fell into two main phyla, namely, Firmicutes (R1401-1a,30.9%; R1401-1b, 18.8%; R1401-2a, 21.4%; R1401-2b, 32.0%)and the alpha, beta, gamma, and delta subgroups of Proteobac-teria (R1401-1a, 27.6%; R1401-1b, 30.3%; R1401-2a, 28.1%;R1401-2b, 29.2%) (Table 3). The other phyla found with allfour primers were Actinobacteria, Acidobacteria, and Chlo-roflexi. A main difference between the libraries generated withthe four primer sets was the distribution of the Proteobacteriaamong the different subgroups. While 65.4% of the clonesproduced with primer R1401-1a were affiliated with thegamma subdivision of Proteobacteria, substantially lower fre-quencies of clones belonging to this subdivision were foundwith the other primers (R1401-1b, 24.1%; R1401-2a, 31.0%;R1401-2b, 43.3%). Also, while 37.9% of the clones obtainedwith primer R1401-1b fell within the delta subdivision of Pro-teobacteria, lower frequencies of this group were found withthe other primers (R1401-1a, 3.8%; R1401-2a, 17.2%; R1401-2b, 16.7%). Members of Gemmatimonadetes and Verrucomi-crobia were found with primers R1401-1a, R1401-1b, andR1401-2a, but primer R1401-2b did not yield any representa-tive of these phyla. Further, primer R1401-1a stood out byhaving no clones related to the class Rubrobacteridae but hav-ing the highest number of clones associated with the classActinobacteridae.
FIG. 2. Rarefaction curves of bacterial clone libraries of soil sample RG generated with primer sets consisting of canonical primer U968fcombined with four different reverse primers (R1401-1a, -2a, -1b, and -2b). Sequences were compared to GenBank rRNA gene-based entries. Thenumber of different OTUs (defined at a 97% similarity cutoff) in each sample is plotted versus the number of sequences sampled.
TABLE 2. Comparison of four 16S rRNA gene librariesusing LIBSHUFFa
Homologouslibrary (X)
P value of �Cxy heterologous library (Y)
1401R-1a 1401R-1b 1401R-2a 1401R-2b
1401R-1a NAb 0.073 0.091 0.0141401R-1b 0.016 NA 0.664 0.0011401R-2a 0.040 0.822 NA 0.1901401R-2b 0.003 0.012 0.063 NA
a Libraries were constructed by using four different reverse primers (1401R-1a,n � 94; 1401R-2a, n � 103; 1401R-1b, n � 96; 1401R-2b, n � 103) in conjunctionwith the forward (clamped) F968 primer. Comparisons were made by using theintegral form of the Cramer-von Mises statistic. The critical P value for thecomparison of the four libraries was 0.0043.
b NA, not applicable.
VOL. 74, 2008 EFFECT OF PRIMERS ON APPARENT SOIL BACTERIAL DIVERSITY 2721
2722 BRONS AND VAN ELSAS APPL. ENVIRON. MICROBIOL.
VOL. 74, 2008 EFFECT OF PRIMERS ON APPARENT SOIL BACTERIAL DIVERSITY 2723
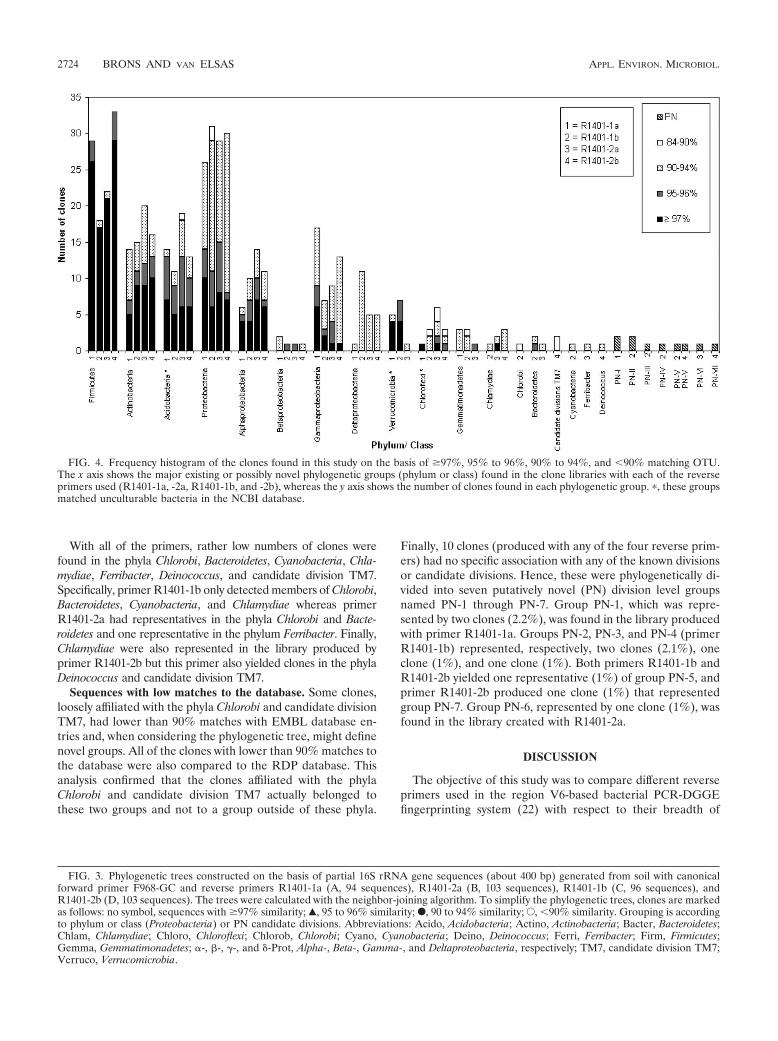
With all of the primers, rather low numbers of clones werefound in the phyla Chlorobi, Bacteroidetes, Cyanobacteria, Chla-mydiae, Ferribacter, Deinococcus, and candidate division TM7.Specifically, primer R1401-1b only detected members of Chlorobi,Bacteroidetes, Cyanobacteria, and Chlamydiae whereas primerR1401-2a had representatives in the phyla Chlorobi and Bacte-roidetes and one representative in the phylum Ferribacter. Finally,Chlamydiae were also represented in the library produced byprimer R1401-2b but this primer also yielded clones in the phylaDeinococcus and candidate division TM7.
Sequences with low matches to the database. Some clones,loosely affiliated with the phyla Chlorobi and candidate divisionTM7, had lower than 90% matches with EMBL database en-tries and, when considering the phylogenetic tree, might definenovel groups. All of the clones with lower than 90% matches tothe database were also compared to the RDP database. Thisanalysis confirmed that the clones affiliated with the phylaChlorobi and candidate division TM7 actually belonged tothese two groups and not to a group outside of these phyla.
Finally, 10 clones (produced with any of the four reverse prim-ers) had no specific association with any of the known divisionsor candidate divisions. Hence, these were phylogenetically di-vided into seven putatively novel (PN) division level groupsnamed PN-1 through PN-7. Group PN-1, which was repre-sented by two clones (2.2%), was found in the library producedwith primer R1401-1a. Groups PN-2, PN-3, and PN-4 (primerR1401-1b) represented, respectively, two clones (2.1%), oneclone (1%), and one clone (1%). Both primers R1401-1b andR1401-2b yielded one representative (1%) of group PN-5, andprimer R1401-2b produced one clone (1%) that representedgroup PN-7. Group PN-6, represented by one clone (1%), wasfound in the library created with R1401-2a.
DISCUSSION
The objective of this study was to compare different reverseprimers used in the region V6-based bacterial PCR-DGGEfingerprinting system (22) with respect to their breadth of
FIG. 3. Phylogenetic trees constructed on the basis of partial 16S rRNA gene sequences (about 400 bp) generated from soil with canonicalforward primer F968-GC and reverse primers R1401-1a (A, 94 sequences), R1401-2a (B, 103 sequences), R1401-1b (C, 96 sequences), andR1401-2b (D, 103 sequences). The trees were calculated with the neighbor-joining algorithm. To simplify the phylogenetic trees, clones are markedas follows: no symbol, sequences with �97% similarity; Œ, 95 to 96% similarity; F, 90 to 94% similarity; E, �90% similarity. Grouping is accordingto phylum or class (Proteobacteria) or PN candidate divisions. Abbreviations: Acido, Acidobacteria; Actino, Actinobacteria; Bacter, Bacteroidetes;Chlam, Chlamydiae; Chloro, Chloroflexi; Chlorob, Chlorobi; Cyano, Cyanobacteria; Deino, Deinococcus; Ferri, Ferribacter; Firm, Firmicutes;Gemma, Gemmatimonadetes; -, -, �-, and �-Prot, Alpha-, Beta-, Gamma-, and Deltaproteobacteria, respectively; TM7, candidate division TM7;Verruco, Verrucomicrobia.
FIG. 4. Frequency histogram of the clones found in this study on the basis of �97%, 95% to 96%, 90% to 94%, and �90% matching OTU.The x axis shows the major existing or possibly novel phylogenetic groups (phylum or class) found in the clone libraries with each of the reverseprimers used (R1401-1a, -2a, R1401-1b, and -2b), whereas the y axis shows the number of clones found in each phylogenetic group. �, these groupsmatched unculturable bacteria in the NCBI database.
2724 BRONS AND VAN ELSAS APPL. ENVIRON. MICROBIOL.
amplification of sequences from the bacterial communities insoil under grass. We thus compared the DGGE patterns pro-duced by a suite of 13 different reverse primers in conjunctionwith a canonical forward primer by cluster analysis. Subse-quently, we also analyzed the partial rRNA gene sequences ofclones in libraries generated with four selected reverse prim-
ers. Overall, the DGGE and clone library-based data bothquite consistently indicated that different parts of the bacterialcommunity in a single soil sample were accessed by differentreverse primers. This contention is worked out in detail below.
It has been shown before that bacterial community finger-prints obtained from soil are, to a great extent, reproducible,and so the levels of experimental variation due to methodolog-ical variation are often minimal (11). In this study, this highreproducibility of the PCR-DGGE method within method-ological replicates was confirmed, providing the backgroundfor subsequent analyses in which the patterns generated with13 primers (Table 1) were compared side by side on a singlegel. Analysis of these patterns revealed the existence of twomain clusters which grouped on the basis of the G/A alterationat position 14 of the reverse primers used. The existence of thetwo clusters was confirmed by excluding the reverse primerswhich carry an R (A or G) at position 14 of their sequences(R1401-1c, -2c, -3c, and -2*c) (Fig. 1A). Hence, the G-to-Aswitch at position 14 had a dramatic influence on the DGGEprofiles obtained from the same soil sample. This was corrob-orated by the clear differences in the theoretical match per-centages of the different primers with database sequences. Incontrast, other changes in the reverse primers, such as theGGGAACG addition at the 3� end and the GC/CG alterationat the 5� end, had lesser effects. Statistical analyses of theDGGE profiles obtained showed that primer R1401-1a yieldedpatterns with the highest diversity, followed by primers R1401-1b, -2a, and -2b.
To further resolve the issue of reverse primer specificityeffects, we produced clone libraries with primers R1401-1a,-1b, -2a, and -2b, which were examined with respect to thenature of the amplified sequences. First, rarefaction analysisindicated considerable incompleteness of sampling, an ex-pected finding given the high bacterial diversity in most soils,including grassland (2, 5, 9). The difference in the rate of“exhaustion” of soil bacterial diversity between the differentprimers, notably, R1401-1b versus R1401-2b, was interesting,as it indicated that, indeed, different parts of the same soilbacterial community were being accessed. To further theoret-ically underpin these data, we analyzed the degree to which thefour primers matched clones of the 139,340-member WasecaCounty farm soil metagenome available via the web. PrimersR1401-1a, -1b, -2a, and -2b matched sequences present inseven, nine, two, and two clones in the library, respectively.These data are grossly consistent with an expected frequencyof occurrence of the 16S rRNA operon in a soil DNA libraryof 1/104 to 105 clones but do not shed light on the exactprevalence because of statistical uncertainties.
Moreover, the analysis of the clone libraries by LIBSHUFFin several cases indicated a clear effect of the reverse primertype on the composition of the clone libraries, and hence wecould confirm the initial observation—obtained by DGGE—that different parts of the bacterial community present in thesame soil are targeted by different reverse primers, sometimesdiffering by only a single nucleotide.
However, the analysis of the different bacterial sequencetypes produced by the different primers, with a few exceptions,did not reveal major differences in the observed frequencies ofspecific sequence types (at �97% similarity). We attribute thisfinding to the diversity that is found within many bacterial taxa,
TABLE 3. Relative abundances of major phylogenetic groups foundin clone libraries constructed with forward primer F968-GCand four different reverse primers in a single soil samplea
Phylogenetic group
Relative abundance (%) found withreverse primer:
R1401-1a R1401-1b R1401-2a R1401-2b
Firmicutes 30.9 18.8 21.4 32.0Genus Bacillus 75.9 83.3 86.4 81.8
Actinobacteria 14.9 15.6 19.4 15.5Class Actinobacteridae 85.7 73.3 55.0 56.3Class Acidimicrobidae 14.3 —b 5.0 —Class Rubrobacteridae — 26.7 35.0 43.7Class candidatus
Microthrix— — 5.0 —
Acidobacteria 14.9 11.5 18.4 12.6
Proteobacteria 27.6 30.3 28.1 29.2Class Alphaproteobacteria 23.1 34.5 48.3 36.7Class Betaproteobacteria 7.7 3.5 3.5 3.3Class Gammaproteobacteria 65.4 24.1 31.0 43.3Class Deltaproteobacteria 3.8 37.9 17.2 16.7
Verrucomicrobia 5.3 7.4 1.0 —
Chloroflexi 1.0 3.1 5.8 2.9
Gemmatimonadetes 3.2 3.1 1.0 —
Chlamydiae — 1.0 — 2.9
Chlorobi — 1.0 1.9 —
Bacteroidetes — 2.1 1.0 —
Candidate division TM7 — — — 1.9
Cyanobacteria — 1.0 — —
Ferribacter — — 1.0 —
Deinococcus — — — 1.0
PN-1 2.2 — — —
PN-2 — 2.1 — —
PN-3 — 1.0 — —
PN-4 — 1.0 — —
PN-5 — 1.0 — 1.0
PN-6 — — 1.0 —
PN-7 — — — 1.0
a Based on the frequencies of occurrence in the 16S rRNA gene clone libraries(1401R-1a, n � 94; 1401R-2a, n � 103; 1401R-1b, n � 96; 1401R-2b, n � 103)(main entries) or on those within the indicated phylum (subentries).
b —, not detected.
VOL. 74, 2008 EFFECT OF PRIMERS ON APPARENT SOIL BACTERIAL DIVERSITY 2725
allowing the amplification of apparently similar taxa with(slightly) different bacterial primers. An alternative explana-tion for this finding might lie in the nature of the primer-to-target annealing process, which is known to be determined, toa large extent, by the 3�-end sequence but may allow the pro-duction of amplicons resulting from sloppy annealing.
Overall and quite expectedly, the analysis of the sequencesproduced in the four libraries revealed the amplification, todifferent extents, of members of 14 different bacterial phylafrom soil, namely, Firmicutes, Proteobacteria, Actinobacteria,Acidobacteria, Verrucomicrobia, Chloroflexi, Gemmatimon-adetes, Chlorobi, Bacteroidetes, Cyanobacteria, Chlamydiae, Fer-ribacter, Deinococcus, and candidate division TM7, the domi-nant phyla being Firmicutes and Proteobacteria. The differencesobserved between the amplification rates of the different prim-ers (Fig. 4) clearly indicate different annealing preferences.However, the finding of the 14 major groups is, overall, fairlyconsistent with data obtained in a range of other studies ofdifferent soils, and most of these phyla are now recognized asforming the numerically dominant parts of the bacterial com-munities in a majority of soils (36). For instance, Mummey etal. (20) recently found that members of Gemmatimonadetes,Actinobacteria (subdivision Rubrobacteridae), Acidobacteria,and the alpha subgroup of Proteobacteria were among thedominant members of the bacterial communities in two soils.In our study, the majority of the clones matched members ofrecognized bacterial divisions; however, a small fraction of theclones revealed the existence in the grassland soil of sevenpotential novel candidate divisions, PN-1 through PN-7, foundto different extents in the libraries produced with all of theprimers. This finding indicates that, in spite of the finding of alarge fraction of sequences that match database entries withtaxonomic status, our understanding of the extent of microbialdiversity in soil is still incomplete, even at deeper phylogeneticlevels. Moreover, even slightly different amplification systemsmay yield different phylogenetic novelty. However, given thescarcity of the current data (only a few clones found per pu-tatively novel group), a more precise definition of the PNgroups should await the production of more sequence infor-mation from other studies.
Although the data obtained from the clone libraries and theDGGE patterns indicated clear differences in the amplifiedbacterial communities, there was not an obvious connectingpoint between the data. On the basis of the matching diversityfound within the RDP database (Table 1), the theoretically“best” reverse primers for use in amplifications would beR1401-1a or -2a, followed by R1401-1b and -2b. However, thenumbers of matching RDP database entries do not necessarilyrepresent the bacterial diversity typical for soil. Thus, the da-tabase does not (yet) contain categories of organisms such asthe class “Spartobacteria” within Verrucomicrobia, the order“Solibacterales” within the phylum Acidobacteria, and the phy-lum Fibrobacteres. In our study, theoretically “suboptimal”primer R1401-1b gave high diversity indices on the basis ofboth DGGE patterns and clone libraries. Specifically, thisprimer yielded, among 100 clones, the highest numbers ofdifferent phyla (11) and novel candidate divisions (4) withinthe domain Bacteria. Thus, the G-to-A alteration at position 14of the primer apparently strongly influenced the patterns gen-
erated, allowing primer R1401-1b to give high indices in bothDGGE and clone libraries.
Considering the foregoing, we conclude that the presentstudy, on the basis of the comparison of existing and newlydesigned primers, revealed a major effect of the sequence ofthe reverse primer used on the “apparent” (observed) soilbacterial diversity and community composition. Where the dif-ferent primers thus provide different angles at the extant bac-terial community in soil, if a single primer would have to berecommended on the basis of the observed levels of diversity,this might be R1401-1b. However, the concomitant use ofprimers R1401-1a and -1b might offer the best view of thediversity of bacterial communities in soil.
ACKNOWLEDGMENTS
We thank Paolina Garbeva (University of Wageningen) for provid-ing soil samples. Wouter Wanders (University of Nijmegen) is thankedfor preliminary work on the DGGE reverse primers. Anouk Piquet(University of Groningen) is thanked for optimizing the Phor-UDGGE system. We thank Rodrigo Costa (University of Groningen)for support with GelCompar.
REFERENCES
1. Altschul, S. F., T. L. Madden, A. A. Schaffer, J. Zhang, Z. Zhang, W. Miller,and D. J. Lipman. 1997. Gapped BLAST and PSI-BLAST: a new generationof protein database search programs. Nucleic Acids Res. 25:3389–3402.
2. Burr, M. D., S. J. Clark, C. R. Spear, and A. K. Camper. 2006. Denaturinggradient gel electrophoresis can rapidly display the bacterial diversity con-tained in 16S rDNA clone libraries. Microb. Ecol. 51:479–486.
3. Chao, A. 1984. Nonparametric estimation of the number of classes in apopulation. Scand. J. Stat. 11:265–270.
4. Cole, J. R., B. Chai, R. J. Farris, Q. Wang, S. A. Kulam, D. M. McGarrell,G. M. Garrity, and J. M. Tiedje. 2005. The Ribosomal Database Project(RDP-II): sequences and tools for high-throughput rRNA analysis. NucleicAcids Res. 33:D294–D296.
5. Dunbar, J., S. M. Barns, L. O. Ticknor, and C. R. Kuske. 2002. Empiricaland theoretical bacterial diversity in four Arizona soils. Appl. Environ. Mi-crobiol. 68:3035–3045.
6. Felske, A., H. Rheims, A. Wolterink, E. Stackebrandt, and A. D. L. Akker-mans. 1997. Ribosome analysis reveals prominent activity of an unculturedmember of the class Actinobacteria in grassland soils. Microbiology 143:2983–2989.
7. Fischer, S. G., and L. S. Lerman. 1979. Length-independent separation ofDNA restriction fragments in two-dimensional gel electrophoresis. Cell 16:191–200.
8. Fischer, S. G., and L. S. Lerman. 1983. DNA fragments differing by singlebase-pair substitutions are separated in denaturing gradient gels: correspon-dence with melting theory. Proc. Natl. Acad. Sci. USA 80:1579–1583.
9. Garbeva, P. 2006. The significance of microbial diversity in agricultural soilfor disease suppressiveness. Ph.D. thesis. University of Leiden, Leiden, TheNetherlands.
10. Garbeva, P., J. A. van Veen, and J. D. van Elsas. 2003. Predominant Bacillusspp. in agricultural soil under different management regimes detected viaPCR-DGGE. Microb. Ecol. 45:302–316.
11. Gelsomino, A., A. C. Keijzer-Wolters, G. Cacco, and J. D. van Elsas. 1999.Assessment of bacterial community structure in soil by polymerase chainreaction and denaturing gradient gel electrophoresis. J. Microbiol. Methods38:1–15.
12. Heuer, H., M. Krsek, P. Baker, K. Smalla, and E. M. H. Wellington. 1997.Analysis of actinomycete communities by specific amplification of genesencoding 16S rRNA and gel-electrophoretic separation in denaturing gradi-ents. Appl. Environ. Microbiol. 63:3233–3241.
13. Huber, T., G. Faulkner, and P. Hugenholtz. 2004. Bellerophon: a program todetect chimeric sequences in multiple sequence alignments. Bioinformatics20:2317–2319.
14. Hughes, J. B., J. J. Hellmann, T. H. Ricketts, and B. J. Bohannan. 2001.Counting the uncountable: statistical approaches to estimating microbialdiversity. Appl. Environ. Microbiol. 67:4399–4406.
15. Kowalchuk, G. A., Z. S. Naoumenko, P. J. Derikx, A. Felske, J. R. Stephen,and I. A. Arkhipchenko. 1999. Molecular analysis of ammonia-oxidizingbacteria of the beta subdivision of the class Proteobacteria in compost andcomposted materials. Appl. Environ. Microbiol. 65:396–403.
16. Kozdroj, J., and J. D. van Elsas. 2000. Application of polymerase chainreaction-denaturing gradient gel electrophoresis for comparison of directand indirect extraction methods of soil DNA used for microbial communityfingerprinting. Biol. Fertil. Soils 31:372–378.
2726 BRONS AND VAN ELSAS APPL. ENVIRON. MICROBIOL.
17. Kropf, S., H. Heuer, M. Gruning, and K. Smalla. 2004. Significance test forcomparing complex microbial community fingerprints using pairwise simi-larity measures. J. Microbiol. Methods 57:187–195.
18. Kumar, S., K. Tamura, and M. Nei. 2004. MEGA3: Integrated software formolecular evolutionary genetics analysis and sequence alignment. Brief.Bioinform. 5:150–163.
19. Mullis, K. B. 1990. The unusual origin of the polymerase chain reaction. Sci.Am. 262:56–61, 64–65.
20. Mummey, D., W. Holben, J. Six, and P. Stahl. 2006. Spatial stratification ofsoil bacterial populations in aggregates of diverse soils. Microb. Ecol. 51:404–411.
21. Muyzer, G., E. C. de Waal, and A. G. Uitterlinden. 1993. Profiling of complexmicrobial populations by denaturing gradient gel electrophoresis analysis ofpolymerase chain reaction-amplified genes coding for 16S rRNA. Appl.Environ. Microbiol. 59:695–700.
22. Muyzer, G., and K. Smalla. 1998. Application of denaturing gradient gelelectrophoresis (DGGE) and temperature gradient gel electrophoresis(TGGE) in microbial ecology. Antonie van Leeuwenhoek 73:127–141.
23. Myers, R. M., S. G. Fischer, L. S. Lerman, and T. Maniatis. 1985. Nearly all singlebase substitutions in DNA fragments joined to a GC-clamp can be detected bydenaturing gradient gel electrophoresis. Nucleic Acids Res. 13:3131–3145.
24. Myers, R. M., T. Maniatis, and L. S. Lerman. 1987. Detection and localizationof single base changes by denaturing gradient gel electrophoresis. MethodsEnzymol. 155:501–527.
25. Nubel, U., B. Engelen, A. Felske, J. Snaidr, A. Wieshuber, R. I. Amann, W.Ludwig, and H. Backhaus. 1996. Sequence heterogeneities of genes encod-ing 16S rRNAs in Paenibacillus polymyxa detected by temperature gradientgel electrophoresis. J. Bacteriol. 178:5636–5643.
26. Postma, J., J. E. I. M. Willemsen-de Klein, and J. D. van Elsas. 1999. Effectof the indigenous microflora on the development of root and crown rotcaused by Pythium aphanidermatum in cucumber grown on rockwool. Phy-topathology 90:125–133.
27. Rademaker, J. L. W., F. J. Louws, U. Rossbach, P. Vinuesa, and F. J. deBruijn. 1999. Computer-assisted pattern analysis of molecular fingerprints
and database construction, p. 1–33. In A. D. L. Akkermans, J. D. van Elsas,and F. J. de Bruijn (ed.), Molecular microbial ecology manual. KluwerAcademic Publishers, Dordrecht, The Netherlands.
28. Sambrook, J., E. F. Fritsch, and T. Maniatis. 1989. Molecular cloning: alaboratory manual, 2nd ed. Cold Spring Harbor Laboratory Press, ColdSpring Harbor, NY.
29. Schloss, P. D., and J. Handelsman. 2005. Introducing DOTUR, a computerprogram for defining operational taxonomic units and estimating speciesrichness. Appl. Environ. Microbiol. 71:1501–1506.
30. Schloss, P. D., B. R. Larget, and J. Handelsman. 2004. Integration of mi-crobial ecology and statistics: a test to compare gene libraries. Appl. Environ.Microbiol. 70:5485–5492.
31. Shannon, C. E. 1997. The mathematical theory of communication. MDComput. 14:306–317. [Reprint from 1943.]
32. Sheffield, V. C., D. R. Cox, L. S. Lerman, and R. M. Myers. 1989. Attachmentof a 40-base-pair G�C-rich sequence (GC-clamp) to genomic DNA frag-ments by the polymerase chain reaction results in improved detection ofsingle-base changes. Proc. Natl. Acad. Sci. USA 86:232–236.
33. Singleton, D. R., M. A. Furlong, S. L. Rathbun, and W. B. Whitman. 2001.Quantitative comparisons of 16S rRNA gene sequence libraries from envi-ronmental samples. Appl. Environ. Microbiol. 67:4374–4376.
34. Smalla, K., U. Wachtendorf, H. Heuer, W. T. Liu, and L. Forney. 1998.Analysis of BIOLOG GN substrate utilization patterns by microbial com-munities. Appl. Environ. Microbiol. 64:1220–1225.
35. Sørensen, J., and A. Sessitsch. 2006. Plant-associated bacteria—lifestyle andmolecular interactions, p. 211–236. In J. D. van Elsas, J. K. Jansson, J. T.Trevors (ed.), Modern soil microbiology II. CRC Press, Boca Raton, FL.
36. van Elsas, J. D., V. Torsvik, A. Hartmann, L. Øureås, and J. K. Jansson.2006. The bacteria and archaea in soil, p. 83–106. In J. D. van Elsas, J. K.Jansson, and J. T. Trevors (ed.), Modern soil microbiology II. CRC Press,Boca Raton, FL.
37. van Veen, J. A., L. S. van Overbeek, and J. D. van Elsas. 1997. Fate andactivity of microorganisms introduced into soil. Microbiol. Mol. Biol. Rev.61:121–135.
VOL. 74, 2008 EFFECT OF PRIMERS ON APPARENT SOIL BACTERIAL DIVERSITY 2727