Embed Size (px)
Citation preview
ANALYSIS OF AN ONLINE PLACEMENT EXAM FOR CALCULUS
by
THEANG HO
B.S., University of Nebraska – Lincoln, 2007
A REPORT
Submitted in partial fulfillment of the requirements for the degree
MASTER OF SCIENCE
Department of Mathematics
College of Arts and Science
KANSAS STATE UNIVERSITY
Manhattan, Kansas
2010
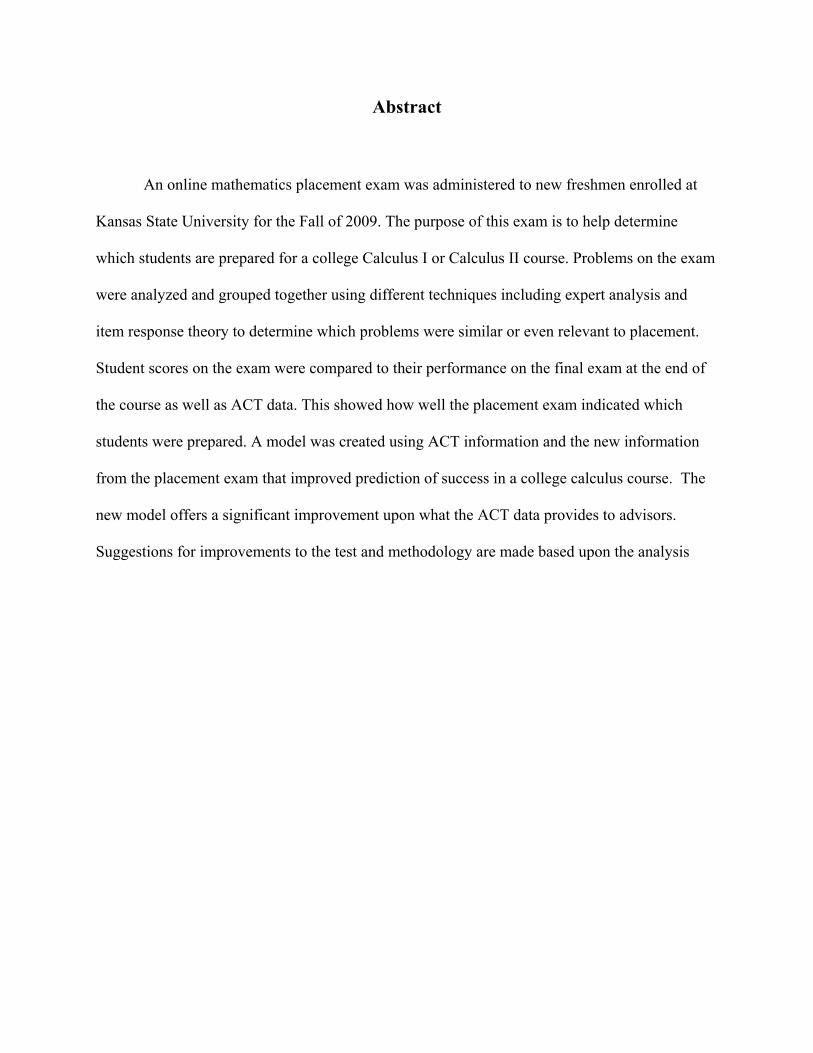
Abstract
An online mathematics placement exam was administered to new freshmen enrolled at
Kansas State University for the Fall of 2009. The purpose of this exam is to help determine
which students are prepared for a college Calculus I or Calculus II course. Problems on the exam
were analyzed and grouped together using different techniques including expert analysis and
item response theory to determine which problems were similar or even relevant to placement.
Student scores on the exam were compared to their performance on the final exam at the end of
the course as well as ACT data. This showed how well the placement exam indicated which
students were prepared. A model was created using ACT information and the new information
from the placement exam that improved prediction of success in a college calculus course. The
new model offers a significant improvement upon what the ACT data provides to advisors.
Suggestions for improvements to the test and methodology are made based upon the analysis
iii
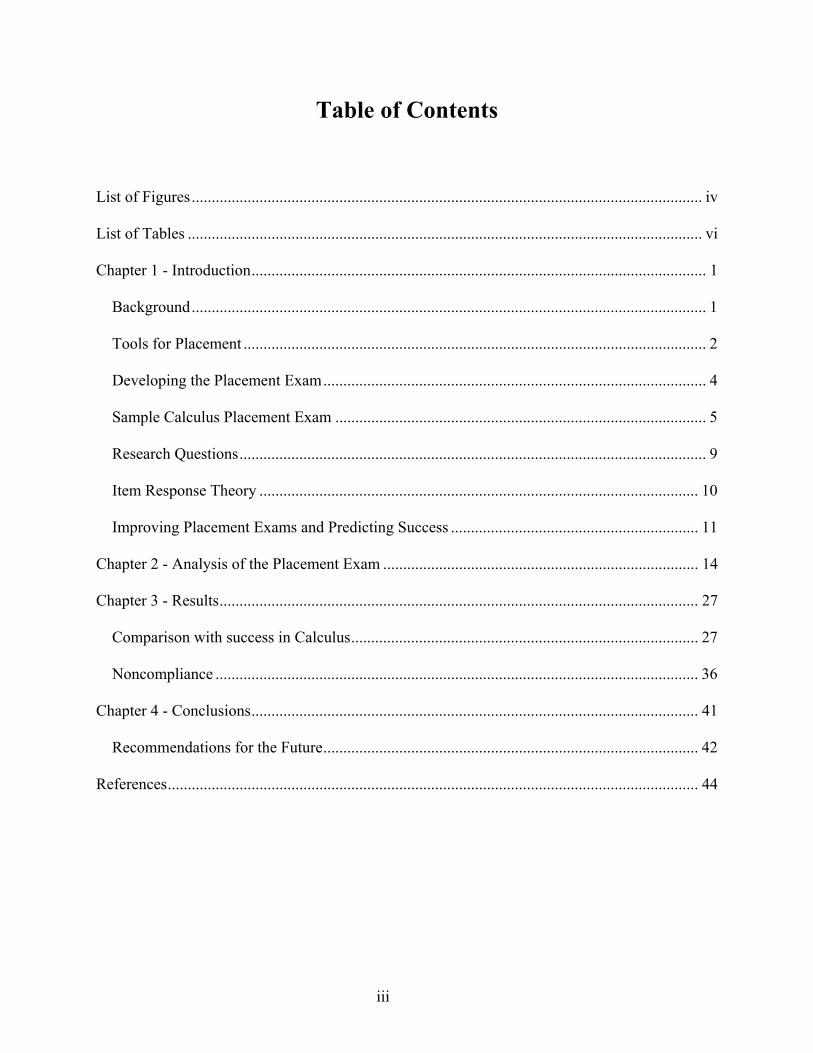
Table of Contents
List of Figures................................................................................................................................ iv
List of Tables ................................................................................................................................. vi
Chapter 1 - Introduction.................................................................................................................. 1
Background................................................................................................................................. 1
Tools for Placement .................................................................................................................... 2
Developing the Placement Exam................................................................................................ 4
Sample Calculus Placement Exam ............................................................................................. 5
Research Questions..................................................................................................................... 9
Item Response Theory .............................................................................................................. 10
Improving Placement Exams and Predicting Success .............................................................. 11
Chapter 2 - Analysis of the Placement Exam ............................................................................... 14
Chapter 3 - Results........................................................................................................................ 27
Comparison with success in Calculus....................................................................................... 27
Noncompliance ......................................................................................................................... 36
Chapter 4 - Conclusions................................................................................................................ 41
Recommendations for the Future.............................................................................................. 42
References..................................................................................................................................... 44
iv
List of Figures
Figure 1.1 Kansas State University Math Course Prerequisites [13].............................................. 2
Figure 1.2 Sample Section 1 of the Calculus Placement Exam...................................................... 5
Figure 1.3 Sample Section 2 of the Calculus Placement Exam...................................................... 6
Figure 1.4 Sample Section 3 of the Calculus Placement Exam...................................................... 7
Figure 1.5 Sample Section 4 of the Calculus Placement Exam...................................................... 8
Figure 2.1 Item Response Curve of Section 3, Problem 3 (grade as latent trait).......................... 15
Figure 2.2 Item Response Curve of Section 4, Problem 3 (grade as latent trait).......................... 15
Figure 2.3 Item Response Curve for Section 1, Problem 1 ......................................................... 16
Figure 2.4 Item Response Curve for Section 1, Problem 2 ......................................................... 17
Figure 2.5 Item Response Curve for Section 1, Problem 3 ......................................................... 17
Figure 2.6 Item Response Curve for Section 1, Problem 4 ......................................................... 18
Figure 2.7 Item Response Curve for Section 2, Problem 1 ......................................................... 18
Figure 2.8 Item Response Curve for Section 2, Problem 2 .......................................................... 19
Figure 2.9 Item Response Curve for Section 2, Problem 3 .......................................................... 19
Figure 2.10 Item Response Curve for Section 2, Problem 4 ........................................................ 20
Figure 2.11 Item Response Curve for Section 3, Problem 1 ........................................................ 20
Figure 2.12 Item Response Curve for Section 3, Problem 2 ........................................................ 21
Figure 2.13 Item Response Curve for Section 3, Problem 3 ........................................................ 21
Figure 2.14 Item Response Curve for Section 3, Problem 4 ........................................................ 22
Figure 2.15 Item Response Curve for Section 3, Problem 5 ........................................................ 22
Figure 2.16 Item Response Curve for Section 4, Problem 1 ........................................................ 23
v
Figure 2.17 Item Response Curve for Section 4, Problem 2 ........................................................ 23
Figure 2.18 Item Response Curve for Section 4, Problem 3 ........................................................ 24
Figure 2.19 Item Response Curve for Section 4, Problem 4 ........................................................ 24
Figure 2.20 Item Response Curve for Section 4, Problem 5 ........................................................ 25
Figure 2.21 Item Response Curve Coefficients ............................................................................ 26
Figure 3.1Venn Diagram of Variance........................................................................................... 34
Figure 3.2 Z-score versus Percent C or Better.............................................................................. 35
Figure 3.3 Pie Chart of Freshmen in Calculus who took the Placement Exam............................ 38
Figure 3.4Pie Chart of Freshmen in Calculus who Did NOT take the Placement Exam ............. 38
Figure 3.5 Pie Chart of Freshmen in Calculus II who took the Placement Exam ........................ 40
Figure 3.6 Pie Chart of Freshmen in Calculus II who took the Placement Exam ........................ 40
vi
List of Tables
Table 2.1 Levels of Difficulties and Discrimination (by ascending difficutly)............................ 25
Table 3.1 Placement exam Z-scores and Model ........................................................................... 35
Table 3.2 Percent of Grades C or better in Calculus I ................................................................. 37
Table 3.3 Percent of Grades C or better in Calculus II ................................................................. 39
1
Chapter 1 - Introduction
Background
Calculus is a required course for many majors at Kansas State University, especially in
the sciences. To name a few, students pursuing a degree in Engineering, Chemistry, Biology, and
engineering must successfully complete a course in Calculus and some must complete Calculus
II. We would like to see a higher level of success in freshmen taking Calculus classes. Questions
were raised about whether students were being properly placed into Calculus and Calculus II.
Many institutions at the post-secondary level use a variety of methods in an attempt at placing
students in the correct mathematics course for which they are prepared. Tools available to
counselors and advisors include the ACT, SAT, high school data, and placement examinations.
They develop a method of placement based upon the school’s curriculum, methodology, student
population, and accessibility to the placement exams. A placement exam would provide
additional information to help place students into the appropriate math course for which they
possess the skills necessary to succeed. Ninety percent of post secondary institutions use some
form of placement test [7]. Until 2009, Kansas State University did not have a placement test for
Mathematics. We believe that using ACT data and information from a placement exam will
increase students’ chance for success by improving the ability of advisers to place students into
the correct mathematics course.
Predicting overall success of college students has long been a topic of interest to college
admissions. It has been found that the best predictor for overall college success and retention is
grade point average from the first year of college [9]. Furthermore, first year grades are “the
single most revealing indicator of successful adjustment to the intellectual demands of a
2
particular college’s course of study”[3]. Placing students in the correct classes should improve
grades in the first year. And thus proper placement plays an important role in increasing retention
and overall success in college.
Tools for Placement
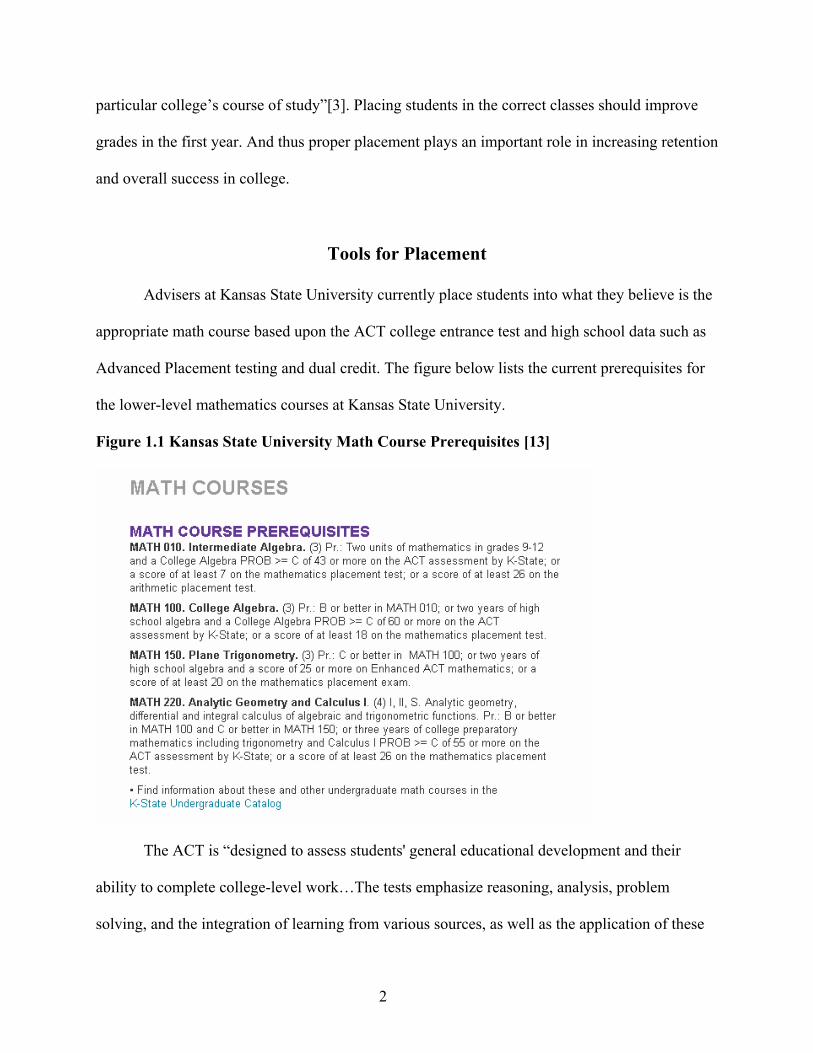
Advisers at Kansas State University currently place students into what they believe is the
appropriate math course based upon the ACT college entrance test and high school data such as
Advanced Placement testing and dual credit. The figure below lists the current prerequisites for
the lower-level mathematics courses at Kansas State University.
Figure 1.1 Kansas State University Math Course Prerequisites [13]
The ACT is “designed to assess students' general educational development and their
ability to complete college-level work…The tests emphasize reasoning, analysis, problem
solving, and the integration of learning from various sources, as well as the application of these
3
proficiencies to the kinds of tasks college students are expected to perform… The Mathematics
Test is based on six content areas: pre-algebra, elementary algebra, intermediate algebra,
coordinate geometry, plane geometry, and trigonometry” [11].
Students may have been exposed to a high school course in higher mathematics or
enrolled for dual credit from a community college. Dual credit, also known as dual enrollment, is
a course that is taken by a high school student that counts toward both high school credit and
college credit. It is generally taught during the normal school day by a high school teacher in
that school. Some students may have taken an Advanced Placement course in calculus during
high school. “AP courses in calculus consist of a full high school academic year of work and are
comparable to calculus courses in colleges and universities. It is expected that students who take
an AP course in calculus will seek college credit, college placement or both from institutions of
higher learning”[12]. A study on the effect of high school course work on lower-level
undergraduate success in math has found that “taking more higher level math courses in high
school is an accurate predictor of scoring well on aptitude tests commonly required for admission
into four-year baccalaureate institutions.”[4] Exposure to the material, despite the grade earned
in the class, served as an advantage for students taking placement exams.
The ACT does provide information for placement into calculus courses and below, but
not Calculus II. Some high school calculus courses do adequately prepare their students for
entering in to a Calculus I or Calculus II course, but this is not always the case. The "Factors
Influencing College Success in Mathematics (FICS-Math)" project at Harvard University is
currently conducting a 3-year study to determine what background factors best prepare students
for calculus in college. Anecdotally, exit interviews have suggested many students struggling in
Calculus II at Kansas State have been exposed to calculus in high school. The ACT does not
4
cover calculus, and previous exposure to calculus in high school does not guarantee retention or
proficiency in the skills necessary to succeed in a college level calculus course. Students choose
to place themselves in either Calculus I or Calculus II because we have no validating information
to decide which class to place them. Placement exams aim to screen possible failure, not to
guarantee success. Being placed in the correct mathematics course would enable a higher success
rate and hopefully increase retention in college enrollment.
Developing the Placement Exam
To improve our ability to properly place students into the correct mathematics course the
mathematics department developed a placement exam. In discussions with New Student Services
about how to offer the exam to all students, the department was informed that there was
insufficient time available to offer the exams during student orientation. It was decided to offer
the exam online so all students could have access to it prior to their arrival for registration in
June. The exam was built on the framework of the department’s current online homework
system. Most problems were not multiple-choice but required students to type in numbers or
formulas. Students are given one chance to fix errors on any problems they missed, allowing
them to correct simple computational or typographical errors. The system randomly generates
different but similar problems for each student every time they sign in. Students are allowed to
try multiple times if they felt their initial score was not reflective of their ability. The exam was
split into two sections: Algebra and Calculus. Questions on Trigonometry are included in the
Calculus exam. The problems on the calculus exam were written by faculty members of the
Kansas State University Department of Mathematics. These problems demonstrate what they
perceive to be the skills necessary to succeed in a calculus course at Kansas State University and
5
representative of the course curriculum. The exams were administered online and at home, and
the students were on the honor system.
Sample Calculus Placement Exam
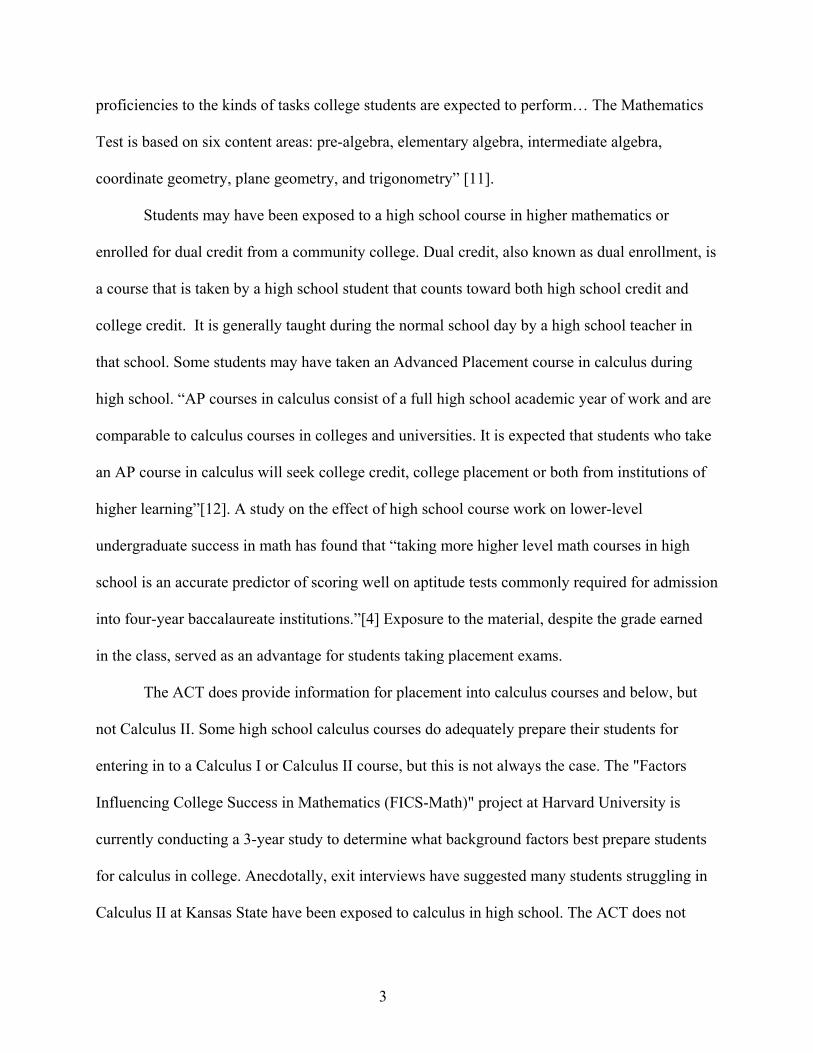
Each student receives a randomly generated exam so we can only show one example to
indicate the type of problems asked. The specific values in the equations vary for each attempt
on the exam.
Section 1 of the Placement Exam covers basic trigonometry and includes problems on
angles and right triangles.
Figure 1.2 Sample Section 1 of the Calculus Placement Exam
6
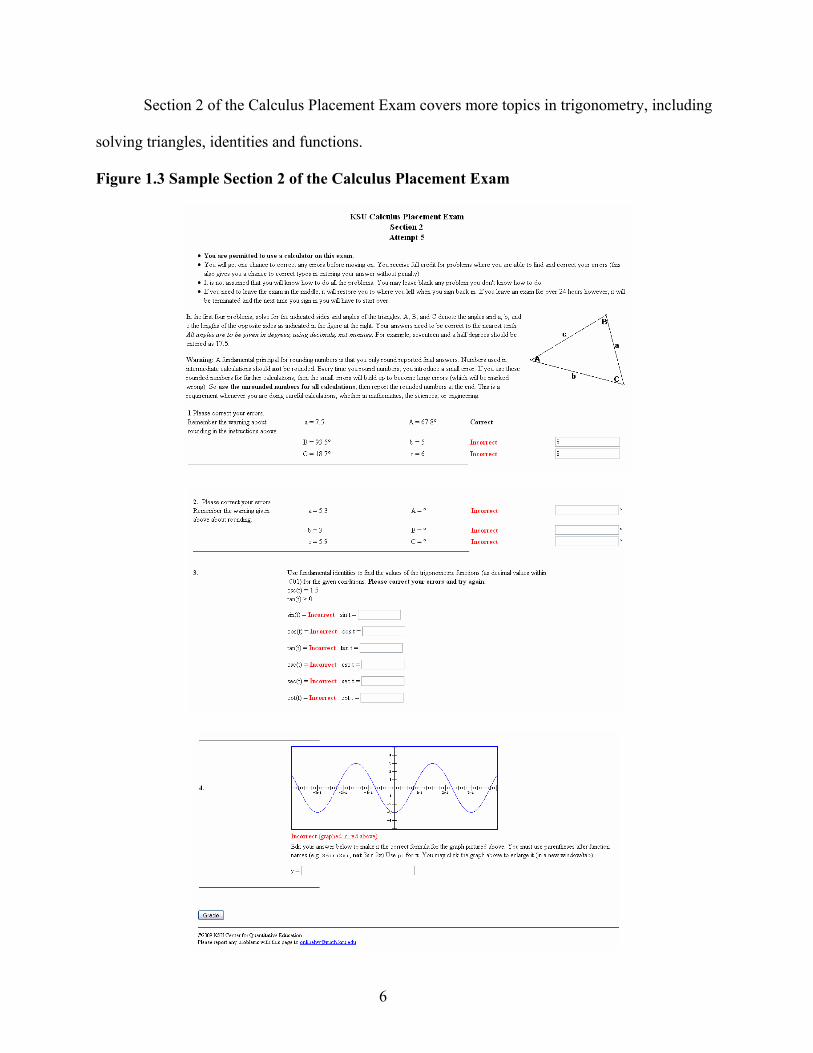
Section 2 of the Calculus Placement Exam covers more topics in trigonometry, including
solving triangles, identities and functions.
Figure 1.3 Sample Section 2 of the Calculus Placement Exam
7
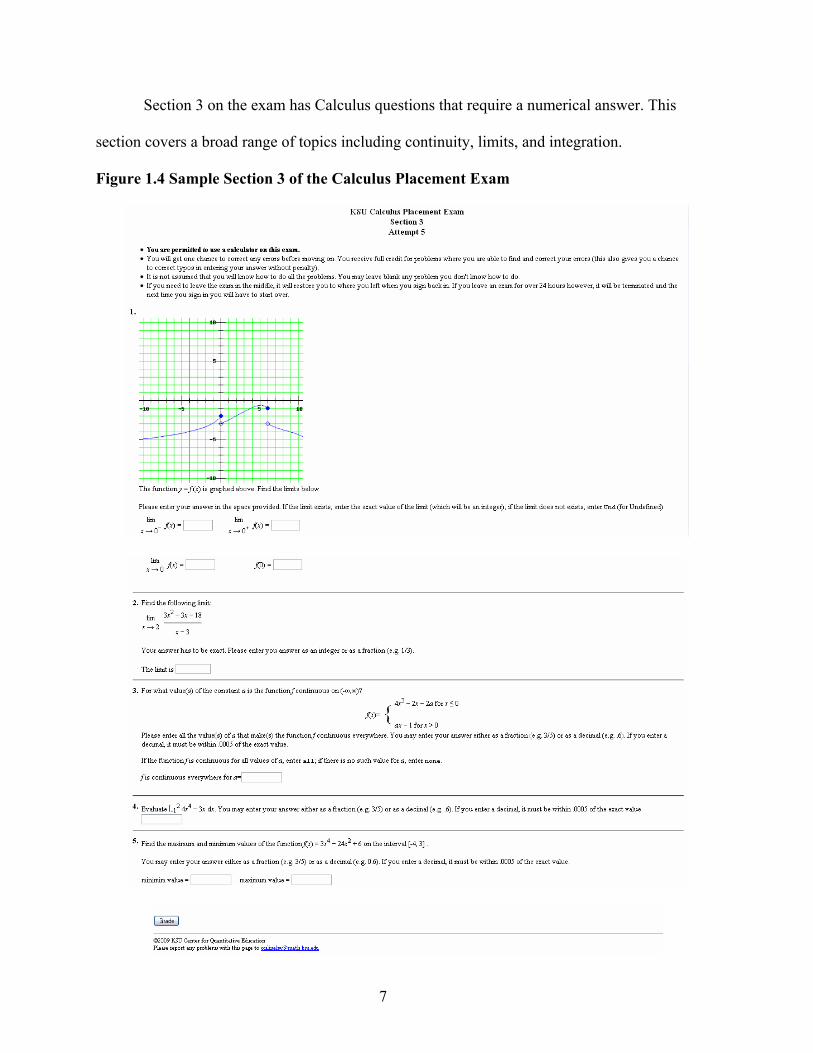
Section 3 on the exam has Calculus questions that require a numerical answer. This
section covers a broad range of topics including continuity, limits, and integration.
Figure 1.4 Sample Section 3 of the Calculus Placement Exam
8
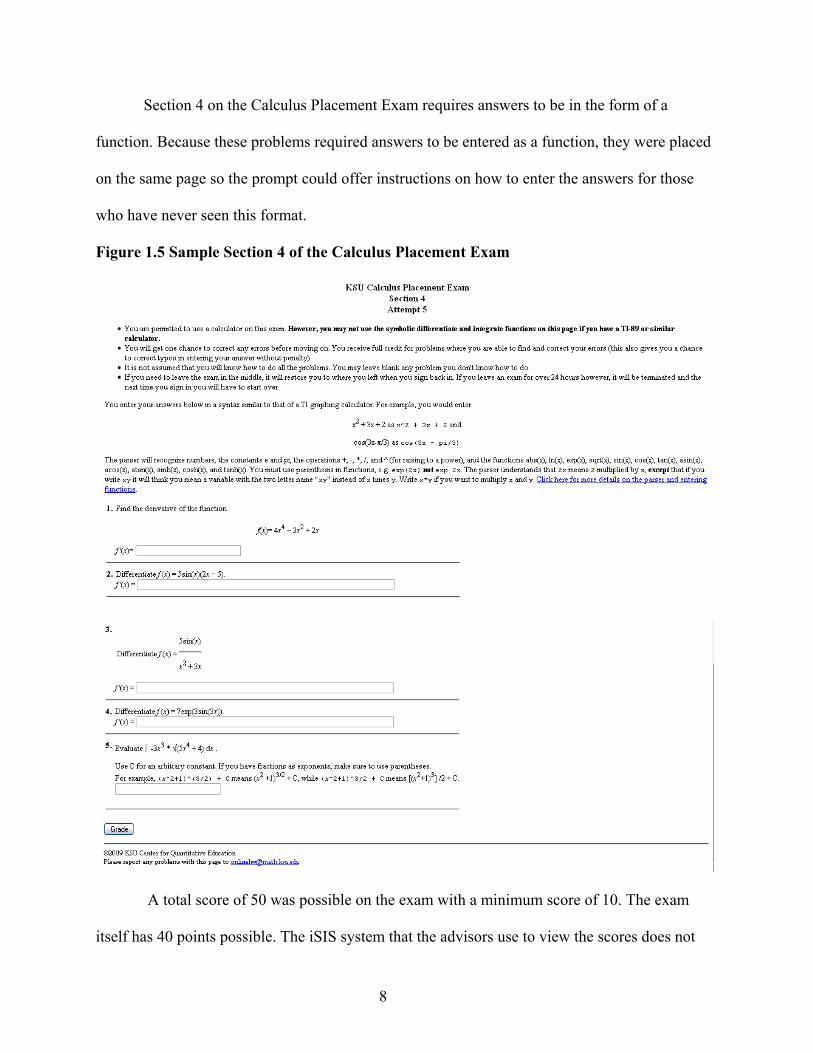
Section 4 on the Calculus Placement Exam requires answers to be in the form of a
function. Because these problems required answers to be entered as a function, they were placed
on the same page so the prompt could offer instructions on how to enter the answers for those
who have never seen this format.
Figure 1.5 Sample Section 4 of the Calculus Placement Exam
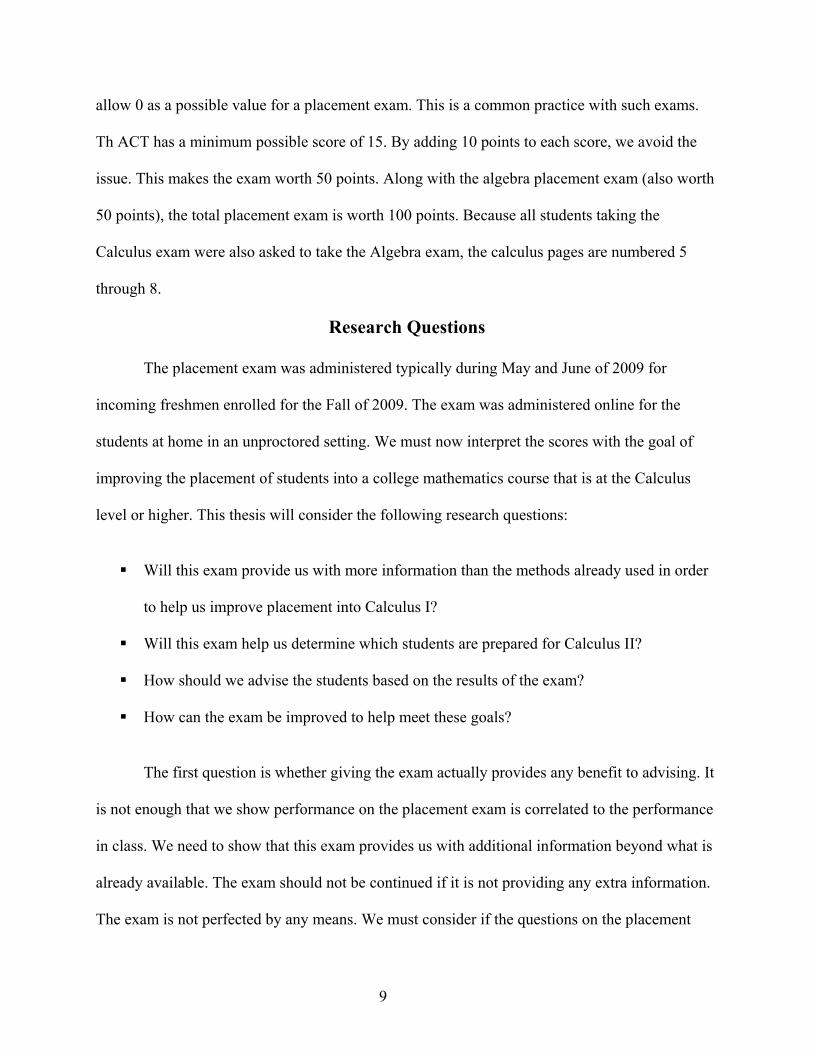
A total score of 50 was possible on the exam with a minimum score of 10. The exam
itself has 40 points possible. The iSIS system that the advisors use to view the scores does not
9
allow 0 as a possible value for a placement exam. This is a common practice with such exams.
Th ACT has a minimum possible score of 15. By adding 10 points to each score, we avoid the
issue. This makes the exam worth 50 points. Along with the algebra placement exam (also worth
50 points), the total placement exam is worth 100 points. Because all students taking the
Calculus exam were also asked to take the Algebra exam, the calculus pages are numbered 5
through 8.
Research Questions
The placement exam was administered typically during May and June of 2009 for
incoming freshmen enrolled for the Fall of 2009. The exam was administered online for the
students at home in an unproctored setting. We must now interpret the scores with the goal of
improving the placement of students into a college mathematics course that is at the Calculus
level or higher. This thesis will consider the following research questions:
Will this exam provide us with more information than the methods already used in order
to help us improve placement into Calculus I?
Will this exam help us determine which students are prepared for Calculus II?
How should we advise the students based on the results of the exam?
How can the exam be improved to help meet these goals?
The first question is whether giving the exam actually provides any benefit to advising. It
is not enough that we show performance on the placement exam is correlated to the performance
in class. We need to show that this exam provides us with additional information beyond what is
already available. The exam should not be continued if it is not providing any extra information.
The exam is not perfected by any means. We must consider if the questions on the placement
10
exam are useful in evaluating placement.
In the Fall of 2009, 145 out of 257 (about 60%) of students enrolled in Calculus II in the
Fall were freshmen. This is typical for a Fall semester. Will this exam be successful in placing
the correct students into Calculus II? If students have dual credit for Calculus, advisers will allow
the students choose to place themselves into either Calculus I or Calculus II because we have no
other indicators of preparedness. Assuming the exam does provide additional information, the
third question asks how the placement exam scores should be interpreted. We could determine a
minimum score on the placement exam required for students to be placed into Calculus I or
Calculus II. Depending on the strength of correlation between performance on the placement
exam and actual performance in the course, it might be more appropriate to provide an estimate
of success and allow the student and advisor to make individual decisions based upon this
estimate.
Item Response Theory
Item response theory, also known as Latent Trait Theory, Item Characteristic Curve
Theory, Rasch model, 2PL Model, 3PL Model, and the Birnbaum Model, is the study of test and
item scores based on the mathematical relationship between a hypothesized trait (the latent trait)
and item responses [1]. In academics, the latent trait can be any measurable attribute of a test
subject including IQ levels, academic ability, reading ability, or arithmetic ability. A test is
developed with items that measure a different facet of interest. Each item possesses a
corresponding Item Response Function that typically forms an S-shaped curve when plotting the
latent trait versus the probability of getting a correct answer on the item. For the purpose of this
report, we will only employ the one-dimensional (Rasch) model. We use this Item Response
Theory in lieu of Classical Test Theory because it provides more information.
11
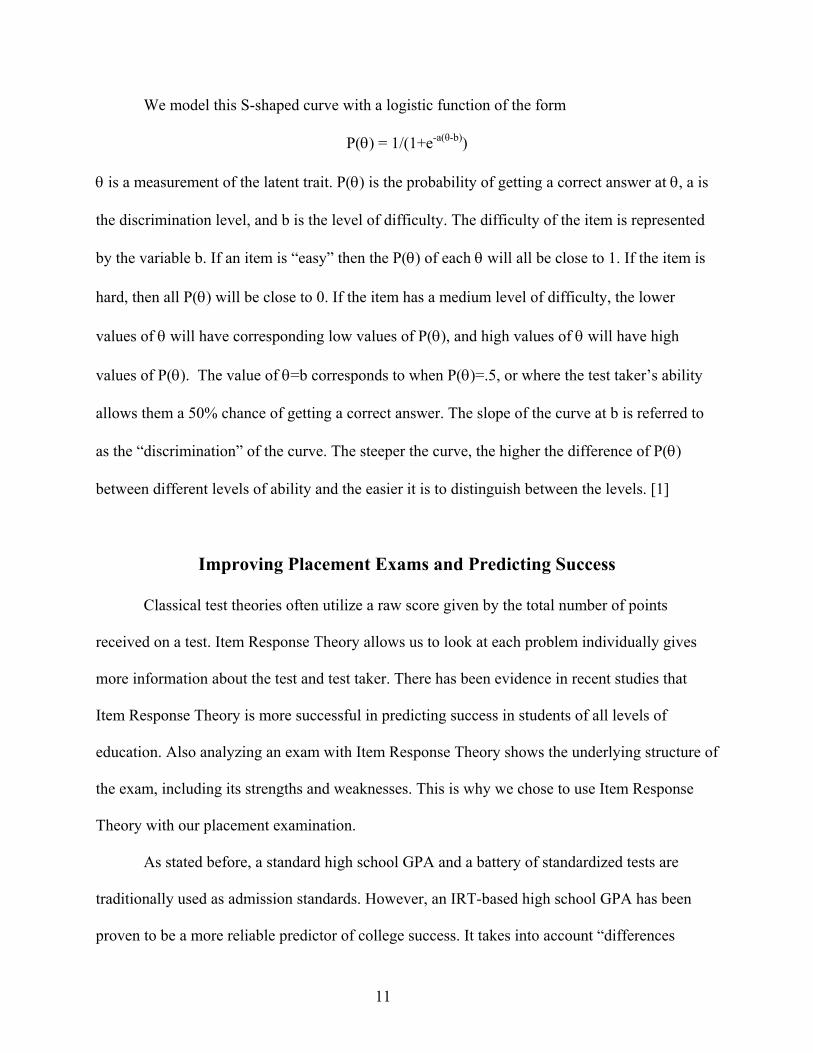
We model this S-shaped curve with a logistic function of the form
P(θ) = 1/(1+e-a(θ-b))
θ is a measurement of the latent trait. P(θ) is the probability of getting a correct answer at θ, a is
the discrimination level, and b is the level of difficulty. The difficulty of the item is represented
by the variable b. If an item is “easy” then the P(θ) of each θ will all be close to 1. If the item is
hard, then all P(θ) will be close to 0. If the item has a medium level of difficulty, the lower
values of θ will have corresponding low values of P(θ), and high values of θ will have high
values of P(θ). The value of θ=b corresponds to when P(θ)=.5, or where the test taker’s ability
allows them a 50% chance of getting a correct answer. The slope of the curve at b is referred to
as the “discrimination” of the curve. The steeper the curve, the higher the difference of P(θ)
between different levels of ability and the easier it is to distinguish between the levels. [1]
Improving Placement Exams and Predicting Success
Classical test theories often utilize a raw score given by the total number of points
received on a test. Item Response Theory allows us to look at each problem individually gives
more information about the test and test taker. There has been evidence in recent studies that
Item Response Theory is more successful in predicting success in students of all levels of
education. Also analyzing an exam with Item Response Theory shows the underlying structure of
the exam, including its strengths and weaknesses. This is why we chose to use Item Response
Theory with our placement examination.
As stated before, a standard high school GPA and a battery of standardized tests are
traditionally used as admission standards. However, an IRT-based high school GPA has been
proven to be a more reliable predictor of college success. It takes into account “differences
12
among courses both in the distribution of grades and the students enrolled” [10]. This method
examines each course separately and creates statistical adjustment for things like the impact of
course difficulty on GPA. The writers of the College Board Scholastic Aptitude Test (SAT)
utilizes this IRT-based GPA along with SAT scores in its studies to predict success among
college students [2].
A study using an IRT model to create the cut-off scales for a test taken by elementary
school students was successful in identifying which students were in need of more assistants and
which students mastered the material set forth by a state-mandated exam. [6]
A study looking to improve the reliability of test scores employed both Classical Test
Theory and Item Response Theory to evaluate how well a test evaluates a student’s academic
standing. The No Child Left Behind Act of 2001 (U. S. Department of Education, 2002) requires
statewide testing programs to report diagnostic information to examinees that allows
parents, teachers, and principals to understand and address the specific academic needs
of students [5]. Along with a raw point score, the report also contains subscores within each
academic area. The subscores were generated by grouping together items considered to be alike
using Item Response Theory. The study concludes that looking at the test as a whole and at items
individually helps create a clearer picture of the student’s academic ability [5]. This is a case in
which utilizing Item Response theory in addition to Classical Test Theory provides an advantage
in evaluation and prediction of success.
With an exam set into place, could improving the exam actually increase the amount of
information it provides? In a study to improve the validity of testing mandated by The No Child
Left Behind Act of 2001, instructors set out to create adjustments for disabled students that still
covers the same amount of material. Carefully inspecting each item and student response to each
13
question, they decided which questions were too hard, which created less of a struggle, and what
materials required modifications to assist disabled students with understanding. This analysis
employed Item Response Theory to enable the instructors to create a similar test with reduced
difficulty that was still fair and covered the required curriculum for general mathematics. [7]
This is a case in which adjusting an exam to fit its audience improved the amount of information
provided by the exam.
14
Chapter 2 - Analysis of the Placement Exam
In the spring of 2009, all entering students planning to take Calculus I or II were asked to
take an online placement exam covering algebra as well as calculus prior to enrollment in June.
Problems were randomly generated and each student receives a different exam with the same
types of problems but with different numbers.
The algebra exam was worth 50 points and consisted of 19 problems covering topics in
basic, intermediate, and college algebra. The Calculus placement exam consisted of 18 problems
divided into 4 sections. The first two sections consisted of topics in trigonometry. The third
section covered limits. The fourth section covered derivatives and integrals of functions.
The exam is graded after each section, and the student is given automatic feedback on
which ones were correct and incorrect. They are given one opportunity to edit and resubmit their
answers for grading before moving on to the new section. If the student was unsatisfied with
their score, they had the opportunity to try the exam again with different, newly generated
problems. 2792 students took the algebra exam and 528 took the Calculus exam. Because the
exams were available to anyone with a KSU eID and a WID, some people took the exams who
were not students, for example advisers and faculty members.
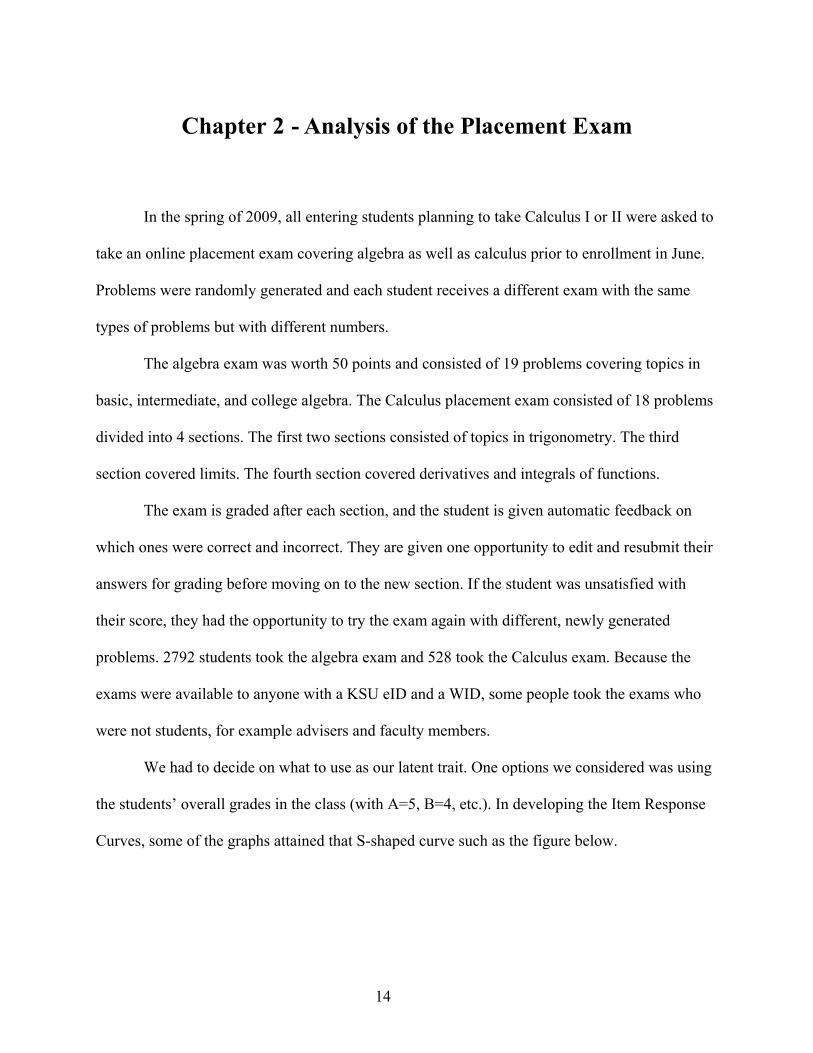
We had to decide on what to use as our latent trait. One options we considered was using
the students’ overall grades in the class (with A=5, B=4, etc.). In developing the Item Response
Curves, some of the graphs attained that S-shaped curve such as the figure below.
15
Figure 2.1 Item Response Curve of Section 3, Problem 3 (grade as latent trait)
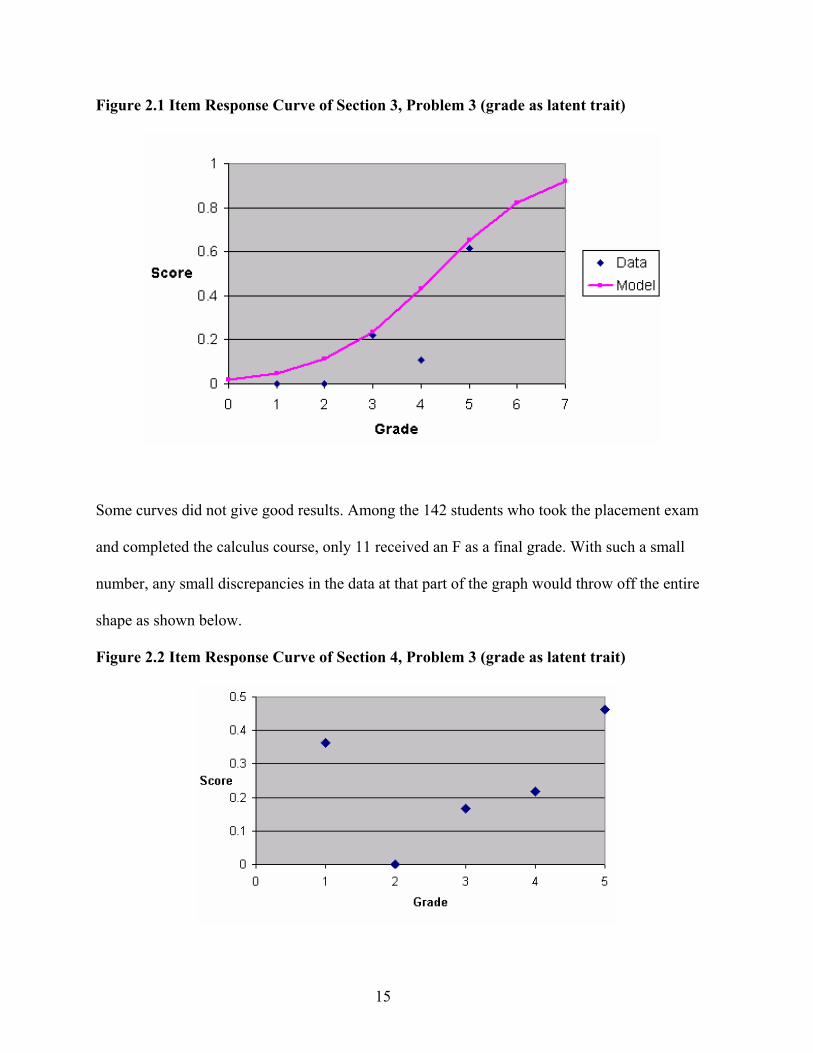
Some curves did not give good results. Among the 142 students who took the placement exam
and completed the calculus course, only 11 received an F as a final grade. With such a small
number, any small discrepancies in the data at that part of the graph would throw off the entire
shape as shown below.
Figure 2.2 Item Response Curve of Section 4, Problem 3 (grade as latent trait)
16
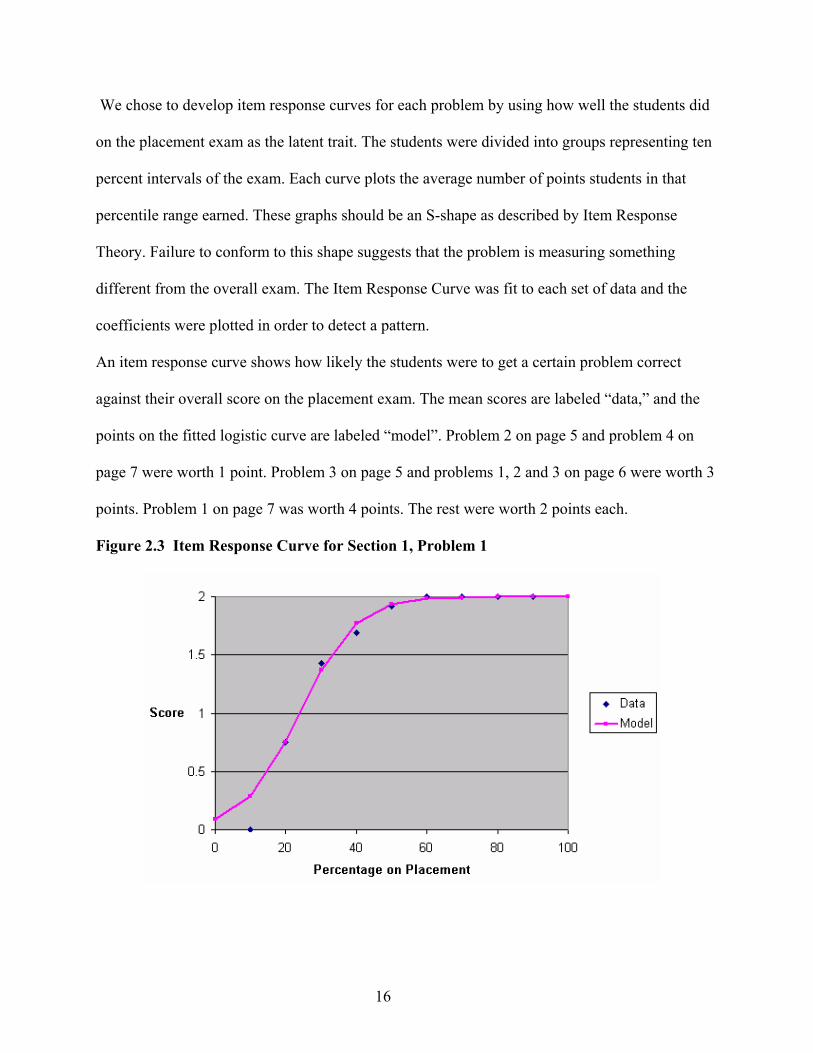
We chose to develop item response curves for each problem by using how well the students did
on the placement exam as the latent trait. The students were divided into groups representing ten
percent intervals of the exam. Each curve plots the average number of points students in that
percentile range earned. These graphs should be an S-shape as described by Item Response
Theory. Failure to conform to this shape suggests that the problem is measuring something
different from the overall exam. The Item Response Curve was fit to each set of data and the
coefficients were plotted in order to detect a pattern.
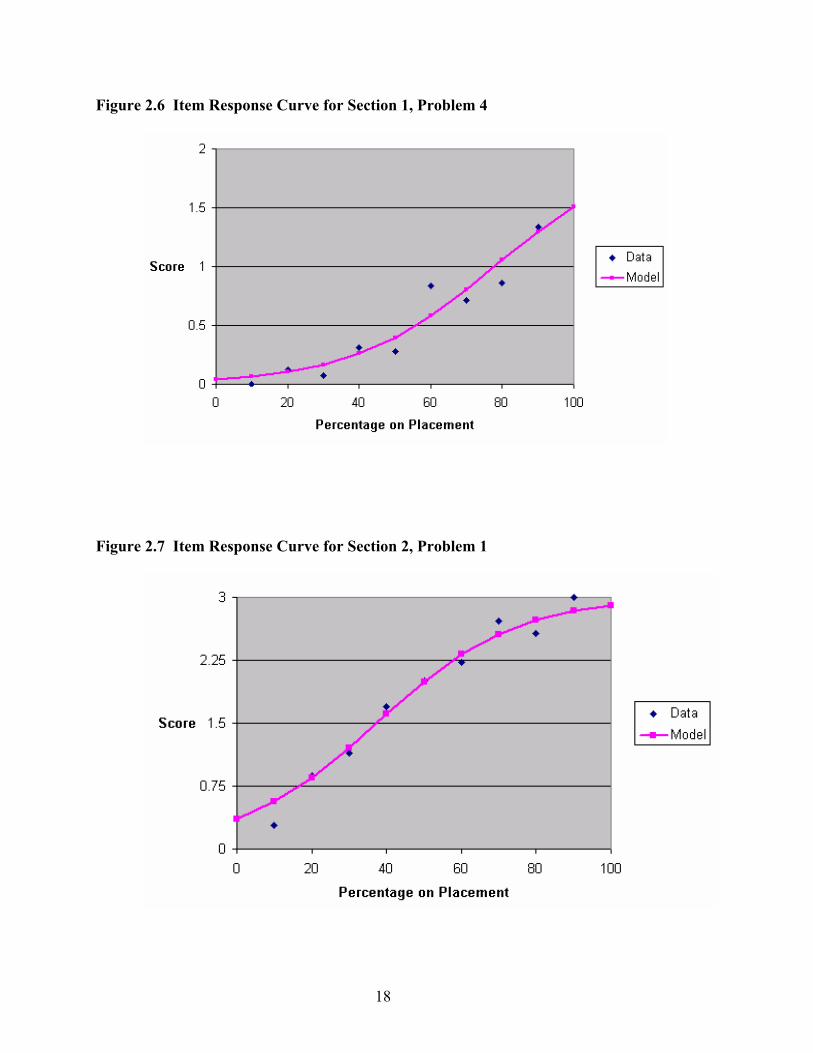
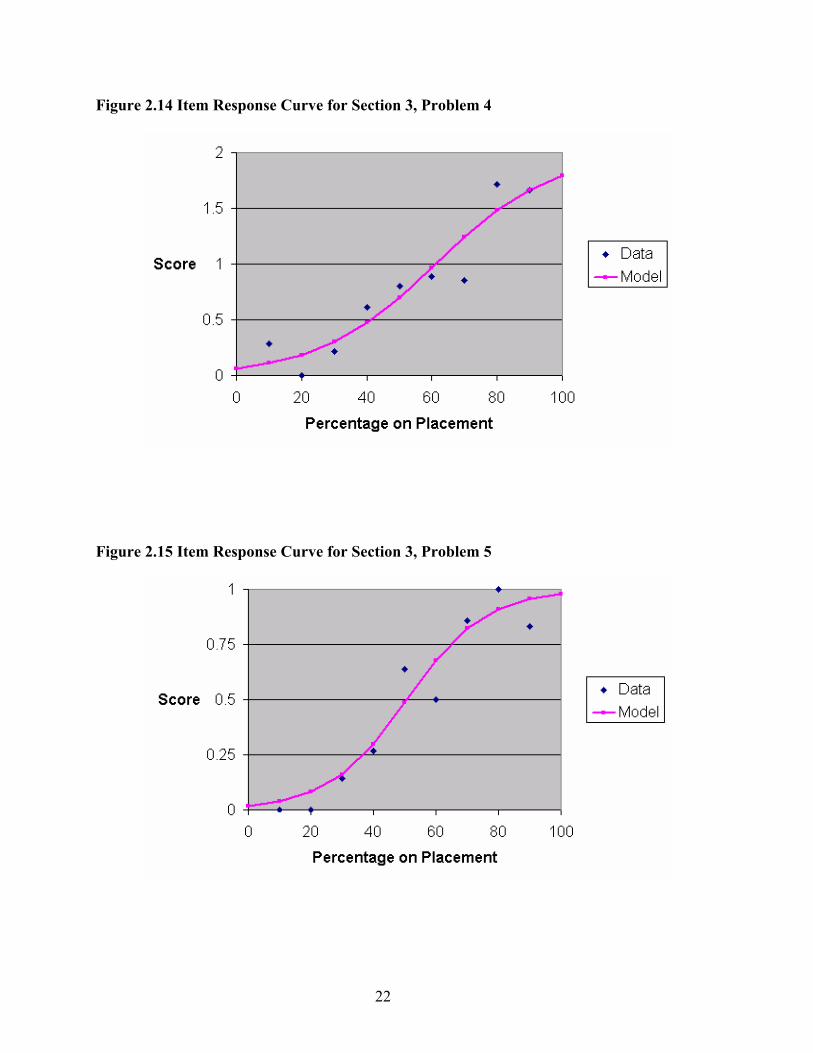
An item response curve shows how likely the students were to get a certain problem correct
against their overall score on the placement exam. The mean scores are labeled “data,” and the
points on the fitted logistic curve are labeled “model”. Problem 2 on page 5 and problem 4 on
page 7 were worth 1 point. Problem 3 on page 5 and problems 1, 2 and 3 on page 6 were worth 3
points. Problem 1 on page 7 was worth 4 points. The rest were worth 2 points each.
Figure 2.3 Item Response Curve for Section 1, Problem 1
17
Section 1, Problem 1 was considered “easy” because students in the top 75% of the class had a
50-50 chance of getting this answer correct. This curve also has a steep slope and therefore a
higher degree of discrimination. A summary of difficulties and discrimination are in Table 2.1.
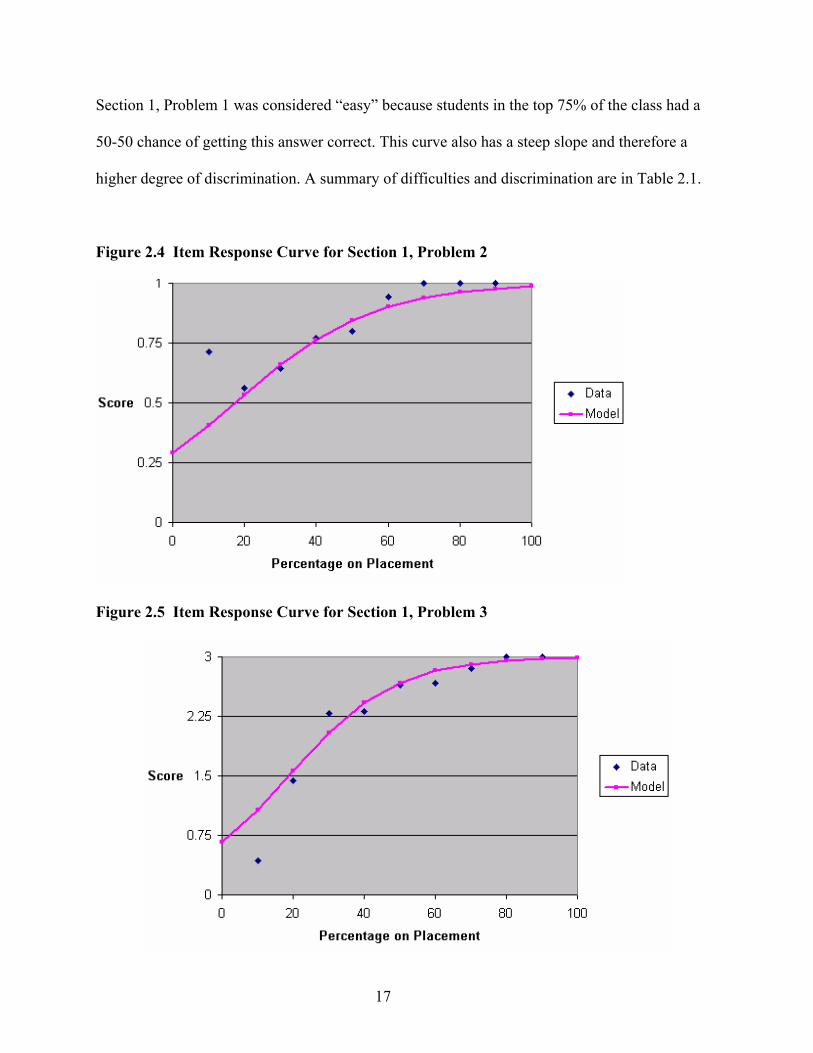
Figure 2.4 Item Response Curve for Section 1, Problem 2
Figure 2.5 Item Response Curve for Section 1, Problem 3
18
Figure 2.6 Item Response Curve for Section 1, Problem 4
Figure 2.7 Item Response Curve for Section 2, Problem 1
19
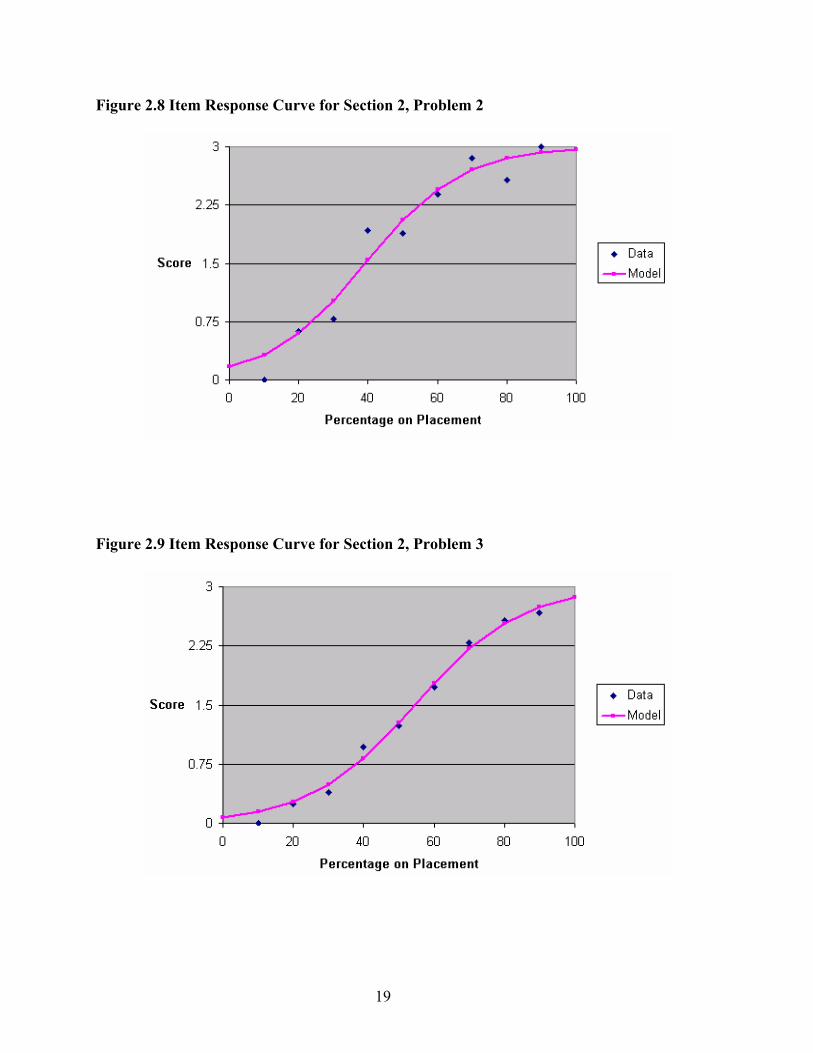
Figure 2.8 Item Response Curve for Section 2, Problem 2
Figure 2.9 Item Response Curve for Section 2, Problem 3
20
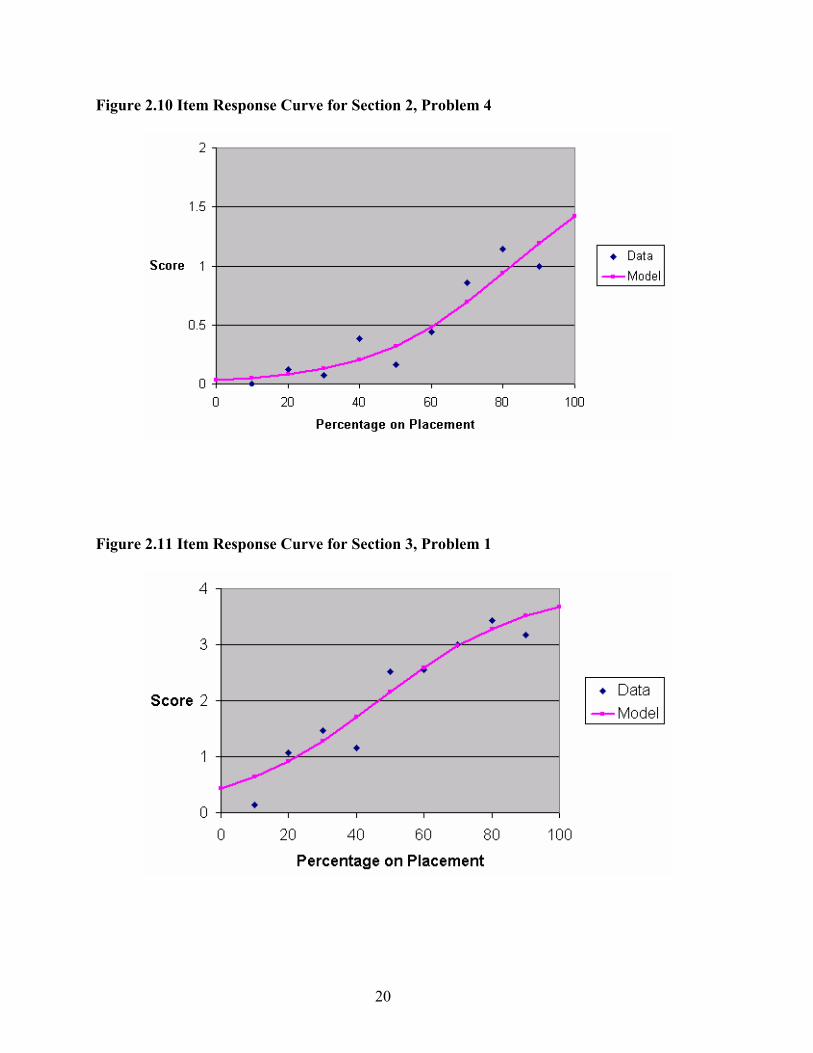
Figure 2.10 Item Response Curve for Section 2, Problem 4
Figure 2.11 Item Response Curve for Section 3, Problem 1
21
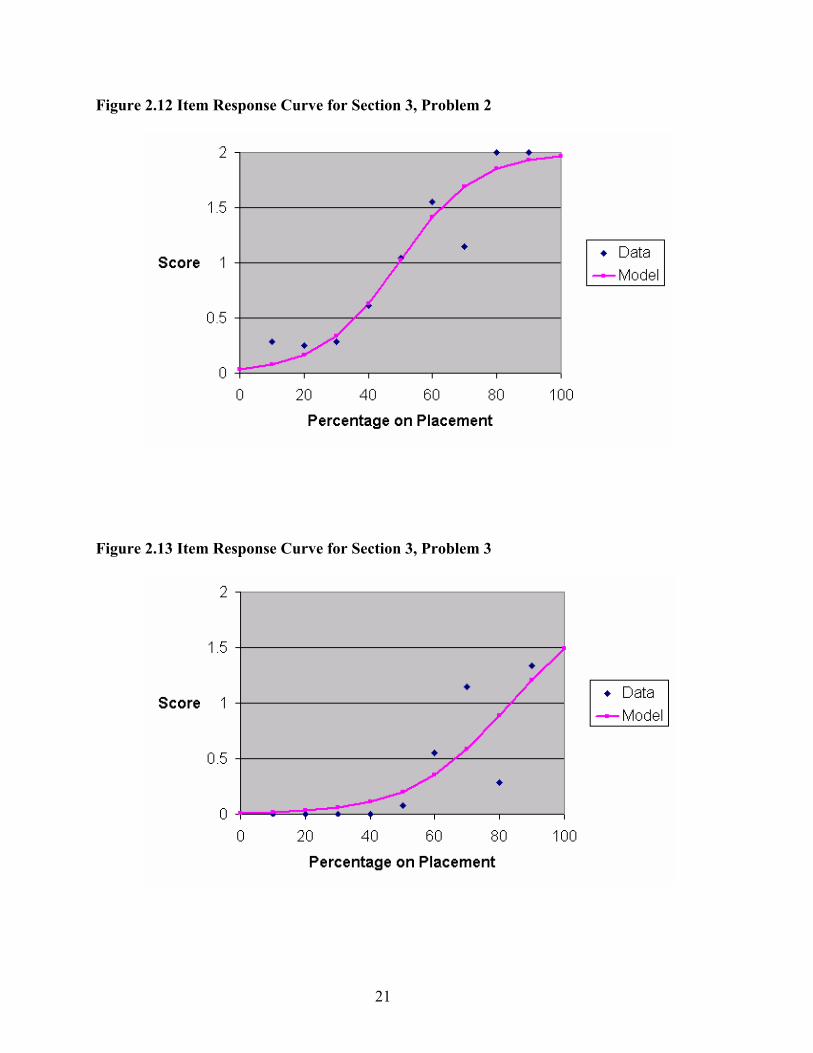
Figure 2.12 Item Response Curve for Section 3, Problem 2
Figure 2.13 Item Response Curve for Section 3, Problem 3
22
Figure 2.14 Item Response Curve for Section 3, Problem 4
Figure 2.15 Item Response Curve for Section 3, Problem 5
23
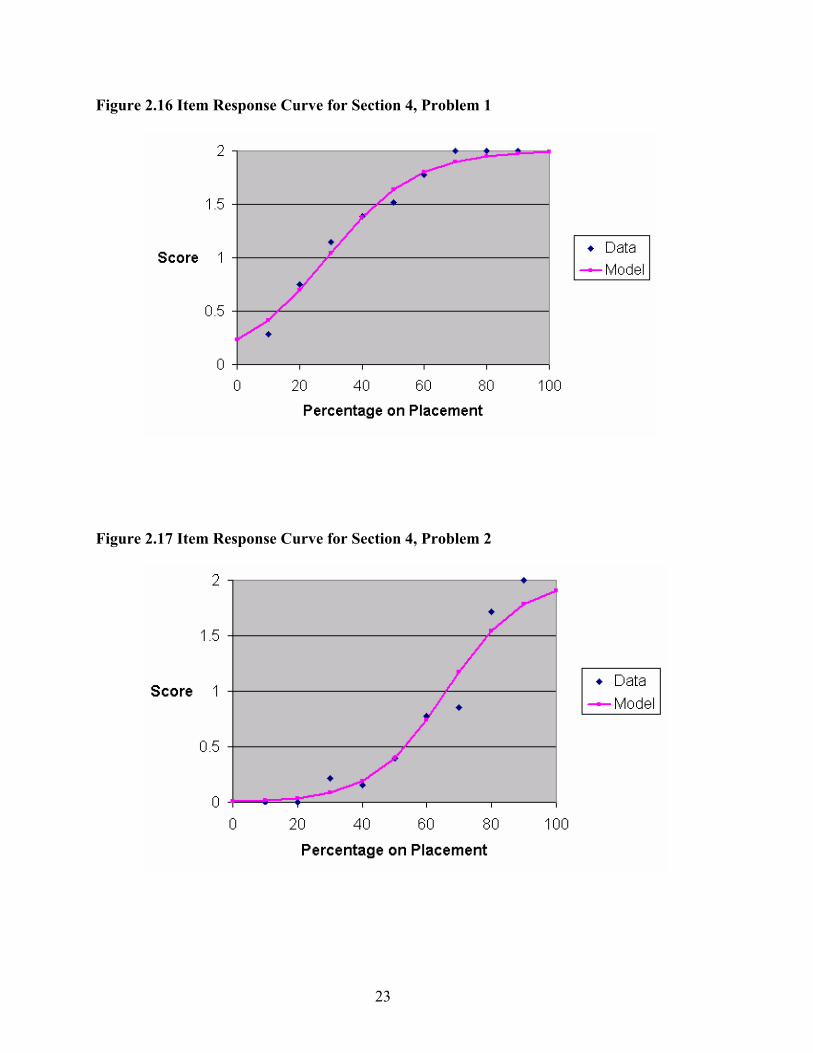
Figure 2.16 Item Response Curve for Section 4, Problem 1
Figure 2.17 Item Response Curve for Section 4, Problem 2
24
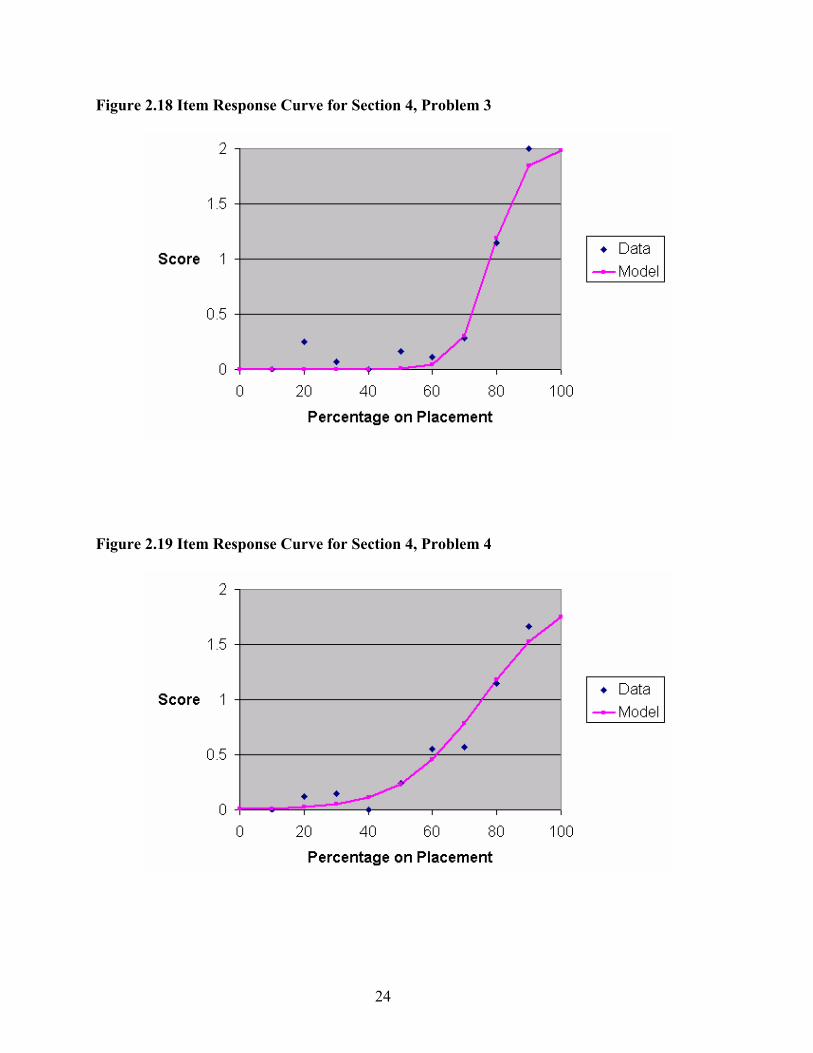
Figure 2.18 Item Response Curve for Section 4, Problem 3
Figure 2.19 Item Response Curve for Section 4, Problem 4
25
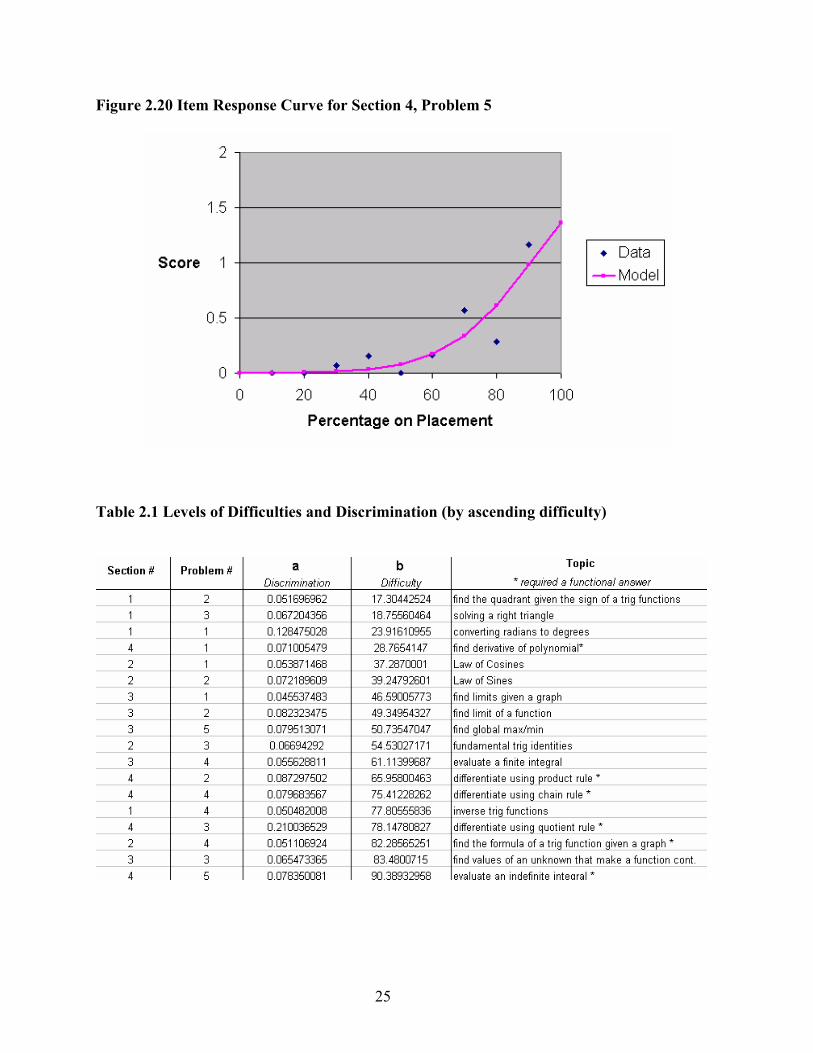
Figure 2.20 Item Response Curve for Section 4, Problem 5
Table 2.1 Levels of Difficulties and Discrimination (by ascending difficulty)
26
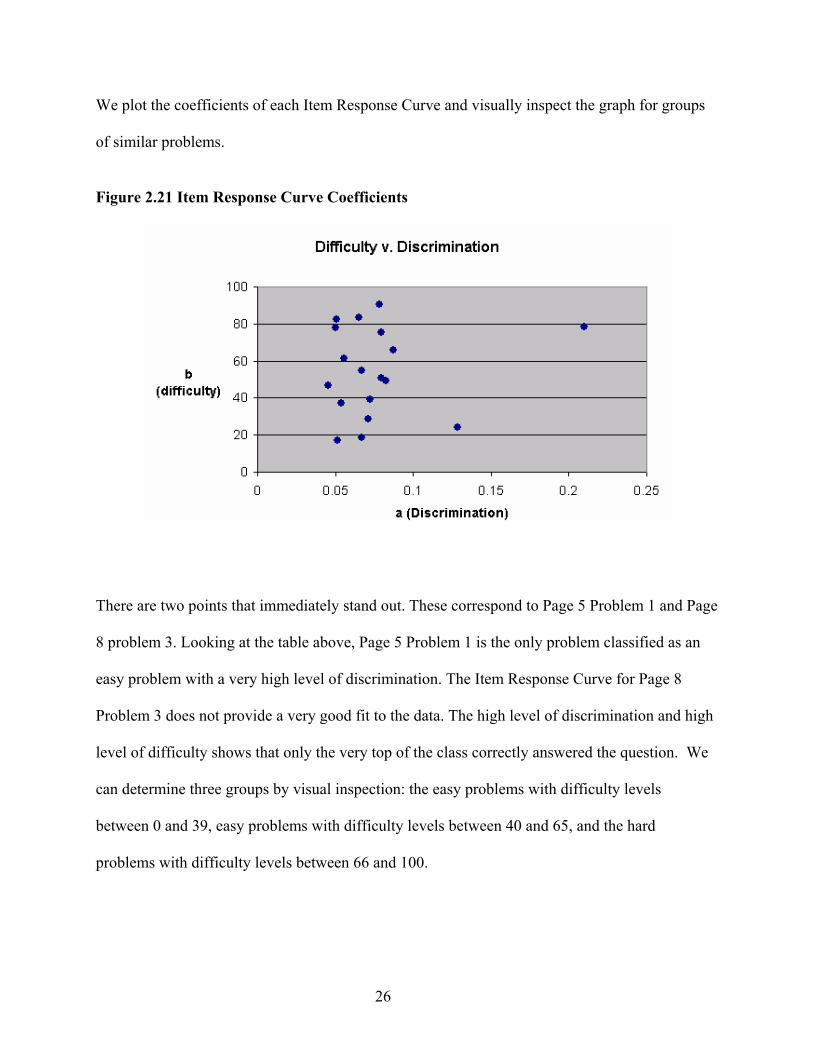
We plot the coefficients of each Item Response Curve and visually inspect the graph for groups
of similar problems.
Figure 2.21 Item Response Curve Coefficients
There are two points that immediately stand out. These correspond to Page 5 Problem 1 and Page
8 problem 3. Looking at the table above, Page 5 Problem 1 is the only problem classified as an
easy problem with a very high level of discrimination. The Item Response Curve for Page 8
Problem 3 does not provide a very good fit to the data. The high level of discrimination and high
level of difficulty shows that only the very top of the class correctly answered the question. We
can determine three groups by visual inspection: the easy problems with difficulty levels
between 0 and 39, easy problems with difficulty levels between 40 and 65, and the hard
problems with difficulty levels between 66 and 100.
27
Chapter 3 - Results
Comparison with success in Calculus
To evaluate the effectiveness of the placement exam, we compare the total placement scores to
the performance of the students in the Calculus course. The performance of the students was
based upon three semester exams, a final exam, final grade, and final point total in the course.
Student performance was analyzed against their score on the final exam. Because ACT is
historically used for placement, we also included this information.
actm is the math score on the ACT.
actc is the composite score on the ACT.
final is the student’s point total on the final.
Atotal is the student’s point total on the algebra portion of the placement exam.
Cptotal is the student’s point total on the calculus placement exam.
PageX is the score on the placement exam on all of page X.
easy is the student’s score on what were considered easy problems as defined on the
previous page.
med is the student’s score on what were considered medium problems as defined on the
previous page.
hard is the student’s score on what were considered hard problems as defined on the
previous page.
Each student taking the Calculus placement exam was also required to take the College
Algebra exam. Pages 1 through 4 of the placement exam were the College Algebra portion.
Pages 5 through 8 correspond to Sections 1 through 4 respectively on the Calculus Placement
exam. Linear regression models for different measures of student performance (exam scores,
28
overall class grade, etc.) as a function of the data above were run to find correlation between
student performance and the placement exam.
If we use more variables, the model will be a better fit. However, there is a question of
whether it is actually modeling the data or trying to just fitting the noise created by the data.
More variables do not always mean more information. We proceed by grouping certain problems
together by specific properties (difficulty level, page number, subject, etc.)
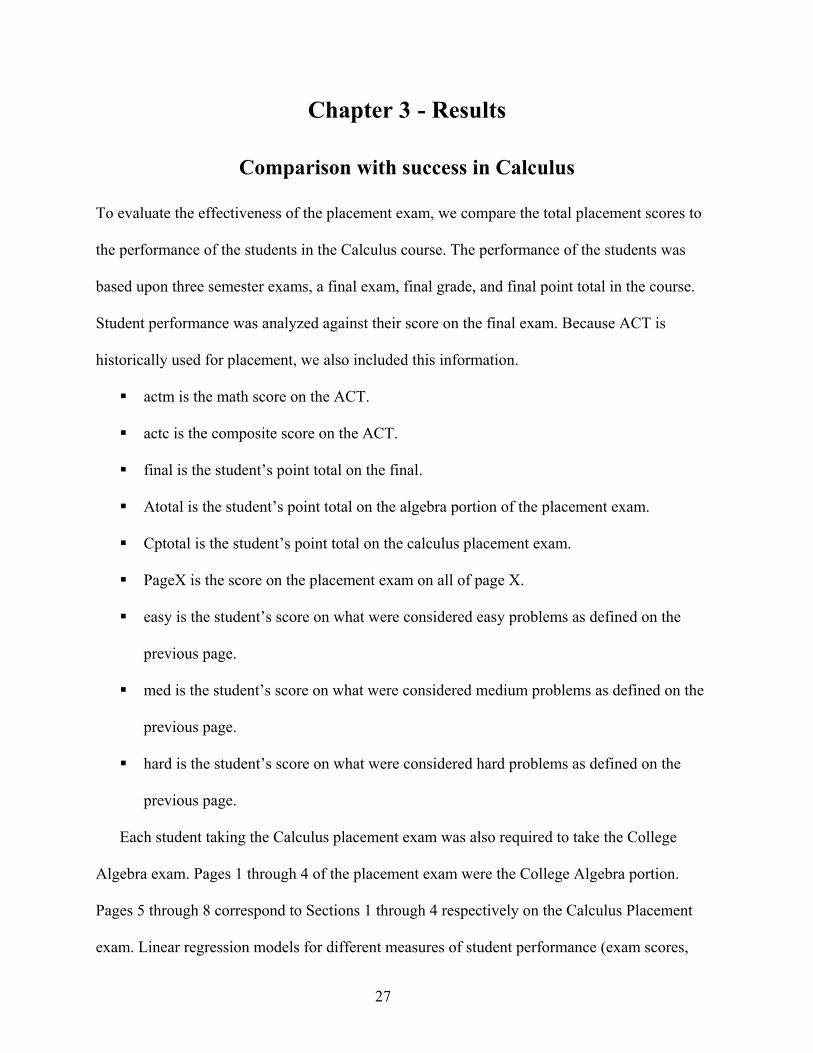
When separating the College Algebra placement exam by subject matter, it was successful in
predicting initial student success in the first exam (Ostapyuk, 2009). We decided to see if this
was also true with the Calculus students. We ran a linear regression of the student’s score on the
first exam given in the Calculus course as a function of the students’ scores on the Algebra
Placement Exam, Calculus Placement Exam, and their score on the Mathematics portion on the
ACT. The Analysis of Variance (ANOVA) output is given below:
A linear regression model with the first exam as a function of the ACT math score and Calculus
Placement exam only account for 26% of the variation. This is not significant enough to draw
any conclusions. Similar conclusions were drawn when comparing ACT data and Calculus
29
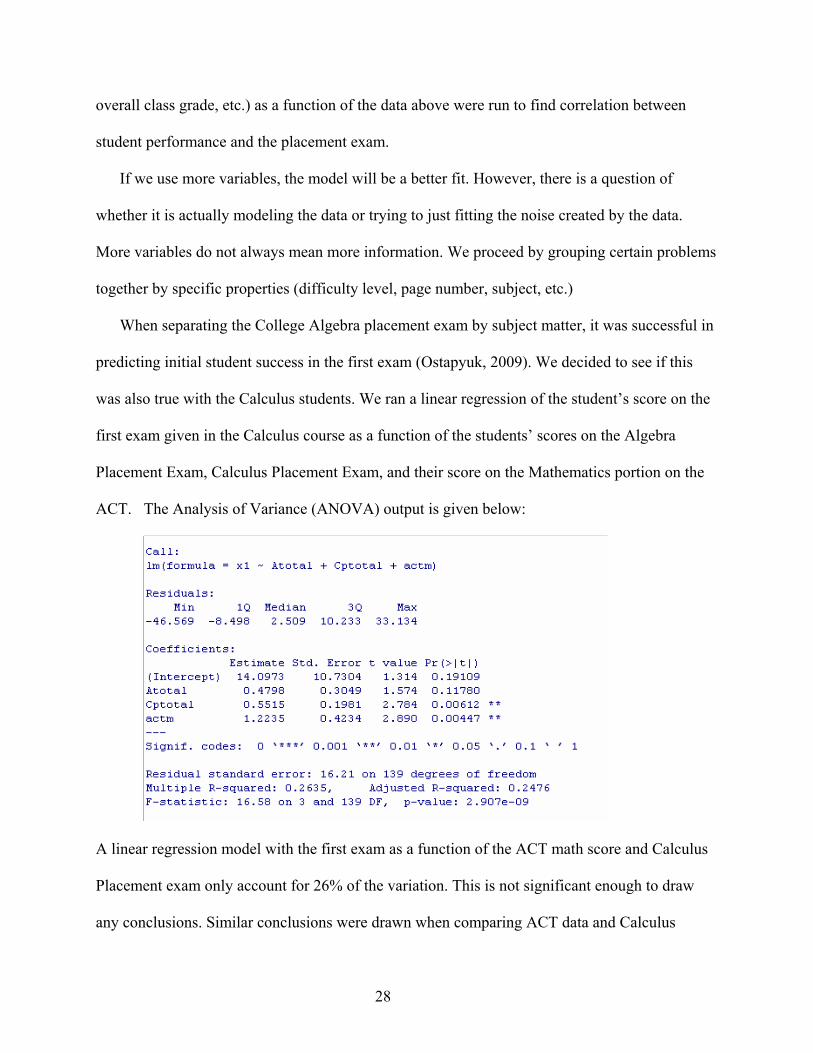
Placement scores with exams 2 and 3. Notice that Atotal is not statistically significant in the
linear regression model. We remove Atotal and run the regression again, this time separating the
Calculus Placement exam into its Trigonometry (Pages 5 and 6) and Calculus (Pages 7 and 8)
components. This time we compare it to the total number of points the student earned in the
class. The ANOVA output is given below:
Only 33.66% of the variation in the data is explained by this model, and the ACT math score is
more significant than the rest of the data. We try a few other options.
Based on the analysis of the exam in Chapter 2, the problems were grouped together
based on difficulty level. We ran a linear regression model of combinations of exams, final
scores and final grades as a function of the ACT math score and the Calculus Placement exam
separated by difficulty level of the problems. We find that no matter what we run the regression
against, splitting the placement exam by problem difficulty adds almost no extra information.
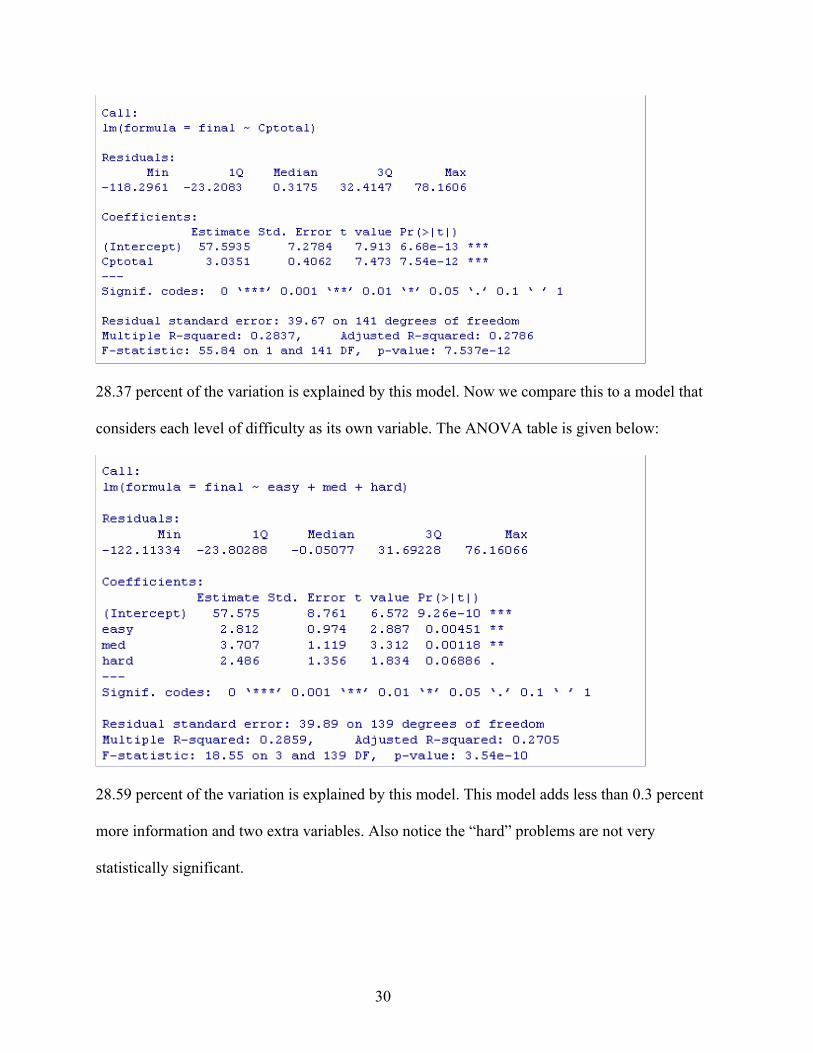
We received the best results with the final exam score as a function of the Calculus Placement
Exam. The ANOVA table for a linear model of final exam grade as a function of the total
Calculus Placement Exam score is given below:
30
28.37 percent of the variation is explained by this model. Now we compare this to a model that
considers each level of difficulty as its own variable. The ANOVA table is given below:
28.59 percent of the variation is explained by this model. This model adds less than 0.3 percent
more information and two extra variables. Also notice the “hard” problems are not very
statistically significant.
31
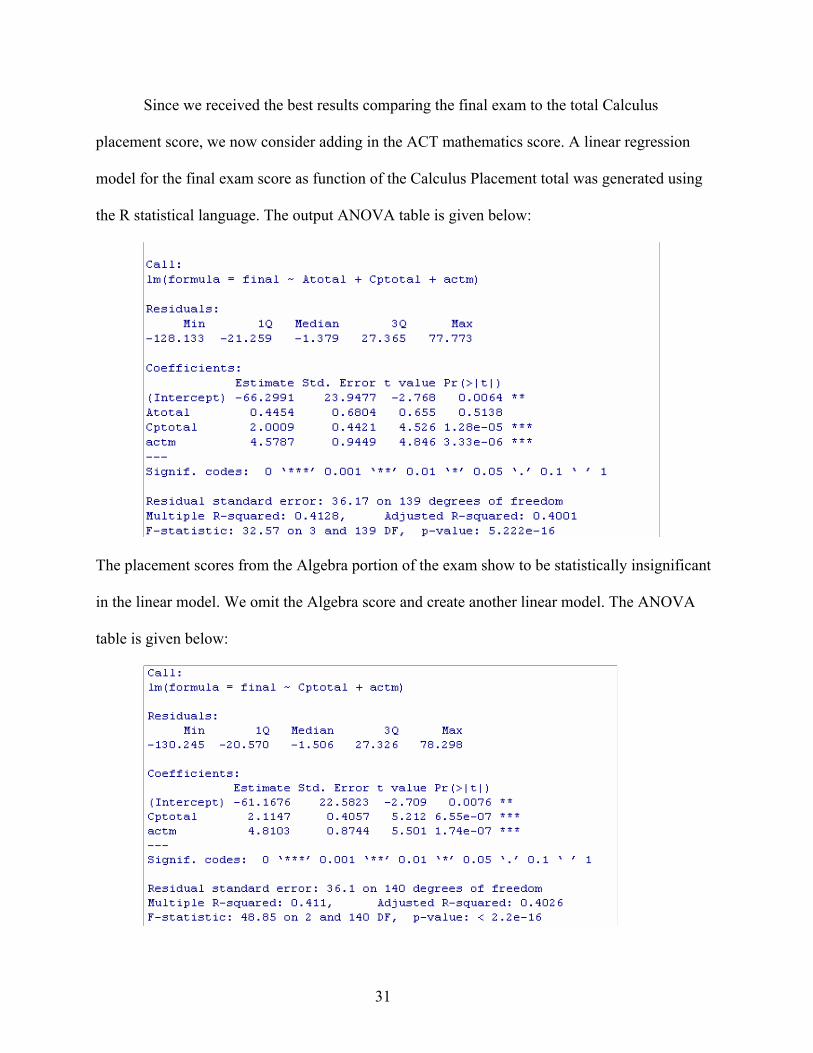
Since we received the best results comparing the final exam to the total Calculus
placement score, we now consider adding in the ACT mathematics score. A linear regression
model for the final exam score as function of the Calculus Placement total was generated using
the R statistical language. The output ANOVA table is given below:
The placement scores from the Algebra portion of the exam show to be statistically insignificant
in the linear model. We omit the Algebra score and create another linear model. The ANOVA
table is given below:
32
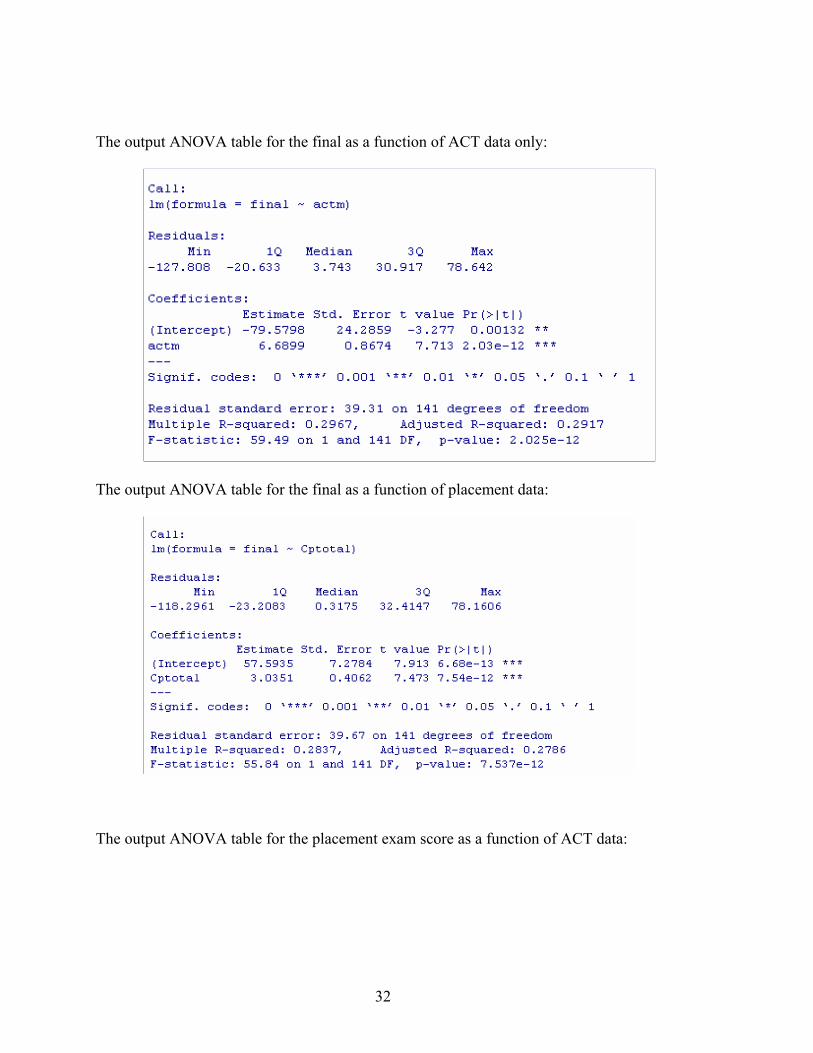
The output ANOVA table for the final as a function of ACT data only:
The output ANOVA table for the final as a function of placement data:
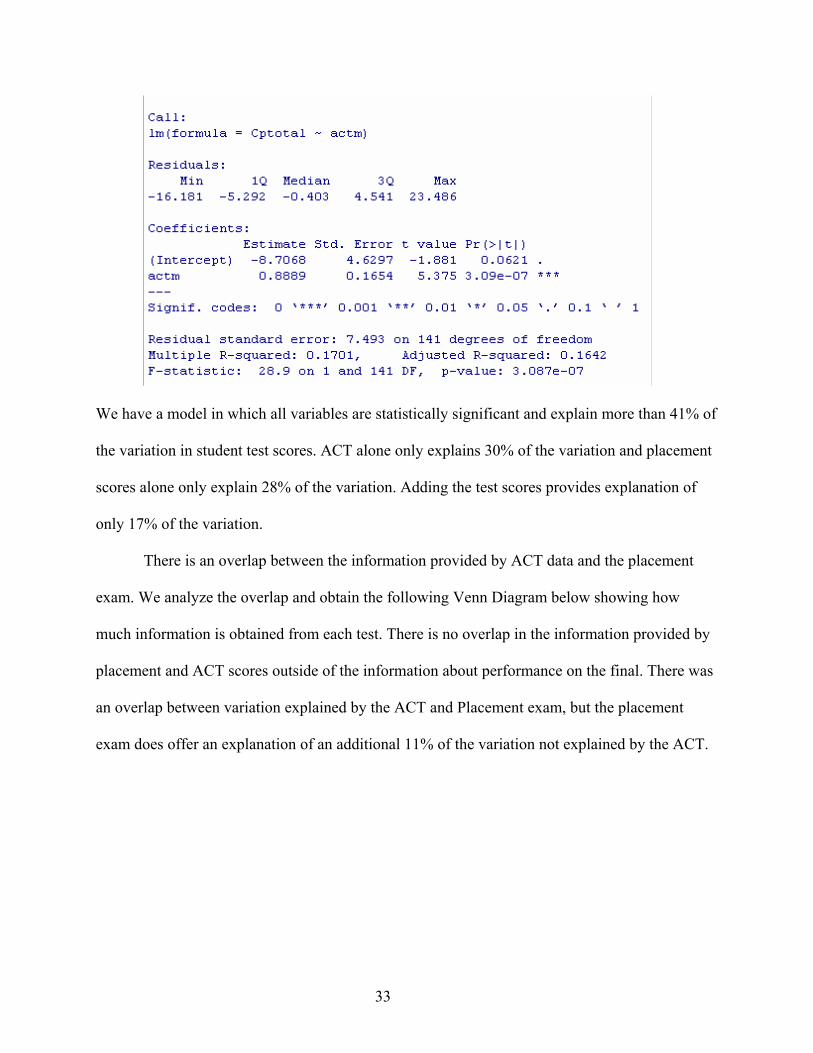
The output ANOVA table for the placement exam score as a function of ACT data:
33
We have a model in which all variables are statistically significant and explain more than 41% of
the variation in student test scores. ACT alone only explains 30% of the variation and placement
scores alone only explain 28% of the variation. Adding the test scores provides explanation of
only 17% of the variation.
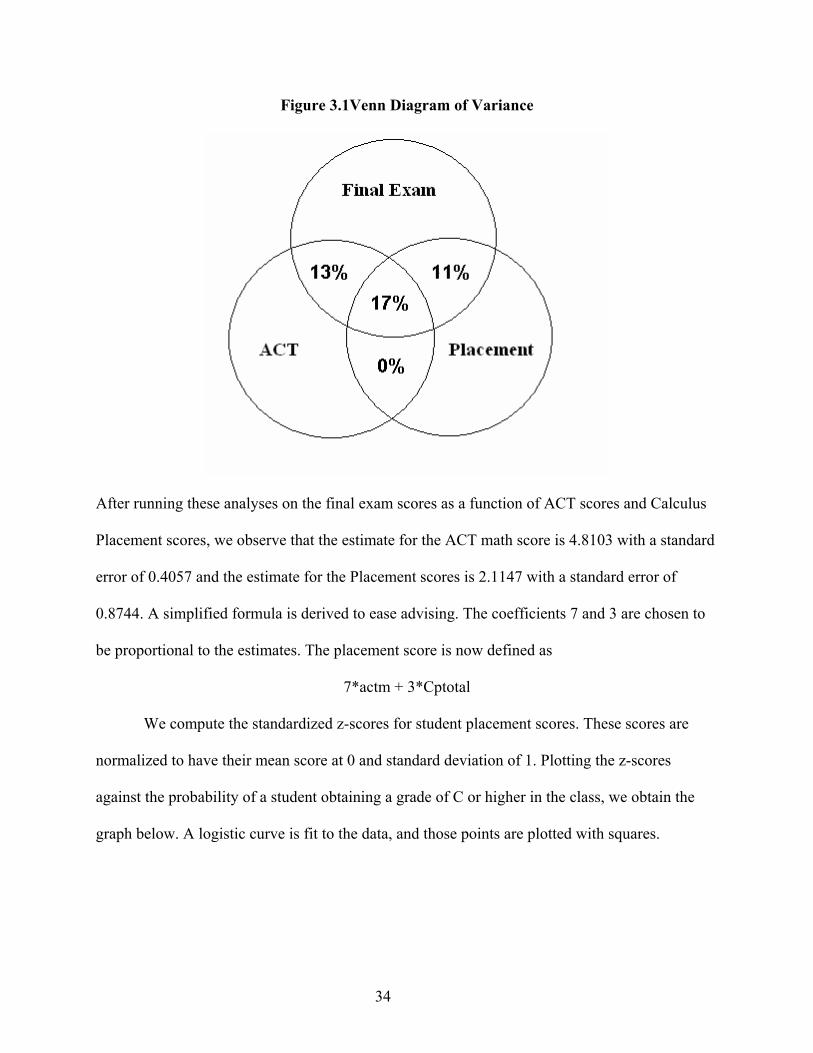
There is an overlap between the information provided by ACT data and the placement
exam. We analyze the overlap and obtain the following Venn Diagram below showing how
much information is obtained from each test. There is no overlap in the information provided by
placement and ACT scores outside of the information about performance on the final. There was
an overlap between variation explained by the ACT and Placement exam, but the placement
exam does offer an explanation of an additional 11% of the variation not explained by the ACT.
34
Figure 3.1Venn Diagram of Variance
After running these analyses on the final exam scores as a function of ACT scores and Calculus
Placement scores, we observe that the estimate for the ACT math score is 4.8103 with a standard
error of 0.4057 and the estimate for the Placement scores is 2.1147 with a standard error of
0.8744. A simplified formula is derived to ease advising. The coefficients 7 and 3 are chosen to
be proportional to the estimates. The placement score is now defined as
7*actm + 3*Cptotal
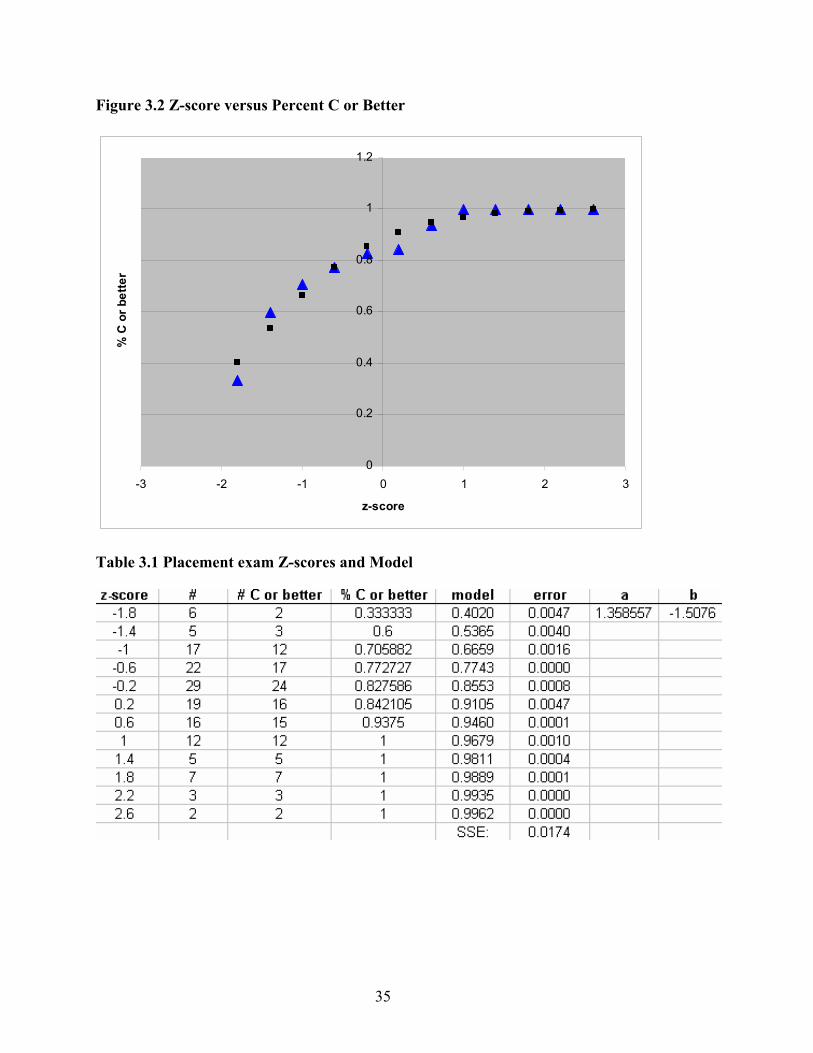
We compute the standardized z-scores for student placement scores. These scores are
normalized to have their mean score at 0 and standard deviation of 1. Plotting the z-scores
against the probability of a student obtaining a grade of C or higher in the class, we obtain the
graph below. A logistic curve is fit to the data, and those points are plotted with squares.
35
Figure 3.2 Z-score versus Percent C or Better
0
0.2
0.4
0.6
0.8
1
1.2
-3 -2 -1 0 1 2 3
z-score
% C
or b
ette
r
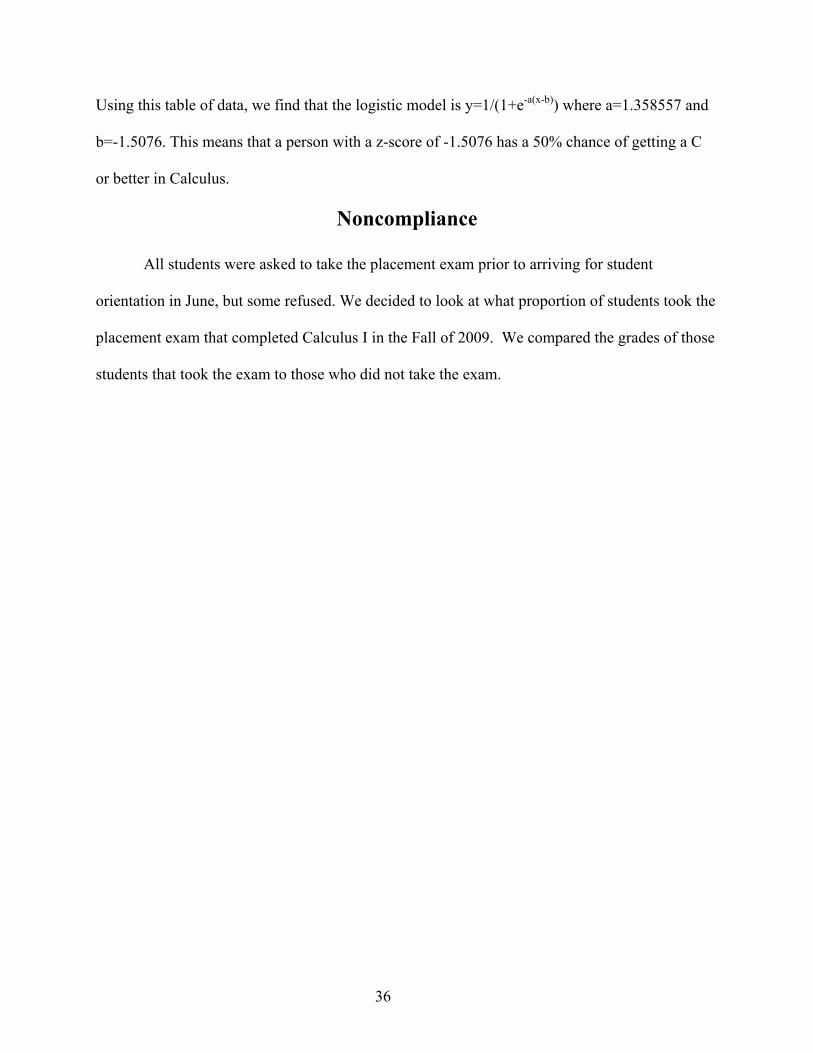
Table 3.1 Placement exam Z-scores and Model
36
Using this table of data, we find that the logistic model is y=1/(1+e-a(x-b)) where a=1.358557 and
b=-1.5076. This means that a person with a z-score of -1.5076 has a 50% chance of getting a C
or better in Calculus.
Noncompliance
All students were asked to take the placement exam prior to arriving for student
orientation in June, but some refused. We decided to look at what proportion of students took the
placement exam that completed Calculus I in the Fall of 2009. We compared the grades of those
students that took the exam to those who did not take the exam.
37
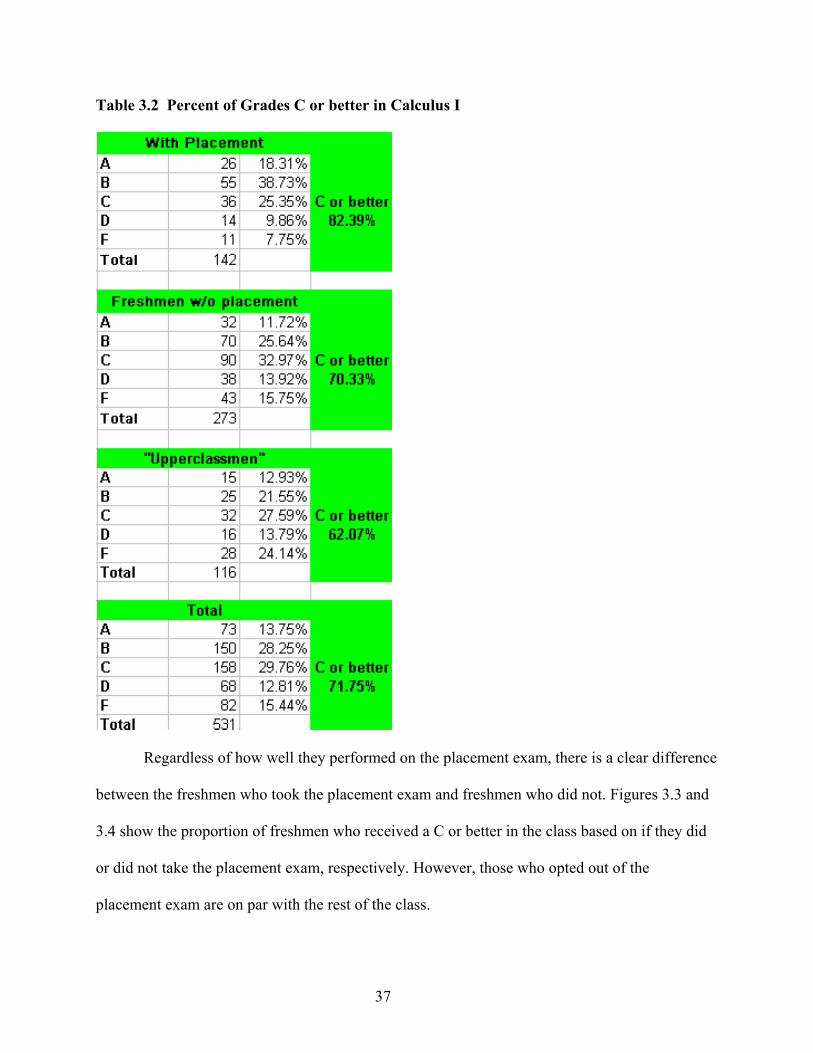
Table 3.2 Percent of Grades C or better in Calculus I
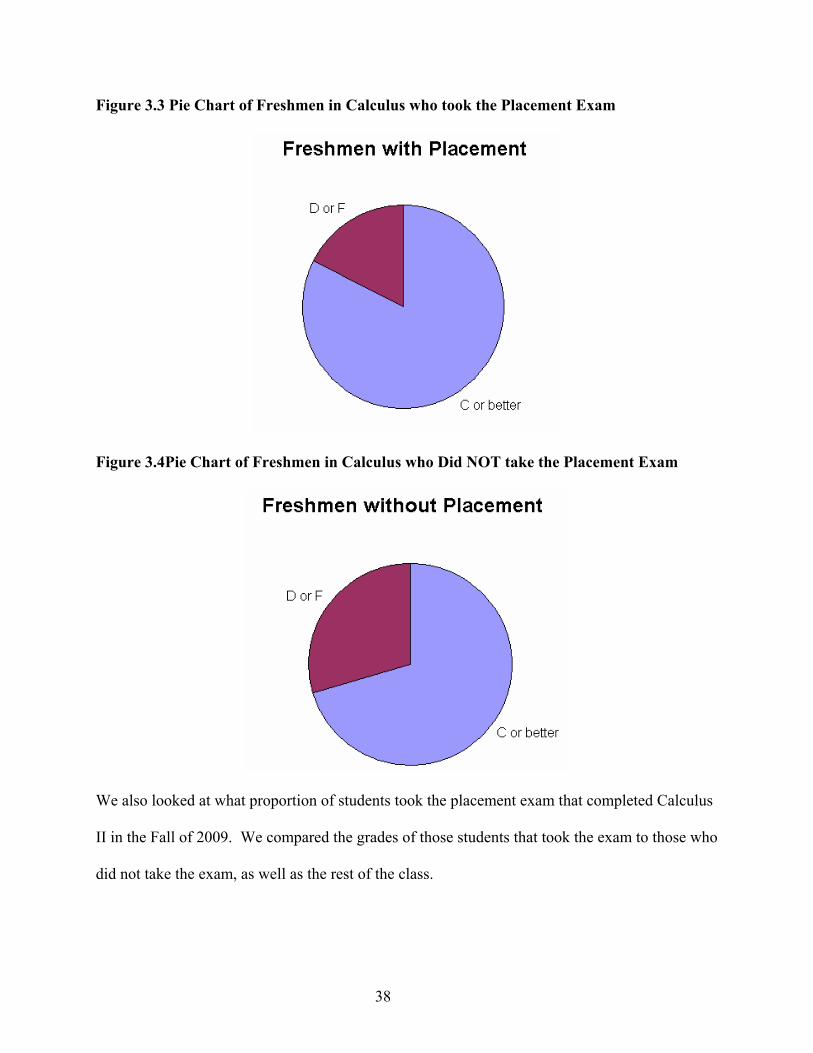
Regardless of how well they performed on the placement exam, there is a clear difference
between the freshmen who took the placement exam and freshmen who did not. Figures 3.3 and
3.4 show the proportion of freshmen who received a C or better in the class based on if they did
or did not take the placement exam, respectively. However, those who opted out of the
placement exam are on par with the rest of the class.
38
Figure 3.3 Pie Chart of Freshmen in Calculus who took the Placement Exam
Figure 3.4Pie Chart of Freshmen in Calculus who Did NOT take the Placement Exam
We also looked at what proportion of students took the placement exam that completed Calculus
II in the Fall of 2009. We compared the grades of those students that took the exam to those who
did not take the exam, as well as the rest of the class.
39
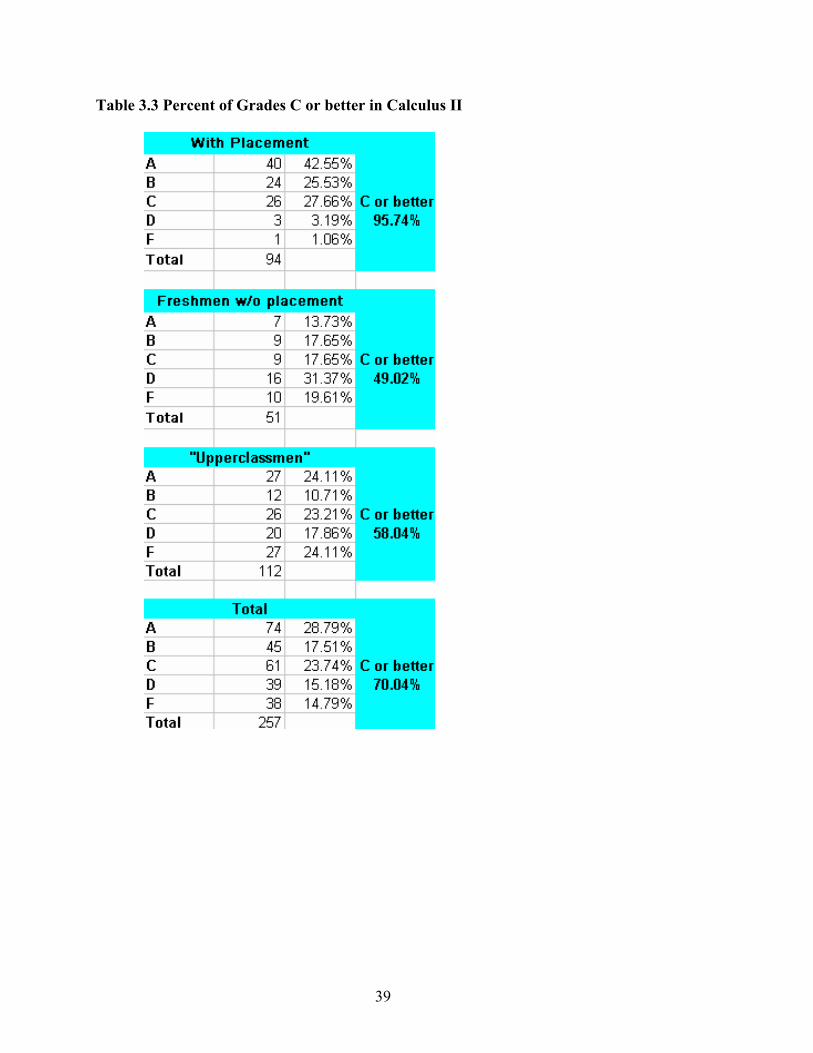
Table 3.3 Percent of Grades C or better in Calculus II
40
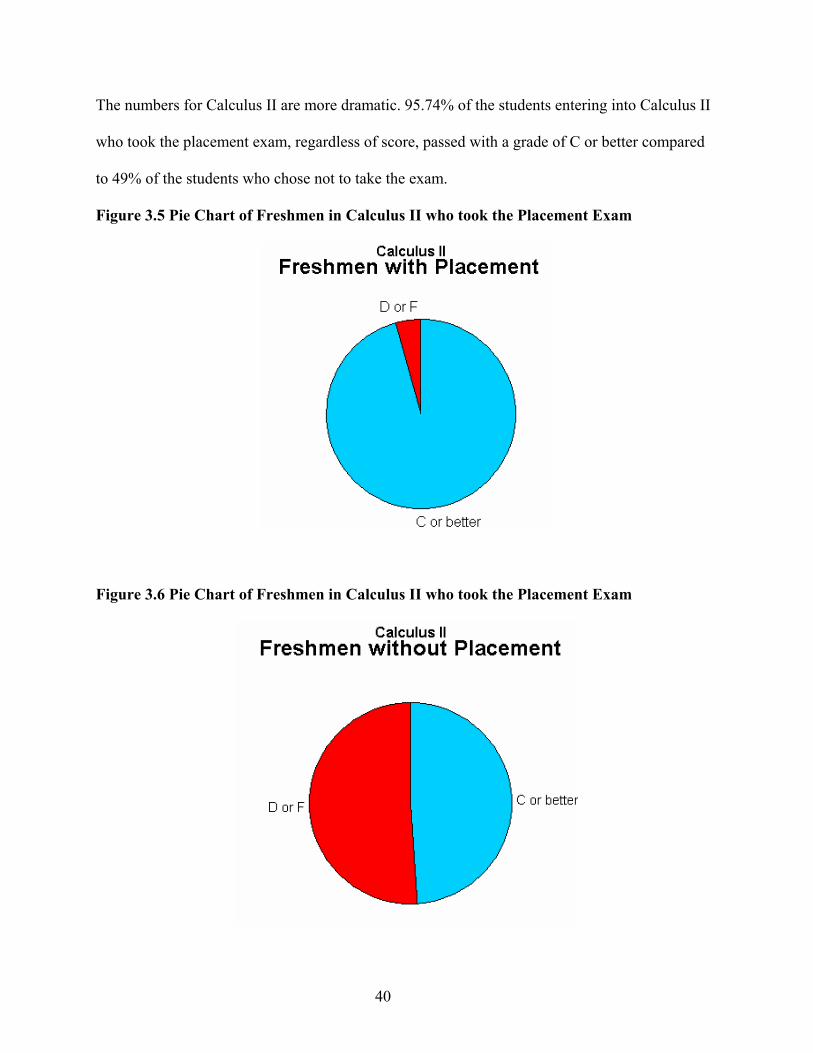
The numbers for Calculus II are more dramatic. 95.74% of the students entering into Calculus II
who took the placement exam, regardless of score, passed with a grade of C or better compared
to 49% of the students who chose not to take the exam.
Figure 3.5 Pie Chart of Freshmen in Calculus II who took the Placement Exam
Figure 3.6 Pie Chart of Freshmen in Calculus II who took the Placement Exam
41
Chapter 4 - Conclusions
We asked whether or not administering a placement exam would increase the ability to
place students in the correct mathematical course that matched their level of preparedness. Based
upon our analysis of the administered test, we conclude that a placement exam does provide
additional information that would aide advisors in helping a student decide what math course
they should take. We were able to provide 11% more information that the ACT alone did not
provide.
We may conclude that the exam does a fairly decent job in predicting chances of success
in Calculus I students. Looking at table 3.2, there is a higher percentage of students who succeed
that take the placement exam. However, the students who do not take the exam are on par with
the rest of the class. This is a different story for Calculus II freshmen. The data for Calculus II
students shows a clear self-selection bias. Many of the students who chose not to take the
placement exam had skill deficiencies that would probably have been indicated by a placement
exam. Because of the level of noncompliance among these students, we did not have enough data
to determine whether or not the placement exam would accomplish the goal of placing students
into Calculus II over Calculus I.
We now have to determine how these scores will be used to advise students.
Because only 41% of the overall variation could be explained by ACT data and placement exam
scores, the cutoff scores should be for advising purposes only and placement of students into
classes should not be solely based on placement exam scores. Other factors such as previous high
school experience, GPA, and AP credit should be taken into account.
Using item response theory to analyze a test, we want to see an exam that has
item response curves of varying difficulties and levels of discrimination. The test that was
42
administered does for the most part meet this goal. With exception of the two outliers, all the
problems on the exam varied in difficulty from easy to hard and with low to high levels of
discrimination. I do not think the two outliers are unreasonable problems. Page 5 Problem 1 asks
the student to convert radians to degrees. This is a necessary skill required of every Calculus
student. With a low level of difficulty and a high level of discrimination, we conclude that
students either knew exactly how to perform the operation or they had no idea. Nearly 80% of
students had a 50-50 chance of getting it correct. Problem 3 on page 8 of the exam covers the
quotient rule. Though many students have been exposed to calculus before taking this exam,
some have not. The Quotient Rule is a skill covered during the Calculus I course at Kansas State
University. This might be a good question for discerning the difference between students ready
for Calculus I versus Calculus II. But again, we do not have enough data to analyze the validity
and usefulness of this problem due to the self-selection and noncompliance.
Recommendations for the Future
The exam is by no means perfected. The test could be improved by changing a
few of the problems. The test does a great job in covering problems of different levels of
difficulty. What is missing from the exam are problems with high levels of discrimination. Other
than the two outliers, all of the problems have relatively equal levels of discrimination ranging
from 0.05 to 0.08. The outliers have levels of .12 and .21. A bank of possible problems should be
developed and tested to determine the levels of difficulty and discrimination.
As evidenced by the self-selection of the Calculus II students, this exam should be in
place as a mandatory requirement for new freshmen. As stated before, the exam results should be
43
considered for advising purposes only, but we believe that it will catch some students that are not
prepared for a Calculus II course and help correctly place them in Calculus I.
We believe the addition of new problems will increase the reliability of the predictions of
these exams. Hopefully it will lead to a reliable, mandated placement exam at Kansas State
University.
44
References
[1] Baker, F. and Kim, S. (2004) The Basics of Item Response Theory. Marcel Dekkar, Inc. New
York, NY.
[2] Burton, N.W. & Ramis, L. (2001). Predicting Success in College: SAT studies of Classes
Graduating Since 1980. College Board Report No. 2001-2.
[3] Korbin, J.L. &Milewski, G.B. (2002). Students with Discrepant High School and SAT I
Scores. College Entrance Examination Board, Research Notes 15.
[4] Roth, J., Crans, G.G., Carter, R.L., Ariet, M., and Resnick, M.B. (2001). Effect of high
school course-taking and grades on passing a college placement test. High School Journal, 84:
72-87.
[5] Skorupski, W.P. & Carvajal, J. (2010). A Comparison of Approaches for Improving the
Reliability of Objective Level Scores. Educational and Psychological Measurement, 70(3) 357-
375.
[6] Sanchez, J.D. (2007). Analyzing Undergraduate Admissions Criteria (the SATs) and
Understanding Students’ Academic Growth Using Hierarchical Linear Models, Item Response
Theory and Differential Item Functioning Analysis, Diss. University of California, Berkeley.
[7] Sawyer, R. (1996). Decision Theory Models for Validating Source Placement Tests. Journal
of educational Measurement, 33: 271-290.
45
[8] J. Shaftel, J., Yang, X., Glasnapp, D., and Poggio, J. (2005). Improving Assessment Validity
for Students with Disabilities in Large-Scale Assessment Programs. Educational Assessment,
10(4), 357-375
[9] Willingham, W.W. (1985). Success in College: The Role of Personal Qualities and Academic
Ability. College Entrance Examination Board and Educational Testing Services. College Board
Publications.
[10] Young, J. (1990). Adjusting the cumulative GPA Using item Response Theory. Journal of
Educational Measurement, Vol. 27, No. 2, pp 175-186.
[11] ACT Information System. ACT: Resources for Education and Workplace Success. 11 June
2010. <http://www.act.org/aap/infosys/index.html>
[12] The College Board. 2009 AP Calculus Course Description. 8 June 2010.
http://www.apcentral.collegeboard.com/apc/public/repository/ap08_calculus_coursedesc.pdf
[13] Kansas State University. Academic Assistance Center. 13 July 2010. http://www.k-
state.edu/aac/mathcourse/prerequisites.htm