Embed Size (px)
Citation preview

ANALYSIS OF AIRCRAFT CONFIGURATIONS INCLUDING PROPAGATED UNCERTAINTIES
Till Pfeiffer, Erwin Moerland, Daniel Böhnke, Björn Nagel, Volker Gollnick German Aerospace Center (DLR), Institute of Air Transportation Systems, Hamburg, Germany
ABSTRACT
During early design stages, limited information is available to conduct decisions on the goodness of aircraft
configurations. In this work, the physical information is supplemented by the uncertainty underlying the applied
analysis modules, propagated through the complete design workflow. Thereby, it is possible to not only state that one concept is preferred above another, but furthermore the level of certainty of such a statement can be
quantified.
1 INTRODUCTION
When analyzing the potential of novel aircraft configurations on a conceptual to preliminary design level, the
often limited amount of time available for investigating physical properties of design candidates dictates both the low fidelity level and amount of analyses that can be conducted. The increase in computational power over
the last decades has resulted in an increase in analysis capabilities for assessing aircraft concepts. However, considerations based on analyses using methods representing high-fidelity physics-based analysis still find their
application in detailed design phases only.
To create a proper basis to conduct design decisions in early design phases using the limited available
information on the aircraft physics, it is required to supplement that information by the uncertainty of the implemented analyses. The DLR project “Future Enhanced Aircraft Configurations (FrEACs)” tries to extend the
early design phase with uncertainty information.
The current paper investigates the analysis of aircraft configurations under consideration of propagated
uncertainties in early design stages. Aside investigating sensitivities of the physical properties of aircraft, the propagation of uncertainties between individual calculation modules in analysis workflows allows for
determination of the overall uncertainty of these properties. The base for making well-grounded design decisions in conceptual and preliminary design stages is thereby improved.
In order to propagate uncertainties across multiple analysis tools, at first uncertainties have to be determined at the individual tool level. In a parallel publication [1], this uncertainty determination is described for the
disciplinary analysis modules within a low-fidelity physics based aerospace toolkit [2]. According to the analysis question at hand, workflows are built up by connecting these modules in the distributed integration
environment RCE [3]. In this way, an analysis process is generated for the evaluation of target functions on
overall aircraft design (OAD) level. Aircraft geometrical parameters, analysis results and uncertainty data are exchanged using the Common Parametric Aircraft Configuration Scheme (CPACS) [4]. An example workflow
including uncertainty propagation components is presented later. Analysis modules are repetitively called to determine the sensitivities of input parameters with corresponding uncertainty band on its output parameters.
Three aircraft configurations for a short-to-medium range design mission are analysed and compared: a
conventional aircraft for reference purposes, a strut-braced wing and a box-wing; depicted in Figure 1.
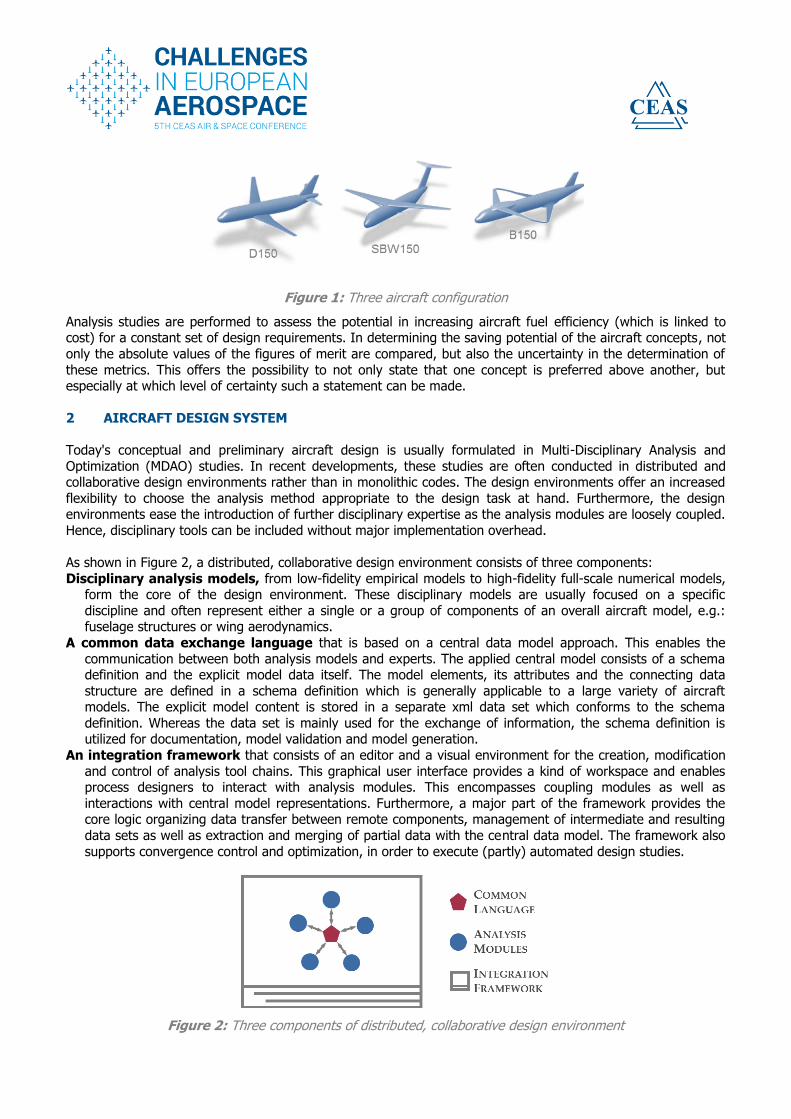
Figure 1: Three aircraft configuration
Analysis studies are performed to assess the potential in increasing aircraft fuel efficiency (which is linked to cost) for a constant set of design requirements. In determining the saving potential of the aircraft concepts, not
only the absolute values of the figures of merit are compared, but also the uncertainty in the determination of
these metrics. This offers the possibility to not only state that one concept is preferred above another, but especially at which level of certainty such a statement can be made.
2 AIRCRAFT DESIGN SYSTEM
Today's conceptual and preliminary aircraft design is usually formulated in Multi-Disciplinary Analysis and
Optimization (MDAO) studies. In recent developments, these studies are often conducted in distributed and collaborative design environments rather than in monolithic codes. The design environments offer an increased
flexibility to choose the analysis method appropriate to the design task at hand. Furthermore, the design environments ease the introduction of further disciplinary expertise as the analysis modules are loosely coupled.
Hence, disciplinary tools can be included without major implementation overhead.
As shown in Figure 2, a distributed, collaborative design environment consists of three components:
Disciplinary analysis models, from low-fidelity empirical models to high-fidelity full-scale numerical models, form the core of the design environment. These disciplinary models are usually focused on a specific
discipline and often represent either a single or a group of components of an overall aircraft model, e.g.: fuselage structures or wing aerodynamics.
A common data exchange language that is based on a central data model approach. This enables the
communication between both analysis models and experts. The applied central model consists of a schema definition and the explicit model data itself. The model elements, its attributes and the connecting data
structure are defined in a schema definition which is generally applicable to a large variety of aircraft models. The explicit model content is stored in a separate xml data set which conforms to the schema
definition. Whereas the data set is mainly used for the exchange of information, the schema definition is utilized for documentation, model validation and model generation.
An integration framework that consists of an editor and a visual environment for the creation, modification
and control of analysis tool chains. This graphical user interface provides a kind of workspace and enables process designers to interact with analysis modules. This encompasses coupling modules as well as
interactions with central model representations. Furthermore, a major part of the framework provides the core logic organizing data transfer between remote components, management of intermediate and resulting
data sets as well as extraction and merging of partial data with the central data model. The framework also
supports convergence control and optimization, in order to execute (partly) automated design studies.
Figure 2: Three components of distributed, collaborative design environment

Several design environments that bring together these components exist in literature. Among others, CEASIOM
[5] and MDOPT [6] are indicated as outstanding examples. The present study is based on the aircraft design system currently under developed at DLR. Therefore, the central model approach uses the Common Parametric
Aircraft Configuration Schema (CPACS) [7] as data exchange format. The Remote Component Environment (RCE) [8] is the integration framework of choice.
The disciplinary analysis models applied are the empirics-based conceptual design tool VAMPzero [9] and vortex-lattice aerodynamic analysis module Tornado [10]. Section 3 further elaborates on the characteristics of
these models.
The introduction of uncertainties into the aircraft design system affects most of its components. First of all, the analysis models with inherent uncertainties need to explicitly provide uncertainty information in their output.
Hence, the central model needs to provide means to describe and store this uncertainty information in a
structured manner. The integration framework needs to be extended to propagate information on uncertainties in a design process consisting of several analysis models.
The analysis and propagation of uncertainties in the design process principia’s is described in [1]. There is
presented an uncertainty component which is imbedded in RCE and build up to simulate and propagate the
uncertainties in a MDO Framework. This component is also used here.
3 SET UP OF A MULTI-DISCIPLINARY ANALYSIS AND OPTIMIZATION ANALYSIS WORKFLOW
Figure 3 shows the workflows for aircraft analysis, including uncertainty propagation components. There are
two workflows, one for the Conventional and Strut Braced Wing configurations and one for the box-wing configuration.
Analysis modules As initial model generator for aircraft configurations, the conceptual design tool VAMPzero is used [9]. VAMPzero is developed within DLR for CPACS based applications. The calculation of the aircrafts physical
parameters is based on handbook equations, which itself are based on statistical aircraft data. There after an
aerodynamic and structure analyses follows. The Module LCGplus generates the load cases which are used for the structural sizing. The analysis code Tornado calculates aerodynamic forces and moments of the aircraft
configuration in several flight conditions (aero performance map) and load cases. Tornado is a vortex-lattice module which applies thin airfoil theory, small angle approximations and assumes incompressible, inviscid,
irrotational flow conditions [11]. The primary wing structure mass is calculated by the AEE code which is based
the of beam theory. It uses the calculated aerodynamic load distributions on the wing determined by Tornado. The secondary wing masses are estimated by the semi-statistical method PESTsewi. It is based on statistical
area masses and further empirics for wing components. The calculated masses are merged in CMU, a consistency checker for the mass breakdown, centre of gravities and inertias, to estimate the design masses.
The calculated masses, aerodynamic forces in all flight conditions and an engine performance map applied used in TrimFlight for the mission analysis of the design. It calculates the fuel for the specified mission, based on the
Breguet formula and provides an estimation of the take-off field length.
The analysis modules are repeatedly called to investigate the sensitivities of output parameters to the variable input parameters under consideration. Thereby, the corresponding uncertainty band on its output parameters is
determined.
Uncertainty component integration The uncertainty component is integrated three times in the workflow. The first component determines the
uncertainties of VAMPzero. The second uncertainty component determines the effects of the uncertainties on
the subsequent structure and aerodynamics analyses modules. The third uncertainty component determines the effects of the uncertainties on the subsequent mission simulation module TrimFlight. The mission simulation
mainly bases on mass parameters generated by VAMPzero and structure analysis and aerodynamic coefficients determined by multiple Tornado runs (in dependence on the angle of attack, Mach number and Reynolds

number). Thereby, the uncertainties that occur in the input of TrimFlight are a result of individual uncertainties
associated with geometry, mass items and aerodynamics.
Figure 3: Analysis workflow in RCE with integrated uncertainty module, left of the D150 and SBW150, right of the BoxWing150

CEAS 2015 034 Page | 5 This work is licensed under the Creative Commons Attribution International License (CC BY). Copyright © 2015 by author(s).
4 EXAMPLE DESIGN OF THREE DIFFERENT AIRCRAFT CONFIGURATIONS OF
CONSIDERING UNCERTAINTIES
As an example demonstration, tree configurations are analysed with the aid of the workflows shown in
Figure 3. These are a conventional wing and tube design, a strut-braced-wing and a box-wing
configuration.
Conventional As a reference aircraft the CSR01 form the CERAS Project [12] is used; its properties are listed in Table 1.
This configuration is a standard conventional wing and tube design and remains unchanged for all these studies.
Parameter Value
Design range 2750 nm Mach number 0.78
Payload (Passenger) 13600 kg (150) Mission-Fuel @ Design Range
18700 kg
Block-Fuel 16500 kg
OEM 42100 kg
TOM 77000 kg Wing loading 642 kg/m²
Wing Area 122 m² Wing aspect ratio 9.5
TOFL 2200 m Span 34 m
Engine Type 2x V2527-A5
Engine Thrust 117.9 kN
Table 1: Properties of Reference Aircraft
The conventional configuration, named D150, is similar to current medium range aircraft like the Airbus
A320 or the Boeing B737. The D150 serves as the baseline for the comparison of all configurations. The top-level aircraft for all three configurations are listed in Table 2.
Parameter Value
Design Range 2750 nm
Mach Number 0.78 Payload (Passenger) 13600 kg (150)
TOFL <2200 m
Span < 34 m (36 m ICAO Code C)
Table 2: Top Level Aircraft Requirements (TLARs) for the Design

CEAS 2015 034 Page | 6 This work is licensed under the Creative Commons Attribution International License (CC BY). Copyright © 2015 by author(s).
Strut-Braced Wing The strut-braced wing, named SBW150, is a high decker configuration with a strut between the fuselage
and the wing to reduce bending moments on the wing. The gain of the strut may result in a reduction of
the structural mass or in a higher aspect ratio to reduce the induced drag, just to name a few design possibilities. Disadvantages arise from the heavier T-Tail in comparison to the D150 Empennage.
Furthermore, several physical effects to the strut-braced wing, e.g. the interference drag of the strut or its aeroelastic behaviour are hard to quantify.
Box-Wing An even more unconventional configuration is the box-wing, named B150, which is a double-decker with offset and merged wingtips. The advantage of this configuration is the box construction that enables the
reduction of induced drag. The wings produce a different portion of lift so that the horizontal stabilizer is
omitted to reduce weight. Another advantage of this configuration is the compact design. Since this configuration has two wings at the same total wing area (or wing load) and a constant wing aspect ratio
the span of each individual wing is reduced.
For a reasonable comparison, the three configurations must be as similar as possible. All three configurations are analyzed under the same conditions, have the same transport task, and are operated
with the same engines. The main difference is the geometric arrangement of the wings and tail.
Design of Experiments A parameter study is performed that varies both the wing area and the wing aspect ratio. The design of experiments is listed in Table 3. The wing area range is similar for all three configurations and wing
aspect ratio range for the box-wing configuration is extended.
Wing parameter Range Steps
Wing area 80 : 140 m² 5
Aspect ratio D150,SBW150
8 : 14 5
Aspect ratio B150
8 : 20 13
Table 3: Parameters and ranges of DOE
The definition of the aspect ratio is defined by the quadratic span b divided by the wing area S. To clarify these definition also for unconventional configurations Figure 4 shows the use dimensions.
Figure 4: Definition of aspect ratio
Within the design space, a full-factorial sampling with 5 and 13 steps for each parameter is chosen (Table
3). Both the individual and coupled effect of the parameter variations is investigated. Each parameter is modified linearly within the defined range. For each sampling point within the design space, 30 samples
are incorporated to determine the uncertainty of the system outcome. The overall mission fuel at the

CEAS 2015 034 Page | 7 This work is licensed under the Creative Commons Attribution International License (CC BY). Copyright © 2015 by author(s).
design range is used as accumulated uncertainty parameter, i.e., all propagated uncertainty information
occurs in the quantification of the overall requirements on mission fuel.
Design environment of all three configurations The analysis environment for the D150, SBW150 (left) and B150 (right) are shown in the Figure 3. The
analyses environments for SBW and D150 are similar.
All models which are included there already described above. The workflow logic is as follows: At the
beginning a CPACS file that holds the definition of D150 or SBW150 which includes the TLARs is loaded. After this an engine is extracted from a database. To enable a better comparison the engine deck
remains constant. The DOE component changes the design parameters as described in the sampling plan. The uncertainty analysis is included at three positions (See Figure 3). The analysis environment for
the B150 is different from the other environments and described in more detail below.
Results of the D150 parameter study including uncertainties The effect of wing area and aspect ratio on mission fuel including uncertainties of the D150 is shown in
Figure 5. Alongside the resulting fuel mass estimations of the 30 samples per DOE point, a regression method is applied to determine the overall calculation result according to the 5x5x30 = 750 analysis
results. The result of this regression is shown in the corresponding response surface (colored, meshed
surface in Figure 5). Additionally, the response surfaces of standard derivations are shown. It can be seed, that the regression of the stochastic results closely resembles the separately determined
deterministic results of the DOE analysis. The maximum difference between the deterministic and stochastic regression was around 2.5% of mission fuel of each design point, for the D150 configuration.
Figure 5: Mission fuel vs. aspect ratio and wing area of the D150

CEAS 2015 034 Page | 8 This work is licensed under the Creative Commons Attribution International License (CC BY). Copyright © 2015 by author(s).
Furthermore, an optimization with respect to the TLAR is included. The basic restriction in this study is
the TOFL and the span and both are limiting for the design. Figure 6 shows the result of the optimization (red dot) in the parameter space, including the contour-lines of fuel, TOFL and wing span.
Figure 6: Mission fuel, TOFL and wing span vs. aspect ratio and wing area of the D150, (with optimum
at: Wing Ref. Area = 128 m² | Wing Aspect Ratio = 9.0 | mission Fuel = 18698 kg)
Figure 7: 2D cross-sections along the response surface centered on the optimum point

CEAS 2015 034 Page | 9 This work is licensed under the Creative Commons Attribution International License (CC BY). Copyright © 2015 by author(s).
Figure 7 shows the analysis results as 2D plots along the response surface centered on the optimum point (aspect ratio = 9.0, wing area = 128 m²). The red line indicates the result of the obtained
regression model, whereas the grey band around the red line indicates the 95% prediction interval of the
regression. The latter implies that if the parameters are independent, normally distributed and have a constant variance then there is a 95% probability that all future results are inside the interval. This is
thereby related to the regression model, and indicates the possible error due to building the regression model. The grey dashed lines show the standard deviation of the random number simulations, i.e., the propagated uncertainty of the analysis modules itself; for second standard deviation (2𝜎) of the mean
(i.e.: 95.4% of the calculated fuel masses lie within this confidence interval). The first standard derivation 𝜎 in the optimum point is 131.5 kg fuel.
The blue point shows the location of the reference configuration CSR01 which is close the D150 optimum point. There is no difference between both configurations in terms of fuel burn, the wing area changes by
4.0 % and the aspect ratio by 3.2%. This indicates that there is no major error in the design framework.
No calibration is executed to enable a reasonable comparison also for the unconventional configurations.
Result of the SBW150 parameter study, including uncertainties The analysis environment for the SBW150 is similar to that of the D150. The main difference is in CPACS file as already described. All integrated models are able to predict the properties of this configuration.
An additional important geometry parameter which is not in the above-defined design space, is the
position of the strut-wing attachment. The relative position where the strut wing intersection is not
changed here and is taken from recent publications [13].
Figure 8Figure 6 shows the Result of the optimization (red dot) in the same way like it shown for the D150.
Figure 8: Mission fuel, TOFL and wing span vs. aspect ratio and wing area of the Strut-Brace-Wing
configuration (with optimum at: Wing Ref. Area = 103 m² | Wing Aspect Ratio = 11.2 | mission Fuel =
16358 kg)

CEAS 2015 034 Page | 10 This work is licensed under the Creative Commons Attribution International License (CC BY). Copyright © 2015 by author(s).
Result of the Box-Wing150 parameter study, including uncertainties The analysis environment for the B150 is different from the previous environments (see Figure 3). Here the geometry is not initialized by VAMPzero as there is no support for this configuration in the tool.
Instead a separate geometry generator, which was designed for this configuration, is applied.
The sequence of the further models LCGpus Tornado, AEE, and PESTsewi is not changed. VAMPzero runs
after the structural analysis and calculates all masses that do not belong to the wing. All masses are merged in the CPACS mass breakdown and updated by CMU.
Of course, the applied analysis methods are low-fidelity, and hence, the design of all configurations is
error-prone. However, for the box-wing configuration a proper analysis is even harder to achieve. For
example, the use of fuselage masses from empiric models within VAMPzero is questionable. The fuselage structure has different connections to the wings, and hence different load cases may be relevant. At this
level of detail, these errors need to be accepted. In future work more higher-fidelity analysis models will be coupled to the uncertainty analysis.
Figure 9 shows the result of the optimization (red dot). The optimum of this configuration is only
constrained by the TOFL. The optimal span is close to 27 meters.
Figure 9: Mission fuel, TOFL and wing span vs. aspect ratio and wing area of the box-wing configuration
(with optimum at: Wing ref. area = 114 m² | wing aspect ratio = 12.7 | mission fuel = 18353 kg)
Comparison of the three Designs All configurations have been optimized independently under the same constraints. Figure 10 shows the
summarized results. It displays the optima together with the band of the second standard deviation and its confidence intervals. In addition, the mission fuel of the reference configuration is shown (by a vertical
dashed line). Both unconventional configurations show an improvement compared to the reference configuration. The D150 matches the reference quite well. The highest potential of the three examined
configurations with respect to fuel consumption shows the SBW150 configuration.

CEAS 2015 034 Page | 11 This work is licensed under the Creative Commons Attribution International License (CC BY). Copyright © 2015 by author(s).
Figure 10: Comparison of the optima of all three configurations including the band of uncertainty
The direct comparison of the three configurations to each other shows that the SBW150 configuration
has a reduction of the fuel consumption at round about 14 % compared to D150 and the reference
aircraft. Taking into account the uncertainties results in, at best, a reduction of 15.5 % and in the worst case, a reduction of 13.1 % fuel. The fuel burn reduction for the B150 compared to the D150 shows a
small improvement of 1.8%. When the uncertainties are taken into account, the best case shows a reduction of 8.7 % and the worst case an increase of 4.1% fuel.
Extension of the Requirements The presented results are mostly driven by the boundary conditions (derived from the reference configuration). As mentioned above, the potential of the SBW configuration is at high aspect ratios, and
with respect to the TLAR these can only be achieved if the wing area is reduced. However, due to the link of wing area to the TOFL a reduction would only be possible if the payload goes down. Thus, the
possible potential of this configuration under the assumptions can not be exploited.
If the D150 TOFL restriction is changed to 2400m then the mission fuel is reduced by 6.5% (see Table
4). However, this reduction is subject to a local 2σ uncertainty of 2.4%. The improvement of fuel burn in the best case is 8.9% and in the worst case only about 4.1%. When the span requirement changes from
34 to 36 meters, mission fuel reduction is around 4.2%. The same is true for the SBW150 configuration,
see Table 4. A comparison of the results of the span variation shows that the efficiency improvement in the SBW configuration is stronger than that of the D150.
Since span restriction is not relevant for the B150, only the change in the TOFL is investigated. It turns
out that the increase in efficiency is low (1.7%) and subject to high uncertainties (see Table 4).
∆ sTOFL ∆ Span
D150 ∆ Fuel in % - 6.5 % - 4.2 %
2𝜎 in% 2.4 % 1.8 %
SBW150 ∆ Fuel in % - 6.2% - 5.9%
2𝜎 in% 3.5 % 2.9 %
B150 ∆ Fuel in % 1.7 % -
2𝜎 in% 7.0 % -
Table 4: Impact of TOFL and span restriction

CEAS 2015 034 Page | 12 This work is licensed under the Creative Commons Attribution International License (CC BY). Copyright © 2015 by author(s).
5 SUMMARY AND CONCLUSION
This paper provides indicative results of the implementation of uncertainty considerations within aircraft
design analyses. A straightforward parameter variation of a conventional aircraft and two unconventional including specific uncertainties was shown and the results were compared to a reference configuration.
With the assumption that the uncertainties are sufficiently covered to support design decisions, the inclusion of uncertainty data helps to make better founded decisions on the applicability of aircraft
configurations to design requirements and missions. Especially when applied to the analysis of aircraft derivatives or even for unconventional aircraft configurations, the consideration of uncertainties becomes
increasingly important.
The integration of uncertainty however cannot be interpreted as the final solution to cover all possible
risks. Uncertainties underlie uncertainties of higher order too. A quantification of all occurring uncertainties seems to be near to impossible; nevertheless a plausible derivation of these makes sense
and is useful for increasing the level of confidence in analysis result interpretation.
The integration of more sources of uncertainty of different disciplines covering major physical effects is
foreseen in future work. By performing optimization including these uncertainties within the target function, a robust optimisation framework will be established. A larger amount of geometrical design
parameters will be varied during full-scale DOE studies, the uncertainty component automatically selects the most relevant ones (based on high sensitivity to the output function or due to large uncertainty) for
detailed calculations. For this a more detailed analysis of the dependencies of parameters during iterative
calculations is required.
REFERENCES
[1] T. Pfeiffer, E. Moerland, and V. Gollnick, “Aircraft Configuration Analysis Using A Low-Fidelity ,
Physics Based Aerospace Framework Under Uncertainty Considerations”, ICAS, 2014.
[2] E. Moerland, R. Becker, and B. Nagel, “Collaborative understanding of disciplinary correlations
using a low-fidelity physics based aerospace toolkit”, CEAS 2013, 2013.
[3] D. Seider, M. Litz, M. Kunde, R. Mischke, and P. Kroll, “RCE: Distributed, Collaborative
Problem Solving Environment”, 2012.
[4] C. M. Liersch and M. Hepperle, “A distributed toolbox for multidisciplinary preliminary aircraft
design”, CEAS Aeronautical Journal, 2011.
[5] M. Zhang, A. Rizzi, F. Nicolosi, and A. De Marco, “Collaborative Aircraft Design Methodology
using ADAS Linked to CEASIOM”, AIAA, 2014.
[6] S. LeDoux and W. Herling, “MDOPT-A multidisciplinary design optimization system using
higher-order analysis codes”, AIAA, 2004.

CEAS 2015 034 Page | 13 This work is licensed under the Creative Commons Attribution International License (CC BY). Copyright © 2015 by author(s).
[7] B. Nagel, D. Böhnke, V. Gollnick, P. Schmollgruber, A. Rizzi, G. La Rocca, and J. J. Alonso,
“Communication in aircraft design : can we establish a common language ?”, ICAS, 2012.
[8] D. Seider, P. M. Fischer, M. Litz, A. Schreiber, and A. Gerndt, “Open source software framework
for applications in aeronautics and space”, 2012 IEEE Aerospace Conference, Mar. 2012.
[9] D. Böhnke, J. Jepsen, and T. Pfeiffer, “An Integrated Method for Determination of the Oswald
Factor in a Multi-Fidelity Design Environment”, CEAS, 2011.
[10] T. Melin, “A Vortex Lattice MATLAB Implementation for Linear Aerodynamic Wing
Applications”, 2000.
[11] T. Melin, “USER ’ s GUIDE Reference manual Tornado 1.0”, 2001.
[12] “CERAS” [Online]. Available: http://ceras.ilr.rwth-aachen.de/trac/wiki/CeRAS/AircraftDesigns
/CSR01.
[13] G. Carrier, O. Atinault, S. Dequand, C. Liauzun, B. Paluch, and C. Toussaint, “Investigation Of A
Strut-Braced Wing Configuration For Future Commercial Transport”, ICAS, 2012.