Embed Size (px)
Citation preview

arX
iv:1
511.
0164
4v1
[st
at.A
P] 5
Nov
201
5
The Annals of Applied Statistics
2015, Vol. 9, No. 3, 1350–1371DOI: 10.1214/15-AOAS848c© Institute of Mathematical Statistics, 2015
INTERPRETABLE CLASSIFIERS USING RULES AND BAYESIANANALYSIS: BUILDING A BETTER STROKE PREDICTION
MODEL
By Benjamin Letham∗,1, Cynthia Rudin∗,1,Tyler H. McCormick†,2
and David Madigan‡,3
Massachusetts Institute of Technology∗, University of Washington†
and Columbia University‡
We aim to produce predictive models that are not only accurate,but are also interpretable to human experts. Our models are deci-sion lists, which consist of a series of if . . . then. . . statements (e.g., ifhigh blood pressure, then stroke) that discretize a high-dimensional,multivariate feature space into a series of simple, readily interpretabledecision statements. We introduce a generative model called BayesianRule Lists that yields a posterior distribution over possible decisionlists. It employs a novel prior structure to encourage sparsity. Ourexperiments show that Bayesian Rule Lists has predictive accuracyon par with the current top algorithms for prediction in machinelearning. Our method is motivated by recent developments in per-sonalized medicine, and can be used to produce highly accurate andinterpretable medical scoring systems. We demonstrate this by pro-ducing an alternative to the CHADS2 score, actively used in clinicalpractice for estimating the risk of stroke in patients that have atrialfibrillation. Our model is as interpretable as CHADS2, but more ac-curate.
1. Introduction. Our goal is to build predictive models that are highlyaccurate, yet are highly interpretable. These predictive models will be inthe form of sparse decision lists, which consist of a series of if. . . then. . .
statements where the if statements define a partition of a set of featuresand the then statements correspond to the predicted outcome of interest.Because of this form, a decision list model naturally provides a reason for
Received October 2013; revised April 2015.1Supported in part by NSF CAREER Grant IIS-1053407 from the National Science
Foundation to C. Rudin, and awards from Siemens and Wistron.2Supported in part by a Google Faculty Award and NIAID Grant R01 HD54511.3Supported in part by Grant R01 GM87600-01 from the National Institutes of Health.Key words and phrases. Bayesian analysis, classification, interpretability.
This is an electronic reprint of the original article published by theInstitute of Mathematical Statistics in The Annals of Applied Statistics,2015, Vol. 9, No. 3, 1350–1371. This reprint differs from the original in paginationand typographic detail.
1

2 LETHAM, RUDIN, MCCORMICK AND MADIGAN
if male and adult then survival probability 21% (19%–23%)else if 3rd class then survival probability 44% (38%–51%)else if 1st class then survival probability 96% (92%–99%)else survival probability 88% (82%–94%)
Fig. 1. Decision list for Titanic. In parentheses is the 95% credible interval for thesurvival probability.
each prediction that it makes. Figure 1 presents an example decision list thatwe created using the Titanic data set available in R. This data set providesdetails about each passenger on the Titanic, including whether the passengerwas an adult or child, male or female, and their class (1st, 2nd, 3rd or crew).The goal is to predict whether the passenger survived based on his or herfeatures. The list provides an explanation for each prediction that is made.For example, we predict that a passenger is less likely to survive than notbecause he or she was in the 3rd class. The list in Figure 1 is one accurateand interpretable decision list for predicting survival on the Titanic, possiblyone of many such lists. Our goal is to learn these lists from data.
Our model, called Bayesian Rule Lists (BRL), produces a posterior dis-tribution over permutations of if. . . then. . . rules, starting from a large, pre-mined set of possible rules. The decision lists with high posterior probabilitytend to be both accurate and interpretable, where the interpretability comesfrom a hierarchical prior over permutations of rules. The prior favors concisedecision lists that have a small number of total rules, where the rules havefew terms in the left-hand side.
BRL provides a new type of balance between accuracy, interpretabilityand computation. Consider the challenge of constructing a predictive modelthat discretizes the input space in the same way as decision trees [Breimanet al. (1984), Quinlan (1993)], decision lists [Rivest (1987)] or associativeclassifiers [Liu, Hsu and Ma (1998)]. Greedy construction methods like clas-sification and regression trees (CART) or C5.0 are not particularly com-putationally demanding, but, in practice, the greediness heavily affects thequality of the solution, both in terms of accuracy and interpretability. At thesame time, optimizing a decision tree over the full space of all possible splitsis not a tractable problem. BRL strikes a balance between these extremes, inthat its solutions are not constructed in a greedy way involving splitting andpruning, yet it can solve problems at the scale required to have an impactin real problems in science or society, including modern healthcare.
A major source of BRL’s practical feasibility is the fact that it uses pre-mined rules, which reduces the model space to that of permutations of rulesas opposed to all possible sets of splits. The complexity of the problem then

INTERPRETABLE CLASSIFIERS USING RULES AND BAYESIAN ANALYSIS 3
depends on the number of pre-mined rules rather than on the full space offeature combinations; in a sense, this algorithm scales with the sparsity ofthe data set rather than the number of features. As long as the pre-mined setof rules is sufficiently expressive, an accurate decision list can be found and,in fact, the smaller model space might improve generalization [through thelens of statistical learning theory, Vapnik (1995)]. An additional advantageto using pre-mined rules is that each rule is independently both interpretableand informative about the data.
BRL’s prior structure encourages decision lists that are sparse. Sparsedecision lists serve the purpose of not only producing a more interpretablemodel, but also reducing computation, as most of the sampling iterationstake place within a small set of permutations corresponding to the sparse de-cision lists. In practice, BRL is able to compute predictive models with accu-racy comparable to state-of-the-art machine learning methods, yet maintainthe same level of interpretability as medical scoring systems.
The motivation for our work lies in developing interpretable patient-levelpredictive models using massive observational medical data. To this end, weuse BRL to construct an alternative to the CHADS2 score of Gage et al.(2001). CHADS2 is widely used in medical practice to predict stroke in pa-tients with atrial fibrillation. A patient’s CHADS2 score is computed byassigning one “point” each for the presence of congestive heart failure (C),hypertension (H), age 75 years or older (A) and diabetes mellitus (D), andby assigning 2 points for history of stroke, transient ischemic attack or thro-moembolism (S2). The CHADS2 score considers only 5 factors, whereas theupdated CHA2DS2-VASc score [Lip et al. (2010b)] includes three additionalrisk factors: vascular disease (V), age 65 to 74 years old (A) and femalegender (Sc). Higher scores correspond to increased risk. In the study defin-ing the CHADS2 score [Gage et al. (2001)], the score was calibrated withstroke risks using a database of 1733 Medicare beneficiaries followed for, onaverage, about a year.
Our alternative to the CHADS2 was constructed using 12,586 patients and4148 factors. Because we are using statistical learning, we are able to considersignificantly more features; this constitutes over 6000 times the amount ofdata used for the original CHADS2 study. In our experiments we comparedthe stroke prediction performance of BRL to CHADS2 and CHA2DS2-VASc,as well as to a collection of state-of-the-art machine learning algorithms: C5.0[Quinlan (1993)], CART [Breiman et al. (1984)], ℓ1-regularized logistic re-gression, support vector machines [Vapnik (1995)], random forests [Breiman(2001a)], and Bayesian CART [Denison, Mallick and Smith (1998), Chip-man, George and McCulloch (1998)]. The balance of accuracy and inter-pretability obtained by BRL is not easy to obtain through other means:None of the machine learning methods we tried could obtain both the samelevel of accuracy and the same level of interpretability.

4 LETHAM, RUDIN, MCCORMICK AND MADIGAN
2. Bayesian rule lists. The setting for BRL is multi-class classification,where the set of possible labels is 1, . . . ,L. In the case of predicting strokerisk, there are two labels: stroke or no stroke. The training data are pairs{(xi, yi)}
ni=1, where xi ∈R
d are the features of observation i, and yi are thelabels, yi ∈ {1, . . . ,L}. We let x= (x1, . . . , xn) and y= (y1, . . . , yn).
In Sections 2.1 and 2.2 we provide the association rule concepts and nota-tion upon which the method is built. Section 2.3 introduces BRL by outliningthe generative model. Sections 2.4 and 2.5 provide detailed descriptions ofthe prior and likelihood, and then Sections 2.6 and 2.7 describe samplingand posterior predictive distributions.
2.1. Bayesian association rules and Bayesian decision lists. An associa-tion rule a→ b is an implication with an antecedent a and a consequent b. Forthe purposes of classification, the antecedent is an assertion about the fea-ture vector xi that is either true or false, for example, “xi,1 = 1 and xi,2 = 0.”This antecedent contains two conditions, which we call the cardinality ofthe antecedent. The consequent b would typically be a predicted label y. ABayesian association rule has a multinomial distribution over labels as itsconsequent rather than a single label:
a→ y ∼Multinomial(θ).
The multinomial probability is then given a prior, leading to a prior conse-
quent distribution:
θ|α∼Dirichlet(α).
Given observations (x,y) classified by this rule, we let N·,l be the numberof observations with label yi = l, and N = (N·,1, . . . ,N·,L). We then obtain aposterior consequent distribution:
θ|x,y,α∼Dirichlet(α+N).
The core of a Bayesian decision list is an ordered antecedent list d =(a1, . . . , am). Let Nj,l be the number of observations xi that satisfy aj butnot any of a1, . . . , aj−1, and that have label yi = l. This is the number ofobservations to be classified by antecedent aj that have label l. Let N0,l bethe number of observations that do not satisfy any of a1, . . . , am and thathave label l. Let Nj = (Nj,1, . . . ,Nj,L) and N= (N0, . . . ,Nm).
A Bayesian decision list D = (d,α,N) is an ordered list of antecedentstogether with their posterior consequent distributions. The posterior con-sequent distributions are obtained by excluding data that have satisfied anearlier antecedent in the list. A Bayesian decision list then takes the form:

INTERPRETABLE CLASSIFIERS USING RULES AND BAYESIAN ANALYSIS 5
if a1 then y ∼Multinomial(θ1), θ1 ∼Dirichlet(α+N1)else if a2 then y ∼Multinomial(θ2), θ2 ∼Dirichlet(α+N2)...else if am then y ∼Multinomial(θm), θm ∼Dirichlet(α+Nm)else y ∼Multinomial(θ0), θ0 ∼Dirichlet(α+N0).
Any observations that do not satisfy any of the antecedents in d are classifiedusing the parameter θ0, which we call the default rule parameter.
2.2. Antecedent mining. We are interested in forming Bayesian decisionlists whose antecedents are a subset of a preselected collection of antecedents.For data with binary or categorical features this can be done using frequentitemset mining, where itemsets are used as antecedents. In our experiments,the features were binary and we used the FP-Growth algorithm [Borgelt(2005)] for antecedent mining, which finds all itemsets that satisfy con-straints on minimum support and maximum cardinality. This means eachantecedent applies to a sufficiently large amount of data and does not havetoo many conditions. For binary or categorical features the particular choiceof the itemset mining algorithm is unimportant, as the output is an exhaus-tive list of all itemsets satisfying the constraints. Other algorithms, such asApriori or Eclat [Agrawal and Srikant (1994), Zaki (2000)], would returnan identical set of antecedents as FP-Growth if given the same minimumsupport and maximum cardinality constraints. Because the goal is to obtaindecision lists with few rules and few conditions per rule, we need not includeany itemsets that apply only to a small number of observations or have alarge number of conditions. Thus, frequent itemset mining allows us to sig-nificantly reduce the size of the feature space, compared to considering allpossible combinations of features.
The frequent itemset mining that we do in our experiments producesonly antecedents with sets of features, such as “diabetes and heart disease.”Other techniques could be used for mining antecedents with negation, suchas “not diabetes” [Wu, Zhang and Zhang (2004)]. For data with continuousfeatures, a variety of procedures exist for antecedent mining [Fayyad andIrani (1993), Dougherty, Kohavi and Sahami (1995), Srikant and Agrawal(1996)]. Alternatively, one can create categorical features using interpretablethresholds (e.g., ages 40–49, 50–59, etc.) or interpretable quantiles (e.g.,quartiles)—we took this approach in our experiments.
We let A represent the complete, pre-mined collection of antecedents, andsuppose that A contains |A| antecedents with up to C conditions in eachantecedent.
2.3. Generative model. We now sketch the generative model for the la-bels y from the observations x and antecedents A. Define a<j as the an-tecedents before j in the rule list if there are any, for example, a<3 = {a1, a2}.

6 LETHAM, RUDIN, MCCORMICK AND MADIGAN
Similarly, let cj be the cardinality of antecedent aj , and c<j the cardinalitiesof the antecedents before j in the rule list. The generative model is then:
– Sample a decision list length m∼ p(m|λ).– Sample the default rule parameter θ0 ∼Dirichlet(α).– For decision list rule j = 1, . . . ,m:
Sample the cardinality of antecedent aj in d as cj ∼ p(cj |c<j ,A, η).Sample aj of cardinality cj from p(aj |a<j , cj,A).Sample rule consequent parameter θj ∼Dirichlet(α).
– For observation i= 1, . . . , n:Find the antecedent aj in d that is the first that applies to xi.If no antecedents in d apply, set j = 0.Sample yi ∼Multinomial(θj).
Our goal is to sample from the posterior distribution over antecedent lists:
p(d|x,y,A,α, λ, η)∝ p(y|x, d,α)p(d|A, λ, η).
Given d, we can compute the posterior consequent distributions required toconstruct a Bayesian decision list as in Section 2.1. Three prior hyperparam-eters must be specified by the user: α, λ and η. We will see in Sections 2.4and 2.5 that these hyperparameters have natural interpretations that sug-gest the values to which they should be set.
2.4. The hierarchical prior for antecedent lists. Suppose the list of an-tecedents d has length m and antecedent cardinalities c1, . . . , cm. The priorprobability of d is defined hierarchically as
p(d|A, λ, η) = p(m|A, λ)m∏
j=1
p(cj |c<j ,A, η)p(aj|a<j , cj ,A).(2.1)
We take the distributions for list length m and antecedent cardinality cjto be Poisson with parameters λ and η, respectively, with proper trunca-tion to account for the finite number of antecedents in A. Specifically, thedistribution of m is Poisson truncated at the total number of preselectedantecedents:
p(m|A, λ) =(λm/m!)
∑|A|j=0(λ
j/j!), m= 0, . . . , |A|.
This truncated Poisson is a proper prior, and is a natural choice because ofits simple parameterization. Specifically, this prior has the desirable propertythat when |A| is large compared to the desired size of the decision list, aswill generally be the case when seeking an interpretable decision list, theprior expected decision list length E[m|A, λ] is approximately equal to λ.The prior hyperparameter λ can then be set to the prior belief of the list

INTERPRETABLE CLASSIFIERS USING RULES AND BAYESIAN ANALYSIS 7
length required to model the data. A Poisson distribution is used in a similarway in the hierarchical prior of Wu, Tjelmeland and West (2007).
The distribution of cj must be truncated at zero and at the maximumantecedent cardinality C. Additionally, any cardinalities that have beenexhausted by point j in the decision list sampling must be excluded. LetRj(c1, . . . , cj,A) be the set of antecedent cardinalities that are available af-ter drawing antecedent j. For example, if A contains antecedents of size 1,2 and 4, then we begin with R0(A) = {1,2,4}. If A contains only 2 rulesof size 4 and c1 = c2 = 4, then R2(c1, c2,A) = {1,2} as antecedents of size 4have been exhausted. We now take p(cj |c<j ,A, η) as Poisson truncated toremove values for which no rules are available with that cardinality:
p(cj |c<j ,A, η) =(ηcj/cj !)
∑
k∈Rj−1(c<j ,A)(ηk/k!)
, cj ∈Rj−1(c<j ,A).
If the number of rules of different sizes is large compared to λ, and η is smallcompared to C, the prior expected average antecedent cardinality is closeto η. Thus, η can be set to the prior belief of the antecedent cardinalityrequired to model the data.
Once the antecedent cardinality cj has been selected, the antecedent ajmust be sampled from all available antecedents in A of size cj . Here, we usea uniform distribution over antecedents in A of size cj , excluding those ina<j :
p(aj|a<j , cj ,A)∝ 1, aj ∈ {a ∈A \ a<j : |a|= cj}.(2.2)
It is straightforward to sample an ordered antecedent list d from the priorby following the generative model, using the provided distributions.
2.5. The likelihood function. The likelihood function follows directly fromthe generative model. Let θ = (θ0, θ1, . . . , θm) be the consequent parameterscorresponding to each antecedent in d, together with the default rule param-eter θ0. Then, the likelihood is the product of the multinomial probabilitymass functions for the observed label counts at each rule:
p(y|x, d,θ) =∏
j:∑
lNj,l>0
Multinomial(Nj |θj),
with
θj ∼Dirichlet(α).
We can marginalize over θj in each multinomial distribution in the aboveproduct, obtaining, through the standard derivation of the Dirichlet-
8 LETHAM, RUDIN, MCCORMICK AND MADIGAN
multinomial distribution,
p(y|x, d,α) =
m∏
j=0
Γ(∑L
l=1αl)
Γ(∑L
l=1Nj,l +αl)×
L∏
l=1
Γ(Nj,l + αl)
Γ(αl)
∝m∏
j=0
∏Ll=1Γ(Nj,l +αl)
Γ(∑L
l=1Nj,l + αl).
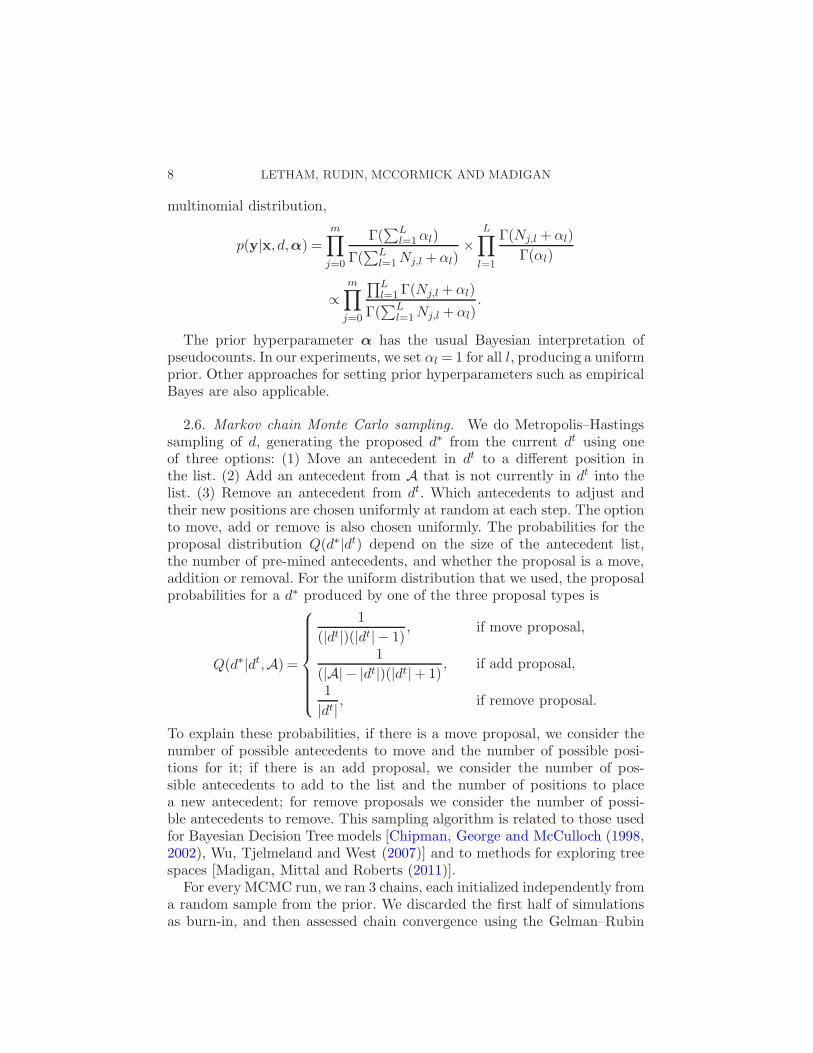
The prior hyperparameter α has the usual Bayesian interpretation ofpseudocounts. In our experiments, we set αl = 1 for all l, producing a uniformprior. Other approaches for setting prior hyperparameters such as empiricalBayes are also applicable.
2.6. Markov chain Monte Carlo sampling. We do Metropolis–Hastingssampling of d, generating the proposed d∗ from the current dt using oneof three options: (1) Move an antecedent in dt to a different position inthe list. (2) Add an antecedent from A that is not currently in dt into thelist. (3) Remove an antecedent from dt. Which antecedents to adjust andtheir new positions are chosen uniformly at random at each step. The optionto move, add or remove is also chosen uniformly. The probabilities for theproposal distribution Q(d∗|dt) depend on the size of the antecedent list,the number of pre-mined antecedents, and whether the proposal is a move,addition or removal. For the uniform distribution that we used, the proposalprobabilities for a d∗ produced by one of the three proposal types is
Q(d∗|dt,A) =
1
(|dt|)(|dt| − 1), if move proposal,
1
(|A| − |dt|)(|dt|+ 1), if add proposal,
1
|dt|, if remove proposal.
To explain these probabilities, if there is a move proposal, we consider thenumber of possible antecedents to move and the number of possible posi-tions for it; if there is an add proposal, we consider the number of pos-sible antecedents to add to the list and the number of positions to placea new antecedent; for remove proposals we consider the number of possi-ble antecedents to remove. This sampling algorithm is related to those usedfor Bayesian Decision Tree models [Chipman, George and McCulloch (1998,2002), Wu, Tjelmeland and West (2007)] and to methods for exploring treespaces [Madigan, Mittal and Roberts (2011)].
For every MCMC run, we ran 3 chains, each initialized independently froma random sample from the prior. We discarded the first half of simulationsas burn-in, and then assessed chain convergence using the Gelman–Rubin

INTERPRETABLE CLASSIFIERS USING RULES AND BAYESIAN ANALYSIS 9
convergence diagnostic applied to the log posterior density [Gelman andRubin (1992)]. We considered chains to have converged when the diagnostic
R < 1.05.
2.7. The posterior predictive distribution and point estimates. Given theposterior p(d|x,y,A, α,λ, η), we consider estimating the label y of a new ob-servation x using either a point estimate (a single Bayesian decision list)or the posterior predictive distribution. Given a point estimate of the an-tecedent list d, we have that
p(y = l|x, d,x,y, α) =
∫
θ
θlp(θ|x, d,x,y, α)dθ
= E[θl|x, d,x,y, α].
Let j(d, x) be the index of the first antecedent in d that applies to x. Theposterior consequent distribution is
θ|x, d,x,y, α∼Dirichlet(α+Nj(d,x)).(2.3)
Thus,
p(y = l|x, d,x,y, α) =αl +Nj(d,x),l
∑Lk=1(αk +Nj(d,x),k)
.
Additionally, (2.3) allows for the estimation of 95% credible intervals usingthe Dirichlet distribution function.
The posterior mean is often a good choice for a point estimate, but theinterpretation of “mean” here is not clear since the posterior is a distributionover antecedent lists. We thus look for an antecedent list whose statisticsare similar to the posterior mean statistics. Specifically, we are interested infinding a point estimate d whose length m and whose average antecedentcardinality c = 1
m
∑mj=1 cj are close to the posterior mean list length and
average cardinality. Let m be the posterior mean decision list length and ¯cthe posterior mean average antecedent cardinality, as estimated from theMCMC samples. Then, we choose our point estimate d as the list with thehighest posterior probability among all samples with m ∈ {⌊m⌋, ⌈m⌉} andc ∈ [⌊c⌋, ⌈c⌉]. We call this point estimate BRL-point.
Another possible point estimate is the decision list with the highest poste-rior probability—the maximum a posteriori estimate. Given two list lengths,there are many more possible lists of the longer length than of the shorterlength, so prior probabilities in (2.1) are generally higher for shorter lists.The maximum a posteriori estimate might yield a list that is much shorterthan the posterior mean decision list length, so we prefer the BRL-point.
10 LETHAM, RUDIN, MCCORMICK AND MADIGAN
In addition to point estimates, we can use the entire posterior p(d|x,y,A,α,λ, η) to estimate y. The posterior predictive distribution for y is
p(y = l|x,x,y,A, α,λ, η) =∑
d∈D
p(y = l|x,d,x,y,A, α)p(d|x,y,A, α,λ, η)
=∑
d∈D
αl +Nj(d,x),l∑L
k=1(αk +Nj(d,x),k)p(d|x,y,A, α,λ, η),
whereD is the set of all ordered subsets of A. The posterior samples obtainedby MCMC simulation, after burn-in, can be used to approximate this sum.We call the classifier that uses the full collection of posterior samples BRL-post. Using the entire posterior distribution to make a prediction means theclassifier is no longer interpretable. One could, however, use the posteriorpredictive distribution to classify, and then provide several point estimatesfrom the posterior to the user as example explanations for the prediction.
3. Simulation studies. We use simulation studies and a deterministicdata set to show that when data are generated by a decision list model, theBRL (Bayesian Rule Lists; see Section 1) method is able to recover the truedecision list.
3.1. Simulated data sets. Given observations with arbitrary features anda collection of rules on those features, we can construct a binary matrixwhere the rows represent observations and the columns represent rules, andthe entry is 1 if the rule applies to that observation and 0 otherwise. Weneed only simulate this binary matrix to represent the observations withoutlosing generality. For our simulations, we generated independent binary rulesets with 100 rules by setting each feature value to 1 independently withprobability 1/2.
We generated a random decision list of size 5 by selecting 5 rules atrandom, and adding the default rule. Each rule in the decision list wasassigned a consequent distribution over labels using a random draw fromthe Beta(1/2,1/2) distribution, which ensures that the rules are informativeabout labels. Labels were then assigned to each observation using the deci-sion list: For each observation, the label was taken as a draw from the labeldistribution corresponding to the first rule that applied to that observation.
For each number of observations N ∈ {100,250,500,1000,2500,5000}, wegenerated 100 independent data sets (x,y), for a total of 600 simulated datasets. We did MCMC sampling with three chains as described in Section 2for each data set. For all data sets, 20,000 samples were sufficient for thechains to converge.
To appropriately visualize the posterior distribution, we binned the poste-rior antecedent lists according to their distance from the true antecedent list,

INTERPRETABLE CLASSIFIERS USING RULES AND BAYESIAN ANALYSIS 11
Fig. 2. (a) Average Levenshtein distance from posterior samples to the true decisionlist, for differing numbers of observations. The black solid line indicates the median valueacross the 100 simulated data sets of each size, and the gray dashed lines indicate the firstand third quartiles. (b) The proportion of posterior samples with the specified distance tothe true decision list, for a randomly selected simulation with n= 100 observations and arandomly selected simulation with n= 5000.
using the Levenshtein string edit distance [Levenshtein (1965)] to measurethe distance between two antecedent lists. This metric measures the mini-mum number of antecedent substitutions, additions or removals to transformone decision list into the other. The results of the simulations are given inFigure 2.
Figure 2(a) shows that as the number of observations increases, the pos-terior mass concentrates on the true decision list. Figure 2(b) illustrates thisconcentration with two choices of the distribution of posterior distances tothe true decision list, for n small and for n large.
3.2. A deterministic problem. We fit BRL to the Tic–Tac–Toe Endgamedata set from the UCI Machine Learning Repository [Bache and Lichman(2013)] of benchmark data sets. The Tic–Tac–Toe Endgame data set pro-vides all possible end board configurations for the game Tic–Tac–Toe, withthe task of determining if player “X” won or not. The data set is deter-ministic, with exactly 8 ways that player “X” can win, each one of the 8ways to get 3 “X”’s in a row on a 3 × 3 grid. We split the data set into5 folds and did cross-validation to estimate test accuracy. For each fold ofcross-validation, we fit BRL with prior hyperparameters λ = 8 and η = 3,and the point estimate decision list contained the 8 ways to win and thusachieved perfect accuracy. In Table 1, we compare accuracy on the test setwith C5.0, CART, ℓ1-regularized logistic regression (ℓ1-LR), RBF kernelsupport vector machines (SVM), random forests (RF) and Bayesian CART(BCART). The implementation details for these comparison algorithms arein the Appendix. None of these other methods was able to achieve perfect

12 LETHAM, RUDIN, MCCORMICK AND MADIGAN
Table 1
Mean classification accuracy in the top row, with standard deviation in the second row,for machine learning algorithms using 5 folds of cross-validation on the Tic–Tac–Toe
Endgame data set
BRL C5.0 CART ℓ1-LR SVM RF BCART
Mean accuracy 1.00 0.94 0.90 0.98 0.99 0.99 0.71Standard deviation 0.00 0.01 0.04 0.01 0.01 0.01 0.04
accuracy. Decision trees in particular are capable of providing a perfect clas-sifier for this problem, but the greedy learning done by C5.0 and CART didnot find the perfect classifier.
4. Stroke prediction. We used Bayesian Rule Lists to derive a stroke pre-diction model using the MarketScan Medicaid Multi-State Database (MDCD).MDCD contains administrative claims data for 11.1 million Medicaid en-rollees from multiple states. This database forms part of the suite of databasesfrom the Innovation in Medical Evidence Development and Surveillance(IMEDS, http://imeds.reaganudall.org/) program that have beenmapped to a common data model [Stang et al. (2010)].
We extracted every patient in the MDCD database with a diagnosis ofatrial fibrillation, one year of observation time prior to the diagnosis andone year of observation time following the diagnosis (n= 12,586). Of these,1786 (14%) had a stroke within a year of the atrial fibrillation diagnosis.
As candidate predictors, we considered all drugs and all conditions. Specif-ically, for every drug and condition, we created a binary predictor variableindicating the presence or absence of the drug or condition in the full lon-gitudinal record prior to the atrial fibrillation diagnosis. These totaled 4146unique medications and conditions. We included features for age and gender.Specifically, we used the natural values of 50, 60, 70 and 80 years of age assplit points, and for each split point introduced a pair of binary variablesindicating if age was less than or greater than the split point. Consideringboth patients and features, here we apply our method to a data set thatis over 6000 times larger than that originally used to develop the CHADS2score (which had n= 1733 and considered 5 features).
We did five folds of cross-validation. For each fold, we pre-mined the collec-tion of possible antecedents using frequent itemset mining with a minimumsupport threshold of 10% and a maximum cardinality of 2. The total numberof antecedents used ranged from 2162 to 2240 across the folds. We set theantecedent list prior hyperparameters λ and η to 3 and 1, respectively, toobtain a Bayesian decision list of similar complexity to the CHADS2 score.For each fold, we evaluated the performance of the BRL point estimate by

INTERPRETABLE CLASSIFIERS USING RULES AND BAYESIAN ANALYSIS 13
if hemiplegia and age> 60 then stroke risk 58.9% (53.8%–63.8%)else if cerebrovascular disorder then stroke risk 47.8% (44.8%–50.7%)else if transient ischaemic attack then stroke risk 23.8% (19.5%–28.4%)else if occlusion and stenosis of carotid artery without infarction thenstroke risk 15.8% (12.2%–19.6%)else if altered state of consciousness and age> 60 then stroke risk
16.0% (12.2%–20.2%)else if age≤ 70 then stroke risk 4.6% (3.9%–5.4%)else stroke risk 8.7% (7.9%–9.6%)
Fig. 3. Decision list for determining 1-year stroke risk following diagnosis of atrial fibril-lation from patient medical history. The risk given is the mean of the posterior consequentdistribution, and in parentheses is the 95% credible interval.
constructing a receiver operating characteristic (ROC) curve and measuringarea under the curve (AUC) for each fold.
In Figure 3 we show the BRL point estimate recovered from one of thefolds. The list indicates that past history of stroke reveals a lot about thevulnerability toward future stroke. In particular, the first half of the decisionlist focuses on a history of stroke, in order of severity. Hemiplegia, the paral-ysis of an entire side of the body, is often a result of a severe stroke or braininjury. Cerebrovascular disorder indicates a prior stroke, and transient is-chaemic attacks are generally referred to as “mini-strokes.” The second halfof the decision list includes age factors and vascular disease, which are knownrisk factors and are included in the CHA2DS2-VASc score. The BRL-pointlists that we obtained in the 5 folds of cross-validation were all of length 7,a similar complexity to the CHADS2 and CHA2DS2-VASc scores which use5 and 8 features, respectively.
The point estimate lists for all five of the folds of cross-validation are givenin the supplemental material [Letham et al. (2015)]. There is significant over-lap in the antecedents in the point estimates across the folds. This suggeststhat the model may be more stable in practice than decision trees, whichare notorious for producing entirely different models after small changes tothe training set [Breiman (1996a, 1996b)].
In Figure 4 we give ROC curves for all 5 folds for BRL-point, CHADS2and CHA2DS2-VASc, and in Table 2 we report mean AUC across the folds.These results show that with complexity and interpretability similar toCHADS2, the BRL point estimate decision lists performed significantly bet-ter at stroke prediction than both CHADS2 and CHA2DS2-VASc. Interest-ingly, we also found that CHADS2 outperformed CHA2DS2-VASc despiteCHA2DS2-VASc being an extension of CHADS2. This is likely because themodel for the CHA2DS2-VASc score, in which risk factors are added linearly,

14 LETHAM, RUDIN, MCCORMICK AND MADIGAN
Fig. 4. ROC curves for stroke prediction on the MDCD database for each of 5 folds ofcross-validation, for the BRL point estimate, CHADS2 and CHA2DS2-VASc.
is a poor model of actual stroke risk. For instance, the stroke risks estimated
by CHA2DS2-VASc are not a monotonic function of score. Within the orig-inal CHA2DS2-VASc calibration study, Lip et al. (2010a) estimate a strokerisk of 9.6% with a CHA2DS2-VASc score of 7, and a 6.7% risk with a score
of 8. The indication that more stroke risk factors can correspond to a lowerstroke risk suggests that the CHA2DS2-VASc model may be misspecified,and highlights the difficulty in constructing these interpretable models man-
ually.
Table 2
Mean, and in parentheses standard deviation, of AUC and training time across 5 folds ofcross-validation for stroke prediction. Note that the CHADS2 and CHA2DS2-VASc
models are fixed, so no training time is reported
AUC Training time (mins)
BRL-point 0.756 (0.007) 21.48 (6.78)CHADS2 0.721 (0.014) no trainingCHA2DS2-VASc 0.677 (0.007) no trainingCART 0.704 (0.010) 12.62 (0.09)C5.0 0.704 (0.011) 2.56 (0.27)ℓ1 logistic regression 0.767 (0.010) 0.05 (0.00)SVM 0.753 (0.014) 302.89 (8.28)Random forests 0.774 (0.013) 698.56 (59.66)BRL-post 0.775 (0.015) 21.48 (6.78)

INTERPRETABLE CLASSIFIERS USING RULES AND BAYESIAN ANALYSIS 15
The results in Table 2 give the AUC for BRL, CHADS2, CHA2DS2-VASc,along with the same collection of machine learning algorithms used in Sec-tion 3.2. The decision tree algorithms CART and C5.0, the only other in-terpretable classifiers, were outperformed even by CHADS2. The BRL-pointperformance was comparable to that of SVM, and not substantially worsethan ℓ1 logistic regression and random forests. Using the full posterior, BRL-post matched random forests for the best performing method.
All of the methods were applied to the data on the same, single AmazonWeb Services virtual core with a processor speed of approximately 2.5 GHzand 4 GB of memory. Bayesian CART was unable to fit the data since itran out of memory, and so it is not included in Table 2.
The BRL MCMC chains were simulated until convergence, which required50,000 iterations for 4 of the 5 folds, and 100,000 for the fifth. The threechains for each fold were simulated in serial, and the total CPU time requiredper fold is given in Table 2, together with the CPU times required for train-ing the comparison algorithms on the same processor. Table 2 shows thatthe BRL MCMC simulation was more than ten times faster than trainingSVM, and more than thirty times faster than training random forests, usingstandard implementations of these methods as described in the Appendix.
4.1. Additional experiments. We further investigated the properties andperformance of the BRL by applying it to two subsets of the data, femalepatients only and male patients only. The female data set contained 8368observations, and the number of pre-mined antecedents in each of 5 foldsranged from 1982 to 2197. The male data set contained 4218 observations,and the number of pre-mined antecedents in each of 5 folds ranged from 1629to 1709. BRL MCMC simulations and comparison algorithm training weredone on the same processor as the full experiment. The AUC and trainingtime across five folds for each of the data sets is given in Table 3.
The BRL point estimate again outperformed the other interpretable mod-els (CHADS2, CHA2DS2-VASc, CART and C5.0), and the BRL-post perfor-mance matched that of random forests for the best performing method. Asbefore, BRL MCMC simulation required significantly less time than SVM orrandom forests training. Point estimate lists for these additional experimentsare given in the supplemental materials [Letham et al. (2015)].
5. Related work and discussion. Most widely used medical scoring sys-tems are designed to be interpretable, but are not necessarily optimized foraccuracy, and generally are derived from few factors. The Thrombolysis InMyocardial Infarction (TIMI) Score [Antman et al. (2000)], Apache II scorefor infant mortality in the ICU [Knaus et al. (1985)], the CURB-65 score forpredicting mortality in community-acquired pneumonia [Lim et al. (2003)]and the CHADS2 score [Gage et al. (2001)] are examples of interpretable

16 LETHAM, RUDIN, MCCORMICK AND MADIGAN
Table 3
Mean, and in parentheses standard deviation, of AUC and training time (mins) across 5folds of cross-validation for stroke prediction
Female patients Male patients
AUC Training time AUC Training time
BRL-point 0.747 (0.028) 9.12 (4.70) 0.738 (0.027) 6.25 (3.70)CHADS2 0.717 (0.018) no training 0.730 (0.035) no trainingCHA2DS2-VASc 0.671 (0.021) no training 0.701 (0.030) no trainingCART 0.704 (0.024) 7.41 (0.14) 0.581 (0.111) 2.69 (0.04)C5.0 0.707 (0.023) 1.30 (0.09) 0.539 (0.086) 0.55 (0.01)ℓ1 logistic regression 0.755 (0.025) 0.04 (0.00) 0.739 (0.036) 0.01 (0.00)SVM 0.739 (0.021) 56.00 (0.73) 0.753 (0.035) 11.05 (0.18)Random forests 0.764 (0.022) 389.28 (33.07) 0.773 (0.029) 116.98 (12.12)BRL-post 0.765 (0.025) 9.12 (4.70) 0.778 (0.018) 6.25 (3.70)
predictive models that are very widely used. Each of these scoring systemsinvolves very few calculations and could be computed by hand during a doc-tor’s visit. In the construction of each of these models, heuristics were usedto design the features and coefficients for the model; none of these modelswas fully learned from data.
In contrast with these hand-designed interpretable medical scoring sys-tems, recent advances in the collection and storing of medical data presentunprecedented opportunities to develop powerful models that can predict awide variety of outcomes [Shmueli (2010)]. The front-end user interface ofmedical risk assessment tools are increasingly available online (e.g., http://www.r-calc.com). At the end of the assessment, a patient may be told heor she has a high risk for a particular outcome but without understandingwhy the predicted risk is high, particularly if many pieces of informationwere used to make the prediction.
In general, humans can handle only a handful of cognitive entities at once[Miller (1956), Jennings, Amabile and Ross (1982)]. It has long since beenhypothesized that simple models predict well, both in the machine learningliterature [Holte (1993)] and in the psychology literature [Dawes (1979)]. Therelated concepts of explanation and comprehensibility in statistical modelinghave been explored in many past works [Bratko (1997), Madigan, Mosurskiand Almond (1997), Giraud-Carrier (1998), Ruping (2006), Huysmans et al.(2011), Vellido, Martın-Guerrero and Lisboa (2012), Freitas (2014), e.g.].
Decision lists have the same form as models used in the expert systemsliterature from the 1970s and 1980s [Leondes (2002)], which were among thefirst successful types of artificial intelligence. The knowledge base of an ex-pert system is composed of natural language statements that are if. . . then. . .rules. Decision lists are a type of associative classifier, meaning that the list

INTERPRETABLE CLASSIFIERS USING RULES AND BAYESIAN ANALYSIS 17
is formed from association rules. In the past, associative classifiers have beenconstructed from heuristic greedy sorting mechanisms [Rivest (1987), Liu,Hsu and Ma (1998), Marchand and Sokolova (2005), Rudin, Letham andMadigan (2013)]. Some of these sorting mechanisms work provably well inspecial cases, for instance, when the decision problem is easy and the classesare easy to separate, but are not optimized to handle more general prob-lems. Sometimes associative classifiers are formed by averaging several rulestogether, or having the rules each vote on the label and then combining thevotes, but the resulting classifier is not generally interpretable [Li, Han andPei (2001), Yin and Han (2003), Friedman and Popescu (2008), Meinshausen(2010)].
In a previous paper we proved that the VC dimension of decision listclassifiers equals |A|, the number of antecedents used to learn the model[Theorem 3, Rudin, Letham and Madigan (2013)]. This result leads to auniform generalization bound for decision lists [Corollary 4, Rudin, Lethamand Madigan (2013)]. This is the same as the VC dimension obtained byusing the antecedents as features in a linear model, thus we have the sameprediction guarantees. We then expect similar generalization behavior fordecision lists and weighted linear combination models.
BRL interacts with the feature space only through the collection of an-tecedents A. The computational effort scales with the number of antecedents,not the number of features, meaning there will generally be less computa-tion when the data are sparse. This means that BRL tends to scale with thesparsity of the data rather than the number of features.
Decision trees are closely related to decision lists, and are in some senseequivalent: any decision tree can be expressed as a decision list, and any de-cision list is a one-sided decision tree. Decision trees are almost always con-structed greedily from the top down, and then pruned heuristically upwardand cross-validated to ensure accuracy. Because the trees are not fully opti-mized, if the top of the decision tree happened to have been chosen badly atthe start of the procedure, it could cause problems with both accuracy andinterpretability. Bayesian decision trees [Chipman, George and McCulloch(1998, 2002), Denison, Mallick and Smith (1998)] use Markov chain MonteCarlo (MCMC) to sample from a posterior distribution over trees. Since theywere first proposed, several improvements and extensions have been madein both sampling methods and model structure [Wu, Tjelmeland and West(2007), Chipman, George and McCulloch (2010), Taddy, Gramacy and Pol-son (2011)]. The space of decision lists using pre-mined rules is significantlysmaller than the space of decision trees, making it substantially easier to ob-tain MCMC convergence and to avoid the pitfalls of local optima. Moreover,rule mining allows for the rules to be individually powerful. Constructing asingle decision tree is extremely fast, but sampling over the space of decisiontrees is extremely difficult (unless one is satisfied with local maxima). To

18 LETHAM, RUDIN, MCCORMICK AND MADIGAN
contrast this with our approach, the rule mining step is extremely fast, yetsampling over the space of decision lists is very practical.
There is a subfield of artificial intelligence, Inductive Logic Programming[Muggleton and De Raedt (1994)], whose goal is to mine individual con-junctive rules. It is possible to replace the frequent itemset miner with aninductive logic programming technique, but this generally leads to losses inpredictive accuracy; ideally, we would use a large number of diverse rules asantecedents, rather than a few (highly overlapping) complex rules as wouldbe produced by an ILP algorithm. In our experiments to a follow-up work[Wang and Rudin (2015)], the use of an ILP algorithm resulted in a sub-stantial loss in performance.
Interpretable models are generally not unique (stable), in the sense thatthere may be many equally good models, and it is not clear in advancewhich one will be returned by the algorithm. For most problems, the spaceof high quality predictive models is fairly large [called the “Rashomon Ef-fect” Breiman (2001b)], so we cannot expect uniqueness. In practice, as weshowed, the rule lists across test folds were very similar, but if one desiresstability to small perturbations in the data generally, we recommend usingthe full posterior rather than a point estimate. The fact that many highperforming rule lists exist can be helpful, since it means the user has manychoices of which model to use.
This work is related to the Hierarchical Association Rule Model (HARM),a Bayesian model that uses rules [McCormick, Rudin and Madigan (2012)].HARM estimates the conditional probabilities of each rule jointly in a con-servative way. Each rule acts as a separate predictive model, so HARM doesnot explicitly aim to learn an ordering of rules.
There are related works on learning decision lists from an optimizationperspective. In particular, the work of Rudin and Ertekin (2015) uses mixed-integer programming to build a rule list out of association rules, which hasguarantees on optimality of the solution. Similarly to that work, Goh andRudin (2014) fully learn sparse disjunctions of conjunctions using optimiza-tion methods.
There have been several follow-up works that directly extend and applyBayesian Rule Lists. The work of Wang and Rudin (2015) on Falling RuleLists provides a nontrivial extension to BRL whereby the probabilities forthe rules are monotonically decreasing down the list. Wang et al. (2015) builddisjunctions of conjunctive rules using a Bayesian framework similar to theone in this work. Zhang et al. (2015) have taken an interesting approach toconstructing optimal treatment regimes using a BRL-like method, where,in addition to the criteria of accuracy, the rule list has a decision cost forevaluating it. It is possible to use BRL itself for that purpose as well, as onecould give preference to particular antecedents that cost less. This sort ofpreference could be expressed in the antecedent prior distribution in (2.2).

INTERPRETABLE CLASSIFIERS USING RULES AND BAYESIAN ANALYSIS 19
King, Lam and Roberts (2014) have taken a Bayesian Rule List approach tohandle a challenging problem in text analysis, which is to build a keyword-based classifier that is easier to understand in order to solicit high qualityhuman input. Souillard-Mandar et al. (2015) applied Bayesian Rule Listsand Falling Rule Lists to the problem of screening for cognitive disorderssuch as Alzheimer’s disease based on the digitized pen strokes of patientsduring the Clock Drawing test.
Shorter preliminary versions of this work are those of Letham et al. (2013,2014). Letham et al. (2013) used a different prior and called the algorithmthe Bayesian List Machine.
6. Conclusion. We are working under the hypothesis that many real datasets permit predictive models that can be surprisingly small. This was hy-pothesized over two decades decade ago [Holte (1993)]; however, we now arestarting to have the computational tools to truly test this hypothesis. TheBRL method introduced in this work aims to hit the “sweet spot” betweenpredictive accuracy, interpretability and tractability.
Interpretable models have the benefits of being both concise and con-vincing. A small set of trustworthy rules can be the key to communicat-ing with domain experts and to allowing machine learning algorithms tobe more widely implemented and trusted. In practice, a preliminary inter-pretable model can help domain experts to troubleshoot the inner workingsof a complex model, in order to make it more accurate and tailored to thedomain. We demonstrated that interpretable models lend themselves to thedomain of predictive medicine, and there is a much wider variety of domainsin science, engineering and industry, where these models would be a naturalchoice.
APPENDIX
Comparison algorithm implementations. Support vector machines: LIB-SVM [Chang and Lin (2011)] with a radial basis function kernel. We selectedthe slack parameter CSVM and the kernel parameter γ using a grid searchover the ranges CSVM ∈ {2−2,20, . . . ,26} and γ ∈ {2−6,2−4, . . . ,22}. We chosethe set of parameters with the best 3-fold cross-validation performance usingLIBSVM’s built-in cross-validation routine. C5.0 : The R library “C50” withdefault settings. CART : The R library “rpart” with default parameters andpruned using the complexity parameter that minimized cross-validation er-ror. Logistic regression: The LIBLINEAR [Fan et al. (2008)] implementationof logistic regression with ℓ1 regularization. We selected the regularizationparameter CLR from {2−6,2−4, . . . ,26} as that with the best 3-fold cross-validation performance, using LIBLINEAR’s built-in cross-validation rou-tine. Random forests: The R library “randomForest.” The optimal value for

20 LETHAM, RUDIN, MCCORMICK AND MADIGAN
the parameter “mtry” was found using “tuneRF,” with its default 50 trees.The optimal “mtry” was then used to fit a random forests model with 500trees, the library default. Bayesian CART : The R library “tgp,” function“bcart” with default settings.
Acknowledgments. The authors thank Zachary Shahn and the OMOPteam for help with the data.
SUPPLEMENTARY MATERIAL
Computer code (DOI: 10.1214/15-AOAS848SUPPA; .zip). Our Pythoncode used to fit decision lists to data, along with an example data set.
BRL point estimates (DOI: 10.1214/15-AOAS848SUPPB; .pdf). The BRLpoint estimates for all of the cross-validation folds for the stroke predictionexperiment, and BRL-point estimates for the female-only and male-only ex-periments.
REFERENCES
Agrawal, R. and Srikant, R. (1994). Fast algorithms for mining association rules. InVLDB’94 Proceedings of the 20th International Conference on Very Large Databases487–499. Morgan Kaufmann, San Francisco, CA.
Antman, E. M., Cohen, M., Bernink, P. J. L. M., McCabe, C. H., Horacek, T.,Papuchis, G., Mautner, B., Corbalan, R., Radley, D. and Braunwald, E.
(2000). The TIMI risk score for unstable angina/non-ST elevation MI: A method forprognostication and therapeutic decision making. JAMA 284 835–842.
Bache, K. and Lichman, M. (2013). UCI machine learning repository. Available athttp://archive.ics.uci.edu/ml.
Borgelt, C. (2005). An implementation of the FP-growth algorithm. In OSDM’05 Pro-ceedings of the 1st International Workshop on Open Source Data Mining: FrequentPattern Mining Implementations 1–5. ACM, New York.
Bratko, I. (1997). Machine learning: Between accuracy and interpretability. In Learn-ing, Networks and Statistics (G. Della Riccia, H.-J. Lenz and R. Kruse, eds.).International Centre for Mechanical Sciences 382 163–177. Springer, Vienna.
Breiman, L. (1996a). Bagging predictors. Mach. Learn. 24 123–140.Breiman, L. (1996b). Heuristics of instability and stabilization in model selection. Ann.
Statist. 24 2350–2383. MR1425957Breiman, L. (2001a). Random forests. Mach. Learn. 45 5–32.Breiman, L. (2001b). Statistical modeling: The two cultures. Statist. Sci. 16 199–231.
MR1874152Breiman, L., Friedman, J. H., Olshen, R. A. and Stone, C. J. (1984). Classification
and Regression Trees. Wadsworth, Belmont, CA.Chang, C.-C. and Lin, C.-J. (2011). LIBSVM: A library for support vector machines.
ACM Transactions on Intelligent Systems and Technology 2 27:1–27:27.Chipman, H. A., George, E. I. and McCulloch, R. E. (1998). Bayesian CART model
search. J. Amer. Statist. Assoc. 93 935–948.Chipman, H. A., George, E. I. and McCulloch, R. E. (2002). Bayesian treed models.
Mach. Learn. 48 299–320.

INTERPRETABLE CLASSIFIERS USING RULES AND BAYESIAN ANALYSIS 21
Chipman, H. A., George, E. I. and McCulloch, R. E. (2010). BART: Bayesian addi-tive regression trees. Ann. Appl. Stat. 4 266–298. MR2758172
Dawes, R. M. (1979). The robust beauty of improper linear models in decision making.American Psychologist 34 571–582.
Denison, D. G. T., Mallick, B. K. and Smith, A. F. M. (1998). A Bayesian CARTalgorithm. Biometrika 85 363–377. MR1649118
Dougherty, J., Kohavi, R. and Sahami, M. (1995). Supervised and unsupervised dis-cretization of continuous features. In ICML’95 Proceedings of the 12th InternationalConference on Machine Learning 194–202. Morgan Kaufmann, San Francisco, CA.
Fan, R.-E., Chang, K.-W., Hsieh, C.-J., Wang, X.-R. and Lin, C.-J. (2008). LIBLIN-EAR: A library for large linear classification. J. Mach. Learn. Res. 9 1871–1874.
Fayyad, U. M. and Irani, K. B. (1993). Multi-interval discretization of continuous-valuedattributes for classification learning. In IJCAI’93 Proceedings of the 1993 InternationalJoint Conference on Artificial Intelligence 1022–1027. Morgan Kaufmann, San Fran-cisco, CA.
Freitas, A. A. (2014). Comprehensible classification models: A position paper. ACMSIGKDD Explorations Newsletter 15 1–10.
Friedman, J. H. and Popescu, B. E. (2008). Predictive learning via rule ensembles.Ann. Appl. Stat. 2 916–954. MR2522175
Gage, B. F., Waterman, A. D., Shannon, W., Boechler, M., Rich, M. W. andRadford, M. J. (2001). Validation of clinical classification schemes for predictingstroke. Journal of the American Medical Association 285 2864–2870.
Gelman, A. and Rubin, D. B. (1992). Inference from iterative simulation using multiplesequences. Statist. Sci. 7 457–472.
Giraud-Carrier, C. (1998). Beyond predictive accuracy: What? Technical report, Univ.Bristol, Bristol, UK.
Goh, S. T. and Rudin, C. (2014). Box drawings for learning with imbalanced data. InKDD’14 Proceedings of the 20th ACM SIGKDD Conference on Knowledge Discoveryand Data Mining 333–342. DOI:10.1145/2623330.2623648.
Holte, R. C. (1993). Very simple classification rules perform well on most commonlyused datasets. Mach. Learn. 11 63–91.
Huysmans, J., Dejaeger, K., Mues, C., Vanthienen, J. and Baesens, B. (2011).An empirical evaluation of the comprehensibility of decision table, tree and rule basedpredictive models. Decision Support Systems 51 141–154.
Jennings, D. L., Amabile, T. M. and Ross, L. (1982). Informal covariation assess-ments: Data-based versus theory-based judgements. In Judgment Under Uncertainty:Heuristics and Biases, (D. Kahneman, P. Slovic and A. Tversky, eds.) 211–230.Cambridge Univ. Press, Cambridge, MA.
King, G., Lam, P. and Roberts, M. (2014). Computer-assisted keyword and documentset discovery from unstructured text. Technical report, Harvard.
Knaus, W. A.,Draper, E. A.,Wagner, D. P. and Zimmerman, J. E. (1985). APACHEII: A severity of disease classification system. Critical Care Medicine 13 818–829.
Leondes, C. T. (2002). Expert Systems: The Technology of Knowledge Management andDecision Making for the 21st Century. Academic Press, San Diego, CA.
Letham, B., Rudin, C., McCormick, T. H. and Madigan, D. (2013). An interpretablestroke prediction model using rules and Bayesian analysis. In Proceedings of AAAI LateBreaking Track. MIT, Cambridge, MA.
Letham, B., Rudin, C., McCormick, T. H. and Madigan, D. (2014). An interpretablemodel for stroke prediction using rules and Bayesian analysis. In Proceedings of 2014KDD Workshop on Data Science for Social Good. MIT, Cambridge, MA.

22 LETHAM, RUDIN, MCCORMICK AND MADIGAN
Letham, B., Rudin, C., McCormick, T. H. and Madigan, D. (2015). Supplement to“Interpretable classifiers using rules and Bayesian analysis: Building a better stroke pre-diction model.” DOI:10.1214/15-AOAS848SUPPA, DOI:10.1214/15-AOAS848SUPPB.
Levenshtein, V. I. (1965). Binary codes capable of correcting deletions, insertions, andreversals. Soviet Physics Dokl. 10 707–710. MR0189928
Li, W., Han, J. and Pei, J. (2001). CMAR: Accurate and efficient classification based onmultiple class-association rules. In Proceedings of the IEEE International Conferenceon Data Mining 369–376. IEEE, New York.
Lim, W. S., van der Eerden, M. M., Laing, R., Boersma, W. G., Karalus, N.,Town, G. I., Lewis, S. A. and Macfarlane, J. T. (2003). Defining communityacquired pneumonia severity on presentation to hospital: An international derivationand validation study. Thorax 58 377–382.
Lip, G. Y. H., Frison, L., Halperin, J. L. and Lane, D. A. (2010a). Identifyingpatients at high risk for stroke despite anticoagulation: A comparison of contemporarystroke risk stratification schemes in an anticoagulated atrial fibrillation cohort. Stroke41 2731–2738.
Lip, G. Y. H., Nieuwlaat, R., Pisters, R., Lane, D. A. and Crijns, H. J. G. M.
(2010b). Refining clinical risk stratification for predicting stroke and thromboembolismin atrial fibrillation using a novel risk factor-based approach: The euro heart survey onatrial fibrillation. Chest 137 263–272.
Liu, B., Hsu, W. and Ma, Y. (1998). Integrating classification and association rule min-ing. In KDD’98 Proceedings of the 4th International Conference on Knowledge Discov-ery and Data Mining 80–96. AAAI Press, Palo Alto, CA.
Madigan, D., Mittal, S. and Roberts, F. (2011). Efficient sequential decision-making algorithms for container inspection operations. Naval Res. Logist. 58 637–654.MR2842551
Madigan, D., Mosurski, K. and Almond, R. G. (1997). Explanation in belief networks.J. Comput. Graph. Statist. 6 160–181.
Marchand, M. and Sokolova, M. (2005). Learning with decision lists of data-dependentfeatures. J. Mach. Learn. Res. 6 427–451. MR2249827
McCormick, T. H., Rudin, C. and Madigan, D. (2012). Bayesian hierarchical rulemodeling for predicting medical conditions. Ann. Appl. Stat. 6 622–668. MR2976486
Meinshausen, N. (2010). Node harvest. Ann. Appl. Stat. 4 2049–2072. MR2829946Miller, G. A. (1956). The magical number seven, plus or minus two: Some limits to our
capacity for processing information. The Psychological Review 63 81–97.Muggleton, S. and De Raedt, L. (1994). Inductive logic programming: Theory and
methods. J. Logic Programming 19 629–679. MR1279936Quinlan, J. R. (1993). C4.5: Programs for Machine Learning. Morgan Kaufmann, San
Mateo.Rivest, R. L. (1987). Learning decision lists. Mach. Learn. 2 229–246.Rudin, C. and Ertekin, S. (2015). Learning optimized lists of classification rules. Tech-
nical report, MIT, Cambridge, MA.Rudin, C., Letham, B. andMadigan, D. (2013). Learning theory analysis for association
rules and sequential event prediction. J. Mach. Learn. Res. 14 3441–3492. MR3144468Ruping, S. (2006). Learning interpretable models. Ph.D. thesis, Univ. Dortmund.Shmueli, G. (2010). To explain or to predict? Statist. Sci. 25 289–310. MR2791669Souillard-Mandar, W., Davis, R., Rudin, C., Au, R., Libon, D. J., Swenson, R.,
Price, C. C., Lamar, M. and Penney, D. L. (2015). Learning classification modelsof cognitive conditions from subtle behaviors in the digital clock drawing test. MachineLearning. To appear.

INTERPRETABLE CLASSIFIERS USING RULES AND BAYESIAN ANALYSIS 23
Srikant, R. and Agrawal, R. (1996). Mining quantitative association rules in largerelational tables. In SIGMOD’96 Proceedings of the 1996 ACM SIGMOD InternationalConference on Management of Data 1–12. ACM, New York.
Stang, P. E., Ryan, P. B., Racoosin, J. A., Overhage, J. M., Hartzema, A. G.,Reich, C., Welebob, E., Scarnecchia, T. and Woodcock, J. (2010). Advancingthe science for active surveillance: Rationale and design for the observational medicaloutcomes partnership. Ann. Intern. Med. 153 600–606.
Taddy, M. A., Gramacy, R. B. and Polson, N. G. (2011). Dynamic trees for learningand design. J. Amer. Statist. Assoc. 106 109–123. MR2816706
Vapnik, V. N. (1995). The Nature of Statistical Learning Theory. Springer, New York.MR1367965
Vellido, A., Martın-Guerrero, J. D. and Lisboa, P. J. G. (2012). Making machinelearning models interpretable. In Proceedings of the European Symposium on ArtificialNeural Networks, Computational Intelligence and Machine Learning. ESANN, Bruges.
Wang, F. and Rudin, C. (2015). Falling rule lists. In JMLR Workshop and ConferenceProceedings 38 1013–1022. San Diego, CA.
Wang, T., Rudin, C., Doshi, F., Liu, Y., Klampfl, E. and MacNeille, P. (2015).Bayesian or’s of and’s for interpretable classification with application to context awarerecommender systems. Available at arXiv:1504.07614.
Wu, Y., Tjelmeland, H. and West, M. (2007). Bayesian CART: Prior specificationand posterior simulation. J. Comput. Graph. Statist. 16 44–66. MR2345747
Wu, X., Zhang, C. and Zhang, S. (2004). Efficient mining of both positive and negativeassociation rules. ACM Transactions on Information Systems 22 381–405.
Yin, X. and Han, J. (2003). CPAR: Classification based on predictive association rules.In ICDM’03 Proceedings of the 2003 SIAM International Conference on Data Mining331–335. SIAM, Philadelphia, PA.
Zaki, M. J. (2000). Scalable algorithms for association mining. IEEE Transactions onKnowledge and Data Engineering 12 372–390.
Zhang, Y., Laber, E. B., Tsiatis, A. and Davidian, M. (2015). Using decisionlists to construct interpretable and parsimonious treatment regimes. Available atarXiv:1504.07715.
B. Letham
Operations Research Center
Massachusetts Institute of Technology
Cambridge, Massachusetts 02139
USA
E-mail: [email protected]
C. Rudin
Computer Science and
Artificial Intelligence Laboratory
Massachusetts Institute of Technology
Cambridge, Massachusetts 02139
USA
E-mail: [email protected]
T. H. McCormick
Department of Statistics
Department of Sociology
University of Washington
Seattle, Washington 98105
USA
E-mail: [email protected]
D. Madigan
Department of Statistics
Columbia University
New York, New York 10027
USA
E-mail: [email protected]