Embed Size (px)
Citation preview
2013 International Nuclear Atlantic Conference - INAC 2013 Recife, PE, Brazil, November 24-29, 2013 ASSOCIAÇÃO BRASILEIRA DE ENERGIA NUCLEAR - ABEN ISBN: 978-85-99141-05-2
ANALYSIS AND OPTIMIZATION OF A TUBULAR SOFC, USING NUCLEAR
HYDROGEN AS FUEL.
Daniel G. Rodríguez 1, Lázaro R. G. Parra 1, Carlos R. G. Fernández 1, Carlos A. B. O. Lira 2 1 Departamento de Ingeniería Nuclear, Instituto Superior de Tecnologías y Ciencias Aplicadas
Ave. Salvador Allende esq. Luaces 0537-8789862 La Habana, Cuba [email protected]
2Departamento de Energia Nuclear, Universidade Federal de Pernambuco
Av. Professor Luiz Freire, 1000 Cidade Universitaria, Recife, PE [email protected]
ABSTRACT
One of the main areas of hydrogen uses as an energy carrier is in fuel cells of high standards as solid oxide fuel cells (SOFC). The SOFCs are fuel cells operate at high temperatures making them ideal for use in large power systems, suitable for distributed generation of electricity. Optimization and analysis of these electrochemical devices is an area of great current study. The computational fluid dynamics software (CFD) have unique advantages for analyzing the influence of design parameters on the efficiency of fuel cells. This paper presents a SOFC design cell which employ as fuel hydrogen produced by thermochemical water splitting cycle (I-S). There will be done the optimization of the main parameters thermodynamic and electrochemical cell operating to achieve top performance. Also will be estimate the cell efficiency and a production-consumption hydrogen system.
1. INTRODUCTION
In recent years it has developed a high scientific activity on production, energy storage and conversion, returning contributions that were discarded old at the time by a large and unjustified cost. The classic example of a technology reborn as are fuel cells. Fuel cells have been known for over 50 years, but its practical application was rejected due to the high costs of the technology and the limited development of materials science. However, today fuel cells are one of the main objects of study of science devoted to energy as they have become one of the most promising sustainable energy system.
There are several types of fuel cells as SOFC (Solid Oxide Fuel Cell), PAFC (Phosphoric Acid Fuel Cell) and MCF (Molten Carbonated Fuel Cell) that because of theirs operating parameters are used mainly in applications stationary power generation. Yet despite the growing interest of society in these devices use is not yet in the desired state, the cause of this behavior could be the high cost of ceramic materials and the still incipient hydrogen economy makes it difficult to acquire fuel [1].
The fuel cell systems are composed of:
• Unit Cells: where electrochemical reactions take place. • Stack: structure where the cells are combined to produce the desired output power.
• Components of the cell: all devices that ensure design of inflows, temperature management and electrical power.
INAC 2013, Recife, PE, Brazil.
The solid oxide fuel cell allow a wide range of fuel to use, not only pure hydrogen, but also carbon-based fuels. The high pressure and temperature parameters allow to reach higher values of efficiency, and internal reforming residual temperature values that allow its use for cogeneration. [1]
Although the values of the efficiency achieved in SOFC cell systems is the highest of these devices [2], its dependence on operating parameters of the cell and design is a problem widely studied in the literature. Achieve the maximum performance from a cell is an optimization process that involves electrochemical, thermodynamic and geometric aspects. The use of software of computational fluid dynamics (CFD) allows the optimization of some of the most important parameters of a cell SOFC [3]. It is clear that if is desirable to reach a hydrogen economy scenario is necessary massively produce it and from various energy sources to ensure adequate supplies. Some generation III + or generation IV nuclear reactors were designed at operating temperature capable of reaching optimal values for the production of hydrogen by thermo-chemical dissociation of water. IS cycle (Iodine-Sulfur) is one of the most widely studied methods for obtaining hydrogen on a large scale, it can be coupled to a high solar plant parameters and a very high temperature reactor (VHTR) or a system driven by accelerator (ADS) [4]. In this work is made the estimation and optimization of a SOFC fuel cell that uses hydrogen as fuel produced by the IS cycle thermochemical water dissociation. The power source for the cycle IS is an accelerator driven system (ADS) developed by [5].
2. NUCLEAR HYDROGEN PRODUCTION.
2.1. ADS conceptual design
The hydrogen production device proposed in this paper is an ADS based on a pebble-bed subcritical nuclear core cooled by helium and driven by a proton accelerator, which was conceived from a starting conceptual design [6]. The high-temperature process heat required to drive the S-I process is provided by the hot helium exiting the ADS core. The nuclear facility is connected to the hydrogen production plant where the thermochemical S-I process takes place [7]; this is a technological choice that has been considered in detail for nuclear-based hydrogen generation, for example, using as the nuclear facility a Very High Temperature Reactor (VHTR) [8-10].
2.2. The sulfur-iodine (S-I) process
The use of heat from nuclear reactors to drive a sulfur-iodine thermochemical hydrogen production process has been the interest of many laboratories in the world. One of the promising approaches to produce large quantities of hydrogen in an efficient way using nuclear energy, is the sulfur-iodine thermochemical water splitting cycle. Thermochemical water splitting sulfur-iodine cycle for hydrogen production consists of three chemical reactions:
I2(s) + SO2 (g) + 2H2O (l) = 2HI (ac) + H2SO4 (ac) T = 120 oC (1)
2H2SO4 (g) = 2SO2 (g) + 2H2O (g) + O2 (g) T = 850 oC (2)
2HI (g) = I2 (g) + H2 (g) T = 450oC (3)
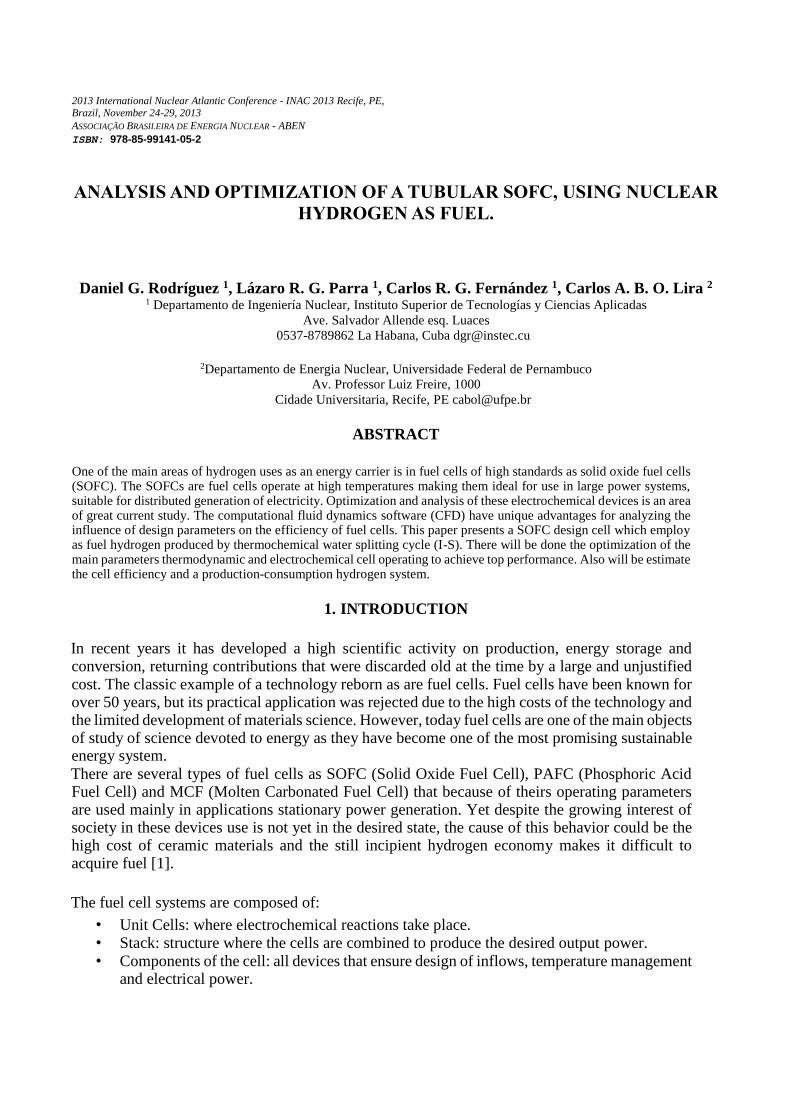
In the work developed by [11] is obtained a model for a complete process cycle SI thermochemical water dissociation (Fig. 1).
INAC 2013, Recife, PE, Brazil.
Figure 1: Flowsheet developed for the whole S-I cycle by [11].
The independence of the H2 mass flow value with the temperature is an important result because allows the decomposition of the 100 % of the HI incorporated into the section. Besides, the cycle could be implemented at lower temperatures and still the same mass flow of H2 and therefore, the same thermal efficiency of the process, would be obtained. The mass flow of hydrogen produced is QH2 =1.9420 kg/s regardless the temperature value, in the studied inlet the studied range. This value represents an energy of QH2,out= 65.2317 kW/h.
3. FUEL CELL SIMULATION.
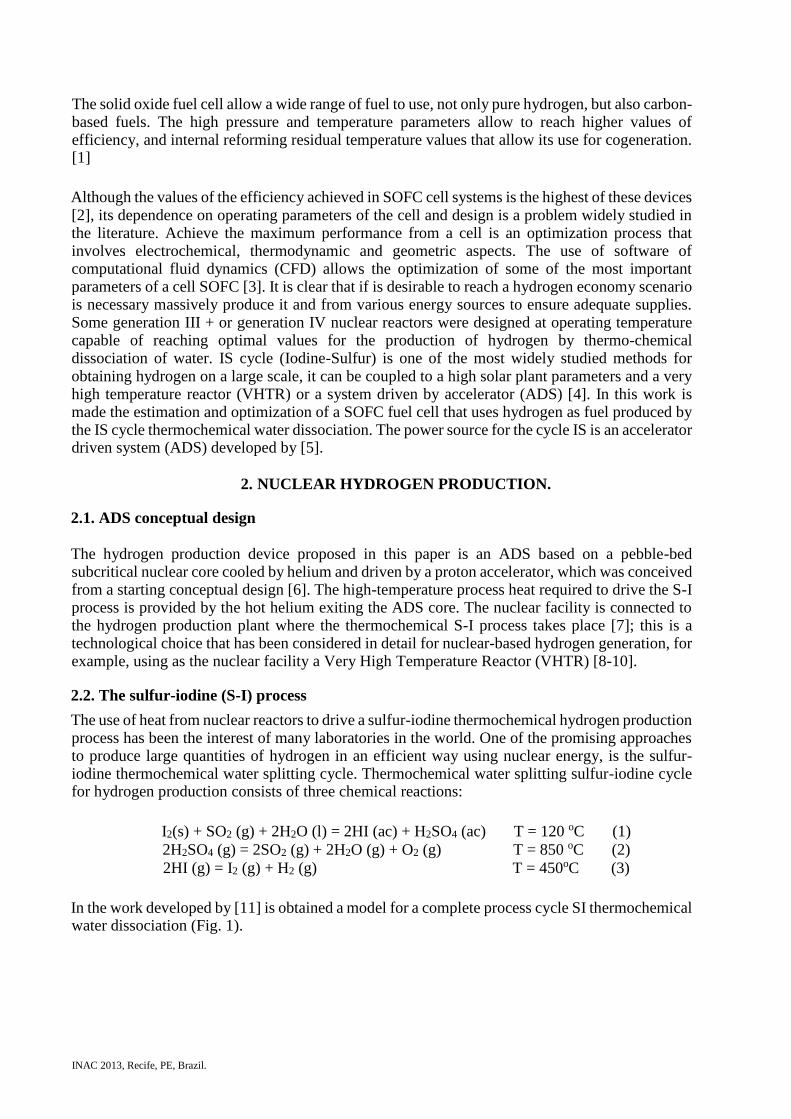
The object of study of this work is a fuel cell tubular SOFC, these have numerous design variants according to the configuration of theirs components. This paper deals with a standard tubular geometry. In Figure 2 a) is shown the configuration of the components in the cell studied in this paper.
a) b)
Figure 2: a) Configuration of SOFC components. b) Dimensions of the model proposed in
mm.
The SOFC is a compact device, which is composed uniquely of solids components, unlike other types of fuel cells having liquid electrolytes. The cell analyzed has a length of 150 mm, the dimensions of the cross section of the cell (in millimeters) is shown in Figure 2 b). At the entrance of the reactants is placed a cylinder which ensures proper flow distribution in the flow channels of gases. This part is not considered in the analysis of cell length because no provides electrolyte
INAC 2013, Recife, PE, Brazil.
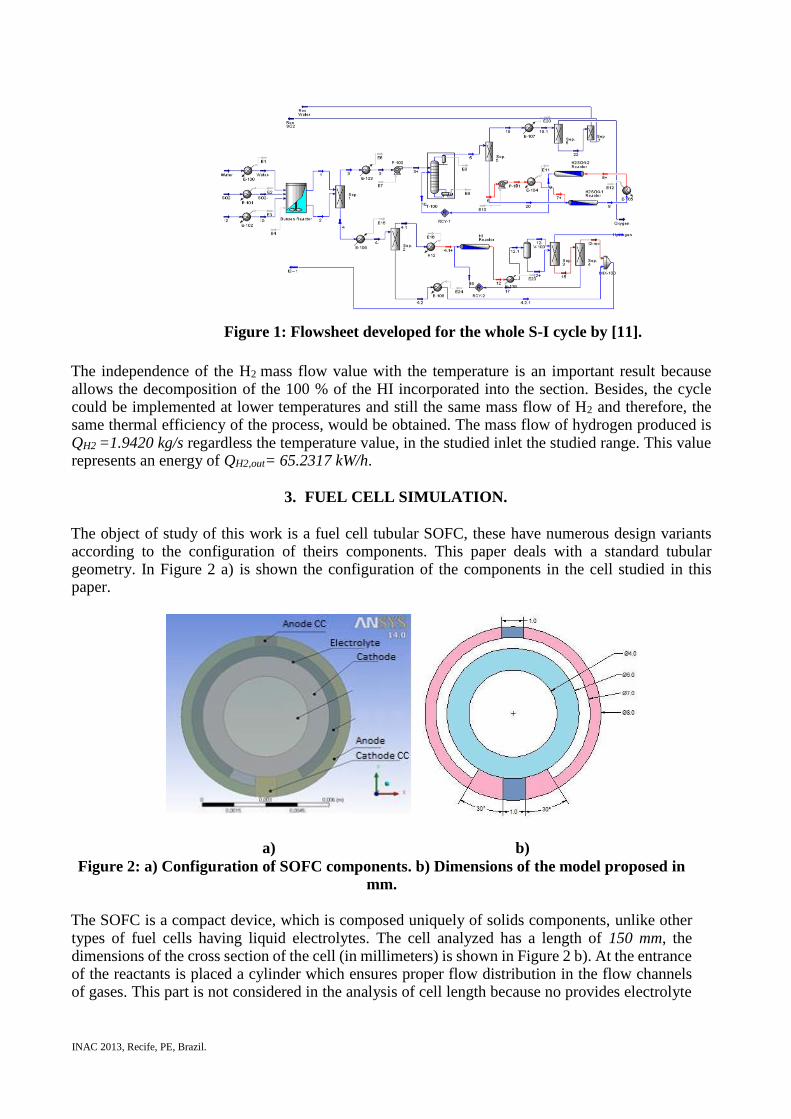
effective surface for the occurrence of the reaction, it function is exclusively hydrodynamic. Figure 3 shows an axonometric view of the geometry analyzed.
Figure 3: General view of the SOFC analyzed.
3.1. Geometry discretization and boundary conditions.
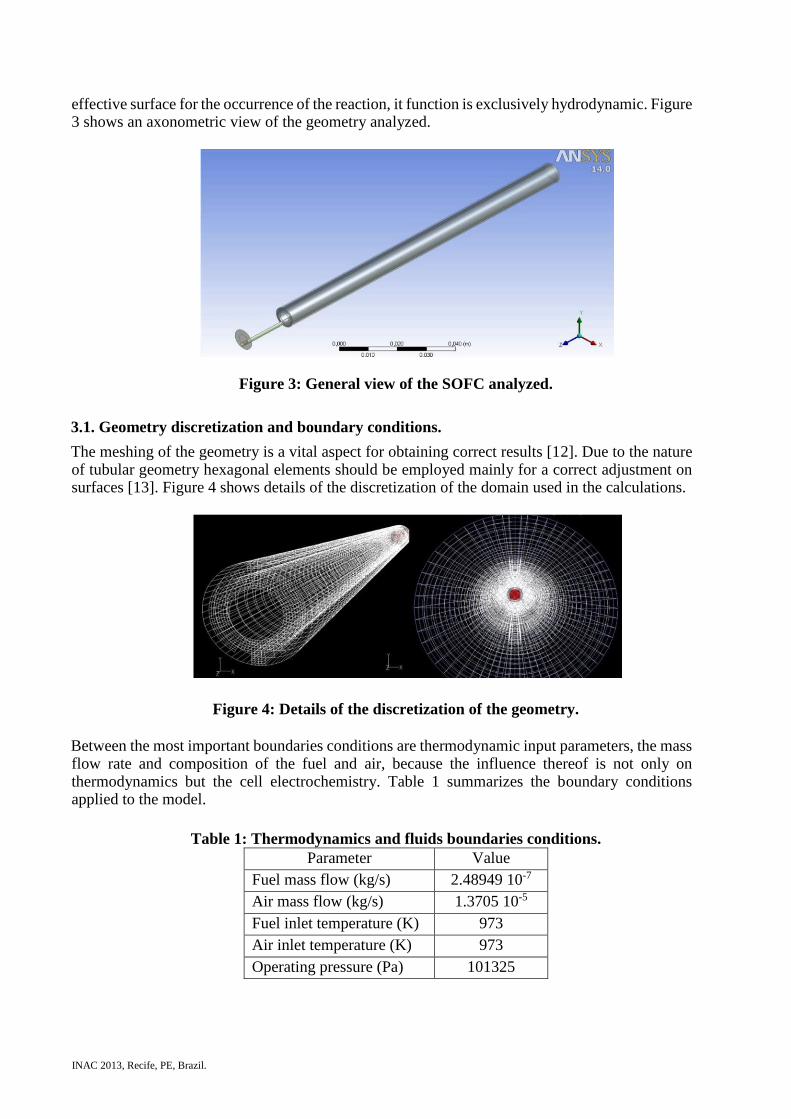
The meshing of the geometry is a vital aspect for obtaining correct results [12]. Due to the nature of tubular geometry hexagonal elements should be employed mainly for a correct adjustment on surfaces [13]. Figure 4 shows details of the discretization of the domain used in the calculations.
Figure 4: Details of the discretization of the geometry.
Between the most important boundaries conditions are thermodynamic input parameters, the mass flow rate and composition of the fuel and air, because the influence thereof is not only on thermodynamics but the cell electrochemistry. Table 1 summarizes the boundary conditions applied to the model.
Table 1: Thermodynamics and fluids boundaries conditions.
Parameter Value
Fuel mass flow (kg/s) 2.48949 10-7
Air mass flow (kg/s) 1.3705 10-5
Fuel inlet temperature (K) 973
Air inlet temperature (K) 973
Operating pressure (Pa) 101325
INAC 2013, Recife, PE, Brazil.
A very important aspect of a fuel cell is the fuel composition and the oxidant used for this has a marked influence on the life and performance of the cell [14]. In the model presented in this paper is used wet hydrogen as fuel and oxygen in the air as oxidant in the mass fractions shown in Table 2.
Table 2: Air and fuel composition used in model in mole fractions.
Hydrogen Oxygen Water Nitrogen
Anode channel 0.5248 - 0.4752 -
Cathode channel - 0.2329 - 0.7671
These boundary conditions will be established as the basis of calculations in subsequent analyzes because some of these boundary conditions are subject to change to analyze their influence on the efficiency of the cell. Values of fuel and air flow are calculated based on the length of the cell in order to set the amount of current produced in the cell parameter that must be specified in the model used by the software.
3.2. Materials of fuel cell components.
There are several possible materials for constructing the components of the fuel cells [15]. For the construction of the anode is used one of the most common materials for application, a nickel alloy doped with YSZ. Materials based on zirconium oxides (YSZ) have been developed in the last two decades and their properties are well defined, these materials are most commonly used for the construction of the SOFC anode. The materials and its properties used for the model are summarized in Table 3.
Table 3: Materials and its properties used in the simulation of the fuel cell components.
Component Material Density
(kg/m3)
Thermal conductivity
(W/mK)
Specific Heat
(J/kgK)
Porosity
(%)
Anode Ni-YSZ 3030 595.1 6.23 30
Cathode LSM 4375 T depend. 1.15 30
Current collector Steel 8900 446 72 -
Electrolyte YSZ 5371 585.2 2.2 -
For the construction of the cathode the used material is known as LSM (Lanthanum Manganite Strontium) whose compatibility with the anode Ni-YSZ has been proven by several studies. The current collectors are constructed using a ferritic chromium-based, high temperature resistance which has been proved by numerous authors. The electrolyte used for the proposed model and YSZ is one of the most common electrolyte according to the literature [16].
3.3. Optimization parameters.
In operation of a fuel cell involved thermodynamic parameters, geometric and electrical, which have a marked influence on the efficiency and power output in the cell. Table 4 shows the objects of study variables and the range of variation and its increase.
INAC 2013, Recife, PE, Brazil.
Table 4: Optimization parameters and intervals size analyzed.
Parameter Initial Value Maximum Minimum Increment
Fuel cell length 150 mm 150 mm 100 mm 10 mm
Flows direction Parallel - Counter-flow -
Temperature 973 K 1323 K 723 K 200 K
Pressure 101325 Pa 1519875 Pa 101325 Pa 506625 Pa
4. RESULTS AND DISCUSSION.
The model built using the software Ansys FLUENT [13] is validated using experimental data and other modeling work reported in the literature. To validate the model used the work of [17] in which the authors propose a model for the simulation of a tubular SOFC cell.
4.1. Model Validation.
One of the most commonly used benchmarks for the validation of models of fuel cells is the activation curve, this curve links the two most important parameters of an electrochemical device, voltage and current. Activation curve obtained by [17] was validated using experimental results. After adjusting the model to the conditions reported by [17] is obtained the activation curve for the proposed model in this work presented in Figure 5.
Figure 5: Comparing the polarization curve obtained by [17] and the curve of the model
proposed.
As it is show in Figure 5, the proposed model has a good agreement with the results reported by the article referenced and experimental data for low current densities and moderate, but for high values of current densities coincidence but still worsens in the allowable range for this type of model.
4.2. Model analysis.
The model is tested for initial conditions shown in Table 5, then some of these conditions and parameters are subject to variations and analysis in order to establish the parameters which provide higher power values. These initial parameters were chosen to be reported several optimization work SOFC cells [2] [17].

INAC 2013, Recife, PE, Brazil.
Table 5: Initial conditions of the model proposed.
Parameter Initial Value
Fuel cell length 150 mm
Flows direction Parallel
Temperature 973
Pressure 101325 Pa
To obtain the characteristic curves of the cell is made a variation of the current produced in order to evaluate the performance thereof under different loads.
4.3. Power Density.
The first analysis of the model is the determination of the optimum current density, value which produces the highest power density value in the cell to the initial conditions. Figure 6 shows a graph of power density function of the current produced in the cell.
Figure 6: Power density obtained by the initial model.
This characteristic curve of the fuel cell can meet the cell behavior under different load regimes. As shown in Figure 6 there are values of current produced in the cells that cause peak values in the power thereof. Current values 9A - 10A correspond to current density values between 4400A/m2 - 4900A/m2. Power decreasing to values higher than 10 A is largely due to the decrease in the cell voltage produced and increased over-activation losses.
4.4 Nerst Voltage.
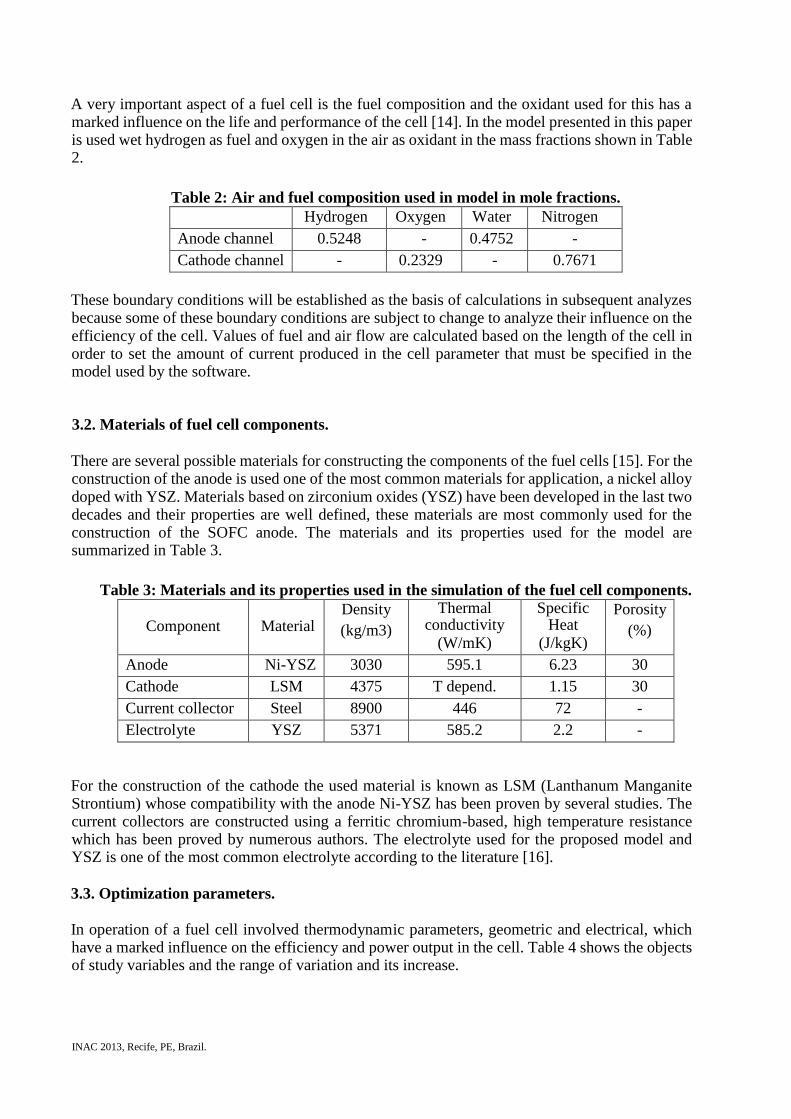
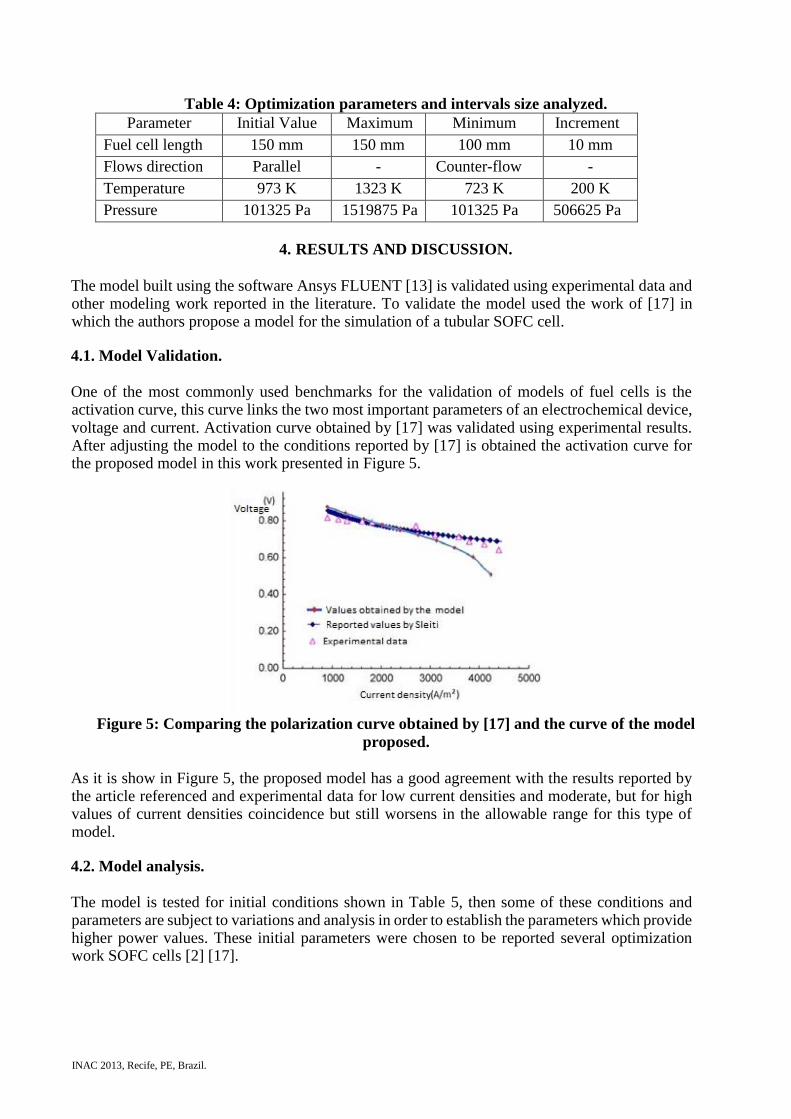
The decrease in cell voltage produced is mainly due to the Nernst voltage drop and increased over-activation losses in the components of the cell. Figure 7 shows the theoretical voltage drop produced in the cell for several values of currents produced. Using the current value (10A) ensuring a maximum power density for the proposed model can be obtained contours Nernst voltage (Figure 8).
INAC 2013, Recife, PE, Brazil.
Figure 7: Nerst Voltage produced as function of the current produced.
Figure 8: Contours of Nerst Voltage produced for 10 A.
As seen in Figure 8 the Nernst voltage values produced in the cell have a fairly uniform distribution in the range from 0.96 V - 0.67 V, resulting in a decrease with increasing length of the cell.
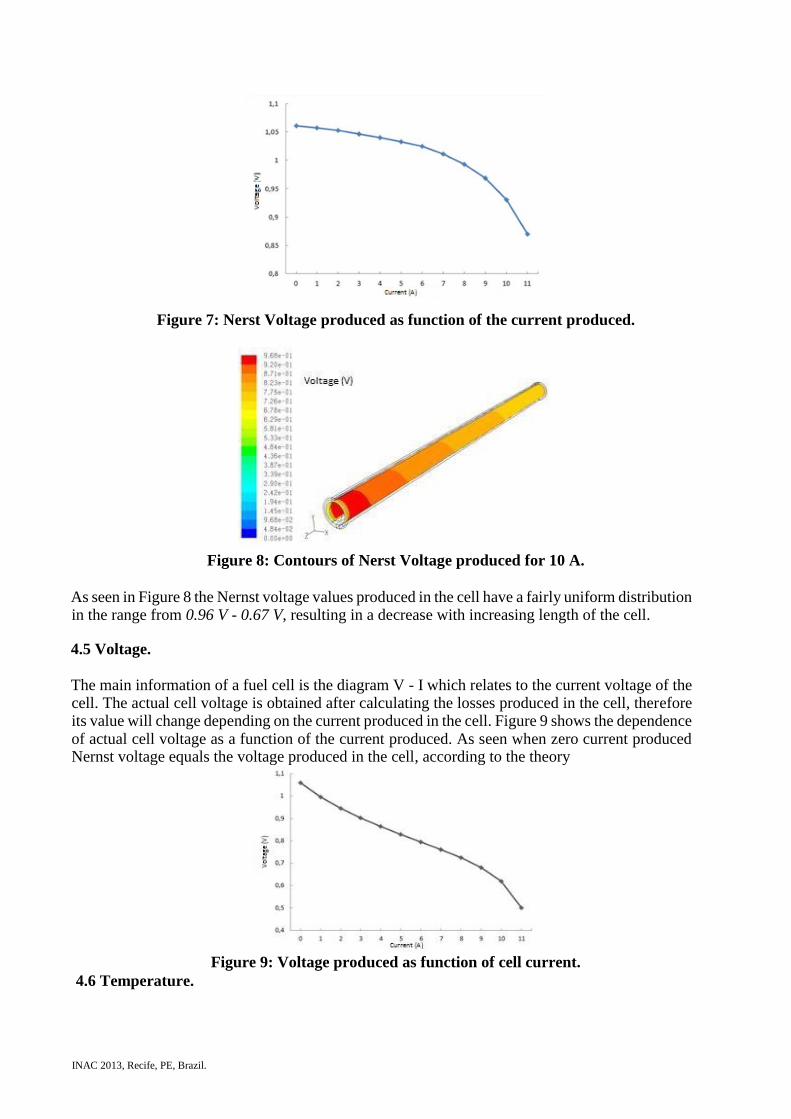
4.5 Voltage.
The main information of a fuel cell is the diagram V - I which relates to the current voltage of the cell. The actual cell voltage is obtained after calculating the losses produced in the cell, therefore its value will change depending on the current produced in the cell. Figure 9 shows the dependence of actual cell voltage as a function of the current produced. As seen when zero current produced Nernst voltage equals the voltage produced in the cell, according to the theory
Figure 9: Voltage produced as function of cell current.
4.6 Temperature.
INAC 2013, Recife, PE, Brazil.
Voltage values produced in the cell, as well as losses by over-activation have a marked dependence on the temperature values that occur in the cell. According to the theory if temperature values produce higher voltage values become smaller, but the increase in temperature also reduces the ohmic losses when the cell operates at moderate current densities and low [2]. In Figure 10 is shown the average temperature rise of the electrolyte for different currents produced in the cell. The results obtained for the temperature increase of the cell based on the current produced coincide with the results obtained by the authors [2] for a rectangular SOFC.
Figure 10: Increase of temperature as function of cells current.
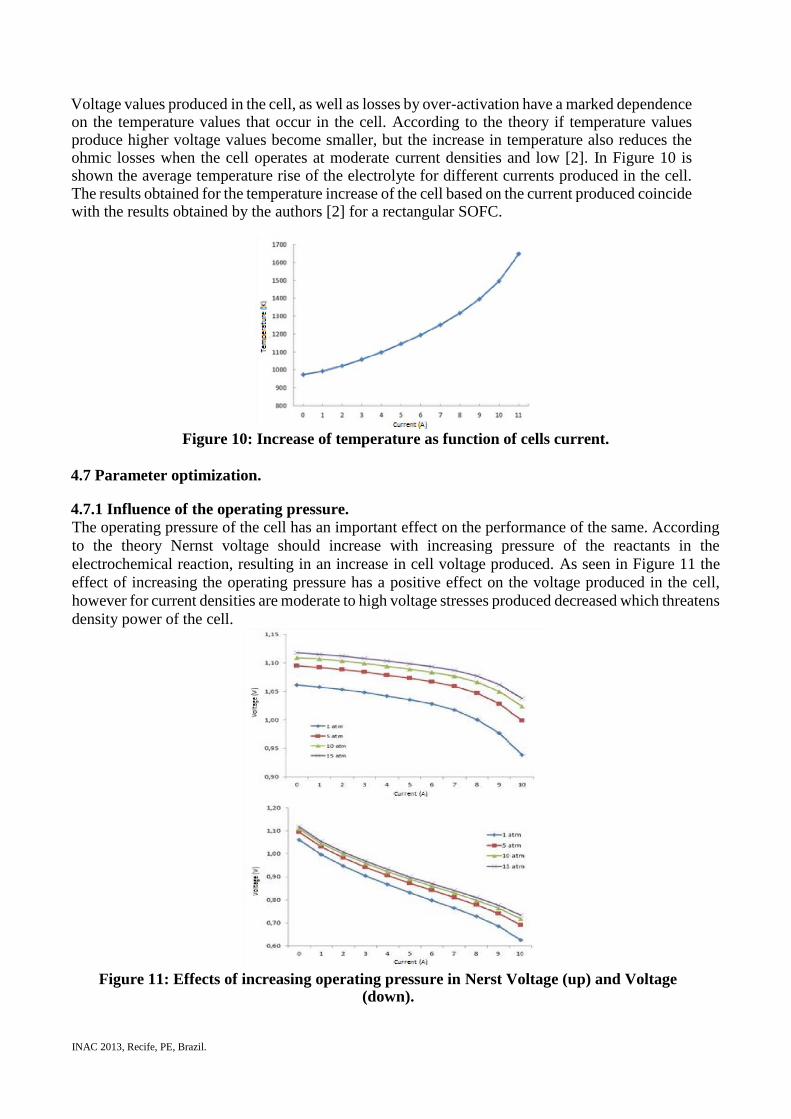
4.7 Parameter optimization.
4.7.1 Influence of the operating pressure. The operating pressure of the cell has an important effect on the performance of the same. According
to the theory Nernst voltage should increase with increasing pressure of the reactants in the
electrochemical reaction, resulting in an increase in cell voltage produced. As seen in Figure 11 the
effect of increasing the operating pressure has a positive effect on the voltage produced in the cell,
however for current densities are moderate to high voltage stresses produced decreased which threatens
density power of the cell.
Figure 11: Effects of increasing operating pressure in Nerst Voltage (up) and Voltage
(down).
INAC 2013, Recife, PE, Brazil.
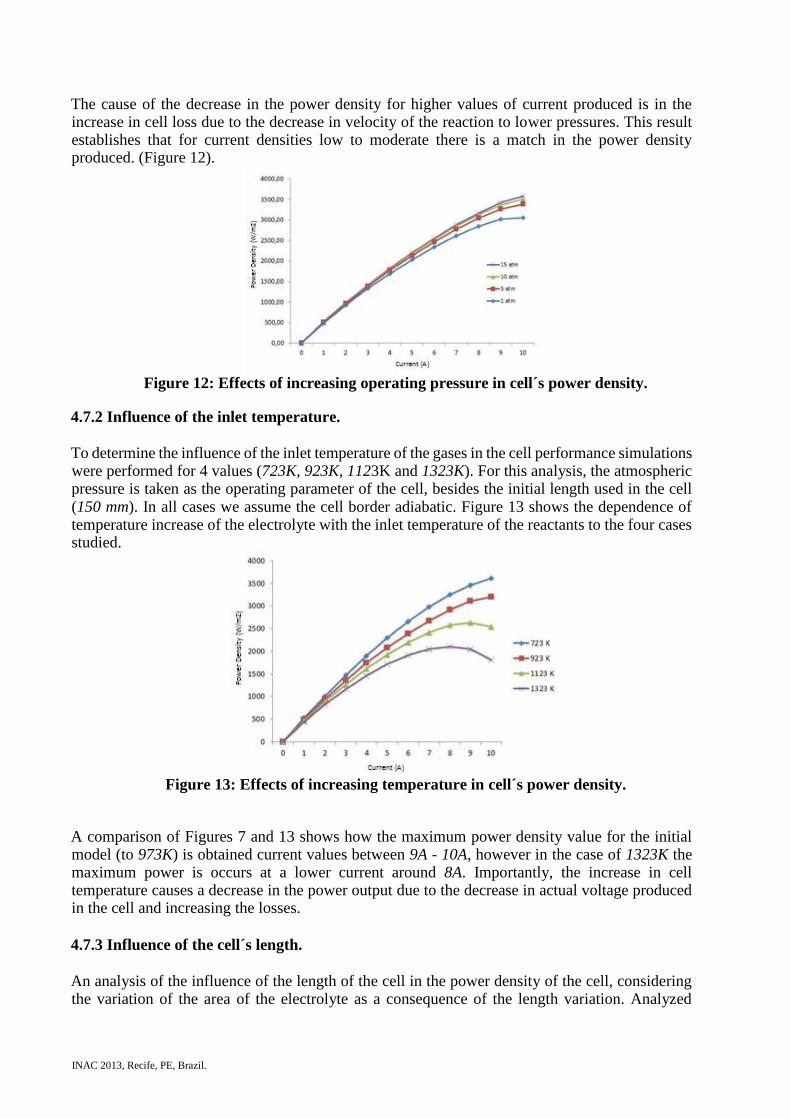
The cause of the decrease in the power density for higher values of current produced is in the increase in cell loss due to the decrease in velocity of the reaction to lower pressures. This result establishes that for current densities low to moderate there is a match in the power density produced. (Figure 12).
Figure 12: Effects of increasing operating pressure in cell´s power density.
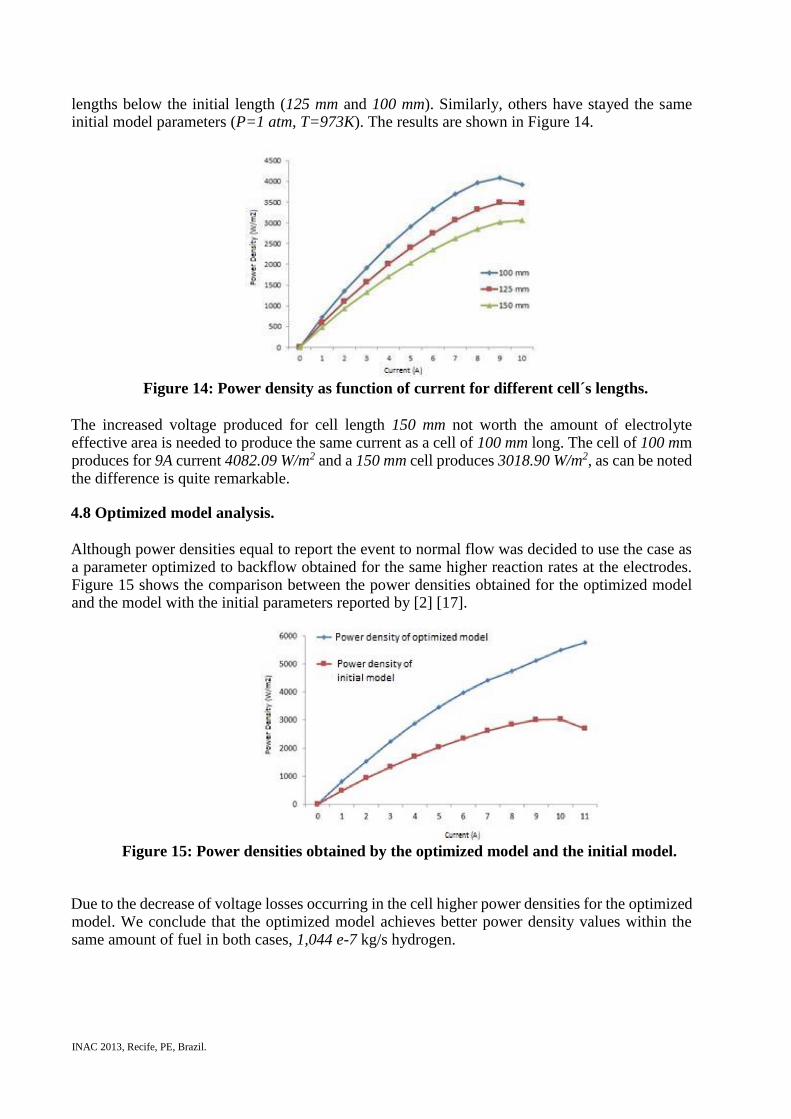
4.7.2 Influence of the inlet temperature.
To determine the influence of the inlet temperature of the gases in the cell performance simulations were performed for 4 values (723K, 923K, 1123K and 1323K). For this analysis, the atmospheric pressure is taken as the operating parameter of the cell, besides the initial length used in the cell (150 mm). In all cases we assume the cell border adiabatic. Figure 13 shows the dependence of temperature increase of the electrolyte with the inlet temperature of the reactants to the four cases studied.
Figure 13: Effects of increasing temperature in cell´s power density.
A comparison of Figures 7 and 13 shows how the maximum power density value for the initial model (to 973K) is obtained current values between 9A - 10A, however in the case of 1323K the maximum power is occurs at a lower current around 8A. Importantly, the increase in cell temperature causes a decrease in the power output due to the decrease in actual voltage produced in the cell and increasing the losses.
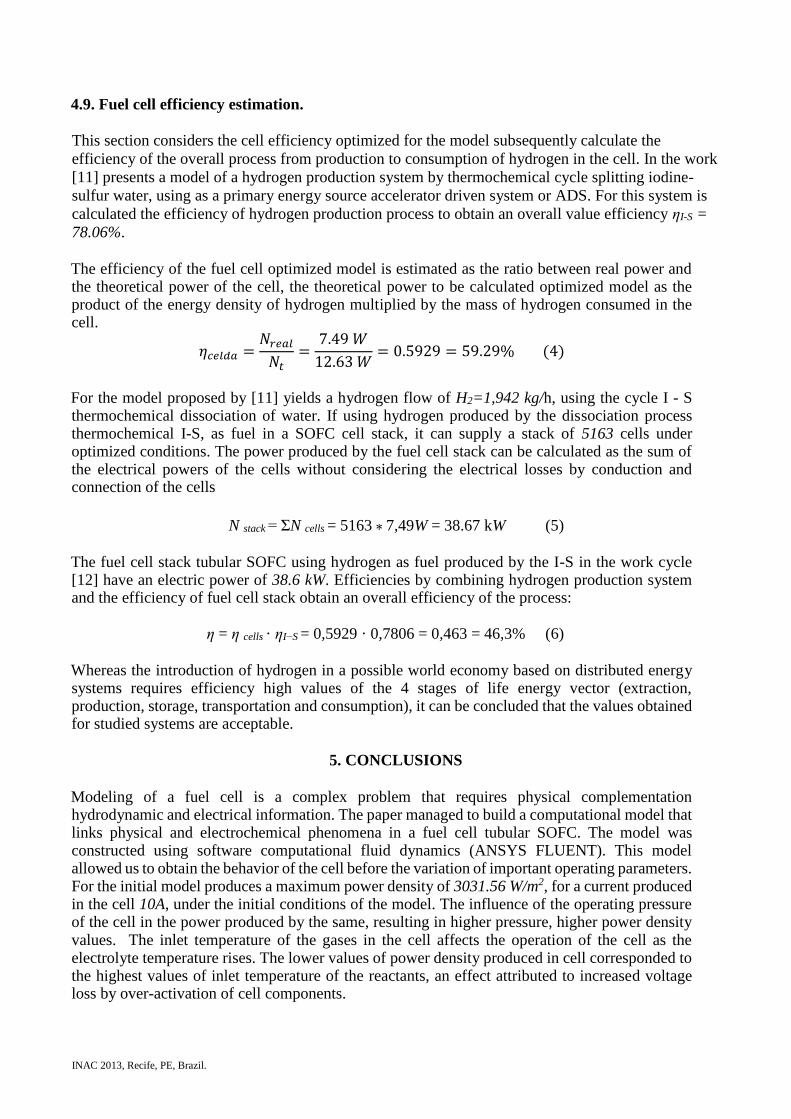
4.7.3 Influence of the cell´s length.
An analysis of the influence of the length of the cell in the power density of the cell, considering the variation of the area of the electrolyte as a consequence of the length variation. Analyzed
INAC 2013, Recife, PE, Brazil.
lengths below the initial length (125 mm and 100 mm). Similarly, others have stayed the same initial model parameters (P=1 atm, T=973K). The results are shown in Figure 14.
Figure 14: Power density as function of current for different cell´s lengths.
The increased voltage produced for cell length 150 mm not worth the amount of electrolyte effective area is needed to produce the same current as a cell of 100 mm long. The cell of 100 mm produces for 9A current 4082.09 W/m2 and a 150 mm cell produces 3018.90 W/m2, as can be noted the difference is quite remarkable.
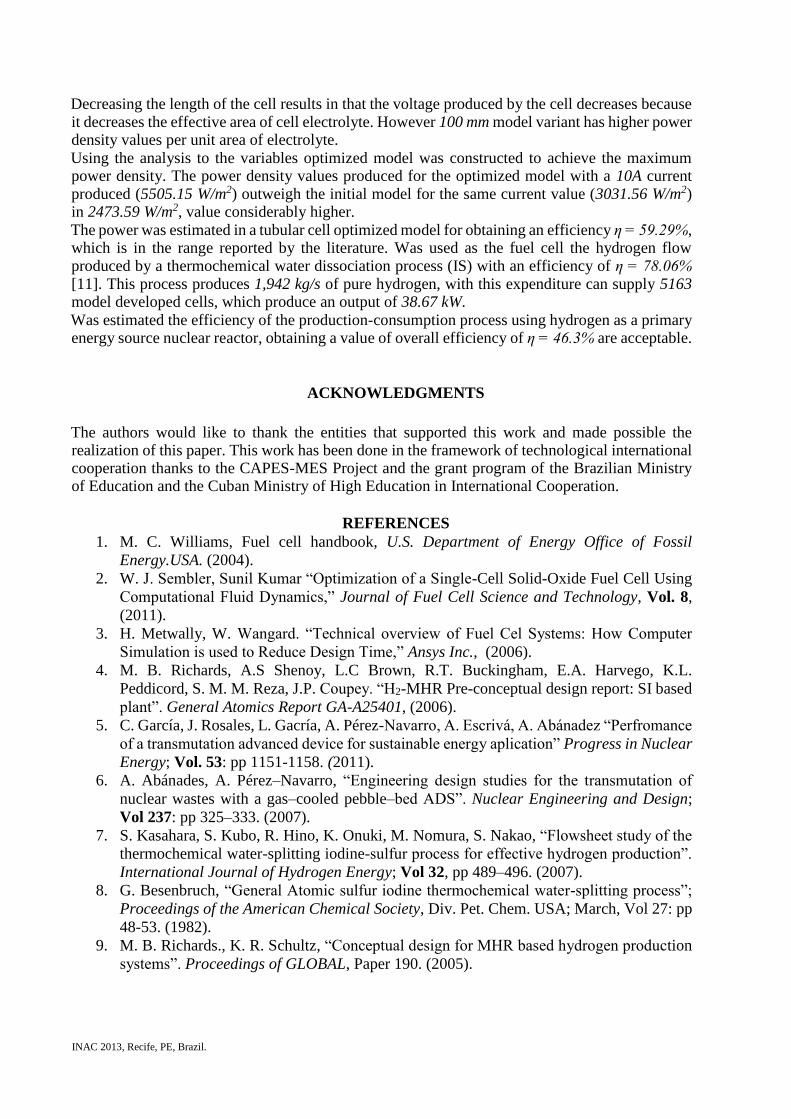
4.8 Optimized model analysis.
Although power densities equal to report the event to normal flow was decided to use the case as a parameter optimized to backflow obtained for the same higher reaction rates at the electrodes. Figure 15 shows the comparison between the power densities obtained for the optimized model and the model with the initial parameters reported by [2] [17].
Figure 15: Power densities obtained by the optimized model and the initial model.
Due to the decrease of voltage losses occurring in the cell higher power densities for the optimized model. We conclude that the optimized model achieves better power density values within the same amount of fuel in both cases, 1,044 e-7 kg/s hydrogen.
INAC 2013, Recife, PE, Brazil.
4.9. Fuel cell efficiency estimation.
This section considers the cell efficiency optimized for the model subsequently calculate the
efficiency of the overall process from production to consumption of hydrogen in the cell. In the work
[11] presents a model of a hydrogen production system by thermochemical cycle splitting iodine-
sulfur water, using as a primary energy source accelerator driven system or ADS. For this system is
calculated the efficiency of hydrogen production process to obtain an overall value efficiency ηI-S =
78.06%.
The efficiency of the fuel cell optimized model is estimated as the ratio between real power and the theoretical power of the cell, the theoretical power to be calculated optimized model as the product of the energy density of hydrogen multiplied by the mass of hydrogen consumed in the cell.
𝜂𝑐𝑒𝑙𝑑𝑎 =𝑁𝑟𝑒𝑎𝑙
𝑁𝑡=
7.49 𝑊
12.63 𝑊= 0.5929 = 59.29% (4)
For the model proposed by [11] yields a hydrogen flow of H2=1,942 kg/h, using the cycle I - S thermochemical dissociation of water. If using hydrogen produced by the dissociation process thermochemical I-S, as fuel in a SOFC cell stack, it can supply a stack of 5163 cells under optimized conditions. The power produced by the fuel cell stack can be calculated as the sum of the electrical powers of the cells without considering the electrical losses by conduction and connection of the cells
N stack = ΣN cells = 5163 7,49W = 38.67 kW (5)
The fuel cell stack tubular SOFC using hydrogen as fuel produced by the I-S in the work cycle [12] have an electric power of 38.6 kW. Efficiencies by combining hydrogen production system and the efficiency of fuel cell stack obtain an overall efficiency of the process: η = η cells · ηI−S = 0,5929 · 0,7806 = 0,463 = 46,3% (6)
Whereas the introduction of hydrogen in a possible world economy based on distributed energy systems requires efficiency high values of the 4 stages of life energy vector (extraction, production, storage, transportation and consumption), it can be concluded that the values obtained for studied systems are acceptable.
5. CONCLUSIONS
Modeling of a fuel cell is a complex problem that requires physical complementation hydrodynamic and electrical information. The paper managed to build a computational model that links physical and electrochemical phenomena in a fuel cell tubular SOFC. The model was constructed using software computational fluid dynamics (ANSYS FLUENT). This model allowed us to obtain the behavior of the cell before the variation of important operating parameters. For the initial model produces a maximum power density of 3031.56 W/m2, for a current produced in the cell 10A, under the initial conditions of the model. The influence of the operating pressure of the cell in the power produced by the same, resulting in higher pressure, higher power density values. The inlet temperature of the gases in the cell affects the operation of the cell as the electrolyte temperature rises. The lower values of power density produced in cell corresponded to the highest values of inlet temperature of the reactants, an effect attributed to increased voltage loss by over-activation of cell components.
INAC 2013, Recife, PE, Brazil.
Decreasing the length of the cell results in that the voltage produced by the cell decreases because it decreases the effective area of cell electrolyte. However 100 mm model variant has higher power density values per unit area of electrolyte.
Using the analysis to the variables optimized model was constructed to achieve the maximum power density. The power density values produced for the optimized model with a 10A current produced (5505.15 W/m2) outweigh the initial model for the same current value (3031.56 W/m2) in 2473.59 W/m2, value considerably higher.
The power was estimated in a tubular cell optimized model for obtaining an efficiency η = 59.29%, which is in the range reported by the literature. Was used as the fuel cell the hydrogen flow produced by a thermochemical water dissociation process (IS) with an efficiency of η = 78.06% [11]. This process produces 1,942 kg/s of pure hydrogen, with this expenditure can supply 5163 model developed cells, which produce an output of 38.67 kW.
Was estimated the efficiency of the production-consumption process using hydrogen as a primary energy source nuclear reactor, obtaining a value of overall efficiency of η = 46.3% are acceptable.
ACKNOWLEDGMENTS
The authors would like to thank the entities that supported this work and made possible the realization of this paper. This work has been done in the framework of technological international cooperation thanks to the CAPES-MES Project and the grant program of the Brazilian Ministry of Education and the Cuban Ministry of High Education in International Cooperation.
REFERENCES
1. M. C. Williams, Fuel cell handbook, U.S. Department of Energy Office of Fossil
Energy.USA. (2004).
2. W. J. Sembler, Sunil Kumar “Optimization of a Single-Cell Solid-Oxide Fuel Cell Using
Computational Fluid Dynamics,” Journal of Fuel Cell Science and Technology, Vol. 8,
(2011).
3. H. Metwally, W. Wangard. “Technical overview of Fuel Cel Systems: How Computer
Simulation is used to Reduce Design Time,” Ansys Inc., (2006).
4. M. B. Richards, A.S Shenoy, L.C Brown, R.T. Buckingham, E.A. Harvego, K.L.
Peddicord, S. M. M. Reza, J.P. Coupey. “H2-MHR Pre-conceptual design report: SI based
plant”. General Atomics Report GA-A25401, (2006).
5. C. García, J. Rosales, L. Gacría, A. Pérez-Navarro, A. Escrivá, A. Abánadez “Perfromance
of a transmutation advanced device for sustainable energy aplication” Progress in Nuclear
Energy; Vol. 53: pp 1151-1158. (2011).
6. A. Abánades, A. Pérez–Navarro, “Engineering design studies for the transmutation of
nuclear wastes with a gas–cooled pebble–bed ADS”. Nuclear Engineering and Design;
Vol 237: pp 325–333. (2007).
7. S. Kasahara, S. Kubo, R. Hino, K. Onuki, M. Nomura, S. Nakao, “Flowsheet study of the
thermochemical water-splitting iodine-sulfur process for effective hydrogen production”.
International Journal of Hydrogen Energy; Vol 32, pp 489–496. (2007).
8. G. Besenbruch, “General Atomic sulfur iodine thermochemical water-splitting process”;
Proceedings of the American Chemical Society, Div. Pet. Chem. USA; March, Vol 27: pp
48-53. (1982).
9. M. B. Richards., K. R. Schultz, “Conceptual design for MHR based hydrogen production
systems”. Proceedings of GLOBAL, Paper 190. (2005).

INAC 2013, Recife, PE, Brazil.
10. M .B. Richards, K. R. Schultz, L.C. Brown, “H2-MHR conceptual design based on the
SI process and high-temperature electrolysis”. International Journal of Nuclear Hydrogen
Production and Applications; Vol 1: pp 36–50. (2006).
11. L. García, D. González, C. García, L. García, C. Brayner, “Efficiency of the sulfure-iodine
thermochemical water splitting process for hydrogen production based on ADS
(accelerator driven system),” Energy, Vol. 1, pp 1-9 (2013).
12. V. Danilov, M. O. Tade “A CFD-based model of planar SOFC for anode flow filed
desing,” International Journal of Hydrogen Energy, Vol. 34, pp 8998-9006 (2009).
13. “User´s Manual.Ansys FLUENT” http://www.ansys.com/ (2011).
14. C. A. Grimes, O. K. Varghese, S. Ranjan, Light, Water, Hydrogen, Springer, New York,
USA (2008).
15. C. Zuo. Fuel Cells, Springer Science+Business Media New, USA (2012).
16. A. Zwetanova, M. Machkova, M. Christov, “Modelling Of Chromium Contamination of
SOFC Cathodes From Metallic Interconnects”. Journal of the University of Chemical
Technology and Metallurgy, Vol. 42. pp 89-92 (2007).
17. A. K. Sleiti. “Performance of tubular Solid Oxide Fuel Cell at reduced temperature and
cathode porosity” Journal of Power Sources. Vol 195. pp 5719-5725 (2010).