Embed Size (px)
Citation preview
Analysing Microarray Data Using Bayesian Network LearningName: Phirun SonSupervisor: Dr. Lin Liu

ContentsAimsMicroarraysBayesian NetworksClassificationMethodologyResults
Aims and GoalsInvestigate suitability of Bayesian
Networks for analysis of Microarray data
Apply Bayesian learning on Microarray data for classification
Comparison with other classification techniques

MicroarraysArray of microscopic
dots representing gene expression levels
Gene expression is the process of DNA genes being transcribed into RNA
Short sections of genes attached to a surface such as glass or silicon
Treated with dyes to obtain expression level

Challenges of Microarray Data
Very large number of variables, low number of samples
Data is noisy and incomplete
Standardisation of data format◦ MGED – MIAME,
MAGE-ML, MAGE-TAB◦ ArrayExpress, GEO,
CIBEX
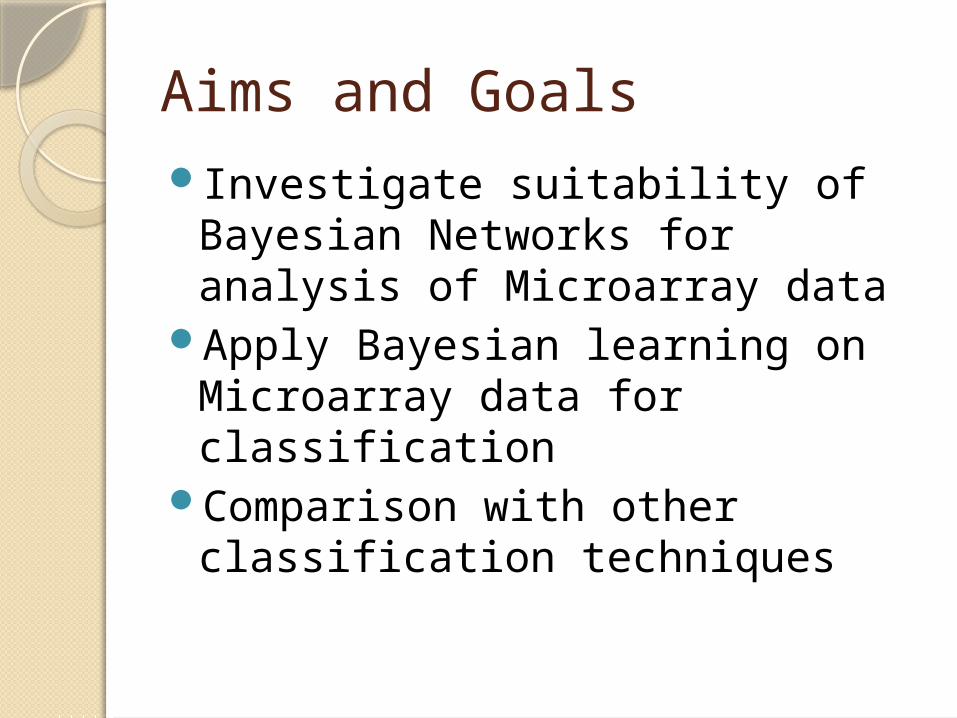
Bayesian NetworksRepresents conditional
independencies of random variables
Two components:◦Directed Acyclic Graph (DAG)◦Probability Table
MethodologyCreate a program to test
accuracy of classification◦ Written in MATLAB using Bayes Net Toolbox
(Murphy, 2001), and Structure Learning Package (Leray, 2004)
◦ Uses Naive network structure, K2 structure learning, and pre-determined structure
Test program on synthetic dataTest program using real dataComparison of Bayes Net and
Decision Tree

Synthetic DataData created from well-known
Bayesian Network examples◦Asia network, car network, and alarm
networkSamples generated from each
networkTested with naive, pre-known
structure, and with structure learning

Synthetic Data - Results
Asia NetworkLauritzen and Spiegelhalter, ‘Local Computations with Probabilities on Graphical Structures and Their Application to Expert Systems’, 1988, pg 164
Correct
Naive 81.0%
K2 Learning 83.4%
Known Graph 85.0%
50 Samples, 10 Folds, 100 IterationsClass Node: Dyspnoea
Correct
Naive 83.1%
K2 Learning 84.3%
Known Graph 85.1%
100 Samples, 10 Folds, 50 IterationsClass Node: Dyspnoea
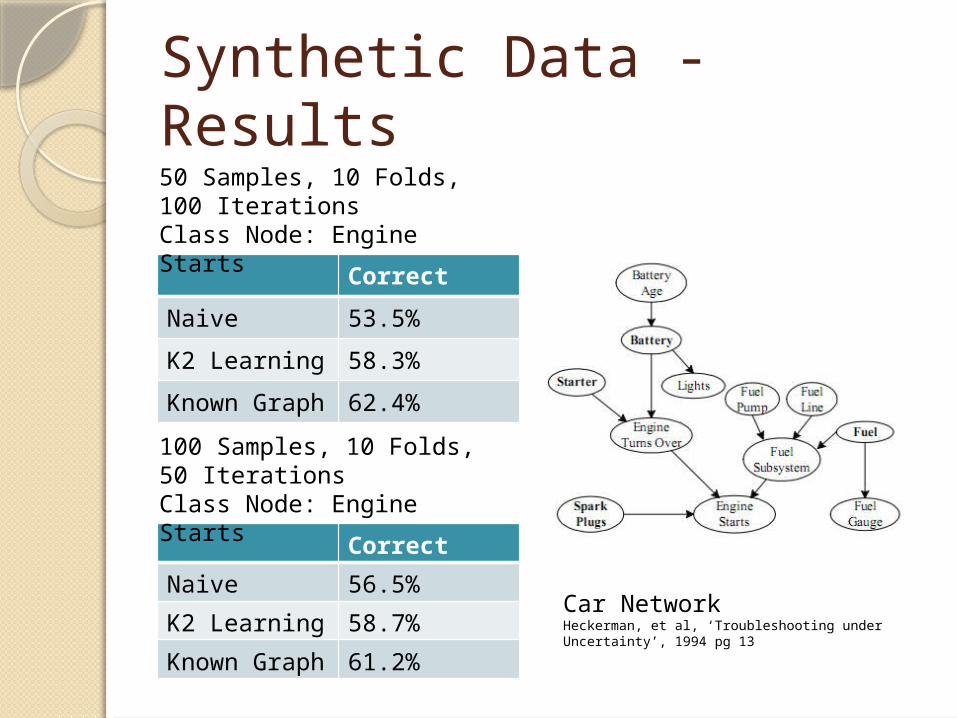
Synthetic Data - Results
Correct
Naive 53.5%
K2 Learning 58.3%
Known Graph 62.4%
Car NetworkHeckerman, et al, ‘Troubleshooting under Uncertainty’, 1994 pg 13
50 Samples, 10 Folds, 100 IterationsClass Node: Engine Starts
Correct
Naive 56.5%
K2 Learning 58.7%
Known Graph 61.2%
100 Samples, 10 Folds, 50 IterationsClass Node: Engine Starts

Synthetic Data - Results
ALARM Network37 Nodes, 46 ConnectionsBeinlich et al, ‘The ALARM monitoring system: A case study with two probabilistic inference techniques for belief networks’, 1989
Correct
Naive 72.4%
K2 Learning 78.7%
Known Graph 89.6%
50 Samples, 10 Folds, 10 IterationsClass Node: InsufAnesth
Correct
Naive 69.0%
K2 Learning 77.8%
Known Graph 93.6%
50 Samples, 10 Folds, 10 IterationsClass Node: Hypovolemia

Lung Cancer Data SetPublically available data sets:
◦ Harvard: Bhattacharjee et al, ‘Classification of Human Lung Carcinomas by mRNA Expression Profiling Reveals Distinct Adenocarcinoma Subclasses’, 2001 11,657 attributes, 156 instances, Affymetrix
◦ Michigan: Beer et al, ‘Gene-Expression Profiles Predict Survival of Patients with Lung Adenocarcinoma’, 2002 6,357 attributes, 96 instances, Affymetrix
◦ Stanford: Garber et al, ‘Diversity of Gene Expression in Adenocarcinoma of the Lung’, 2001 11,985 attributes, 46 instances, cDNA Contains missing values

Feature SelectionLi (2009) provides a feature-
selected set of 90 attributes◦Using WEKA feature selection◦Also allows comparison with Decision
Tree based classification
Discretised data in 3 forms◦ Undetermined values left unknown◦ Undetermined values put into either category – two
category◦ Undetermined values put into another category – three
categoryWEKA: Ian H. Witten and Eibe Frank, ‘Data Mining: Practical machine learning tools and techniques’, 2005.

Harvard Set Harvard Training on Michigan
Harvard Training on Stanford
MATLAB WEKA DT
2-Cat -> 2-Cat NF 95 (99.0%)
95 (99.0%)
95 (99.0%)
2-Cat -> 2-Cat F 94 (97.9%)
93 (96.9%)
92 (95.8%)
3-Cat -> 3-Cat NF 94 (97.9%)
95 (99.0%)
94 (97.9%)
3-Cat -> 3-Cat F 88 (91.7%)
95 (99.0%)
94 (97.9%)MATLAB WEKA DT
2-Cat -> 2-Cat NF 41 (89.1%)
46 (100%) 43 (93.5%)
2-Cat -> 2-Cat F 41 (89.1%)
45 (97.8%)
36 (78.3%)
3-Cat -> 3-Cat NF 41 (89.1%)
46 (100%) 42 (91.3%)
3-Cat -> 3-Cat F 41 (89.1%)
46 (100%) 42 (91.3%)

Michigan Set Michigan Training on Harvard
Michigan Training on Stanford
MATLAB WEKA DT
2-Cat -> 2-Cat NF 150 (96.2%)
154 (98.7%)
153 (98.1%)
2-Cat -> 2-Cat F 144 (92.3%)
153 (98.1%)
150 (96.2%)
3-Cat -> 3-Cat NF 145 (92.9%)
153 (98.1%)
153 (98.1%)
3-Cat -> 3-Cat F 140 (89.7%)
152 (97.4%)
153 (98.1%)MATLAB WEKA DT
2-Cat -> 2-Cat NF 41 (89.1%)
46 (100%) 41 (89.1%)
2-Cat -> 2-Cat F 41 (89.1%)
46 (100%) 40 (87.0%)
3-Cat -> 3-Cat NF 41 (89.1%)
45 (97.8%)
39 (84.8%)
3-Cat -> 3-Cat F 41 (89.1%)
46 (100%) 39 (84.8%)

Stanford Set Stanford Training on Harvard
Stanford Training on Michigan
MATLAB WEKA DT
2-Cat -> 2-Cat NF 139 (89.1%)
153 (98.1%)
139 (89.1%)
2-Cat -> 2-Cat F 139 (89.1%)
150 (96.2%)
124 (79.5%)
3-Cat -> 3-Cat NF 139 (89.1%)
150 (96.2%)
154 (98.7%)
3-Cat -> 3-Cat F 139 (89.1%)
150 (96.2%)
152 (97.4%)MATLAB WEKA DT
2-Cat -> 2-Cat NF 86 (89.6%)
95 (99.0%)
86 (89.6%)
2-Cat -> 2-Cat F 86 (89.6%)
92 (95.8%)
72 (75.0%)
3-Cat -> 3-Cat NF 86 (89.6%)
95 (99.0%)
94 (97.9%)
3-Cat -> 3-Cat F 86 (89.6%)
95 (99.0%)
91 (94.8%)
Future WorkUse structure learning for
Bayesian ClassifiersIncrease of homogeneous dataOther methods of classification