Embed Size (px)
Citation preview
Aalto University
School of Science
Degree Programme in Systems and Operations Research
Olli Rentola
Analyses of Online Advertising Performance Using
Attribution Modeling
Master’s Thesis
Espoo, August 5th
, 2014
Supervisor: Prof. Ahti Salo
Instructor: M. Sc. (Tech.) Ilkka Mansikkamäki
The document can be stored and made available to the public on the open internet pages of
Aalto University. All other rights are reserved.
ii
Aalto University
School of Science
ABSTRACT OF THE
MASTER’S THESIS
Author: Olli Rentola
Title:
Analyses of Online Advertising Performance Using Attribution Modeling
Date: August 5th
, 2014 Pages: 7 + 71
Major: Systems and operations research Code: Mat-2
Supervisors: Prof. Ahti Salo
Instructor: M.Sc. (Tech) Ilkka Mansikkamäki
The importance for data-driven planning in online advertising has become a significant
factor for marketers. Advancements in data collection technologies have provided
marketers the prerequisites for thorough analyses of the impacts of online marketing
activities and most often attribution models are used to evaluate the performance. An
attribution model defines the contribution of advertising channels in inducing conversions
among customers i.e. purchase decisions. This Thesis proposes a framework for online
advertising performance analysis and budget optimization using such techniques.
The empirical analysis is conducted with clickstream data collected across multiple
websites using cookies. We use binary logistic regression model to classify customers to
converters and to non-converters. To evaluate the cost performance of a channel, we
present a metric that is based on the expected cost of conversions. The logistic regression
model is estimated with and without bootstrap aggregation. The coefficients are averaged
over 100 iterations and the posterior distribution of conversions is ensured in training
samples.
The results suggest that the probability of conversion is highest at the first banner
impression. Moreover, the search engines are significantly more efficient in inducing
conversions than banners and direct traffic, but banner impressions increase the traffic of
other channels. Last, the joint effects of advertisements were found beneficial.
While the research objectives of this Thesis were achieved, further research is
required to improve the results of the proposed framework. Nevertheless, this study
provides solid results for online marketing planners and means to optimize the online
marketing activities in terms of budget allocation.
Keywords: Attribution model, logistic regression, online advertising,
performance analysis
Language: English

iii
Aalto-yliopisto
Perustieteiden korkeakoulu
DIPLOMITYÖN
TIIVISTELMÄ
Tekijä: Olli Rentola
Työn nimi:
Internet-mainonnan tehokkuuden arviointi attribuutiomallinnuksen avulla
Päiväys: 5. elokuuta 2014 Sivumäärä: 7 + 71
Pääaine: Systeemi- ja operaatiotutkimus Koodi: Mat-2
Valvoja: Prof. Ahti Salo
Ohjaaja: DI Ilkka Mansikkamäki
Käyttäjätason Internet-käyttäytymistiedon merkitys on kasvanut Internet-mainonnan
suunnittelussa. Kehittyneet tiedonkeruutekniikat mahdollistavat Internet-mainonnan
vaikutusten yksilötason analysoinnin attribuutiomallinnuksella. Attribuutiomalli kuvaa,
miten eri mainoskanavat ovat vaikuttaneet käyttäjän ostopäätökseen eli käyttäjän
konversioon. Tässä tutkimuksessa esitetään attribuutiomallinnukseen perustuva viitekehys
Internet-mainonnan tehokkuuden analysointia ja budjetin optimointia varten.
Työn empiirinen tarkastelu tehdään käyttäjätason internetkäyttäytymistiedon
perusteella. Analysoitu aineisto on kerätty Internet-sivuilta evästeiden avulla. Kuluttajien
ostokäyttäytymistä mallinnetaan binäärisellä logistisella regressiomallilla.
Mainoskanavien kustannustehokkuuden mittaamiseen työssä esitetään metriikka, joka
kuvaa sitä odotusarvoista kustannusta, millä käyttäjä kussakin kanavassa konvertoituu.
Tulosten perusteella käyttäjän todennäköisyys konvertoitua on suurimmillaan
ensimmäisen bannerihavainnon jälkeen. Samoin näiden valossa hakukone on tehokas
konvertoimaan käyttäjiä. Lisäksi havaittiin, että bannerimainokset vaikuttavat muiden
kanavien kävijämääriin, ja useimmiten mainoskanavien yhteisvaikutukset lisäävät
käyttäjän konvertoitumis-todennäköisyyttä.
Tutkimukselle asetut tavoitteet saavutettiin. Tutkimuksessa havaittiin, että
markkinointikanavien välisten suhteiden parempi ymmärtäminen vaatii lisätutkimusta.
Tutkimuksessa saatujen tulosten avulla Internet-mainonnan suunnittelijat pystyvät
tehostamaan markkinointitoimenpiteitä ja markkinointibudjetin käyttöä.
Asiasanat: Attribuutiomalli, Internet-mainonta, logistinen regressio,
tehokkuuden analysointi
Kieli: Englanti

iv
Preface
The subject of my Thesis was a natural choice for me, and I am very lucky to come by it.
My interests in mathematical modeling and marketing must have increased the odds, but
the final thanks belong to Toni Jarimo.
All the prerequisites for writing this Thesis were set in January, but delays with the
data created extra pressure during the spring. Huge thanks goes for my instructor, Ilkka
Mansikkamäki, for continuous support and expressing true interest in my work by being
always present and ensuring smooth workflow. Regardless of the horror stories of not
getting feedback for the Thesis from anyone, Ilkka and Ahti Salo, my supervisor, proved
my prejudice wrong in every aspect. Ahti gave us always constructive feedback in short
notice and he really deserves our appreciation.
Last, but definitely not least, I want to thank all my course mates and friends with
whom I had the opportunity to work and spend time with during the six years of my
studies. The student community had a major impact on the path which I traversed to this
point, and thanks to all those who made the time of the studies such a memorable time in
my life. Also, thanks to SiMiLi for showing that it is a safe bet to go for a three regardless
of the time of the day.
This Thesis would not have seen the light of the day without the support from forces
at home. Thanks go to my parents, Seija and Jari, for their support and for guiding me to
make the right choices. Special thanks go to my girlfriend Outi, who was always there to
support me with the work; accomplishing in something is nothing if you cannot share it
with the closest to you.
In Espoo, 5th
of August, 2014
Olli Rentola
v
Contents
Abstract................................................................................................................................. ii
Abstract (in Finnish) ...........................................................................................................iii
Preface.................................................................................................................................. iv
Contents ................................................................................................................................ v
Abbreviations ..................................................................................................................... vii
1. Introduction .................................................................................................................. 1
1.1. Research Objectives ................................................................................................ 3
1.2. Research Scope ....................................................................................................... 4
1.3. Structure of the Thesis ............................................................................................ 5
2. Attribution Modeling and Online Advertising .......................................................... 6
2.1. Digital Advertising Channels ................................................................................ 10
2.2. Attribution in Advertising ..................................................................................... 13
2.3. Attribution Modeling Techniques ......................................................................... 14
2.3.1. Attribution Heuristics ............................................................................. 16
2.3.2. Probabilistic Methods ............................................................................. 19
2.3.3. Multivariate Time-Series Models ........................................................... 26
3. Data Description and Processing .............................................................................. 28
3.1. Data Description.................................................................................................... 28
3.2. Data Processing ..................................................................................................... 30
3.3. Data Processing Algorithms .................................................................................. 32
3.3.1. Algorithm for Aggregating Consecutive Customer Interactions with
Display Advertisements ......................................................................................... 32
3.3.2. Customer Path Creation Algorithm ........................................................ 34
4. Methods Used for Analysis ........................................................................................ 36
4.1. Logistic Regression for Attribution Modeling and Performance Analysis ........... 37
4.2. Modeling Steps ..................................................................................................... 39
4.2.1. Sample Selection and Model Validation ................................................ 40
4.2.2. Metrics for Model Selection ................................................................... 41
5. Results ......................................................................................................................... 44
5.1. Key Distributions of Path Dataset ......................................................................... 45
5.2. Model Selection .................................................................................................... 48
5.3. Conversion Probabilities with Logistic Regression and Last-Click Model .......... 51
5.4. Performance of Channels ...................................................................................... 52

vi
6. Discussion .................................................................................................................... 55
6.1. Framework for Budget Optimization .................................................................... 57
6.2. Review of Hypotheses........................................................................................... 58
6.3. Limitations of the Study ........................................................................................ 59
6.4. Topics for Further Research .................................................................................. 60
7. Conclusions ................................................................................................................. 62
References ........................................................................................................................... 64
Appendix A Statistics of Path Dataset ............................................................................. 70
vii
Abbreviations
APD Advertising Platform Data
AUC Area Under the Curve
FP False Positive
FPR False Positive Rate
MTA Multi-Touch Attribution
ROC Receiver Operating Characteristics
SEM Search Engine Marketing
SEO Search Engine Organic
TP True Positive
TPR True Positive Rate
TWD Target Website Data
1
Chapter 1
1. Introduction
The growing importance of Internet has offered remarkable opportunities for marketers. In
2013, 39% of world’s population was actively using it enabling marketers to reach
significant number of the world’s inhabitants digitally [1]. Thus, online marketing has
established a strong position in companies’ marketing mix.
Internet proposes new channels to communicate companies’ offerings to potential
customers and to enhance the relationship with existing ones. Digital advertising revenues
totaled nearly $40 billion only in the US in 2012 [2], and companies in the US intend to
use 2.5% of their total revenue to digital marketing in 2013 [3]. Even though the revenue
spent in digital marketing is very significant, marketers lack sophisticated methods for
analyzing the impact of their digital marketing investments [4] [5].
In traditional offline marketing, it is problematic to measure and track the effects of
marketing on individual customers [6]. This is due to the nature of offline marketing
activities; it is not possible to easily distinguish which specific advertisements the
customer has seen before making a purchase decision, which makes it impossible to
reliably divide credit among advertisements for inducing the purchase decision of the
customer. Luckily, the advancements in Internet technologies have provided marketers the
tools to tackle this problem on the Web.
2
Nowadays Internet advertisers can follow users’ exposure to advertisements using
cookie data. A cookie is a small piece of data that contains information about the user’s
browsing habits, which can be transferred to a third party (advertiser) when the user visits
a website. Then, it is possible to combine this information with customer behavior data
across different websites. Furthermore, the tracking can be extended to search engines and
even to individual keywords. All this information is very valuable for marketers but such
capabilities have raised privacy concerns. Combined, these pieces of information enable
marketers to analyze customers’ journeys to purchases thoroughly. The purchase event is
more commonly known as the conversion of the customer. This information can be used to
recognize how different advertisements have contributed to the final purchase decision.
Attribution models attempt to define how each interaction with advertisements along
the customer’s journey contributes to the customer’s decision whether to purchase the
advertiser’s offering or not. Several attribution models exist, but a standardized
methodology has not been established [4]. Even though marketers have access to loads of
consumer data, the last-click model prevails in the industry. Last-click model assigns all
credit to the last clicked advertisement; it therefore ignores large amounts of customer
behavior information. One objective of this Thesis is to propose an attribution modeling
approach that is able to exploit available information of the path to conversion based on
given dataset.
Marketers have trouble in optimizing the allocation of marketing funds, because it is
difficult to measure the impacts of marketing activities precisely. In the Internet,
technology has made it possible to carry out more accurate return-on-investment analyses.
Because the effects of investments can be measured more accurately, budget allocation has
become a more holistic process. Based on the attribution modeling approach proposed in
this Thesis, we give recommendations for campaign performance measurement and budget
planning of online advertising to ensure the effectiveness of online marketing efforts.
3
1.1. Research Objectives
The purpose of this Thesis is to create a framework to analyze user data to understand the
impact of online marketing efforts on customer conversion rates. The framework is used to
support decision making in planning and coordination of online marketing activities to
maximize the number of converted customers and to enable more efficient use of
marketing budget in online campaigns. To rationalize the recommendations for online
advertising planners, this Thesis has the following objectives:
1. Identify the key elements driving customer behavior by analyzing conversion
paths.
2. Categorize digital marketing channels based on the analysis.
3. Propose an attribution modeling approach and key metrics that best fit the industry
based on the given datasets.
Due to the nature of the problem, a set of hypotheses, which will be reviewed during
the analysis, must be set to support and guide the analysis process. This is a standard
approach in data mining projects, because the amount and complexity of the data can make
the analysis process inconsistent. Hypotheses must be set so they yield answers that are of
practical use for marketers’ decision making and aligned with the goals of the Thesis.
First, because the pricing of advertisements is based on either clicks or impressions, it
is important to understand the value of either action as precisely as possible. Second, due
to the fact that advertisement channels are different, especially search engine marketing,
we want to understand the impact of search engine marketing better. Interactions with
advertisements in search engine should yield better results in comparison to other channels,
because a customer is more engaged when seeing an advertisement in search engine results
[7] [8]. Therefore, search engine marketing should be important in customer conversion
process.
Third, customers may avoid clicking banner advertisements due to various reasons
(for instance security and trust reasons) [9]. Nevertheless, they still may acknowledge the
advertised offering, even though they do not click on it. Thus, we want to find whether or
not banner advertisements are important in awareness creation and if banners mostly direct
customers to other channels before converting.
4
After conversion, the customer is aware of the advertised offering and has evidently
thoughtfully considered it. Intuitively, it would make sense that the path to second or more
conversion of such customer is clearly different than the path of a customer who has not
yet converted. Therefore, we study whether a conversion has impact on the conversion
path or not. Lastly, in order to understand the effect of advertisement exposure on
customers better, we study if encountering the same advertisement multiple times has an
impact on the overall conversion probability. Especially for advertisement targeting these
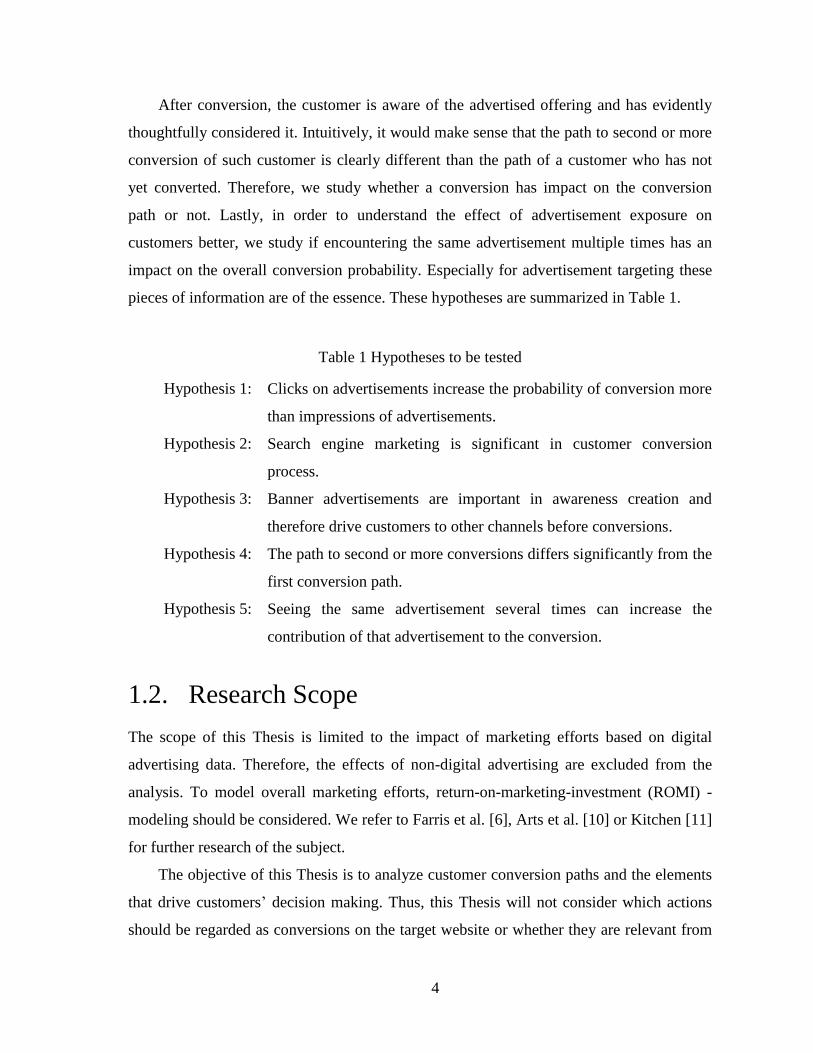
pieces of information are of the essence. These hypotheses are summarized in Table 1.
Table 1 Hypotheses to be tested
Hypothesis 1: Clicks on advertisements increase the probability of conversion more
than impressions of advertisements.
Hypothesis 2: Search engine marketing is significant in customer conversion
process.
Hypothesis 3: Banner advertisements are important in awareness creation and
therefore drive customers to other channels before conversions.
Hypothesis 4: The path to second or more conversions differs significantly from the
first conversion path.
Hypothesis 5: Seeing the same advertisement several times can increase the
contribution of that advertisement to the conversion.
1.2. Research Scope
The scope of this Thesis is limited to the impact of marketing efforts based on digital
advertising data. Therefore, the effects of non-digital advertising are excluded from the
analysis. To model overall marketing efforts, return-on-marketing-investment (ROMI) -
modeling should be considered. We refer to Farris et al. [6], Arts et al. [10] or Kitchen [11]
for further research of the subject.
The objective of this Thesis is to analyze customer conversion paths and the elements
that drive customers’ decision making. Thus, this Thesis will not consider which actions
should be regarded as conversions on the target website or whether they are relevant from
5
the perspective of marketing goals. In addition, such topics as preference levels of brands
prior to seeing online-advertisements are excluded from the analysis. This is not entirely in
line with reality, but some simplifications are needed in order to assess the impact of
online marketing.
1.3. Structure of the Thesis
The structure of this Thesis is as follows. Chapter 2 reviews the literature on attribution
modeling. Also, research in areas supporting attribution modeling will be reviewed,
including online advertising in general, online advertising channels and effects of cross
channel advertising. All these subjects are important for attribution modeling. Then in
Chapter 3 the available datasets and data processing are described. In Chapter 4 the
approach for attribution modeling and modeling steps are presented. The results of the
modeling are presented in Chapter 5. Chapter 6 contains the discussion of the modeling
approach and results. We conclude the Thesis in Chapter 7 with a summary.
6
Chapter 2
2. Attribution Modeling and Online Advertising
The objective of marketing is to communicate the advertiser’s offering to customers and to
increase the chance that the customer acquires the offering [12]. The effects of advertising
on customers have been widely studied [13], and research suggests that advertisements that
engage customers provide the best results [14] [15]. Goldfarb and Tucker [16] have found
that the most obtrusive advertisements appear to be the most effective ones in online
advertising, but this statement does not hold for all customers. It has been shown that
advertisement obtrusiveness can cause a decline in purchase intent among privacy
concerned customers [16]. Furthermore, Campbell [17] showed that advertisement
obtrusiveness can lead to reduced purchase intentions in TV advertising. On the other
hand, Ambler [13] suggests that if encountering an advertisement does not leave a trace in
long term memory, it has no effect at all on the customer, which supports the findings of
Goldfarb and Tucker [16] about the effectiveness of obtrusive advertisements. Because
studies give contradicting results of the effects of advertising, a part of the effects is
explained by the differences in customers’ behavior in different customer segments i.e.
how the advertisements effect different customers differently.
7
Internet has provided a new set of channels for marketers to engage their customers.
Advancements in technology have made it possible to measure marketing activities better
than before. Traditionally, analysis has been conducted on aggregated data, but nowadays
it is possible to analyze customer behavior at the individual level. It has been problematic
to measure the effects of offline marketing channels [6], such as printed media and TV,
because there has not been any efficient way to reliably track the effects of advertisements
on individuals. In the Internet, data from multiple sites can be combined (known as
‘clickstream’ data of a user) to examine the online behavior of individuals
comprehensively. Advertising platforms and small pieces of data called cookies have made
this possible.
A cookie is a small piece of data that allows a website to download data from the
user’s browser. Cookies store information about individuals’ browsing habits, and it is
used to collect behavior data anonymously. An advertising platform is a platform that is
provided by a third party. Through the platform, advertiser has access to multiple websites
to spread the advertisements. Combining the information of advertising platforms, cookies
and the information obtained from the advertiser’s own website, it is possible to conduct a
thorough analysis of customers’ behavior, and therefore optimizations in online advertising
activities can be done.
Using cookie data is an essential part of understanding customer online behavior, but
there are some serious drawbacks. First of all, cookies are browser and device (e.g. mobile
or computer) specific. Therefore, if a customer uses multiple browsers or multiple devices,
the behavior data of the same individual will be fragmented to different cookies that cannot
be combined reliably afterwards. Additionally, if multiple users use the same device and
browser, each action will be registered as if they were done by the same individual.
Secondly, the user may disable cookie tracking in the browser. If cookies are not enabled,
each action of such a customer is tracked as a unique encounter. Thus, the customer’s
every action will be registered as if it was done by new individuals. Luckily, such data is
straightforward to exclude from the analysis, and cookies are enabled by default in
browsers.
Despite the disadvantages of using cookies, detailed data of customer online behavior
has provided ways to take targeted marketing to a new level. Targeted marketing is the
8
practice of showing carefully selected advertisements to customers. In online advertising,
loads of specific customer behavior data is available for the advertiser. Therefore, the
advertiser can optimize in real time which advertisements should be shown to which
customer to maximize the effects of advertisements overall. Targeted marketing has been
found to have the highest impact on customers [18].
In order to perceive the customer journey to conversion (or purchase), marketers have
developed several frameworks to facilitate the analysis. Most often marketers talk about a
purchase or a conversion funnel of customers, which describes the path that a customer
traverses before converting [19]. A path is a summary of customer’s actions that include
such information as which advertisements the customer has seen, which websites they have
visited etc. One common form of conversion funnel consists of four sections: awareness,
research, decision and purchase [20]. In the stage of awareness the customer is aware of a
need that can be fulfilled with a product or service, while in research section the customer
seeks information regarding the product. In purchase stage customer has narrowed down
their alternatives to a few possible options. Conversion is the last step from the acquisition
point of view that the marketer desires to occur as the result of marketing activities [21].
Even though conversion funnel proposes a down-to-earth approach to perceive
customer conversion, contradicting results have been proposed of its validity; Jansen and
Schuster [20] propose that the purchase funnel is not an appropriate model for online
purchase process, not at least in retail industry and in search engine marketing. The reason
for this is that customers usually start looking for information in a search engine according
to purchase funnel, but as soon as they encounter a solution that satisfies the original need,
they will stop and convert without necessarily proceeding through each layer of the funnel.
Therefore, these contradicting results emphasize that one should not stagnate strictly to
conversion funnel framework and exceptions should be allowed.
Intuitively, it seems relevant to consider that a conversion is equivalent with a
purchase. However, the purpose of the website, in which the advertisement refers to, has
an impact on what should be counted as a conversion. For instance, manufacturers may not
sell their products directly to the end customers even if the manufacturer owns the brand.
Thus, their website may be more informative without an option to buy anything. In this
9
situation purchases cannot be counted and therefore other relevant events must be regarded
as conversions.
Because the goal of marketers is to induce as many customer conversions as possible,
it would seem reasonable to pay for advertising space based on performance basis, i.e.,
based on conversion rates. However, this is not the case always. Conventionally, online
advertisements are priced based on number of impressions and clicks on the
advertisements. Usually cost-per-impression (CPI), pay-per-click (PPC), cost-per-
conversion (CPC) and cost-per-mille (CPM) are used. All these metrics, except cost-per-
mille, measure the cost of one event (click, impression or conversion). Cost-per-mille
describes the cost of thousand impressions of an advertisement. Due to the fact that most
online advertisements are priced based on clicks or impressions, problem known as ‘click
fraud’ [22] poses a problem for marketers, because it can skew the performance analysis of
online campaigns and can be a source of additional expenses. According to the Click Fraud
Network, a community of online advertisers, agencies and search providers, 28.3% of all
clicks on paid search engine marketing results in 2007 may have been fraudulent [22].
In each industry, performance measurement is a significant part of business decision
making. Return-on-investment (ROI) calculations are a well-known approach in every
branch of business and it is essential part of measuring performance. However, with
limited information and simplistic models, these calculations can lead to sub-optimal
decisions. Thus, in the field of online advertising, these presented metrics do not tell the
whole truth of online campaign performance, because they do not take into account joint
effects of online advertising activities, let alone the effects of offline marketing activities.
To expand the understanding of impacts of online marketing investments, multi-touch
attribution modeling should be considered.
Finally, some research has been carried out in the field of marketing budget allocation,
but surprisingly, not much research on online marketing budgeting has been conducted.
Although, research on the subject has been done in the field of traditional marketing (for
instance by Fischer M. et al. [23]) and such methods could probably be extended to online
advertising. In this Thesis, insights into online marketing budgeting will be given, but a
thorough research on the subject is left for further research.
10
2.1. Digital Advertising Channels
There are several Internet channels with which marketers can either enhance existing
relationships or to acquire new customers. This section focuses on the most important
online channels, which are banner advertisements, search engines and social media. The
effects of cross channel advertising are also presented.
Banners are probably the best known form of online advertising. In principle, a banner
can be implemented to any website. A banner contains a still-image or interactive content.
Also, websites can hold numerous banner advertisements which can originate from
different advertisers. Naturally, the best possible scenario for an advertiser is to have no
competitive advertisements in view [24].
On a daily basis, customers encounter numerous banners, and actually they often find
those annoying [25] [26]. Nevertheless, Manchanda et al. [27] and Yoon and Lee [28]
show that banner advertising has a positive effect on customer purchase behavior. It has
been shown by commercial research [29] and academic research [24] that the probability
of user engaging with a banner is highest at the first encounter and after several exposures
the probability of click through drops significantly. Although, Chatterjee et al. [24] point
out that banner advertisements occupy a relatively small portion of the consumers’ visual
field and can be easily missed even if consumer is interested in them. Therefore, for some
customers, multiple exposures to the same banner advertisement may be needed, because
each exposure event increases the probability of user acknowledging the advertisement
[24].
According to Kireyev et al. [19] banners assist in the conversion process. In practice
this implies that banners direct customers to other channels such as search engines. This is
a valid argument for two reasons. First, some customers may avoid looking and clicking on
banners due to trust reasons for instance [9]. Secondly, because customers see banners
constantly on websites, even if they do not consciously focus on them, banners can still
remind the customer of the offering which can induce a conversion through another
channel later on. These reasons may skew impression statistics and therefore the
performance analysis of banner advertisements.
11
Banner advertisements are probably the best-known form of digital advertising, but
nowadays search engine marketing is the dominant way to advertise online [30]. Search
engines, such as Google, Bing and Yahoo!, have established a strong position in the field
of online marketing. Normally, search engine marketing yields better results compared to
banner advertising in terms of click-through-rates (CTR), because customers are highly
involved in situations when they encounter advertisements on the search engine; they are
looking for something as a result of cognitive thinking and the advertisements shown in
search engines are strongly related to the used keywords. Previous research has shown that
such combination increases the effectiveness of advertisements [7] [8].
To get visibility in search engines, there are two ways to achieve it: through organic
search (search engine organic, SEO) or bought keywords (search engine marketing, SEM).
In practice, search engines rank websites in relation to keywords. Based on sites’ ranking,
sites are shown in accordance with the keyword used for search. To get extra visibility in
search results, one can buy keywords so that for bought keywords predetermined
advertisements will be shown. The price of an advertisement depends on three things: the
overall demand of the keyword, maximum amount that the advertiser is ready to pay for
the keyword and on a predetermined quality score of the advertiser’s website [20]. The
rank of the advertisement among competitors’ advertisements is based on the price the
advertiser is willing to pay. Furthermore, it has been shown that the rank of an
advertisement shown with the search results has an effect on click and conversion rates
[31] [32].
In search engine marketing, keywords are categorized into two groups: branded and
generic. Branded keywords are specific and directly refer to the advertised brand or
product, such as ‘Apple’ or ‘MacBook Pro’ for instance. Generic keywords are broader
and usually more expensive, because companies in the same industry compete for those
words to acquire the attention of maximal number of customers. Generic keywords are
used to establish a stronger position for the advertiser’s brand, for instance by advertising
their products as a standard product of a certain category, such as ‘tablets’. Other examples
of keywords belonging to generic group are such as ‘computer’ and ‘smartphone’.
Intuitively, it may be difficult to recognize the dynamic relationship between branded and
generic keywords. However, Rutz and Bucklin [33] found that generic search activity
12
induces awareness of relevance among customers, which in turn increases the number of
branded searches that are more prone to facilitate conversions than generic keywords.
Buying keywords from a search engine is not the only option to get visibility in search
results. Websites will be shown ‘naturally’ in search results based on the site’s relevance to
the used keyword. Therefore, one must be careful with budget allocation not to overspend
in search engine marketing, because advertisements can ‘cannibalize’ clicks from natural
search results thus leading to unnecessary spending of advertising funds. On the other
hand, Yang and Ghose [30] found that the presence of paid advertisements and organic
search results together yield 4.5% increase in firm’s profit in comparison with absence of
paid advertisements or organic search results. They propose that one reason for this is the
“second opinion effect”: the customer sees both results and is encouraged by the fact that
there is, in addition to the advertisement that attempts to persuade the customer, a search
result that is generated by the search engine and therefore its content is beyond the reach of
the advertiser [34]. These dynamic elements of search engine marketing lead the advertiser
to a complex budget allocation problem. SEM budget optimization is not in the scope of
this Thesis.
One of the most recent developments in online advertising is the growing importance
of social media and electronic discussion platforms. Because customers can distinguish
advertisements from the flow of information online, the importance of peer communication
of products emerge. It has been shown that word-of-mouth (WOM) recommendations are
considered to be more credible and trustworthy than marketing activities of a firm [35].
Nowadays, there are numerous different electronic platforms in which customers can share
their brand experiences freely (e.g. discussion forums, social media, blogs etc.).
Traditionally firms have been able to control the content in their official channels, but
the advent of internet and social media have changed this setting dramatically: firms are
not in control of the content of the companies’ products generated by users on Internet.
Furthermore, social online networks can spread word-of-mouth information very
efficiently. Thus, brand management in social media is of the essence for marketers
nowadays [36].
To summarize the discussion of online advertising channels, there are multiple
websites and channels in which marketers can spread their advertisements. Each channel
13
has its unique role in the customer conversion process. By understanding the amount each
advertisement attributes to the overall conversion, marketers can optimize their marketing
activities. In order to conduct such activities, attribution of advertisements and means to
model attribution should be considered.
2.2. Attribution in Advertising
Attribution is the process of identifying a set of user actions ("events") that contribute in
some manner to a desired outcome, and then assigning value to each of these events [37].
Rather than assigning all the credit to the last or first advertisement the user sees, a division
of credit among all advertisements a user saw before conversion should be considered. In
the literature this problem is known as the multi-touch attribution problem (MTA) [37]. A
touch point is considered to be either an impression of the advertisement or a user click on
it.
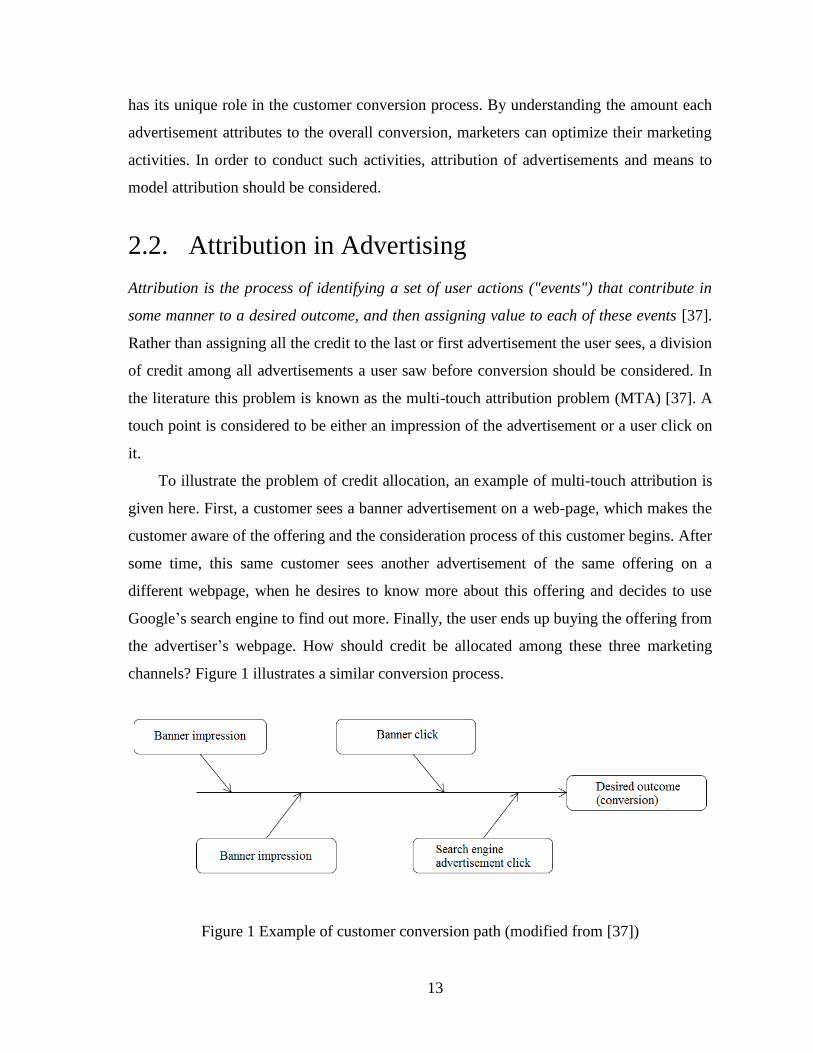
To illustrate the problem of credit allocation, an example of multi-touch attribution is
given here. First, a customer sees a banner advertisement on a web-page, which makes the
customer aware of the offering and the consideration process of this customer begins. After
some time, this same customer sees another advertisement of the same offering on a
different webpage, when he desires to know more about this offering and decides to use
Google’s search engine to find out more. Finally, the user ends up buying the offering from
the advertiser’s webpage. How should credit be allocated among these three marketing
channels? Figure 1 illustrates a similar conversion process.
Figure 1 Example of customer conversion path (modified from [37])
14
Surprisingly, besides last-click model, there is no standardized methodology to model
the cross-channel effects in the industry [4] [38] even though the problem has existed
because the beginning of online advertising. Particularly, this is due to the lack of
transparency across websites and a standardized approach in attribution modeling [39].
Naik and Raman [40] and Naik and Peters [41] have shown that advertisements
enhance the effect of other advertisements within and across marketing channels. This fact
emphasizes the importance of properly understanding the dynamics of advertising channels
and contribution of each advertisement to customer conversion. To achieve such
requirements, attribution modeling techniques provide answers to these matters.
2.3. Attribution Modeling Techniques
Attribution models attempt to define how each touch point contributes to the customer
conversion. Naturally, the better the dynamics and impact of online marketing channels are
understood, the better utilization of marketing budget is achieved i.e. the funds for
marketing can be used in a more efficient manner.
Many models exist with varying degree of complexity and understandability. Use of
simplistic models is sometimes justified due to the easiness of implementation or because
of the interpretability of model’s parameters. In general, descriptive modeling is used to
understand the contribution of each advertising channel better, while predictive modeling
may yield more usable results in budget allocation and continuous evaluation and control
of on-going campaigns.
There are basically two common types of attribution modeling approaches based on
the literature review: to distribute credit to different touch points based on certain model or
a rule (heuristic), or to model the dynamics between advertising channels and the behavior
of a customer. Credit distribution models are mostly discussed in commercial papers while
the latter approach is favored in academic research, but naturally, there are some overlaps.
Furthermore, based on the literature review there are four basic principles of conducting
attribution modeling. First, the credit among channels is divided by using simple heuristics.
Secondly, the problem can be regarded as a binary classification problem (i.e. whether the
customer will convert or not). Thirdly, the value of each channels’ contribution to overall
15
customer conversion is estimated with some probabilistic technique. Lastly, it is possible
to model the advertising efforts with multivariate time-series models. All these approaches
have their pros and cons.
The predominant way to apply attribution modeling is to use simple heuristics even
though such approaches ignore considerable amount of available information. The most
common problem of heuristic based attribution is the predetermined assumption built into
the model. Therefore, a more data-driven approach should yield results that are more in
line with the realized customer behavior. Nottorf [38] proposes that the modeling
technique should take the following things into account due to the heterogeneous nature of
the customer behavior data and the dynamic elements driving customer conversion:
1. Handle customer heterogeneity well.
2. Account for various advertising channels.
3. Address interaction effects across these multiple advertising channels.
To handle customer heterogeneity in the best possible way, one should consider
customer segmentation. Then, it would make sense to apply different attribution models to
different customer segments, but it can be problematic to segment customers reliably based
on purely clickstream data. If segmentation is done in this way, the segmentation criteria
must be justified very carefully.
If customers cannot be segmented, a data-driven model may give a generalized picture
of customers’ behavior. On the other hand, this may not be an issue because the effects of
marketing investments on individuals are difficult to measure, a general attribution model
that represents the whole sample should yield accurate enough results to be of practical
use. In addition to identifying the important characteristics of attribution modeling
technique, the goal of attribution modeling should be taken into account as well.
Ultimately, the objective of attribution modeling limits the number of techniques that are
of practical use.
The goal of attribution modeling should be defined so that marketers can make
decisions based on the model. Attribution modeling approach should be able to provide
answers, or at least guidelines, to budget allocation questions, because budget allocation is
the underlying element driving marketing activities and thus customer conversion rates. By
16
modeling the dynamics between channels, marketers can better understand how advertising
in different channels effects on customers’ actions.
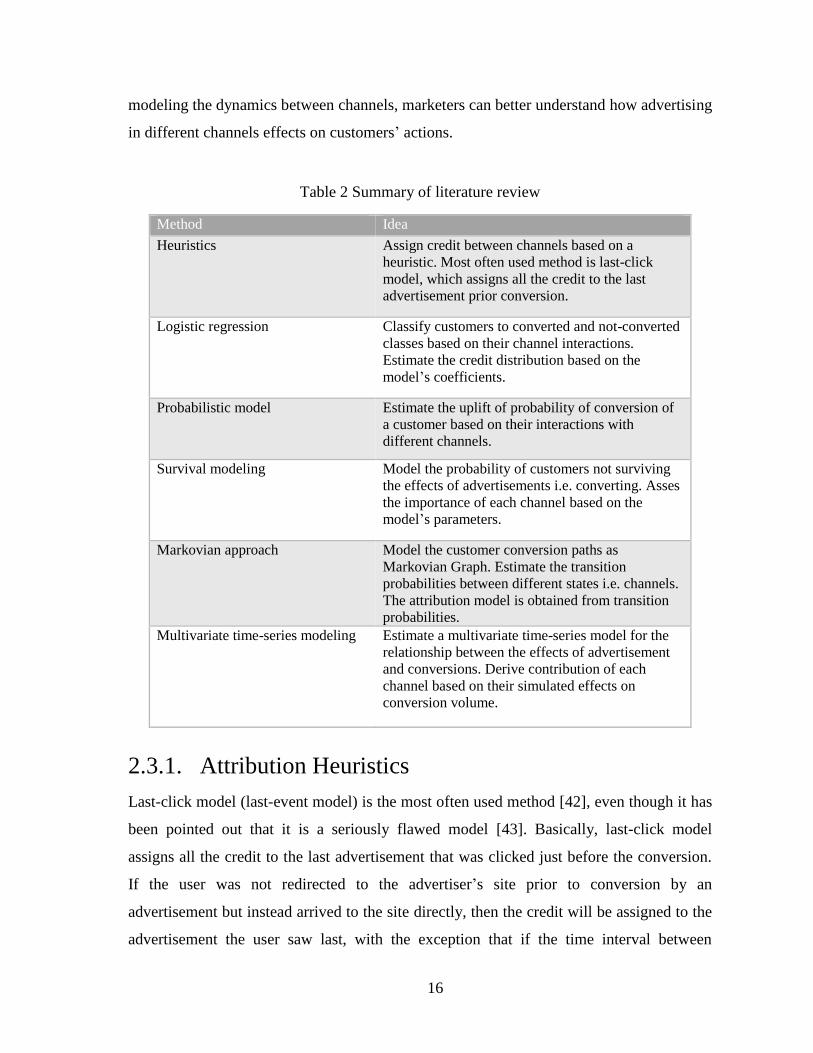
Table 2 Summary of literature review
Method Idea
Heuristics Assign credit between channels based on a
heuristic. Most often used method is last-click
model, which assigns all the credit to the last
advertisement prior conversion.
Logistic regression Classify customers to converted and not-converted
classes based on their channel interactions.
Estimate the credit distribution based on the
model’s coefficients.
Probabilistic model Estimate the uplift of probability of conversion of
a customer based on their interactions with
different channels.
Survival modeling Model the probability of customers not surviving
the effects of advertisements i.e. converting. Asses
the importance of each channel based on the
model’s parameters.
Markovian approach Model the customer conversion paths as
Markovian Graph. Estimate the transition
probabilities between different states i.e. channels.
The attribution model is obtained from transition
probabilities.
Multivariate time-series modeling Estimate a multivariate time-series model for the
relationship between the effects of advertisement
and conversions. Derive contribution of each
channel based on their simulated effects on
conversion volume.
2.3.1. Attribution Heuristics
Last-click model (last-event model) is the most often used method [42], even though it has
been pointed out that it is a seriously flawed model [43]. Basically, last-click model
assigns all the credit to the last advertisement that was clicked just before the conversion.
If the user was not redirected to the advertiser’s site prior to conversion by an
advertisement but instead arrived to the site directly, then the credit will be assigned to the
advertisement the user saw last, with the exception that if the time interval between
17
conversion and last interaction with an advertisement is considered to be too long [4]. The
reason for this is the time decay effect of advertisements.
Of course, last-click model is extremely simplistic and it is easy to implement and to
understand, but the model ignores a considerable amount of available information. This
fact is especially important for marketers, because they should exploit all the relevant
available information to better understand the behavior of their customers. In addition,
from the viewpoint of customer’s purchase decision making, purchase decisions may not
be taken instantly after seeing an advertisement and a time period for consideration may be
needed. To emphasize the issue, Kireyev et al. [19] points out that banner advertisements
induce a significant amount of search queries on search engines. Additionally, the click-
through rate is way lower in banner advertising compared to, for instance, branded search
engine marketing (0.11% in 2013 [44] vs. 1.68% [45] in 2013). Furthermore, the effects of
different advertising channels cannot be compared without taking the whole conversion
path into account due to the differences in their natures and purposes. For instance,
advertisements in search engines are presented to customers who have done a conscious
search and therefore it is probable that they are closer to the end of conversion path
compared to those who happen to see a glimpse of a banner advertisement on a website
and are not deliberately looking for the advertised offering. These facts cause considerable
undervaluation of banner advertisements when using last-click model.
The first event model is very similar to the last-click model. Here, the credit will be
assigned to the first advertisement of the conversion path [46]. Naturally, this is a
simplification of the customer’s decision making process. On the one hand, it may be so
that the first advertisement really initiated the consideration process and therefore should
be credited for it. On the contrary, it has been shown that users can develop “banner
blindness” [47]. This means that they learn how to avoid looking at banner advertisements
intuitively. Thus, the user may not acknowledge the presence of a banner at all. Therefore,
it is not definitive that the consideration process begins at the first impression.
Furthermore, because the offline advertising effects are not evaluated in attribution
modeling, it is not evident if the consideration process began well before encountering the
first advertisement on Internet. On the other hand, this problem is present in every
attribution modeling approach. To summarize first-click and last-click models, they have

18
significant flaws in the fundamental way how they measure online advertising efforts thus
leading to inaccurate budget allocation.
Several multi-touch models have been proposed to account for the combined effects
of advertisements of various channels. A straightforward approach is to distribute the
credit evenly between all touch points before conversion [46]. Such model is called a linear
model. Still, the linear model shares similar shortcomings as the first- and last-click
models, but on the other hand it emphasizes the reminder effect of advertisements (i.e.
each advertisement works as a reminder and contributes positively to the customer
conversion). Thus, the linear model may be a good alternative for last- and first-click
models in some situations.
Although it has been shown that effects of advertisements decay (wearout effect) over
time [24], and therefore even distribution may not be the optimal model to use in cases in
which the conversion path take long. To overcome the issue with time, time decay models
have been proposed [48]. Here the weight distribution between touch points is
concentrated on the most recent activities. But still, time decay models take into account
only one point of view of customer consideration process. Furthermore, time decay models
can yield flawed results in conversion paths, in which the time to conversion is short and
the effects of time decay may not have time to emerge. Thus, it is not optimal for an entire
sample of customers.
To combine multiple perspectives in attribution modeling, the U –shaped distribution
curve has been proposed [48]. In practice this means that the first and the last
advertisement seen by the customer are given the most weight and the credit between the
intermediate touch points is distributed based on the distance to the first or the last touch
point. The idea is simple: the first advertisement initiates the interest, advertisements
between first and last work as reminders, and finally the last advertisement converts the
customer. Although, this approach, as other approaches presented before, is strictly based
on a predetermined principle of how the conversion process takes place, leaving no space
for information that can emerge from the data itself. Therefore, these models assume that
the customer data is rather homogenous. To tackle the problem of heterogeneity of
customers, a more data driven approach should be considered [4]. Attribution models that
19
take into account the properties of the conversion path and the information that emerges
from the data have less bias than models that include certain built in assumptions.
According to Chandler-Pepelnjak [49], marketers may be reluctant to apply a
statistical model for attribution. Therefore, a compromise solution has been proposed
known as Engagement Mapping (E-Map) [49]. Engagement Mapping is a technique to
address attribution by assigning base weights to different advertisement channels based on
expert recommendations. Then, the contribution of each advertisement is calculated by
normalizing the values of base weights that have been adjusted with multipliers that take
the size of the advertisement, recency of advertisement exposure and the order of events
into account. Even though this approach seeks to yield more precise results than simple
heuristic attribution models, it still suffers from biases of the experts who define the
weights. To overcome these issues, a more data-driven approach should be considered.
2.3.2. Probabilistic Methods
Chatterjee et al. [24] were among the first to propose modeling of customer behavior on
websites with binary logistic regression. Logistic regression is generally used for
classification problems [50]. In binary classification problem, one attempts to classify
observations into two distinct classes, normally either to a success or to a failure class. The
basic idea of logistic regression is to estimate the odds that an observation belongs to a
certain class based on the information about the observation. Odds is the ratio of
probability of an observation belonging to a class divided by the probability of not
belonging to the class.
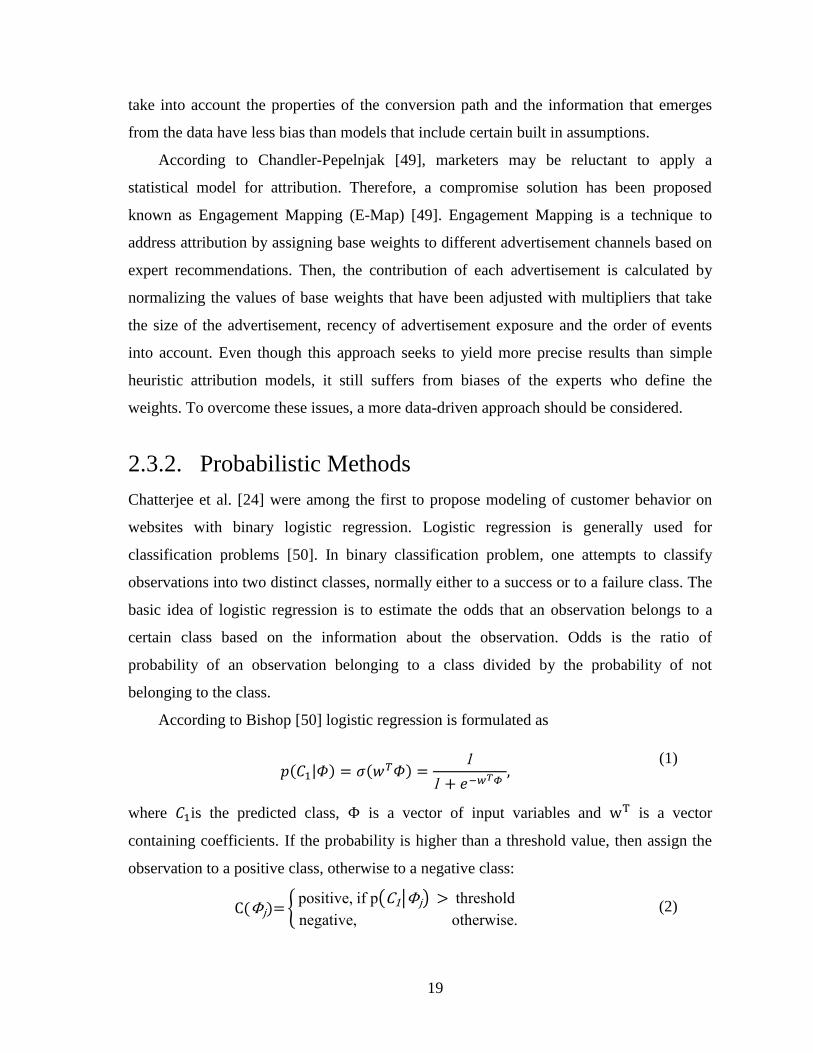
According to Bishop [50] logistic regression is formulated as
( | ) ( )
(1)
where is the predicted class, is a vector of input variables and is a vector
containing coefficients. If the probability is higher than a threshold value, then assign the
observation to a positive class, otherwise to a negative class:
( ) {positive if p( | ) threshold
ne ative other ise (2)
20
The threshold value is between 0 and 1 and it leads to a linear decision boundary. By
changing the threshold value, we can alter the sensitivity of the classifier.
The parameters of logistic regression model can be estimated using maximum
likelihood method [50]. In the case of normal regression, it is possible to obtain a closed
form solution for optimal parameters, but because there are no residuals in logistic
regression model, a closed form solution is not possible. Therefore, the likelihood function
must be evaluated iteratively, by for example using the Newton-Raphson method. We refer
to Bishop and Christopher [50] for a detailed explanation.
Originally Chatterjee et al. [24] modeled customer behavior on a website with
mandatory registration so that the predicted class of the observed variables is the
probability of user clicking a banner on the website based on the following explanatory
variables: number of banners the customer has seen so far, number of pages accessed on
the site, time between browsing sessions, number of all-time exposures to banner
advertisements and time because last click on a banner. They confirm the previous result
that the probability of user clicking a banner decreases as a function of number of
exposures. Also, a more recent study [38] extends this result so it applies for most
consumers, but not all. In addition, it is found that new visitors and less frequent visitors
are more prone to click on banner advertisements than regular visitors. This could be due
to the fact that customers can develop a skill to avoid looking at banners [47].
Chatterjee et al. [24] use a standard normal prior distribution to take the heterogeneity
of customers into account. In practice, with heterogeneity they mean the variety of click-
proneness on advertisements among customers. The values of coefficients describing
heterogeneity are drawn from standardized normal distribution in this case. However, there
is a disadvantage to use such approach as pointed out by Rossi and Allenby [51]. They
argue that it is not the optimal way to discover new structure from the data, because the
model of this approach tends to draw outlying units towards the center of the data.
Even though the approach proposed by Chatterjee et al. [24] does not take cross-
channel effects into account, the idea can be extended to model consumer behavior across
multiple channels as Nottorf [38] has done. They use display advertisement as well as paid
search advertisement data to model the clicking probability on display advertisements.
Additionally, they account for customer heterogeneity in a more sophisticated manner.
21
To overcome the drawbacks of Chatterjee et al. [24], Nottorf [38] discards the
assumption of common prior distribution and allows for K different normal models, where
K is the number of mixture components. This way, they are able to capture the properties
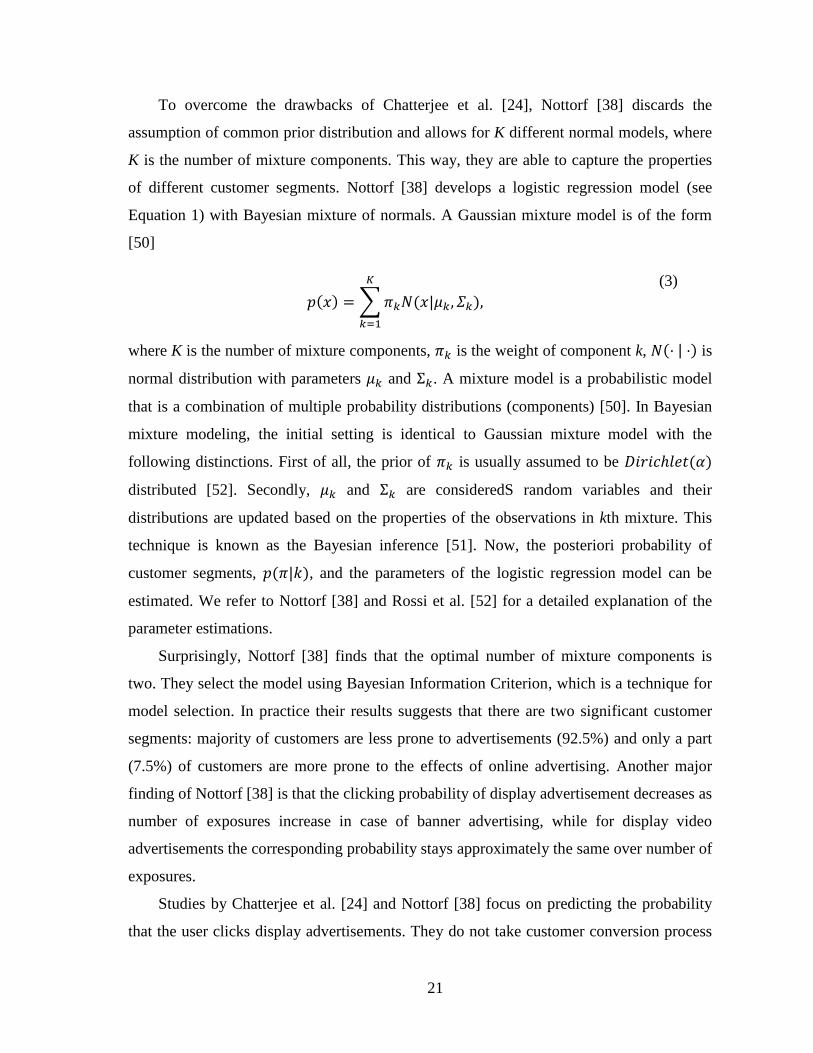
of different customer segments. Nottorf [38] develops a logistic regression model (see
Equation 1) with Bayesian mixture of normals. A Gaussian mixture model is of the form
[50]
( ) ∑ ( | )
(3)
where K is the number of mixture components, is the weight of component k, ( | ) is
normal distribution with parameters and . A mixture model is a probabilistic model
that is a combination of multiple probability distributions (components) [50]. In Bayesian
mixture modeling, the initial setting is identical to Gaussian mixture model with the
following distinctions. First of all, the prior of is usually assumed to be ( )
distributed [52]. Secondly, and are consideredS random variables and their
distributions are updated based on the properties of the observations in kth mixture. This
technique is known as the Bayesian inference [51]. Now, the posteriori probability of
customer segments, ( | ), and the parameters of the logistic regression model can be
estimated. We refer to Nottorf [38] and Rossi et al. [52] for a detailed explanation of the
parameter estimations.
Surprisingly, Nottorf [38] finds that the optimal number of mixture components is
two. They select the model using Bayesian Information Criterion, which is a technique for
model selection. In practice their results suggests that there are two significant customer
segments: majority of customers are less prone to advertisements (92.5%) and only a part
(7.5%) of customers are more prone to the effects of online advertising. Another major
finding of Nottorf [38] is that the clicking probability of display advertisement decreases as
number of exposures increase in case of banner advertising, while for display video
advertisements the corresponding probability stays approximately the same over number of
exposures.
Studies by Chatterjee et al. [24] and Nottorf [38] focus on predicting the probability
that the user clicks display advertisements. They do not take customer conversion process
22
or budgeting into account in exactly the same way it is studied in this Thesis, but their
methodology is usable for attribution modeling also: instead of predicting probability of a
click on display advertisements, the probability of conversion could be modeled. Shao and
Li [4] have focused more on attribution modeling from this perspective. They use a bagged
logistic regression and a second-order conditional probabilistic model for attribution
modeling purposes.
Logistic regression with various combinations of other methods has been used to
model customer behavior and online advertising [4] [24] [38]. There are three significant
disadvantages to it according to Dalessandro et al. [42] and Chandler-Pepelnjak [49]. First,
the parameters are difficult to interpret [42]. Second, logistic regression requires
aggregated level data to be of practical use [49]. Third, negative coefficients of predictors
can emerge due to collinearity [42]. Collinearity in regression modeling describes the
correlation of predictor variables that may cause impreciseness in the estimated models.
Shao and Li [4] overcome this problem by using a technique called ba in (“bootstrap
a re atin ”) in their logistic regression model.
Bagging is an ensemble method that is used to improve classification performance by
combining multiple weak predictions to produce a single stronger prediction [53]. Bagging
was first introduced by Breinman [54]. The idea of bagging is to take N bootstrap samples
of the training set and estimate N models using each dataset once. A bootstrap sample is
constructed by randomly selecting M observations from the training set, with replacement,
where M is the size of the training set.
For classification purposes, bagging uses a majority vote rule i.e. using all estimated
models to predict the class and label the observation to the class that majority of the
models predict. Finally, the model’s coefficients are estimated by averaging the
coefficients of N bagged models. With bagging the variance of the model may be reduced
[54] and by averaging the estimates the risk of overfitting can be mitigated [55] [56] [57].
The greatest disadvantage of applying logistic regression to attribution modeling from
the perspective of this Thesis is that coefficients of the predictive variables are difficult to
interpret. The interpretations of coefficients can provide insights on a very high level while
campaign performance analysis demands strictly quantitative results (i.e. it is not possible
23
to interpret the coefficients so that one could say, for instance, how many conversions will
be achieved if one coefficient is increased by one unit).
Another similar approach to logistic regression was proposed by Manchanda et al.
[27]. Instead of modeling the probability of a click they model the probability of purchase
based on exposure to banner advertisements by developing a proportional hazard model on
week-level data. Based on their research, exposure to banner advertisements has a
significant effect on customer purchase behavior. Furthermore, their results underline the
importance of appropriately addressing cross-channel effects: they found that probability
of purchase increases after banner impression. Thus, they propose that the use of
instantaneous metrics, such as click-through-rates, may yield inaccurate results. They are
the first to apply survival modeling to model the effects of online advertisements on
customer conversion behavior.
Proportional hazard model is a modeling technique of survival analysis, in which the
basic idea is to model the probability of survival in respect to time. This idea can be
applied in attribution modeling by modeling the probability of ‘a customer not surviving
the effects of advertising’ i.e. the probability of customer converting as a result of
marketing efforts. One advantage to use proportional hazard model is that by doing so, it is
possible to capture the impacts of changes in model’s covariates to the hazard rate [58].
Hazard rate describes the risk of failure per time unit at different time intervals; in this case
it is the risk of conversion per time unit. Therefore, it is possible to estimate the impact on
conversion probability based on changes in the covariates (e.g. number of seen
advertisements, number of pages visited etc.). Such approach has been used also by
Chandler-Pepelnjak [49].
Shao and Li [4] propose a simple probabilistic model that takes into account user
conversion and cross-channel effects. To the best of author’s knowledge, they were the
first to include conversions and cross-channel effects into modeling. Their model is based
on first and second-order conditional probabilities. There are several advantages to such
approach. First of all, the model is easy to interpret. Second, it yields low estimation
variability, but trades off accuracy [4]. The idea of the model is the following. For each
channel calculate the probability of user conversion and for each two channel pairs (user
24
exposed to two channels) calculate the probability of user conversion and sum them up to
estimate the contribution of each channel:
( ) ( | )
( )∑ { ( | ) ( | ) ( | )}
(4)
The definitions of variables in Equation 4 are: C is the contribution of channel i, y is a
binary variable denoting conversion, N is the number of channels, ( | ) is the
conditional probability of conversion given the user has been exposed to channel i and
( | ) is the second-order conditional probability of user conversion.
Theoretically it is possible to use higher order conditional probabilities. The problem
is that this increases the complexity of model parameter estimation algorithm. Thus,
additional accuracy may not be worth of the extra complexity one must pay in terms of
calculation time. To support this statement, Shao and Li [4] found that the number of data
samples with third-order conversion paths dropped significantly even though their dataset
consisted of over two billion impressions and clicks of advertisements. Therefore, second
order conditional probabilities should yield accurate enough results to be of practical use.
Dalessandro et al. [42] extend the work on probabilistic modeling of Shao and Li [4].
They propose attribution modeling to be considered as a causal estimation problem. Thus,
the parameters are selected so that they directly measure the marginal uplift of value
creation of each advertisement and channel. Therefore, Dalessandro et al. [42] argue that
credit distribution among advertisements should directly be derived from this metric. They
propose that the sum of expected value of change in conversion probability after being
exposed to an advertisement in a channel should be considered as the amount of credit to
be yielded to a channel. The estimation of such parameters is not straightforward. We refer
to Dalessandro et al. [42] for a detailed explanation of the procedure.
Probabilistic models seem to prevail in attribution modeling research. Anderl et al. [5]
contribute to the cause by introducing a graph-based Markovian framework to define
optimal credit distribution among channels. They adapt the idea from Archak et al. [59],
who used a similar approach in modeling search engine advertising. The main advantage
of this approach is that the modeling technique can identify structural correlations in
individual level data [5]. Furthermore, this approach does not rely on aggregate-level data.

25
Therefore, the user level specific behavior is captured in an efficient manner. On top of all,
because the approach proposed by Anderl et al. [5] does not make any assumptions about
nature of channels or decision processes of the customers, it is very versatile.
Markov network (or graph) is a graph representation of a Markov chain in which each
vertex is a possible state (advertising channel in this case) and edges represent the
probability of transition between the states. By estimating the transition probabilities, the
division of attribution can be made. Anderl et al. [5] use Markov models up to fourth order
i.e. taking up to four last states into account to estimate the probability of next transition.
Anderl et al. [5] found that the greatest increase in accuracy is achieved when moving from
the second to third order Markov chain, and only a marginal increase in terms of accuracy
is gained by using a fourth order model instead of order of three.
The average lengths of customer journeys in datasets analyzed by Anderl et al. [5]
were relatively short on average (3 to 5.25 days). Therefore, they found only limited
differences between their approach and first- and last-click model. Although, several initial
conditions of the analysis must be noted. First of all, they had four datasets: one of travel,
two of fashion retail and one of luggage retail. These companies operate completely online,
so the effects of offline marketing activities are excluded completely. Secondly, and most
importantly, their analysis is purely based on data that contains only clicks and not
impressions. This leads inevitably to the undervaluation of display advertisements.
Anderl et al. [5] finds significant differences in the credit distribution of advertising
channels between industries. This result strongly speaks in favor for industry, and maybe
even brand, specific attribution models. The results of their proposed approach with click-
only data differ considerable from analyses that take the impressions also into account.
Kireyev et al. [19] found that optimal budget allocation between search and display is 63-
37, while Anderl et al. [5] propose only 5% of spending in display at best. Of course, these
analyses are from different industries and with slightly different perspectives, but still the
magnitude of difference is noteworthy. Also, Kireyev et al. [19] estimates the budget
allocation based on impressions and clicks, which provides evidence of the importance of
impressions, especially in the case of banner advertising.
All in all, Anderl et al. [5] propose a relatively straightforward approach to attribution
modeling, but unfortunately their approach lacks the ability to propose any means for
26
budget optimizations even though some guidelines could be obtained from the final credit
division. They propose that the budget should be allocated according to the value
contribution of each channel, but this rule for budget allocation is not optimal, or may not
even be good, because the estimated model describes only the data that is used for
estimating the model and the data does not take the actual performance of channels into
account.
2.3.3. Multivariate Time-Series Models
Kireyev et al. [19] propose a multivariate time-series model to estimate the dynamics of
search and display advertising. A multivariate time-series model consists of multiple
individual time-series models, in which each time-series influences each other based on
some principles. In this case the following time-series are modeled on week-level data:
number of conversions induced by display advertisements, number of conversions by
search advertisements, number of impressions of search engine advertisements, number of
clicks on search engine advertisements and number of impressions of display
advertisements. They use Bayesian Information Criterion to identify that lag-length of
variables is optimal at value of one, which makes sense: last week’s impressions and clicks
influence next week’s conversions. This is in line with the behavior of customers in the
studied industry; the dataset is from banking and it has been recognized that the customer
consideration process is longer than in, for instance, retailing.
In practice, Kireyev et al. [19] model the conversions based on impressions and clicks
with a vector error correction model (VECM). The idea of VECM is to model how fast a
dependent variable returns to its equilibrium after a disturbance (i.e. a change in the
predicting variables). They use impulse response analysis to evaluate the impact of
marketing investments and attempt to cover the spillover and long-term effects of
advertisements with such methods. Finally, by using elasticities of advertisement channels,
they propose the optimal budget allocation between search and display advertisements by
taking into account long-term and the dynamic effects of advertising. Furthermore, they
recognize that impressions and clicks on banner advertisements induce search queries,
which they take into account in determining the optimal allocation of marketing funds.

27
Their approach has several disadvantages. First of all, they model only the dynamics
between two channels: search and display. Even though these are probably the most
important channels, it still does not correspond reality. Furthermore, it can be complicated
to expand the analysis for instance on site level i.e. what is the contribution of each site and
its advertisements to the overall number of conversions. Secondly, long term effects of an
impulse (i.e. investment to the advertising channels) may be difficult to interpret.
According to the model, an impulse to impressions and clicks generate conversions after
many weeks and never reaches to zero. Therefore, an impulse (i.e. increased spending in
banner advertisements) causes a permanent change to the base level of number of
conversions (i.e. to the number of conversions that would occur without any advertising
activities at all). Because the competition is so fierce, it is difficult to argue that the long-
term effects of online advertisements are as significant as the model proposes.
Despite its limitations, the time-series approach provides a very interesting approach
to modeling dynamics of advertising channels. Still, the downsides in interpreting the
results make it difficult to advocate the use of such model.
28
Chapter 3
3. Data Description and Processing
3.1. Data Description
The analysis is conducted with three different datasets. Two of these are combined into one
customer path dataset and the third is used for performance analysis. The datasets are: a
dataset of customer interactions with banner advertisements across websites, a dataset of
customer behavior information on the target website and a dataset that contains all the
pricing information of different channels. With ‘target website’, we mean the site in which
the customer conversions occur.
These datasets are constructed as follows. The customers’ interactions are recorded so
that each recordable interaction with the website is recorded. Therefore, each row contains
one customer action that represents an impression or a click. Because all interactions are
recorded, there are no missing values in the datasets. These interactions are stored in a
dataset that is provided by a third party (advertising platform). We denote this dataset as
APD (advertising platform data). The relevant pieces of information of APD are presented
in Table 3.
29
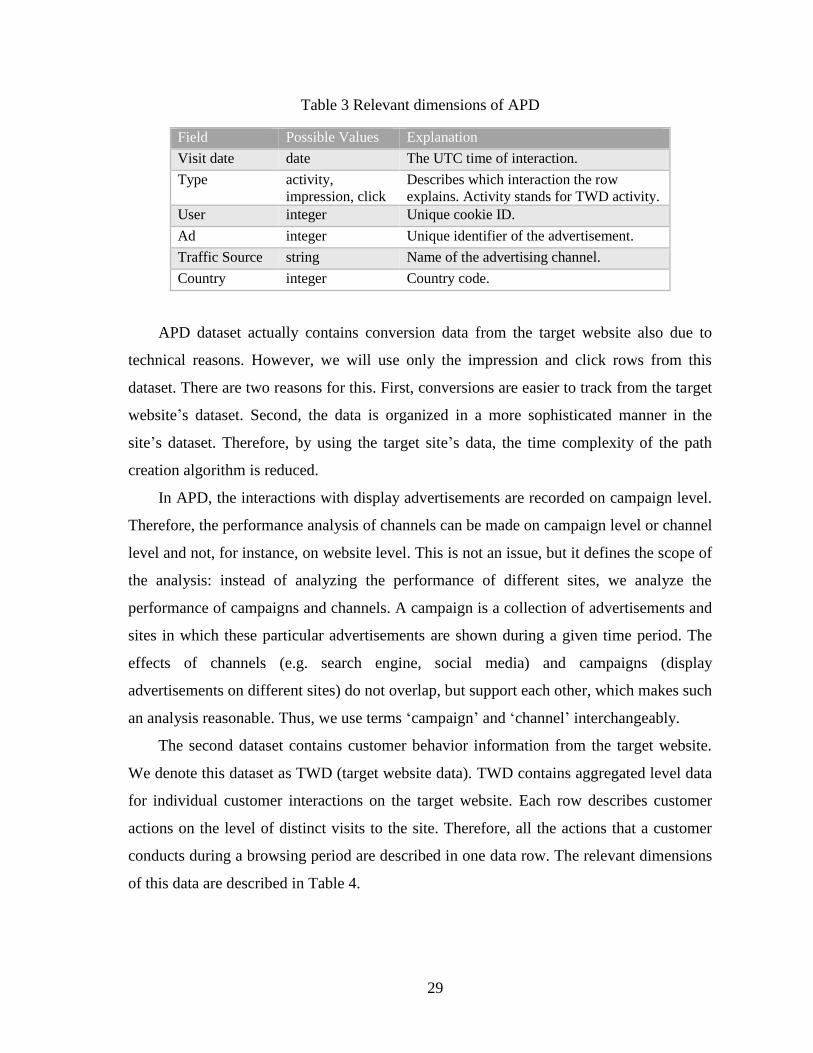
Table 3 Relevant dimensions of APD
Field Possible Values Explanation
Visit date date The UTC time of interaction.
Type activity,
impression, click
Describes which interaction the row
explains. Activity stands for TWD activity.
User integer Unique cookie ID.
Ad integer Unique identifier of the advertisement.
Traffic Source string Name of the advertising channel.
Country integer Country code.
APD dataset actually contains conversion data from the target website also due to
technical reasons. However, we will use only the impression and click rows from this
dataset. There are two reasons for this. First, conversions are easier to track from the target
website’s dataset. Second, the data is organized in a more sophisticated manner in the
site’s dataset. Therefore, by using the target site’s data, the time complexity of the path
creation algorithm is reduced.
In APD, the interactions with display advertisements are recorded on campaign level.
Therefore, the performance analysis of channels can be made on campaign level or channel
level and not, for instance, on website level. This is not an issue, but it defines the scope of
the analysis: instead of analyzing the performance of different sites, we analyze the
performance of campaigns and channels. A campaign is a collection of advertisements and
sites in which these particular advertisements are shown during a given time period. The
effects of channels (e.g. search engine, social media) and campaigns (display
advertisements on different sites) do not overlap, but support each other, which makes such
an analysis reasonable. Thus, we use terms ‘campaign’ and ‘channel’ interchangeably.
The second dataset contains customer behavior information from the target website.
We denote this dataset as TWD (target website data). TWD contains aggregated level data
for individual customer interactions on the target website. Each row describes customer
actions on the level of distinct visits to the site. Therefore, all the actions that a customer
conducts during a browsing period are described in one data row. The relevant dimensions
of this data are described in Table 4.
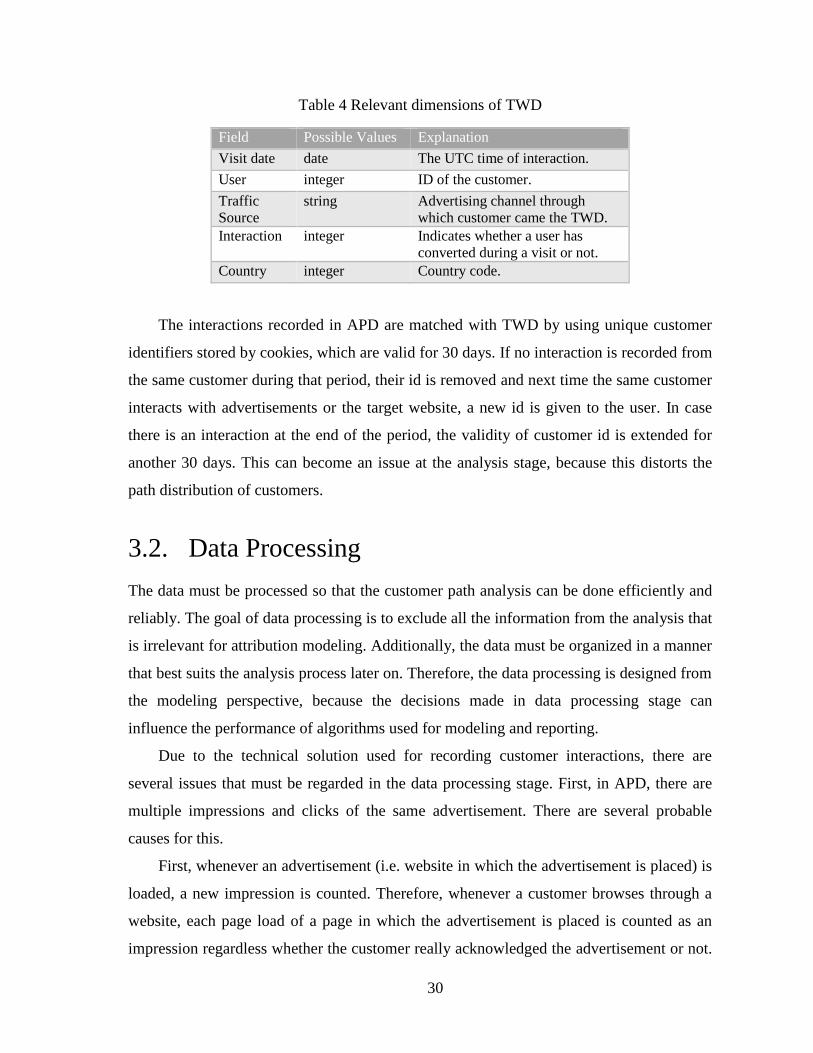
30
Table 4 Relevant dimensions of TWD
Field Possible Values Explanation
Visit date date The UTC time of interaction.
User integer ID of the customer.
Traffic
Source
string Advertising channel through
which customer came the TWD.
Interaction integer Indicates whether a user has
converted during a visit or not.
Country integer Country code.
The interactions recorded in APD are matched with TWD by using unique customer
identifiers stored by cookies, which are valid for 30 days. If no interaction is recorded from
the same customer during that period, their id is removed and next time the same customer
interacts with advertisements or the target website, a new id is given to the user. In case
there is an interaction at the end of the period, the validity of customer id is extended for
another 30 days. This can become an issue at the analysis stage, because this distorts the
path distribution of customers.
3.2. Data Processing
The data must be processed so that the customer path analysis can be done efficiently and
reliably. The goal of data processing is to exclude all the information from the analysis that
is irrelevant for attribution modeling. Additionally, the data must be organized in a manner
that best suits the analysis process later on. Therefore, the data processing is designed from
the modeling perspective, because the decisions made in data processing stage can
influence the performance of algorithms used for modeling and reporting.
Due to the technical solution used for recording customer interactions, there are
several issues that must be regarded in the data processing stage. First, in APD, there are
multiple impressions and clicks of the same advertisement. There are several probable
causes for this.
First, whenever an advertisement (i.e. website in which the advertisement is placed) is
loaded, a new impression is counted. Therefore, whenever a customer browses through a
website, each page load of a page in which the advertisement is placed is counted as an
impression regardless whether the customer really acknowledged the advertisement or not.
31
Second, a banner type of “carousel” can cause multiple impressions for the same customer
even though the customer did nothing on the website. Carousel banner is a display
advertisement type, in which the advertisement is refreshed with some time interval and
each refresh is counted as a unique impression. Third, the target (e.g. a banner
advertisement) that a customer tried to click may not have seemed to work and therefore
the customer can do multiple clicks on the advertisement before the site seemingly
responded to the action. Even though the outcome of the customer action may not be
immediately revealed to the customer, the website counts each such action as an equivalent
click.
These are probably the most important reasons for multiple records in the dataset.
However, in order to adequately create the customer conversion paths it is important to
know which events are regarded as distinct touch points i.e. which are the actions that had
influence on the customer. It is not reasonable to count several consecutive impressions or
clicks as unique touch points if the time intervals between these interactions are short
enough. There are two reasons for this. First, it is not possible to distinguish which
interaction is the one that is relevant for the customer i.e. has an influence on the customer.
The reason for this is that there is no property of the impression or a click with which the
categorization of such action could be done reliably.
Second, in addition to the problem of recognizing the relevant interactions, issue of
customer behavior and advertisement influence emerges: the customer may not
acknowledge the advertisement at first, but after few occurrences they may recognize it
[24]. Therefore, by combining consecutive interactions, we are able to capture the effects
of advertisements on all different customers with the expense of counting meaningless
interactions also. Moreover, by using this approach we mitigate the need to use a
segmentation method for customers based on their display advertisement proneness that
can be difficult to define reliably based on these datasets.
Even though we aggregate consecutive interactions to count as single touch points, it
is as important to calculate the total number of interactions occurred at each touch point.
The reason for this is simple: the pricing of advertisements is most often based on the
number of individual impressions or clicks. Therefore, each of these interactions must be
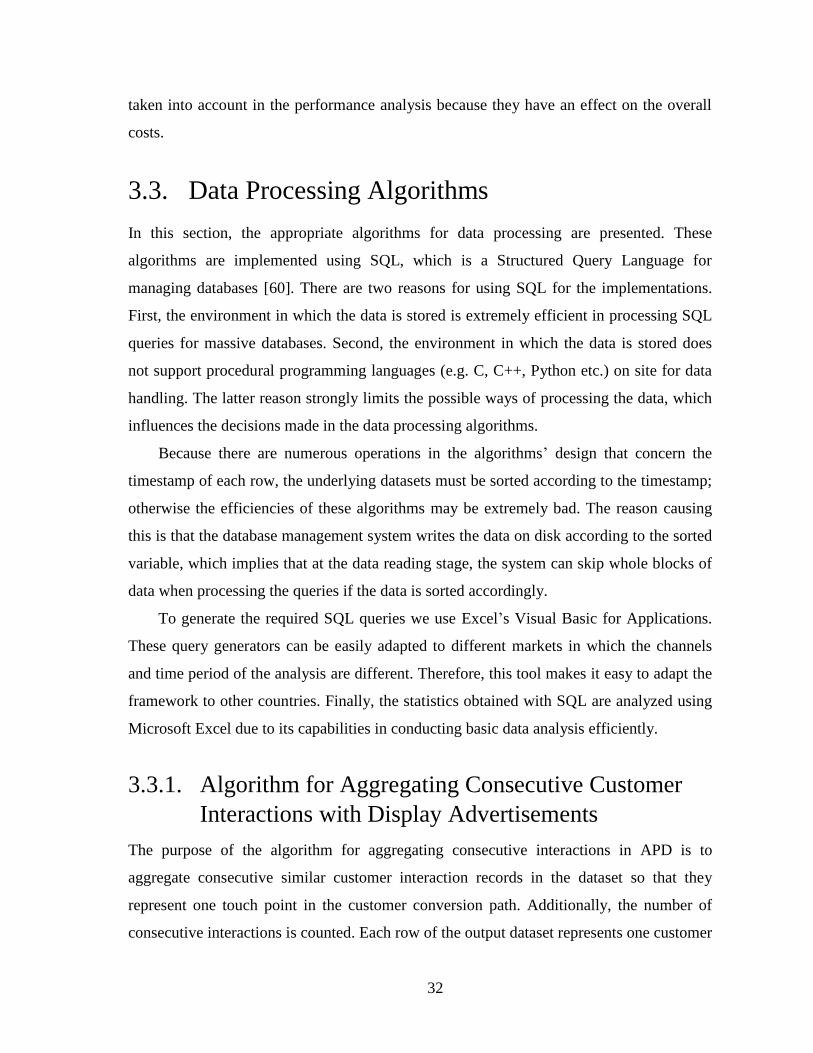
32
taken into account in the performance analysis because they have an effect on the overall
costs.
3.3. Data Processing Algorithms
In this section, the appropriate algorithms for data processing are presented. These
algorithms are implemented using SQL, which is a Structured Query Language for
managing databases [60]. There are two reasons for using SQL for the implementations.
First, the environment in which the data is stored is extremely efficient in processing SQL
queries for massive databases. Second, the environment in which the data is stored does
not support procedural programming languages (e.g. C, C++, Python etc.) on site for data
handling. The latter reason strongly limits the possible ways of processing the data, which
influences the decisions made in the data processing algorithms.
Because there are numerous operations in the algorithms’ design that concern the
timestamp of each row, the underlying datasets must be sorted according to the timestamp;
otherwise the efficiencies of these algorithms may be extremely bad. The reason causing
this is that the database management system writes the data on disk according to the sorted
variable, which implies that at the data reading stage, the system can skip whole blocks of
data when processing the queries if the data is sorted accordingly.
To generate the required SQL queries we use Excel’s Visual Basic for Applications.
These query generators can be easily adapted to different markets in which the channels
and time period of the analysis are different. Therefore, this tool makes it easy to adapt the
framework to other countries. Finally, the statistics obtained with SQL are analyzed using
Microsoft Excel due to its capabilities in conducting basic data analysis efficiently.
3.3.1. Algorithm for Aggregating Consecutive Customer
Interactions with Display Advertisements
The purpose of the algorithm for aggregating consecutive interactions in APD is to
aggregate consecutive similar customer interaction records in the dataset so that they
represent one touch point in the customer conversion path. Additionally, the number of
consecutive interactions is counted. Each row of the output dataset represents one customer
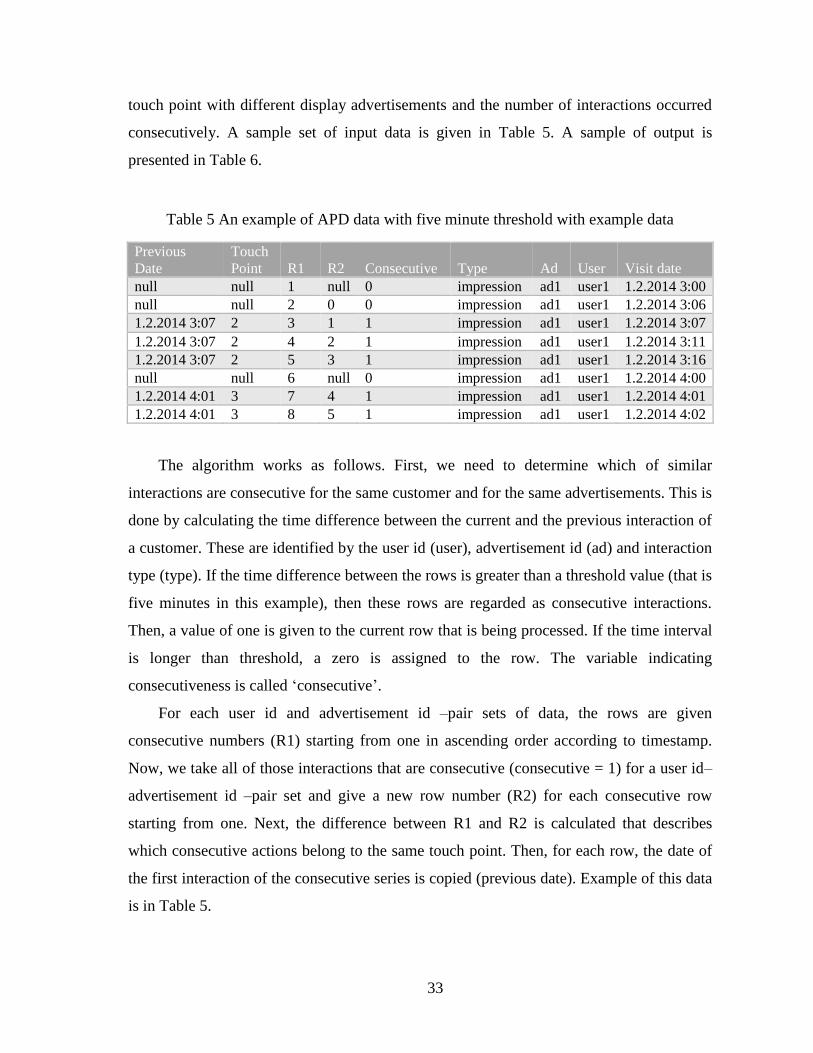
33
touch point with different display advertisements and the number of interactions occurred
consecutively. A sample set of input data is given in Table 5. A sample of output is
presented in Table 6.
Table 5 An example of APD data with five minute threshold with example data
Previous
Date
Touch
Point R1 R2 Consecutive Type Ad User Visit date
null null 1 null 0 impression ad1 user1 1.2.2014 3:00
null null 2 0 0 impression ad1 user1 1.2.2014 3:06
1.2.2014 3:07 2 3 1 1 impression ad1 user1 1.2.2014 3:07
1.2.2014 3:07 2 4 2 1 impression ad1 user1 1.2.2014 3:11
1.2.2014 3:07 2 5 3 1 impression ad1 user1 1.2.2014 3:16
null null 6 null 0 impression ad1 user1 1.2.2014 4:00
1.2.2014 4:01 3 7 4 1 impression ad1 user1 1.2.2014 4:01
1.2.2014 4:01 3 8 5 1 impression ad1 user1 1.2.2014 4:02
The algorithm works as follows. First, we need to determine which of similar
interactions are consecutive for the same customer and for the same advertisements. This is
done by calculating the time difference between the current and the previous interaction of
a customer. These are identified by the user id (user), advertisement id (ad) and interaction
type (type). If the time difference between the rows is greater than a threshold value (that is
five minutes in this example), then these rows are regarded as consecutive interactions.
Then, a value of one is given to the current row that is being processed. If the time interval
is longer than threshold, a zero is assigned to the row. The variable indicating
consecutiveness is called ‘consecutive’.
For each user id and advertisement id –pair sets of data, the rows are given
consecutive numbers (R1) starting from one in ascending order according to timestamp.
Now, we take all of those interactions that are consecutive (consecutive = 1) for a user id–
advertisement id –pair set and give a new row number (R2) for each consecutive row
starting from one. Next, the difference between R1 and R2 is calculated that describes
which consecutive actions belong to the same touch point. Then, for each row, the date of
the first interaction of the consecutive series is copied (previous date). Example of this data
is in Table 5.
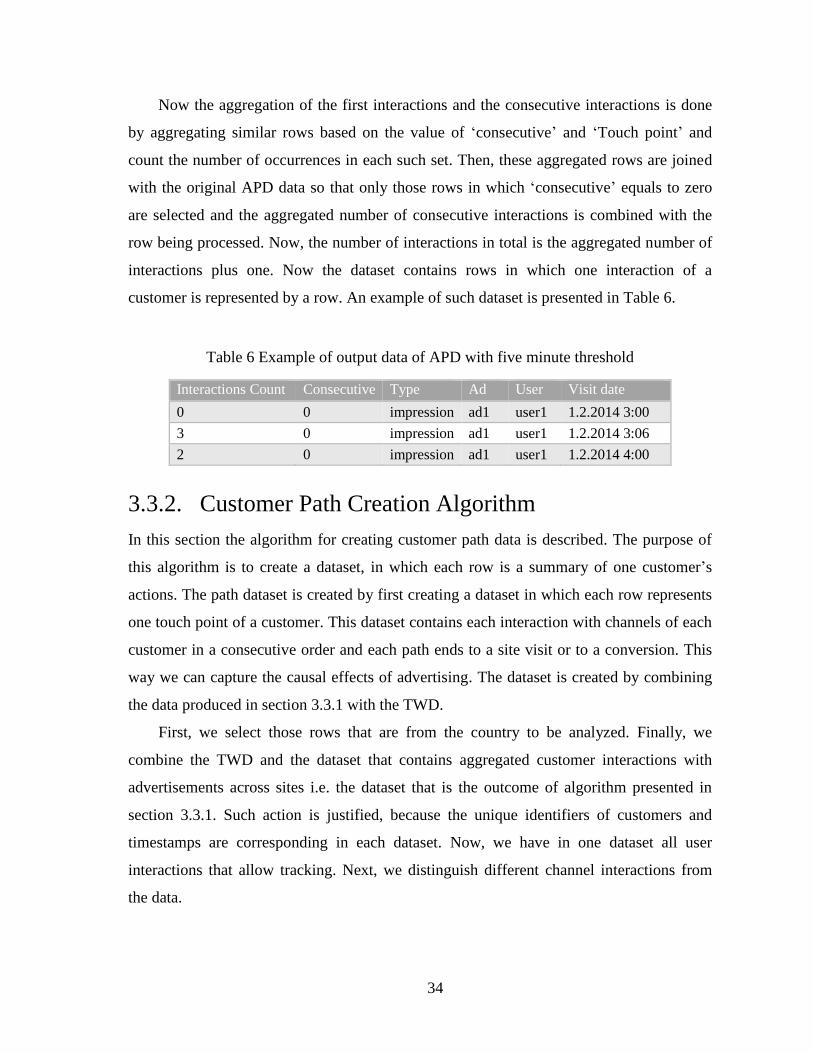
34
Now the aggregation of the first interactions and the consecutive interactions is done
by aggregating similar rows based on the value of ‘consecutive’ and ‘Touch point’ and
count the number of occurrences in each such set. Then, these aggregated rows are joined
with the original APD data so that only those rows in which ‘consecutive’ equals to zero
are selected and the aggregated number of consecutive interactions is combined with the
row being processed. Now, the number of interactions in total is the aggregated number of
interactions plus one. Now the dataset contains rows in which one interaction of a
customer is represented by a row. An example of such dataset is presented in Table 6.
Table 6 Example of output data of APD with five minute threshold
Interactions Count Consecutive Type Ad User Visit date
0 0 impression ad1 user1 1.2.2014 3:00
3 0 impression ad1 user1 1.2.2014 3:06
2 0 impression ad1 user1 1.2.2014 4:00
3.3.2. Customer Path Creation Algorithm
In this section the algorithm for creating customer path data is described. The purpose of
this algorithm is to create a dataset, in which each row is a summary of one customer’s
actions. The path dataset is created by first creating a dataset in which each row represents
one touch point of a customer. This dataset contains each interaction with channels of each
customer in a consecutive order and each path ends to a site visit or to a conversion. This
way we can capture the causal effects of advertising. The dataset is created by combining
the data produced in section 3.3.1 with the TWD.
First, we select those rows that are from the country to be analyzed. Finally, we
combine the TWD and the dataset that contains aggregated customer interactions with
advertisements across sites i.e. the dataset that is the outcome of algorithm presented in
section 3.3.1. Such action is justified, because the unique identifiers of customers and
timestamps are corresponding in each dataset. Now, we have in one dataset all user
interactions that allow tracking. Next, we distinguish different channel interactions from
the data.
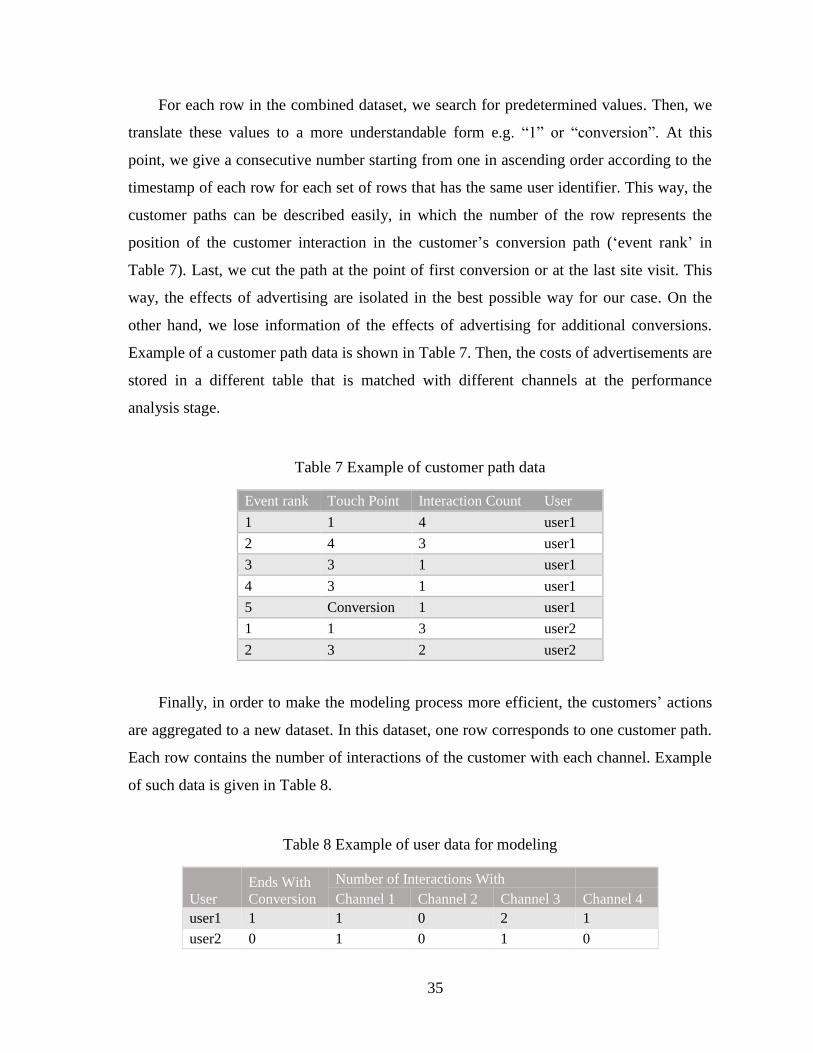
35
For each row in the combined dataset, we search for predetermined values. Then, we
translate these values to a more understandable form e.g “1” or “conversion” At this
point, we give a consecutive number starting from one in ascending order according to the
timestamp of each row for each set of rows that has the same user identifier. This way, the
customer paths can be described easily, in which the number of the row represents the
position of the customer interaction in the customer’s conversion path (‘event rank’ in
Table 7). Last, we cut the path at the point of first conversion or at the last site visit. This
way, the effects of advertising are isolated in the best possible way for our case. On the
other hand, we lose information of the effects of advertising for additional conversions.
Example of a customer path data is shown in Table 7. Then, the costs of advertisements are
stored in a different table that is matched with different channels at the performance
analysis stage.
Table 7 Example of customer path data
Event rank Touch Point Interaction Count User
1 1 4 user1
2 4 3 user1
3 3 1 user1
4 3 1 user1
5 Conversion 1 user1
1 1 3 user2
2 3 2 user2
Finally, in order to make the modeling process more efficient, the customers’ actions
are aggregated to a new dataset. In this dataset, one row corresponds to one customer path.
Each row contains the number of interactions of the customer with each channel. Example
of such data is given in Table 8.
Table 8 Example of user data for modeling
User
Ends With
Conversion
Number of Interactions With
Channel 1 Channel 2 Channel 3 Channel 4
user1 1 1 0 2 1
user2 0 1 0 1 0
36
Chapter 4
4. Methods Used for Analysis
In order to be of practical use, the attribution modeling approach must yield results that
support decision making. Because the marketing activities are driven by the amount of
available funds at the disposal of the marketing manager, the budget is the primary source
of constraints in marketing planning process. Therefore, the framework for analysis should
be able to address financial matters directly.
In principle, marketers face an optimization problem in advertising planning: they
have at their disposal a fixed amount of budget which must be allocated in the best
possible way between advertising channels to achieve as many converted customers as
possible in short- and long-run. Therefore, the decision making should be based on a
holistic process and, if possible, should be rationalized on actual performance basis.
Essentially the underlying problem is to recognize and to understand the dynamics of
advertising channels. In practice this means understanding: the importance of each channel
in relation to each other (attribution model), to what degree an impression or a click
describes the conversion proneness of a customer and whether or not channels drive
customers to other channels prior conversions.
37
In the modeling stage, we focus mostly on the first two because it has been shown
beforehand that banner advertisements drive customers to search engines [19]. To analyze
the first two statements, we determine the performance of channels based on an attribution
model and budget spending.
In order to distinguish the importance of clicks and impressions, we should regard
clicks and impressions of the same channel as distinct channels. However, the impressions
and clicks are most likely highly correlated, because an impression is always required
before a click can occur. Therefore, we must evaluate the performance based on
impressions if both click and impression data are available.
Nottorf [38] proposes that the modeling technique should account for customer
heterogeneity as well as possible. However, because the objective of this Thesis is to
estimate the overall performance of channels, we seek to capture the average behavior of
all customers. In addition, it is unclear if it is beneficial to conduct segmentation based on
the given datasets. Thus, a segmentation technique will not be used in our analysis and we
leave the analysis of segmentation of customers based on such datasets for further
research.
Finally, in order to validate the modeling approach, we estimate the following key
distributions of the customer path dataset. First, the number of touch points, number of
different type of channels and the consideration period in calendar days are estimated.
These give insight whether the last-click model is sufficient for this line of business or not.
Second, in order to validate the recommendation based on the path distributions, we
estimate the traffic that is driven by different channels, most importantly by display
advertisements.
4.1. Logistic Regression for Attribution Modeling
and Performance Analysis
The outcome of an attribution modeling technique should be a summary of each channel’s
importance in relation to other channels. This requirement limits the number of potential
modeling techniques. A technique that satisfies all the requirements of the purpose of this
Thesis is logistic regression.
38
Logistic regression can be used to estimate the probability that an observation belongs
to a class based on its features. Therefore, the underlying problem is approached as a
classification task: we want to classify customers based on their actions to two distinct
classes; to those who convert and to those who do not convert in the short term (i.e. in the
time period of the analysis).
Because the coefficients of the model should describe how each individual channel
performs, we select the independent variables to be the number of interactions of a
customer with each channel. Furthermore, to account for the effects of advertisements after
customer has converted and the impact of customer conversion on future decisions, we
select one variable as the number of conversions prior the last conversion. Thus, we
classify customers based on their interactions with different channels. There are two other
reasons for this selection.
First, this selection of predicting variables implies that each estimated coefficient
describes the change in the customer’s conversion probability after they have interacted
with a particular channel. Second, previous research [40] [41] has shown that the number
of relevant exposure events increases the probability of conversion. Therefore, the
spillover effect of advertising channels must not be ignored in the performance analysis.
Therefore, the most important factor that distinguishes converting from not-converting
customers should be the number of interactions with online advertising channels.
Now, because we seek to compare the performance of channels after a customer
interacts once with each channel, we estimate the relative importance as follows. First, the
odds ratio is not linear and therefore the exponents of coefficients as such cannot be used
to compare channel performance. However, we can calculate the theoretical probability of
the case when a user has interacted with particular channels using Equation 1. With such
approach, we can overcome the problem of interpreting the model’s coefficients that was
found problematic with logistic regression [42]. Furthermore, by choosing only impression
data for available datasets, we are able to mitigate the problem of collinearity that was one
of the disadvantages of using logistic regression [42].
By comparing the conversion probability of different channels, we can determine
which channels are more prone to convert customers and which are not. To do this for each
channel, we calculate the conversion probability using Equation 1 by assigning 1 to (i.e.
39
there has been one interaction with channel i) and 0 to all other , in which k is the
index of the coefficient and j is the index of the observation.
By combining the channel-wise conversion probabilities with the amount of budget
spent and the number of customers that the one channel has brought to the target website,
we can estimate the actual performance of each channel. Because our data represents only
those customers who have entered the target website, the probability describes the
conversion probability of customers who have interacted with a channel and have visited
the target website i.e. have acknowledged the advertisement and visited the site.
Furthermore, because consecutive interactions within a time interval are aggregated, which
means in practice that the advertising channel has been recognized by the customer in our
case, we can estimate the performance of each channel as follows. We calculate the
expected number of conversions per channel based on the probability provided by the
model. Then, by calculating the expected cost per conversion per channel, we are able to
recognize each channel’s performance. This way, we obtain a performance metric that is
comparable across channels. Therefore, channels’ performances can be compared with this
metric. Then, by comparing the expected cost per conversion per channel we can give
recommendations for budget reallocation.
We implement logistic regression using R that is a programming language and
software environment for statistical analysis. The reason for using R is that it is widely
used, given it can be used for free of charge and it is a powerful tool in data analysis.
4.2. Modeling Steps
The modeling stage consists of three steps. First, the sample of the underlying dataset is
selected and divided into a training set and a test set. Second, the logistic regression
models are estimated with and without Bootstrap Aggregation for a number of different
samples, because Opitz and Maclin [53] found that bagging almost always outperforms a
single classifier, but not always. Last, the model that yields the best performance on test set
based on selected performance indicators is selected for estimating the conversion
probabilities of the customers.

40
4.2.1. Sample Selection and Model Validation
Our data sample consists of { } –data pairs, in which
is a vector of descriptive
values and is the outcome. Because the customer behavior datasets tend to be
significantly large a smaller sample of it must be obtained. This leads to three issues in
sample size selection. First, the estimation of model’s parameters can be computationally
demanding: the convergence time of estimation algorithms depends on the sample size.
Second, using too large dataset, the problem of overfitting emerges. Overfitting means that
the model starts to explain the randomness of the data.
Third, the number of distinct conversion and non-conversion paths can be large. This
is mostly due to the fact, that there exist many different channels and therefore many
channel combinations are possible. Moreover, the ratio of converted and not-converted
paths may be significantly skewed in favor of non-converted paths. Also, the estimated
model is highly dependent on the sample. Therefore, if we were to take a completely
random sample, there is a risk of building a model which is not valid.
To mitigate these issues, we divide the underlying dataset into two exclusive
subgroups: converted paths and non-converted paths. Because we can estimate the ratio of
converted and not converted customers from the original dataset, we use this proportion to
select samples randomly from the subgroups. However, it must be noted that if the
distribution of classes is very skewed, logistic regression can provide poor performance
[61]. Furthermore, we mitigate this issue by using different methods for model estimation.
For the selected sample, we use cross-validation for model selection. The sample is
divided into two exclusive sets: a training set and a test set. A separate validation set is not
required because we do not have to assess which parameters work best, but we have to use
all channels with enough data points. Then, the training set is used to train the models and
test set is used to evaluate the models’ performance on selected metrics.
The size of the sample should contain as diverse cases as possible and represent the
distribution of the underlying dataset as well as possible. Furthermore, because there can
be numerous different combinations of conversion paths and the size of the underlying
dataset is significantly large, we select the sample size as a proportion of the whole sample.
Then, because the estimated model is highly dependent on the selected sample, we mitigate
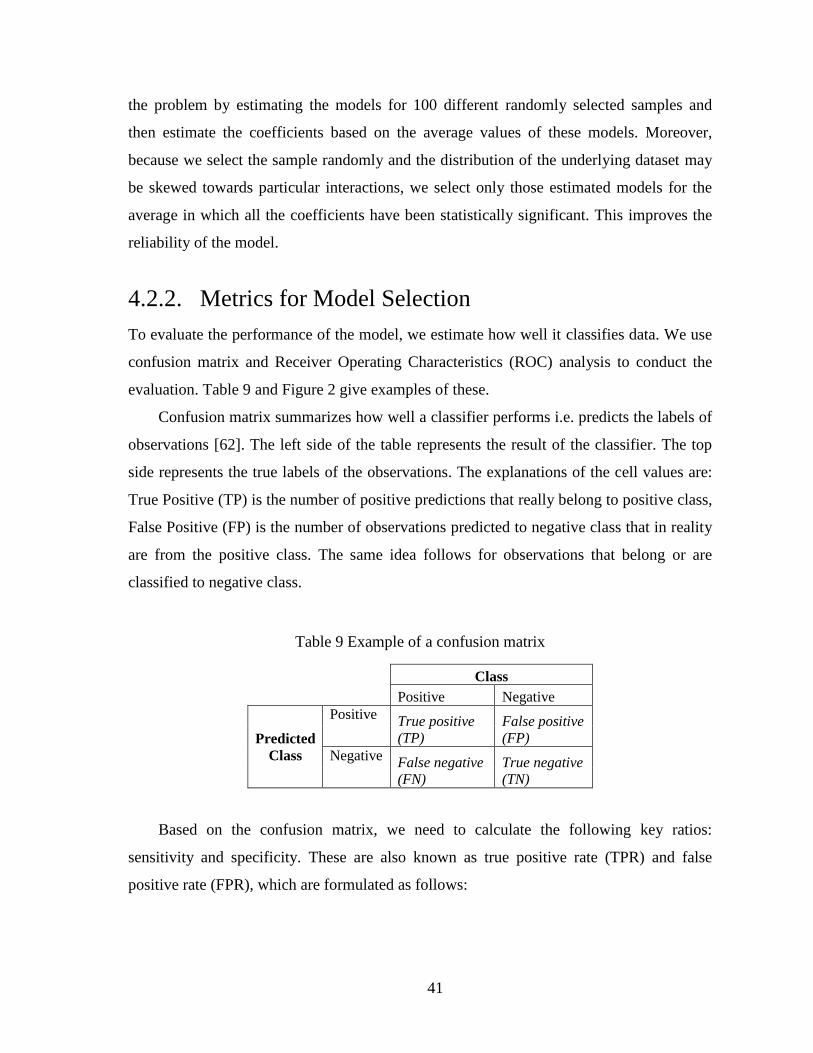
41
the problem by estimating the models for 100 different randomly selected samples and
then estimate the coefficients based on the average values of these models. Moreover,
because we select the sample randomly and the distribution of the underlying dataset may
be skewed towards particular interactions, we select only those estimated models for the
average in which all the coefficients have been statistically significant. This improves the
reliability of the model.
4.2.2. Metrics for Model Selection
To evaluate the performance of the model, we estimate how well it classifies data. We use
confusion matrix and Receiver Operating Characteristics (ROC) analysis to conduct the
evaluation. Table 9 and Figure 2 give examples of these.
Confusion matrix summarizes how well a classifier performs i.e. predicts the labels of
observations [62]. The left side of the table represents the result of the classifier. The top
side represents the true labels of the observations. The explanations of the cell values are:
True Positive (TP) is the number of positive predictions that really belong to positive class,
False Positive (FP) is the number of observations predicted to negative class that in reality
are from the positive class. The same idea follows for observations that belong or are
classified to negative class.
Table 9 Example of a confusion matrix
Class
Positive Negative
Predicted
Class
Positive True positive
(TP)
False positive
(FP)
Negative False negative
(FN)
True negative
(TN)
Based on the confusion matrix, we need to calculate the following key ratios:
sensitivity and specificity. These are also known as true positive rate (TPR) and false
positive rate (FPR), which are formulated as follows:
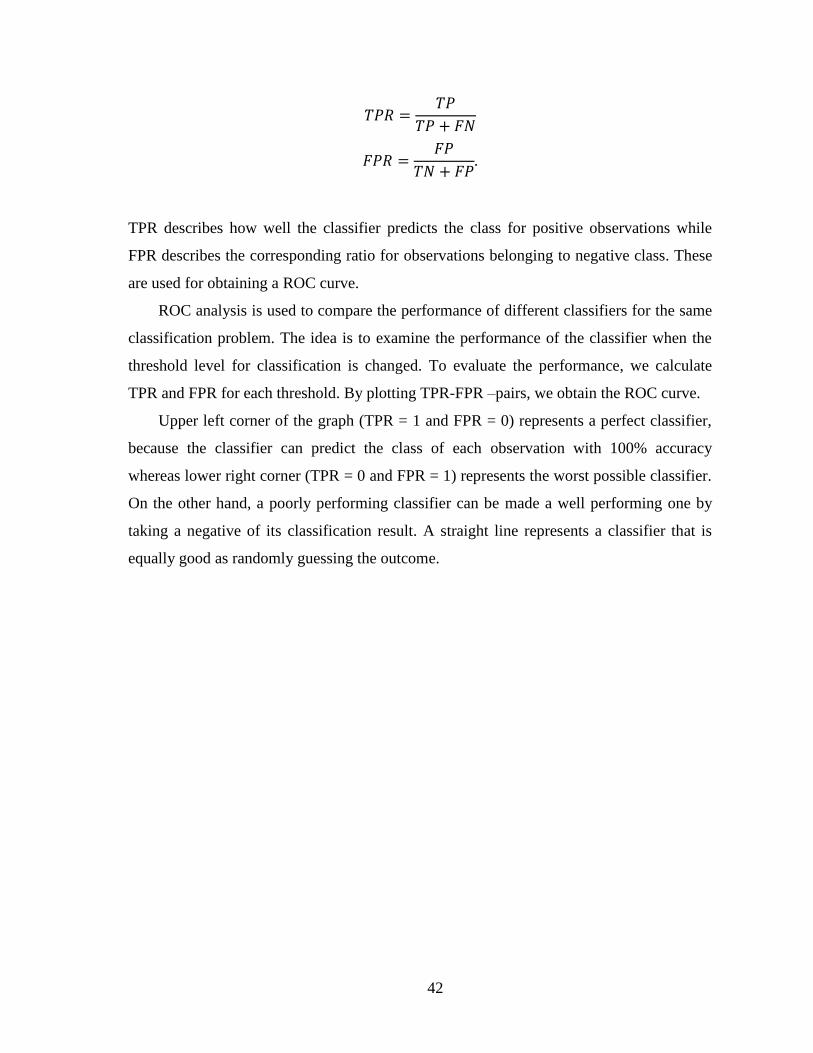
42
TPR describes how well the classifier predicts the class for positive observations while
FPR describes the corresponding ratio for observations belonging to negative class. These
are used for obtaining a ROC curve.
ROC analysis is used to compare the performance of different classifiers for the same
classification problem. The idea is to examine the performance of the classifier when the
threshold level for classification is changed. To evaluate the performance, we calculate
TPR and FPR for each threshold. By plotting TPR-FPR –pairs, we obtain the ROC curve.
Upper left corner of the graph (TPR = 1 and FPR = 0) represents a perfect classifier,
because the classifier can predict the class of each observation with 100% accuracy
whereas lower right corner (TPR = 0 and FPR = 1) represents the worst possible classifier.
On the other hand, a poorly performing classifier can be made a well performing one by
taking a negative of its classification result. A straight line represents a classifier that is
equally good as randomly guessing the outcome.
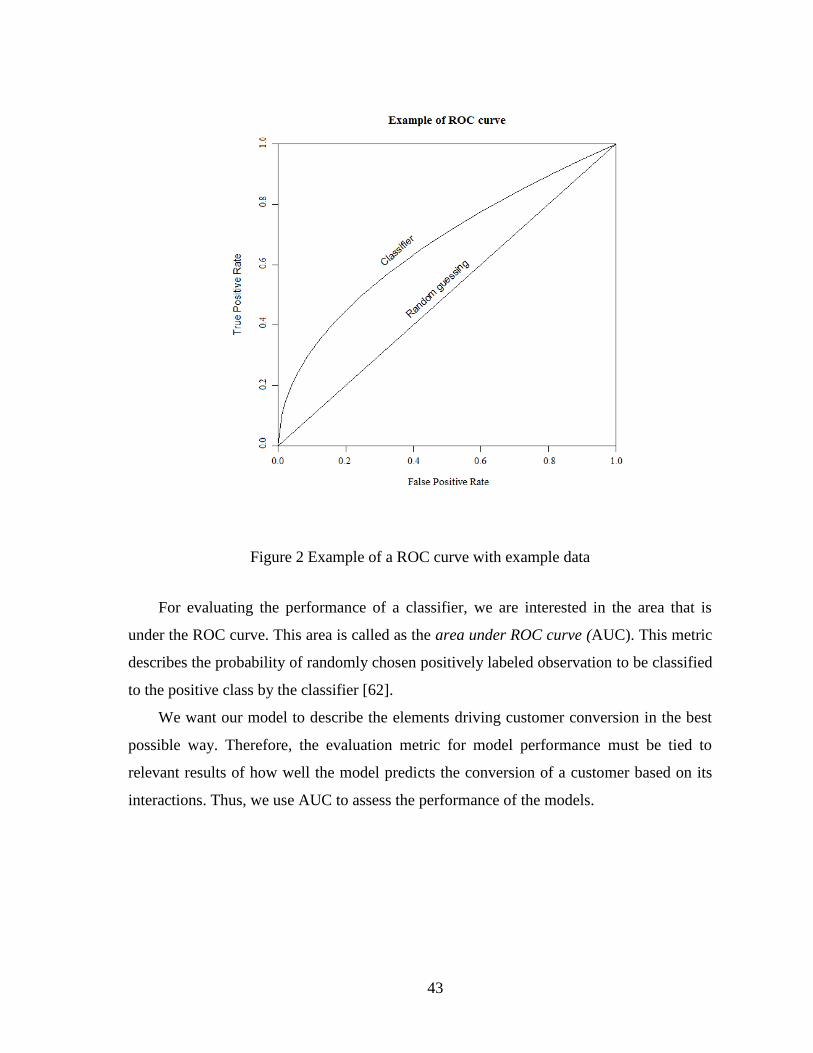
43
Figure 2 Example of a ROC curve with example data
For evaluating the performance of a classifier, we are interested in the area that is
under the ROC curve. This area is called as the area under ROC curve (AUC). This metric
describes the probability of randomly chosen positively labeled observation to be classified
to the positive class by the classifier [62].
We want our model to describe the elements driving customer conversion in the best
possible way. Therefore, the evaluation metric for model performance must be tied to
relevant results of how well the model predicts the conversion of a customer based on its
interactions. Thus, we use AUC to assess the performance of the models.

44
Chapter 5
5. Results
The analysis is conducted on customer cookie information data for a single country for one
month. Data of five different channels is used, which are direct traffic (direct), banner
advertisements (display), search engine marketing for branded keywords (SEM Branded),
search engine marketing for generic keywords (SEM Generic) and organic search engine
(SEO) results. Direct traffic refers to customers who type the address or use a bookmark to
enter the site. Display, SEM Generic and SEM Branded have a budget. For display we use
impression data and for the rest click data.
Similar consecutive interactions that occur within 30 minutes interval are considered
as individual touch points. All the paths are kept in the analysis because each path ends to
a conversion or to a site visit. With such setup, our dataset has 692075 unique paths of
which 20.29% ends to a conversion. Tables of path length distributions are in Appendix A.
45
5.1. Key Distributions of Path Dataset
Figure 3 represents the distribution of path lengths in number of touch points. The majority
of conversion paths require only one touch point (86.63 %). Also, practically all conversion
paths are at most three steps long (97.51%), while the same proportion for non-conversion
paths is achieved with paths that are nine steps or shorter (97.62%). These are partly
explained by the structure of the data: 73.13% of data points are clicks and a click is the
result of a conscious decision while customers may not acknowledge each impression.
Therefore, the true distribution of touch points should contain more paths that are longer
than one touch point.
Figure 3 Path length in touch points
Figure 4 shows the number of channels in conversion paths: only 6.58% of all
conversion paths require two or more different type of channel interactions. This result
explains why last-click model can perform well. In fact, because majority of paths have
only one touch point, the first-event model, too, would yield similar results. On the other
hand, even though most converting customers require only one channel for conversion,
0%
10%
20%
30%
40%
50%
60%
70%
80%
90%
100%
1 2 3 4 5 6 7 8 9 10 >
10
Pro
po
rtio
n
Touch-points
Path length in touch points
Total
Conversion paths
Non-conversion paths
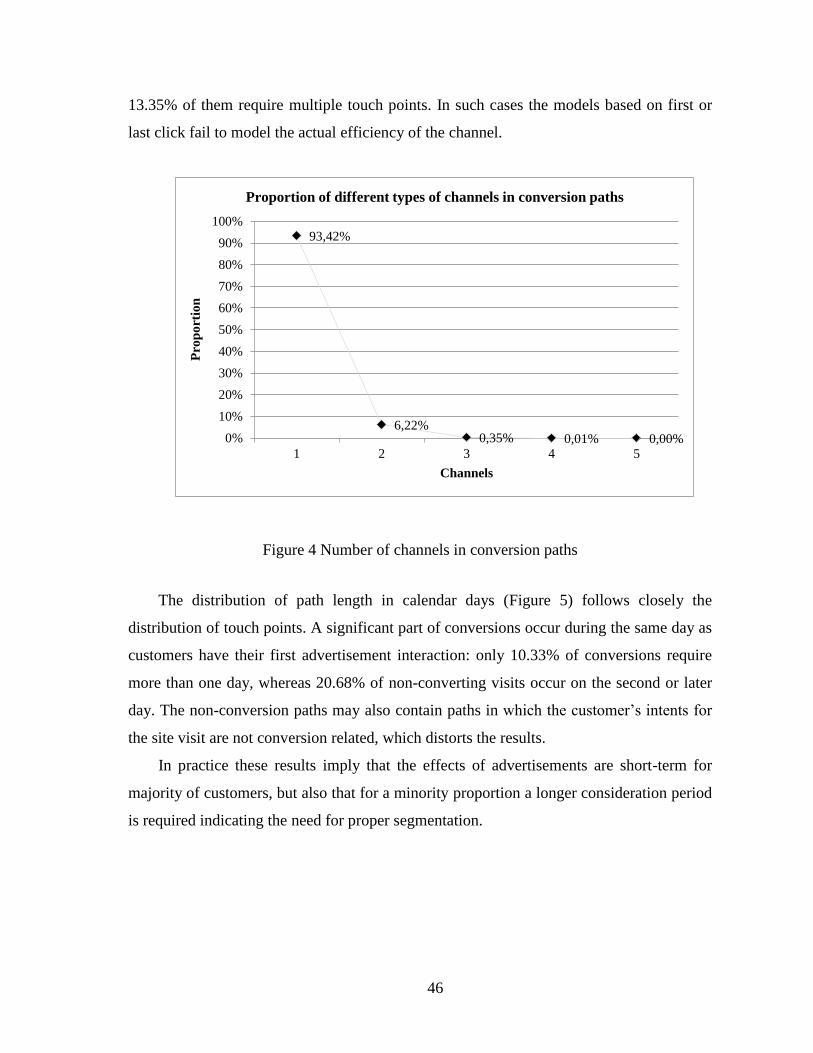
46
13.35% of them require multiple touch points. In such cases the models based on first or
last click fail to model the actual efficiency of the channel.
Figure 4 Number of channels in conversion paths
The distribution of path length in calendar days (Figure 5) follows closely the
distribution of touch points. A significant part of conversions occur during the same day as
customers have their first advertisement interaction: only 10.33% of conversions require
more than one day, whereas 20.68% of non-converting visits occur on the second or later
day. The non-conversion paths may also contain paths in hich the customer’s intents for
the site visit are not conversion related, which distorts the results.
In practice these results imply that the effects of advertisements are short-term for
majority of customers, but also that for a minority proportion a longer consideration period
is required indicating the need for proper segmentation.
93,42%
6,22% 0,35% 0,01% 0,00% 0%
10%
20%
30%
40%
50%
60%
70%
80%
90%
100%
1 2 3 4 5
Pro
po
rtio
n
Channels
Proportion of different types of channels in conversion paths
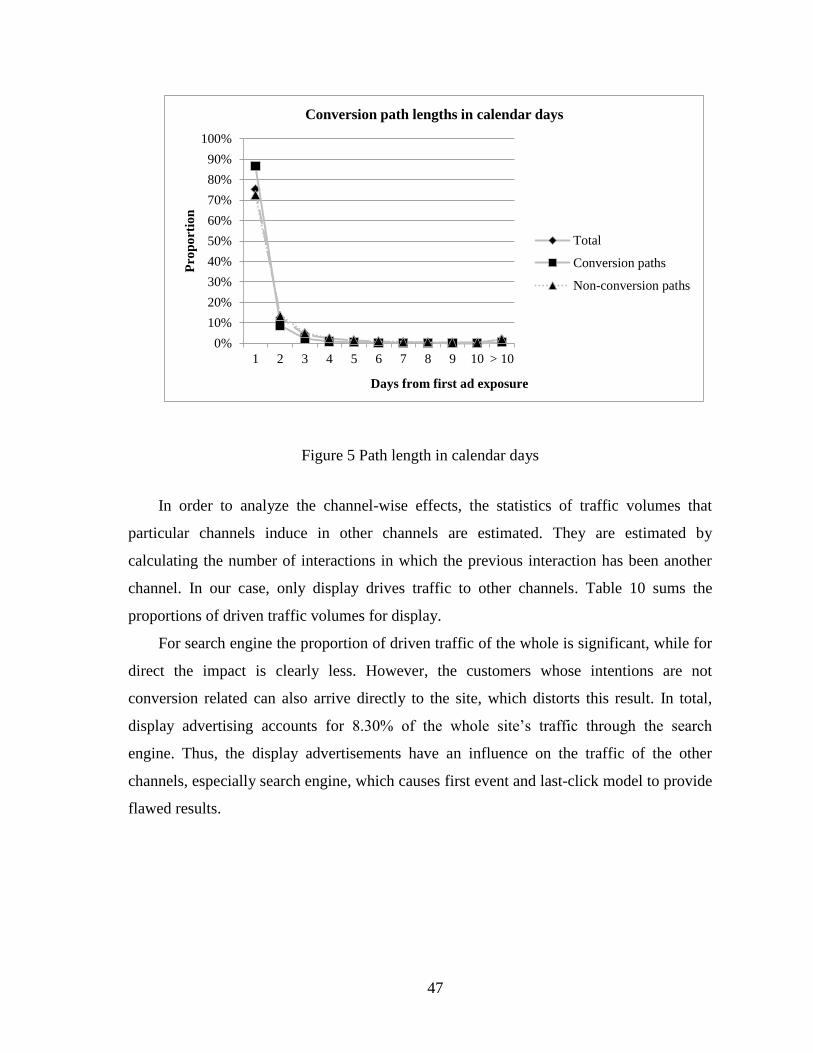
47
Figure 5 Path length in calendar days
In order to analyze the channel-wise effects, the statistics of traffic volumes that
particular channels induce in other channels are estimated. They are estimated by
calculating the number of interactions in which the previous interaction has been another
channel. In our case, only display drives traffic to other channels. Table 10 sums the
proportions of driven traffic volumes for display.
For search engine the proportion of driven traffic of the whole is significant, while for
direct the impact is clearly less. However, the customers whose intentions are not
conversion related can also arrive directly to the site, which distorts this result. In total,
display advertising accounts for 8 30% of the hole site’s traffic throu h the search
engine. Thus, the display advertisements have an influence on the traffic of the other
channels, especially search engine, which causes first event and last-click model to provide
flawed results.
0%
10%
20%
30%
40%
50%
60%
70%
80%
90%
100%
1 2 3 4 5 6 7 8 9 10 > 10
Pro
po
rtio
n
Days from first ad exposure
Conversion path lengths in calendar days
Total
Conversion paths
Non-conversion paths
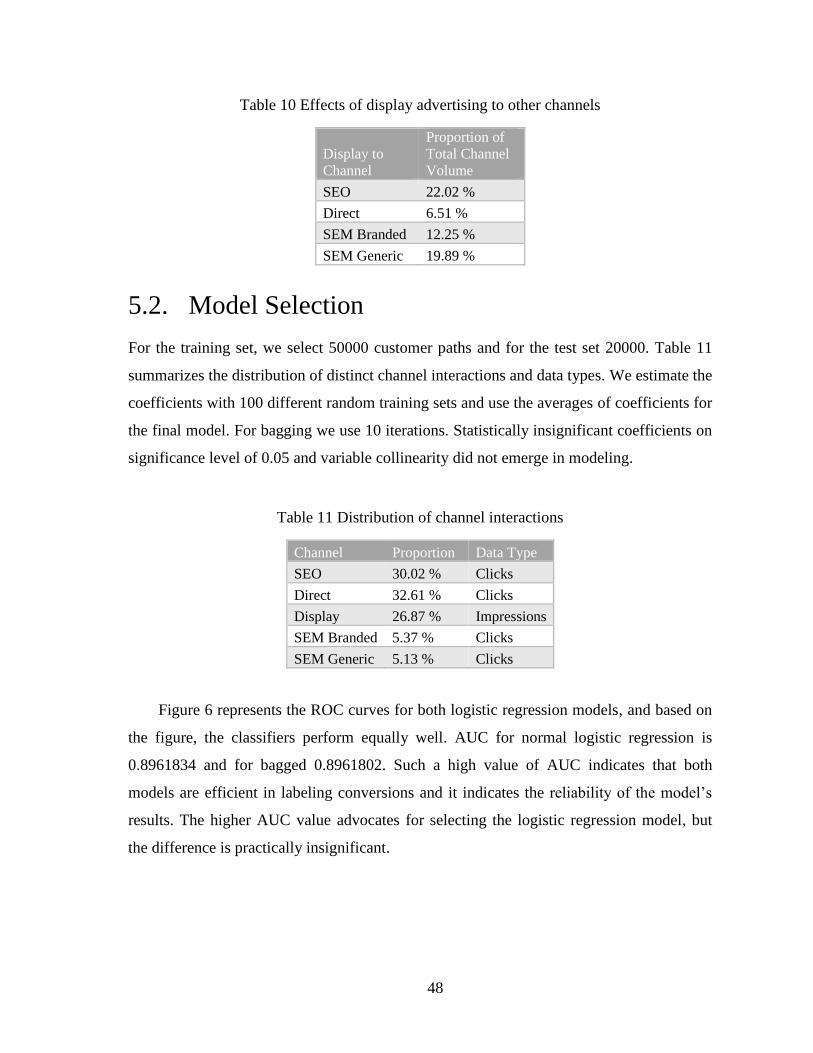
48
Table 10 Effects of display advertising to other channels
Display to
Channel
Proportion of
Total Channel
Volume
SEO 22.02 %
Direct 6.51 %
SEM Branded 12.25 %
SEM Generic 19.89 %
5.2. Model Selection
For the training set, we select 50000 customer paths and for the test set 20000. Table 11
summarizes the distribution of distinct channel interactions and data types. We estimate the
coefficients with 100 different random training sets and use the averages of coefficients for
the final model. For bagging we use 10 iterations. Statistically insignificant coefficients on
significance level of 0.05 and variable collinearity did not emerge in modeling.
Table 11 Distribution of channel interactions
Channel Proportion Data Type
SEO 30.02 % Clicks
Direct 32.61 % Clicks
Display 26.87 % Impressions
SEM Branded 5.37 % Clicks
SEM Generic 5.13 % Clicks
Figure 6 represents the ROC curves for both logistic regression models, and based on
the figure, the classifiers perform equally well. AUC for normal logistic regression is
0.8961834 and for bagged 0.8961802. Such a high value of AUC indicates that both
models are efficient in labeling conversions and it indicates the reliability of the model’s
results. The higher AUC value advocates for selecting the logistic regression model, but
the difference is practically insignificant.

49
Figure 6 ROC curve for logistic regression
The classification accuracies of the regression models increase steadily and steeply at
first indicating that the classifier labels a portion of customers with high accuracy. For the
rest, TPR increases with the expense of prediction accuracy i.e. FPR increases significantly
faster than TPR. Therefore, the classes of some customers are not as easy to predict and the
true positives are classified with the expense of misclassifying non-converting customers.
Table 12 shows the corresponding coefficients of each channel and standard
deviations of the coefficients. Both models provide similar results for the model’s
coefficients . In general, bagging should yield better classification performance and lower
variability. However, in our case standard logistic regression outperforms in terms of
standard deviation for every coefficient but SEM Generic’s. This may be the result of the
fact that we use averages of coefficients for both models, which mitigates the issues that
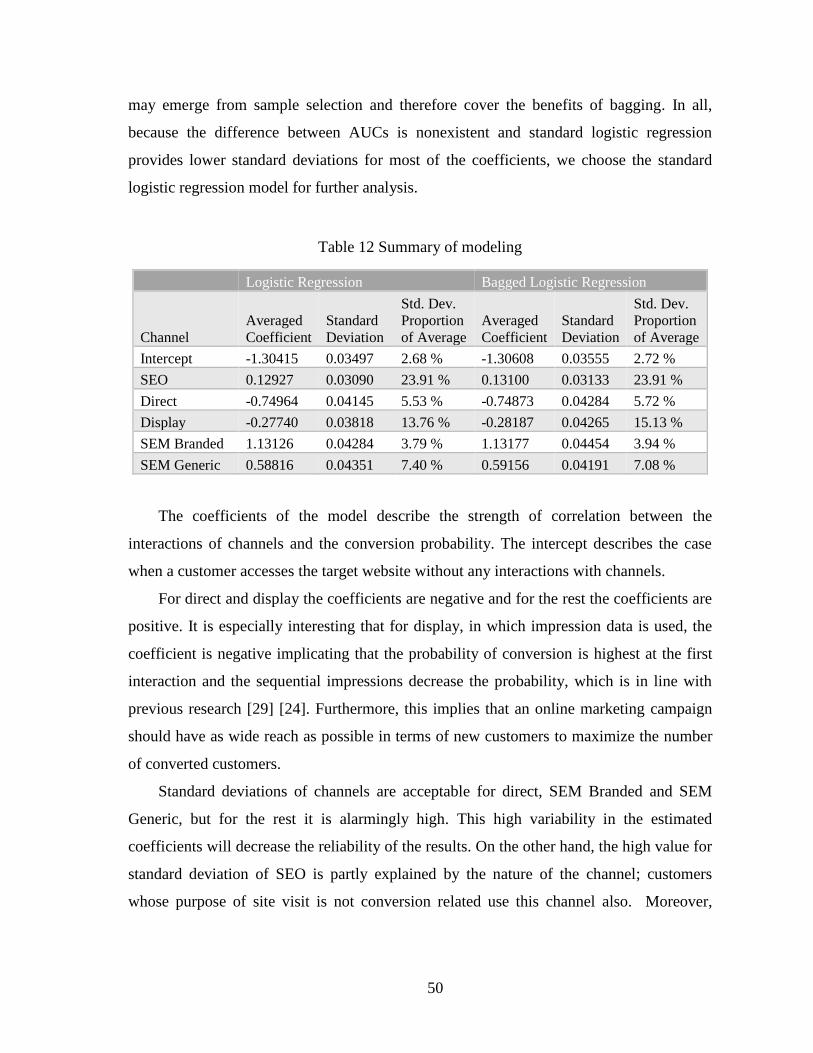
50
may emerge from sample selection and therefore cover the benefits of bagging. In all,
because the difference between AUCs is nonexistent and standard logistic regression
provides lower standard deviations for most of the coefficients, we choose the standard
logistic regression model for further analysis.
Table 12 Summary of modeling
Logistic Regression Bagged Logistic Regression
Channel
Averaged
Coefficient
Standard
Deviation
Std. Dev.
Proportion
of Average
Averaged
Coefficient
Standard
Deviation
Std. Dev.
Proportion
of Average
Intercept -1.30415 0.03497 2.68 % -1.30608 0.03555 2.72 %
SEO 0.12927 0.03090 23.91 % 0.13100 0.03133 23.91 %
Direct -0.74964 0.04145 5.53 % -0.74873 0.04284 5.72 %
Display -0.27740 0.03818 13.76 % -0.28187 0.04265 15.13 %
SEM Branded 1.13126 0.04284 3.79 % 1.13177 0.04454 3.94 %
SEM Generic 0.58816 0.04351 7.40 % 0.59156 0.04191 7.08 %
The coefficients of the model describe the strength of correlation between the
interactions of channels and the conversion probability. The intercept describes the case
when a customer accesses the target website without any interactions with channels.
For direct and display the coefficients are negative and for the rest the coefficients are
positive. It is especially interesting that for display, in which impression data is used, the
coefficient is negative implicating that the probability of conversion is highest at the first
interaction and the sequential impressions decrease the probability, which is in line with
previous research [29] [24]. Furthermore, this implies that an online marketing campaign
should have as wide reach as possible in terms of new customers to maximize the number
of converted customers.
Standard deviations of channels are acceptable for direct, SEM Branded and SEM
Generic, but for the rest it is alarmingly high. This high variability in the estimated
coefficients will decrease the reliability of the results. On the other hand, the high value for
standard deviation of SEO is partly explained by the nature of the channel; customers
whose purpose of site visit is not conversion related use this channel also. Moreover,
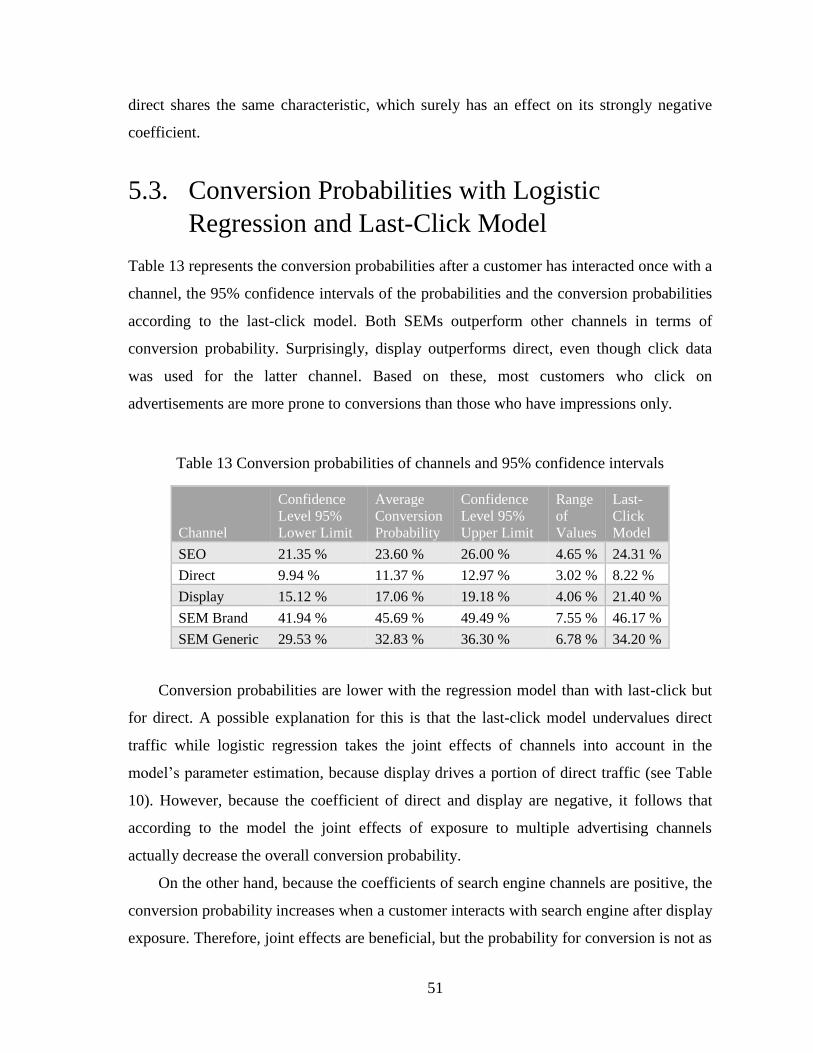
51
direct shares the same characteristic, which surely has an effect on its strongly negative
coefficient.
5.3. Conversion Probabilities with Logistic
Regression and Last-Click Model
Table 13 represents the conversion probabilities after a customer has interacted once with a
channel, the 95% confidence intervals of the probabilities and the conversion probabilities
according to the last-click model. Both SEMs outperform other channels in terms of
conversion probability. Surprisingly, display outperforms direct, even though click data
was used for the latter channel. Based on these, most customers who click on
advertisements are more prone to conversions than those who have impressions only.
Table 13 Conversion probabilities of channels and 95% confidence intervals
Channel
Confidence
Level 95%
Lower Limit
Average
Conversion
Probability
Confidence
Level 95%
Upper Limit
Range
of
Values
Last-
Click
Model
SEO 21.35 % 23.60 % 26.00 % 4.65 % 24.31 %
Direct 9.94 % 11.37 % 12.97 % 3.02 % 8.22 %
Display 15.12 % 17.06 % 19.18 % 4.06 % 21.40 %
SEM Brand 41.94 % 45.69 % 49.49 % 7.55 % 46.17 %
SEM Generic 29.53 % 32.83 % 36.30 % 6.78 % 34.20 %
Conversion probabilities are lower with the regression model than with last-click but
for direct. A possible explanation for this is that the last-click model undervalues direct
traffic while logistic regression takes the joint effects of channels into account in the
model’s parameter estimation, because display drives a portion of direct traffic (see Table
10). However, because the coefficient of direct and display are negative, it follows that
according to the model the joint effects of exposure to multiple advertising channels
actually decrease the overall conversion probability.
On the other hand, because the coefficients of search engine channels are positive, the
conversion probability increases when a customer interacts with search engine after display
exposure. Therefore, joint effects are beneficial, but the probability for conversion is not as
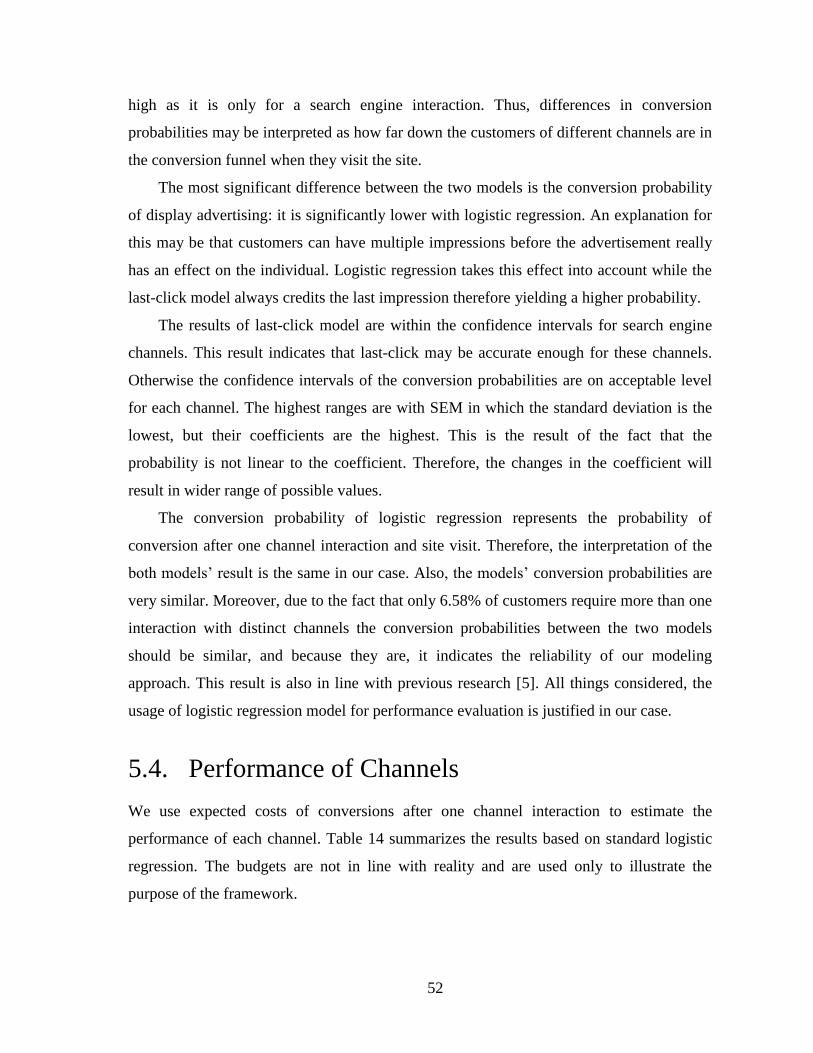
52
high as it is only for a search engine interaction. Thus, differences in conversion
probabilities may be interpreted as how far down the customers of different channels are in
the conversion funnel when they visit the site.
The most significant difference between the two models is the conversion probability
of display advertising: it is significantly lower with logistic regression. An explanation for
this may be that customers can have multiple impressions before the advertisement really
has an effect on the individual. Logistic regression takes this effect into account while the
last-click model always credits the last impression therefore yielding a higher probability.
The results of last-click model are within the confidence intervals for search engine
channels. This result indicates that last-click may be accurate enough for these channels.
Otherwise the confidence intervals of the conversion probabilities are on acceptable level
for each channel. The highest ranges are with SEM in which the standard deviation is the
lowest, but their coefficients are the highest. This is the result of the fact that the
probability is not linear to the coefficient. Therefore, the changes in the coefficient will
result in wider range of possible values.
The conversion probability of logistic regression represents the probability of
conversion after one channel interaction and site visit. Therefore, the interpretation of the
both models’ result is the same in our case. Also the models’ conversion probabilities are
very similar. Moreover, due to the fact that only 6.58% of customers require more than one
interaction with distinct channels the conversion probabilities between the two models
should be similar, and because they are, it indicates the reliability of our modeling
approach. This result is also in line with previous research [5]. All things considered, the
usage of logistic regression model for performance evaluation is justified in our case.
5.4. Performance of Channels
We use expected costs of conversions after one channel interaction to estimate the
performance of each channel. Table 14 summarizes the results based on standard logistic
regression. The budgets are not in line with reality and are used only to illustrate the
purpose of the framework.
53
Site visits per channel are calculated as the sum of customers who have interacted
with the particular channel and visited the site i.e. it is assumed that each channel
interaction is relevant for the customer in order to enter the site.
Table 14 Summary of channels’ performance
Channel
Budget
(€)
Site
Visits
(All)
Conversion
Probability
Expected
Number of
Conversions
Cost per
Conversion
Direct - 300828 23.60 % 70987 -
SEO - 261660 11.37 % 29743 -
Display 15 000 € 99191 17.06 % 16920 0 89 €
SEM Brand 4 000 € 66642 45.69 % 30448 0 13 €
SEM Generic 9 000 € 63652 32.83 % 20895 0 43 €
SEM Branded performs best because it has the lowest cost per conversion while
display performs rather poorly in comparison. Direct and SEO are present in customers’
paths in 71.02% of cases and therefore they bring great proportion of traffic to the site with
no budget at all. Also, most customers require only one type of channel interaction for a
site visit. Thus, each channel brings a unique segment of customers to the site. Therefore, it
is justified to continue spending in display and SEM also.
On the other hand, display has an impact on the volumes of other channels.
Furthermore, for customers who have seen only display advertisements the probability of
conversion is increased if a customer traverses to search engine, but is decreased when
accessing the site directly after the exposure. Therefore, search engine facilitates
conversions of customers who have only a display exposure while for direct the impact is
negative.
Because the conversion probabilities for search engine are significantly higher than
for the rest, the customers should be driven to search engine in overall. From this point of
view, increased spending in display advertisement may be considered, because display
drives traffic to these channels. However, for display advertisements the cost per
conversion is significantly higher than for the other channels. Therefore, it would make
sense to reallocate the budget of this channel to better performing channels i.e. to SEM in
our case.

54
In conclusion, in order to validate the reallocation recommendation, one must consider
two important elements. First, the potential capacity of the channel must be evaluated: does
the increased budget bring more customers to the site who are equally probable to convert?
Second, how much is the driven traffic by display affected by reallocation? If such
information is not present, then the decision must be validated through testing. Successful
reallocation should result in lower costs per conversions in overall and in increase in the
volume of conversions.
55
Chapter 6
6. Discussion
Analyzing the performance of online advertising proved not to be straightforward even
though the data collection possibilities have provided the basis for such analysis.
Attribution modeling techniques enable such analysis, but they are not enough for a
performance analysis due their limited capability to account for cost performance.
Furthermore, attribution models are always estimated based on the given datasets, which
implies that such results cannot be used as a general guideline for all countries and lines of
businesses. Thus, utilization of probabilistic methods market-wise combined with expected
costs can yield relevant information for advertising planners.
The results of attribution modeling must be implemented in decision making with
caution mostly because of the limitations in the data. There are limited data collection
capabilities across websites so that the datasets are unbalanced. Because the event when a
customer sees an advertisement is always the first thing that either induces a click or the
customer to go to another channel, it is very important to have such data from all channels.
In our case we have impression data only of one out of five channels. Such approach may
overvalue channels which have only click data: users that engage in clicks are known to be
more prone to conversions. Therefore, the structure of our data favors the last-click model.
56
Online customer datasets tend to be very large. Therefore, data processing algorithms
must perform well to reduce computation costs. On the other hand, attribution modeling
results are not required on a daily but on a monthly basis. Thus, the performance may not
become an issue, but how the data is preprocessed is important for online customer
datasets. The raw data cannot be used as is to analyze the impact of online advertisement
because a customer can have multiple impressions during same sessions even though they
acknowledge the advertisement only once or not at all.
The dataset for the analysis was created so that the causality of the effects of
advertisements is stored adequately. Therefore, we analyzed the paths that lead to the first
conversion or to the last site visit if conversion did not occur beforehand. Due to this, the
impact of advertising for second or more conversion was not captured. However, the
effects of advertisements are probably the most important for the first conversion, because
after a conversion a customer is aware of the offering and the advertisements have mostly
served their purpose. Therefore, the conversion probabilities are underappreciated in our
setup hich explains partly the difference bet een the model’s and last-click’s conversion
probabilities.
The statistics of the customer path length indicate a very short-term decision making
among customers and explain why last-click model can perform well. Therefore, first,
because the results of logistic regression are in line with the last-click probabilities, our
modeling approach appears to be valid in this sense. Second, the significance of excluding
paths that started before the analyzing period decreases as the analyzing period gets longer.
On the contrary, 5.98% of customers convert after four days of the initial
advertisement exposure. This indicates that there is a customer segment that spends longer
time considering the purchase. But, it is also possible that such customers may have not
acknowledged the advertisements beforehand, but just the ones before the conversions.
Thus, this proportion is the upper limit of size of such customer segment in our case.
Even though the data favors the usage of last-click or first-event model, display
advertisements drive traffic to other channels. The impact of driven traffic for the receiving
channels is significant in terms of volume, which clearly advocates the use of statistical
attribution modeling technique and not, for instance, heuristics. All things considered, the
utilization of binary logistic regression model is reasonable.
57
The way expected costs for conversions are calculated underestimates the true cost per
conversions, because this approach simplifies reality: customers can have different
histories before entering the site which affects their conversion probability. However, for
our datasets, such simplification is justified because of the path length distributions.
Moreover, budget reallocation works best when the reach of the poor and well performing
channels overlap, because the same customers can be converted more efficiently with other
means. In all, our approach is not completely accurate, but yields good enough results for
online advertising decisions.
Eventually, logistic regression proved to function well with customer dataset on
individual level when several significant issues are properly overcome. Because the
attribution models in general do not account for the actual performance of channels, the
expected cost approach provides a down-to-earth approach for channel-wise performance
evaluation and budget optimization.
6.1. Framework for Budget Optimization
As the result of the analysis process, we conclude the guidelines for the framework for
analyzing online advertising performance. The prerequisite for the analysis is to have the
datasets that include customer information collected with cookies. Also, impression data
should be preferred over click data. The budget optimization process goes as follows:
1. Create the customer path dataset.
2. Understand key statistics of the path data.
3. Estimate a binary logistic regression model for the data. Use the model to
calculate the conversion probabilities for different channels for one channel
interaction.
a. If the proportion of paths that require multiple channels before conversions
is significant, consider estimating the probabilities for most common paths
instead of only one interaction.
4. Estimate the performance of a channel based on the expected cost per conversion.
Reallocate the budget based on the expected costs.
5. Validate the results through testing or with further analysis of channel dynamics.
58
6.2. Review of Hypotheses
Hypothesis 1
Clicks on advertisements increase the probability of conversion more than impressions of
advertisements. Intuitively, this statement seems to be valid: those users that click on
advertisements are more engaged and therefore more prone to convert. However, because
our datasets contain only limited amount of impression data, this hypothesis cannot be
analyzed thoroughly. On the other hand, for most of the channels of which we have only
click data the conversion probabilities are higher than the channels of which we have
impression data. Also, for all channels, except for the direct one, which use click data, the
probability of conversion increases as the number of clicks increase due to positive
regression coefficients. Therefore, it seems that clicks describe the conversion proneness of
a customer in general better.
Hypothesis 2
Search engine marketing is significant in the customer conversion process. The conversion
probabilities for search engine channels are higher than for the rest of the channels. In
addition, multiple interactions with such channels increase the probability of conversion.
Moreover, the search engines cover 40.52% of the total traffic to the site. Last, display
advertisements drive a proportion of customers to search engine, which accounts for a total
of 8.30% of the sites total traffic. In all, search engine marketing is significant in customer
conversion process in our case.
Hypothesis 3
Banner advertisements are important in awareness creation and therefore drive customers
to other channels before conversions. Most conversion paths (93.42%) require only one
kind of channel interaction before conversion. Therefore, regardless of the channel, it
seems that channels in general do not drive customers to other channels prior conversions.
However, display channel has an impact on the traffic volumes of other channels. On the
other hand, majority of the customers who interact with display do not require additional
59
touch points before conversions. Therefore, for display advertising there is a spillover
effect, but it is not a dominating characteristic of the channel.
Hypothesis 4
The path to second or more conversions differs significantly from first conversion path.
This hypothesis cannot be validated with our approach. The decision to include only first
conversion paths to the analysis is central in the modeling. To analyze the hypothesis, the
path distributions of first conversion paths and second or more conversion paths should be
compared.
Hypothesis 5
Seeing the same advertisement several times can increase the contribution of that
advertisement to the conversion. The regression coefficients for direct and display are
negative implying that multiple interactions with such a channel decrease the probability of
conversion, while for the rest the coefficients are positive which suggests that the
probability increases with multiple interactions. On the other hand, we have impression
data only of display channel, so in principle, we can validate the argument only for this
channel: in our case, multiple impressions of display advertisements decrease the
probability of conversion and therefore the hypothesis is not valid.
6.3. Limitations of the Study
The most significant limitations emerge from the lack of impression data from all
channels, because impressions can either induce a click or drive the customer to another
channel before converting. Therefore, our modeling approach does not capture the effects
of all online advertising equally. Moreover, this limits our capability to determine whether
channels drive customers to other channels or not.
Also, the attribution model to be imperfect due to limitations in data collection.
Therefore, the performance results provided with the framework are not as accurate as they
could be. On the other hand, our data covers all the main online marketing channels, which
60
makes the performance analysis reliable enough for giving basis to holistic decision
making.
The last data related limitation is the incapability to distinguish between non-relevant
paths in the dataset. First, the paths that have begun before the period of analysis are not
excluded. Second, non-converting paths contains a portion of customers whose site visit is
not conversion related. Such issues distort the results, because these paths are not relevant
in the sense of advertising efficiency.
The modeling approach has two main limitations. First, because we use a probabilistic
method for attribution, we are not able to calculate the number of conversions that should
be directly attributed to different channels in situations in which there are multiple
interactions in the customer’s path; this is possible with heuristics. On the other hand, it
may not be significant in performance analysis to know exactly which channel interaction
induced the decision. Second, our approach assumes that all landing pages of
advertisements are equally effective even though this is not in line with reality. Therefore,
the quality of the landing page is attributed to the advertisements, which distorts the
results.
For managers the frame ork’s reatest limitation is its incapability to suggest the
exact amount for budget reallocation for poorly performing channels. Therefore, the actual
benefits of reallocation can only be validated through testing. Due to this, the flexibility of
marketing communication portfolio must be maintained in budget reallocation and not to
invest all the money to the channel with the lowest cost per conversions.
6.4. Topics for Further Research
Further research should focus on online advertising budgeting and on improving the results
of our approach. In order to improve the budget reallocation recommendations, the impact
of budget reallocation should be understood better. This can be analyzed through three
entities: by analyzing the marginal changes in volumes in case of budget reallocation,
correlation between channel volumes and the reaches of the channels.
To improve the results, segmentation of customers should be investigated in detail.
First, some customers are influenced more by banner advertisements than others [38].
61
Second, the effects of advertisements can decrease over multiple interactions [24] [29], as
we also saw in our analysis. Therefore, by estimating different models for different
customer segments, the results of the modeling could be improved. The study of
segmentation should focus on whether a particular kind of behavior indicates
advertisement proneness or not. Also, it would be beneficial to understand if detailed
information of the advertisement (i.e. position, size and sites in which they are displayed)
have an impact on its performance.
There are four changes that could improve the modeling setup. First, for managerial
purposes, it is beneficial to know the impact of one impression to any user, not just the
users that visit the target web site. Therefore, a future line of development for the modeling
scheme is to use data that covers all users who have seen advertisements and allow
tracking.
Second, the modeling approach ignores the effects of the landing page on the target
website. Therefore, by including the page to our modeling setup, the impact of the page
could be recognized and the effects of advertising isolated in a better fashion. Furthermore,
with such approach, the poorly performing landing pages could be distinguished and their
content optimized to fit the purpose.
Third, we select the sample in random and ensure that the sample distribution is equal
with the posterior distribution of converted and non-converted paths. However, because we
have multiple channels, implying numerous different combinations of channels, in
customers’ paths, the major paths may dominate the sample and other relevant paths may
be unintentionally excluded. Therefore, the use of modified stratified sampling should be
investigated to ensure the versatility of path distribution in each sample.
Last, the impact of online advertisements to all customer paths should be covered.
Therefore, an analysis should be conducted to verify whether the path to second or more
conversion differs from the first conversion path and if the effects of advertising are still
significant for additional conversions.
After all, online advertising is only a portion of the whole marketing portfolio.
Therefore, by combining the results of attribution and ROMI –modeling the overall
marketing efforts may be optimized further. Also, a cross-validation between the results
would be beneficial to recognize how robust the results of both approaches are.
62
Chapter 7
7. Conclusions
The importance of online advertising and measuring its impacts is growing rapidly.
Advancements in technology have enabled marketers to analyze and model the effects of
online advertising on individual level. Most often marketers use attribution modeling
methods for such analysis. However, they still lack sophisticated methods to thoroughly
tackle the problem even though the prerequisites for purely data driven solution are
available. A simple technique known as the last-click model prevails at present.
The goal of this Thesis was to propose a framework for analyzing online advertising
performance using an attribution modeling technique and to analyze the effects of online
advertising channels. To guide the analysis, five hypotheses of the dynamics of online
advertising were set.
The study began with an overview of online advertising and with a literature review of
online advertising modeling techniques. We chose binary logistic regression for classifying
customers to two distinct classes: to converters and to non-converters. As independent
variables we used the number of interactions with each channel prior a conversion event.
Our dataset consisted of paths in which only the part to the first conversion or last site visit
63
if conversions have not occurred is stored to model the causality of efficiency of
advertisements as accurately as possible.
The logistic regression model was estimated with and without bagging and the
coefficients were averaged over 100 iterations. The expected benefits of bagging were not
observed and standard logistic regression provided better results in terms of coefficient
variability, while the difference in classification performance was insignificant. For
probabilistic attribution modeling, the binary logistic regression provided satisfactory
results.
It was found that most of the first conversions occur during the same day as the first
advertisement interaction. In addition, for the majority of the customers only one kind of
channel interactions and only one touch point is required before conversion. Thus, the
results of logistic regression and last-click model proved to be very similar. On the other
hand, it was found that display advertisements drive a significant amount of traffic to other
channels, which supports the use of proper attribution model. Naturally, this is not always
the case, because the datasets are highly dependent on the line of the business. Therefore,
in case of longer customer consideration periods, the importance of statistical attribution
modeling becomes more significant. Nevertheless, it is better to use a simple model than
no model at all for performance evaluation.
The greatest disadvantage of online advertising modeling techniques is their limited
capability to provide results based on actual performance for decision makers. Thus, we
present a metric for channel performance evaluation that is based on the expected costs of
conversions per channels. By comparing the expected costs of channels, recommendations
for budget reallocation can be given The frame ork’s reatest limitation is the inability to
provide the optimal amount of funds to be reallocated. In order to provide such results, a
further study should be conducted.
In conclusion, the main goal of the Thesis was achieved, but further research is
required to understand and evaluate the effects of online advertising better. Overall, this
study provides solid results for marketing managers to optimize the overall performance of
online advertising activities.
64
References
[1] “Key ICT Indicators for Developed and Developing Countries and the World (Totals
and Penetration Rates) ” International Telecommunications Union 2013 [Online].
Available: http://www.itu.int/en/ITU-
D/Statistics/Documents/statistics/2012/ITU_Key_2006-2013_ICT_data.xls.
[Accessed 12 May 2014].
[2] “IAB Internet Advertising Revenue Report ” PricewaterhouseCoopers, April 2013.
[Online]. Available:
http://www.iab.net/media/file/IABInternetAdvertisingRevenueReportFY2012POST
ED.pdf. [Accessed 5 February 2014].
[3] “U S Di ital Marketin Spendin Report 2013 ” Gartner 2013 [Online]. Available:
http://www.gartner.com/technology/research/digital-marketing/digital-marketing-
spend.jsp. [Accessed 5 February 2014].
[4] X. Shao and L. Li, “Data-Driven Multi-Touch Attribution Models ” Proceedin s of
the 17th ACM SIGKDD International Conference on Knowledge Discovery and
Data mining, 2011.
[5] E. Anderl, I. Becker, F. V. Wangenheim and J. H. Schumann, “Putting Attribution to
Work: A Graph-Based Framework for Attribution Modeling in Managerial
Practice ” 23 October 2013 [Online]. Available:
http://papers.ssrn.com/sol3/papers.cfm?abstract_id=2343077.
[6] P. W. Farris, N. T. Bendle, P. E. Pfeifer and D. J. Reibstein, Marketing Metrics. The
Definitive Guide to Measure Marketing Performance, Upper Saddle River, New
Jersey: Pearson Education, Inc., 2010.
[7] K. L. Keller, “Memory Factors in Advertising: The Effect of Advertising Retrieval
Cues on Brand Evaluations ” Journal of Consumer Research vol. 14, nr. 3, pp. 316-
333, 1987.
[8] Y. J. Hyun, J. W. Gentry and S. Jun, “An Investigation of Newspaper Advertisement
Memory as Affect Context Involvement and Advertisement Size-A Korean Case ”
Journal of Current Issues & Research in Advertising, vol. 28, nr. 1, pp. 45-56, 2006.
65
[9] X. Dréze and F.-X. Hussherr, “Internet Advertisin : Is Anybody Watchin ? ”
Journal of Interactive Marketing, vol. 17, nr. 4, pp. 8-23, 2003.
[10] W. Thorsten, K. Pauwels and J. Arts, “Practice Prize Paper—Marketing's Profit
Impact: Quantifying Online and Off-line Funnel Progression,” Marketin Science
vol. 30, nr. 4, pp. 604-611, 2011.
[11] P. J. Kitchen, Integrated Brand Marketing and Measuring Returns, Hampshire:
Palgrave Macmillan, 2010.
[12] “Marketin ” Wikipedia 7 February 2014 [Online] Available:
http://en.wikipedia.org/wiki/Marketing. [Accessed 9 February 2014].
[13] T. Ambler, “Persuasion, Pride and Prejudice: How Advertisements Work ”
International Journal of Advertising, vol. 19, pp. 299-315, 2000.
[14] A. Dickinger, P. Haghirian, J. Murphy and A. Scharl, “An Investigation and
Conceptual Model of SMS Marketin ” Proceedin s of the 37th Ha aii
International Conference on System Sciences, 2004.
[15] T. Jelassi and A. Enders, Strategies for e-Business: Creating Value Through
Electronic and Mobile Commerce, Upper Saddle River, NJ: Prentice Hall, 2005.
[16] A. Goldfarb and C. Tucker, “Online Display Advertising: Targeting and
Obtrusiveness ” Marketin Science vol. 30, nr. 3, pp. 389-404, 2011.
[17] M. C. Campbell, “When Attention-getting Advertising Tactics Elicit Consumer
Inferences of Manipulative Intent: The Importance of Balancing Benefits and
Investments ” Journal of Consumer Psycholo y vol. 4, nr. 3, pp. 225-254, 1995.
[18] G. Iyer, D. Soberman and J. M. Villas-Boas, “The Tar etin of Advertisin ”
Marketing Science, vol. 24, nr. 3, pp. 461-476, 2005.
[19] P. Kireyev, K. Pauwels and S. Gupta, “Do Display Advertisements Influence
Search? Attribution and Dynamics in Online Advertising, workin paper ” Harvard
Business School, 2013, February.
[20] B. J. Jansen and S. Schuster, “Bidding on the Buying Funnel for Sponsored Search
and Key ord Advertisin ” Journal of Electronic Commerce Research vol. 12, nr.
1, 2011.
66
[21] “Conversion Marketin ” Wikipedia 17 January 2014 [Online] Available:
http://en.wikipedia.org/wiki/Conversion_marketing. [Accessed 9 February 2014].
[22] K. C. Wilbur and Y. Zhu, “Click Fraud ” Marketin Science vol. 28, nr. 2, pp. 293-
308, 2009.
[23] M. Fischer, S. Albers and M. Frie, “Dynamic Marketing Budget Allocation Across
Countries Products and Marketin Activities ” Marketin Science vol. 30, nr. 4,
pp. 568-585, 2011.
[24] P. Chatterjee, D. L. Hoffman and T. P. Novak, “Modeling the Clickstream:
Implications for Web-Based Advertisin Efforts ” Marketin Science vol. 22, nr. 4,
pp. 520-541, 2003.
[25] C. Cho, “Factors Influencing Clicking of Banner Advertisements on the www ”
CyberPsychology & Behavior, vol. 6, nr. 2, pp. 201-215, 2003.
[26] S. M. Edwards, H. Li and J.-H. Lee, “Forced Exposure and Psychological
Reactance: Antecedents and Consequences of the Perceived Intrusiveness of Pop-up
Advertisements ” Journal of Advertisin vol. 31, nr. 3, pp. 83-95, 2002.
[27] P. Manchanda, J.-P. Dubé, K. Y. Goh and P. K. Chintagunta, “The Effect of Banner
Advertisin on Internet Purchasin ” Journal of Marketin Research vol. XLIII, pp.
98-108, 2006.
[28] H.-S. Yoon and D.-H. Lee, “The Exposure Effect of Unclicked Banner
Advertisement ” Advances in International Marketin vol. 7, nr. 18, pp. 211-229,
2007.
[29] DoubleClick, 1996. [Online]. Available:
http://web.archive.org/web/19980205034142/http://www.doubleclick.net/nf/general/
frequset.htm. [Accessed 14 February 2014].
[30] S. Yang and A. Ghose, “Analyzing the Relationship Between Organic and
Sponsored Search Advertising: Positive, Negative, or Zero Interdependence? ”
Marketing Science, vol. 29, nr. 4, pp. 602-623, 2010.
[31] N. Brooks, “The Atlas Rank Report I: Ho Search En ine Rank Impacts Traffic ”
August 2004. [Online]. Available:
67
http://atlassolutions.com/wwdocs/user/atlassolutions/en-us/insights/RankReport.pdf.
[Accessed 10 February 2014].
[32] N. Brooks, “The Atlas Rank Report II: How Search Engine Rank Impacts
Conversions ” January 2005 [Online]. Available:
http://surf2your.pages.com.au/resources/RankReportPart2.pdf. [Accessed 10
February 2014].
[33] O. J. Rutz and R. E. Bucklin, “From Generic to Branded: A Model of Spillover in
Paid Search Advertisin ” Journal of Marketin Research vol. XLVIII, pp. 87-102,
2011.
[34] B. Hartzer, “Balancin Paid and Or anic Search Listin s ” Search En ine Guide 25
October 2005. [Online]. Available: http://www.searchengineguide.com/bill-
hartzer/balancing-paid.php. [Accessed 14 February 2014].
[35] B. Bickart and R. M. Schindler, “Internet Forums as Influential Source of Consumer
Information ” Journal of Interactive Marketin vol. 15, nr. 3, pp. 31-40, 2001.
[36] S. Gensler, F. Völckner, Y. Liu-Thompkins and C. Wiertz, “Managing Brands in the
Social Media Environment ” Journal of Interactive Marketing, vol. 27, pp. 242-256,
2013.
[37] IAB Attribution Working Group, “Attribution Primer ” 21 June 2012 [Online].
Available: http://www.iab.net/media/file/AttributionPrimer.pdf. [Accessed 10
February 2014].
[38] F. Nottorf, “Modeling the Clickstream Across Multiple Online Advertising Channels
Usin a Binary Lo it With Bayesian Mixture of Normals ” Electronic Commerce
Research and Applications, vol. 13, nr. 1, pp. 45-55, 2014.
[39] I. Fanlo, “Removing the Barriers to Growing Online Media Spend: Transparency ”
Admonsters, 4 November 2010. [Online]. Available:
http://www.admonsters.com/blog/removing-barriers-growing-online-media-spend-
transparency. [Accessed 20 February 2014].
[40] A. N. Prasada and R. Kalyan, “Understanding the Impact of Synergy in Multimedia
Communications ” Journal of Marketin Research vol. 40, nr. 4, pp. 375-388, 2003.
68
[41] N. A. Prasada and K. Peters, “A Hierarchical Marketing Communications Model of
Online and Offline Media Syner ies ” Journal of Interactive Marketing, vol. 23, nr.
4, pp. 288-299, 2009.
[42] B. Dalessandro, C. Perlich, O. Stitelman and F. Provost, “Causally Motivated
Attribution For Online Advertisin ” ADKDD '12 Proceedin s of the Sixth
International Workshop on Data Mining for Online Advertising and Internet
Economy, New York, 2012.
[43] J. Chandler-Pepelnjak, “Measuring ROI Beyond the Last Advertisement ” [Online]
Available: http://atlassolutions.com/wwdocs/user/atlassolutions/en-us/insights/dmi-
MeasuringROIBeyondLastAd.pdf. [Accessed 17 February 2014].
[44] D. Chaffey, “Display Advertisin Clickthrou h Rates ” Smartins hts 13 November
2013. [Online]. Available: http://www.smartinsights.com/internet-
advertising/internet-advertising-analytics/display-advertising-clickthrough-rates/.
[Accessed 14 February 2014].
[45] J. Dreller, “Q1 2013 Global Search Advertising Clicks, CTR, and Impression
Volume ” Kenshoo 24 April 2013 [Online]. Available:
http://www.kenshoo.com/blog-post/q1-2013-global-search-advertising-clicks-ctr-
and-impression-volume/. [Accessed 27 March 2014].
[46] “Attribution (marketin ) ” Wikipedia 23 January 2014 [Online] Available:
http://en.wikipedia.org/wiki/Attribution_%28marketing%29. [Accessed 5 February
2014].
[47] J. P. Benway, “Banner Blindness: the Irony of Attention Grabbing on the World
Wide Web ” Proceedin s of Human Factors and Er onomics Society Annual
Meeting, Houston, Texas, 1998.
[48] K. Bill, “Attribution Playbook Goo le Analytics ” Goo le 2012 [Online]
Available: http://services.google.com/fh/files/misc/attribution_playbook.pdf.
[Accessed 17 February 2014].
[49] J. Chandler-Pepelnjak, “Modelin Conversions In Online Advertisin ” PhD
dissertation, The University Of Montana, 2010.
69
[50] C. M. Bishop, Pattern Recognition and Machine Learning, New York: Springer
Science+Business Media, LLC, 2006.
[51] P. E. Rossi and G. M. Allenby, “Bayesian Statistics and Marketin ” Marketin
Science, vol. 22, nr. 3, pp. 304-328, 2003.
[52] P. E. Rossi, G. M. Allenby and R. McCulloch, Bayesian Statistics and Marketing,
West Sussex: John Wiley & Sons Ltd, 2005.
[53] D. Opitz and R. Maclin, “Popular Ensemble Methods: An Empirical Study ” Journal
of Artificial Intelligence Research, vol. 8, pp. 169-198, 1999.
[54] L. Breiman, “Ba in Predictors ” Machine Learnin vol. 24, pp. 123-140, 1996.
[55] M. LeBlanc and R. Tibshirani, “Combining Estimates on Regression and
Classification ” Journal of the American Statistical Association vol. 91, pp. 1641-
1650, 1996.
[56] M. Mojirsheibani, “Combinin Classifiers vis Descretization ” Journal of the
American Statistical Association, vol. 94, pp. 600-609, 1999.
[57] J. Friedman, T. Hastie and R. Tibsharini, “Additive Logistic Regression: a Statistical
Vie of Boostin ” Annals of Statistics vol. 28, pp. 337-407, 2000.
[58] N. E. Breslow, “Analysis of Survival Data Under the Proportional Hazard Model ”
International Statistical Review, vol. 43, nr. 1, pp. 45-58, 1975.
[59] N. Archak, V. S. Mirrokni and S. Muthukrishnan, “Mining Advertiser-Specific User
Behavior Usin Adfactors ” World Wide Web Conference Ralei h North Carolina
USA, 2010.
[60] Wikipedia, “SQL ” 22 March 2014 [Online] Available:
http://en.wikipedia.org/wiki/SQL. [Accessed 24 March 2014].
[61] R. Longadge, S. S. Dongre and L. Malik, “Class Imbalance Problem in Data Mining:
Revie ” International Journal of Computer Science And Net ork vol. 2, nr. 1,
2013.
[62] T. Fawcett, “An Introduction to ROC Analysis ” Pattern Reco nition Letters vol.
27, pp. 861-874, 2006.
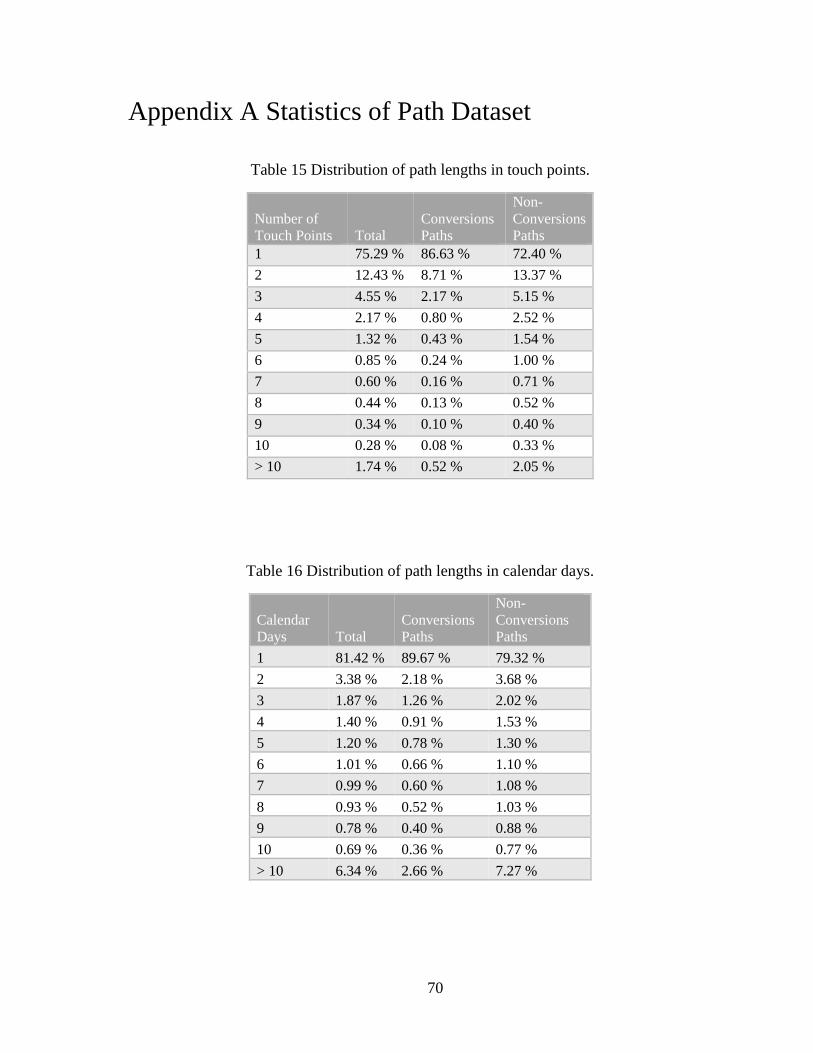
70
Appendix A Statistics of Path Dataset
Table 15 Distribution of path lengths in touch points.
Number of
Touch Points Total
Conversions
Paths
Non-
Conversions
Paths
1 75.29 % 86.63 % 72.40 %
2 12.43 % 8.71 % 13.37 %
3 4.55 % 2.17 % 5.15 %
4 2.17 % 0.80 % 2.52 %
5 1.32 % 0.43 % 1.54 %
6 0.85 % 0.24 % 1.00 %
7 0.60 % 0.16 % 0.71 %
8 0.44 % 0.13 % 0.52 %
9 0.34 % 0.10 % 0.40 %
10 0.28 % 0.08 % 0.33 %
> 10 1.74 % 0.52 % 2.05 %
Table 16 Distribution of path lengths in calendar days.
Calendar
Days Total
Conversions
Paths
Non-
Conversions
Paths
1 81.42 % 89.67 % 79.32 %
2 3.38 % 2.18 % 3.68 %
3 1.87 % 1.26 % 2.02 %
4 1.40 % 0.91 % 1.53 %
5 1.20 % 0.78 % 1.30 %
6 1.01 % 0.66 % 1.10 %
7 0.99 % 0.60 % 1.08 %
8 0.93 % 0.52 % 1.03 %
9 0.78 % 0.40 % 0.88 %
10 0.69 % 0.36 % 0.77 %
> 10 6.34 % 2.66 % 7.27 %
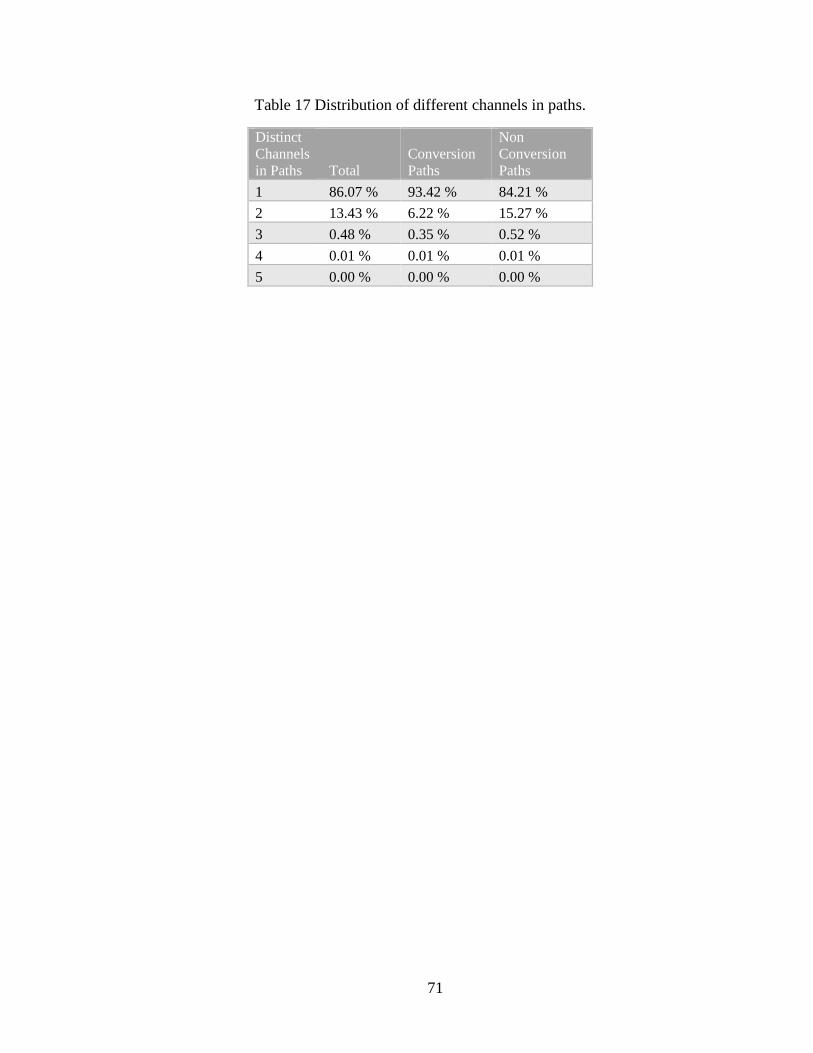
71
Table 17 Distribution of different channels in paths.
Distinct
Channels
in Paths Total
Conversion
Paths
Non
Conversion
Paths
1 86.07 % 93.42 % 84.21 %
2 13.43 % 6.22 % 15.27 %
3 0.48 % 0.35 % 0.52 %
4 0.01 % 0.01 % 0.01 %
5 0.00 % 0.00 % 0.00 %