Embed Size (px)
Citation preview
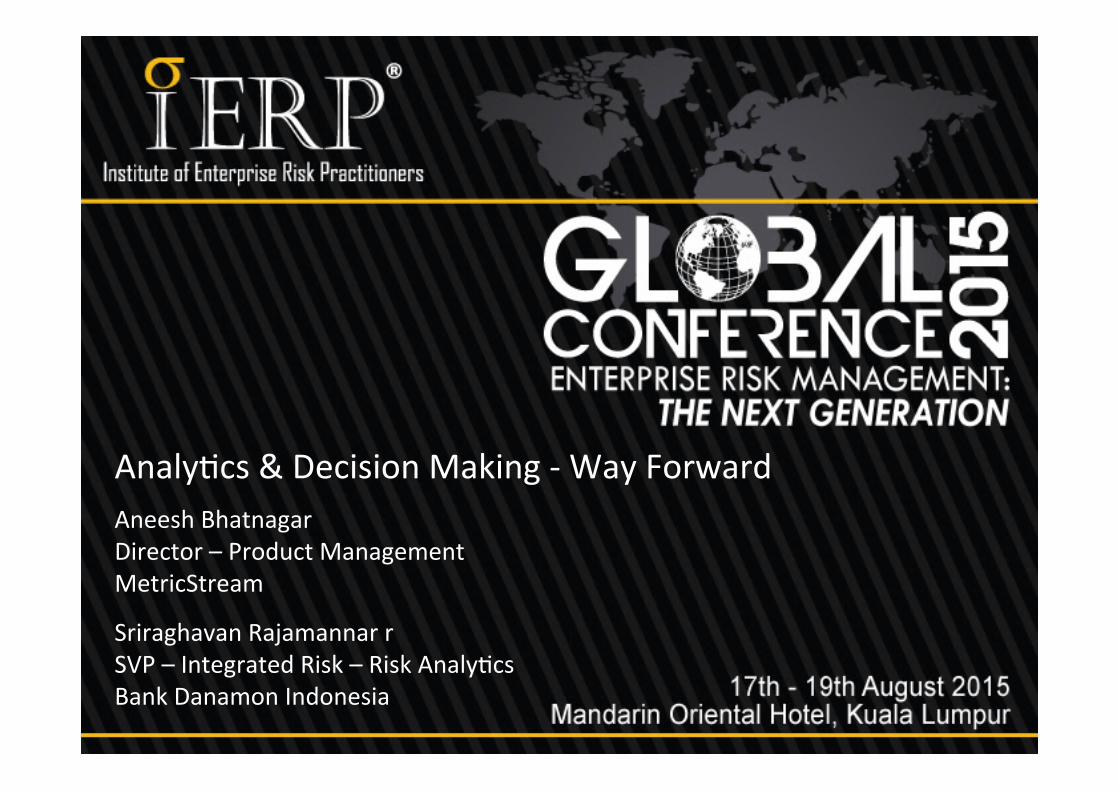
Analy&cs & Decision Making -‐ Way Forward Aneesh Bhatnagar Director – Product Management MetricStream
Sriraghavan Rajamannar r SVP – Integrated Risk – Risk Analy&cs Bank Danamon Indonesia
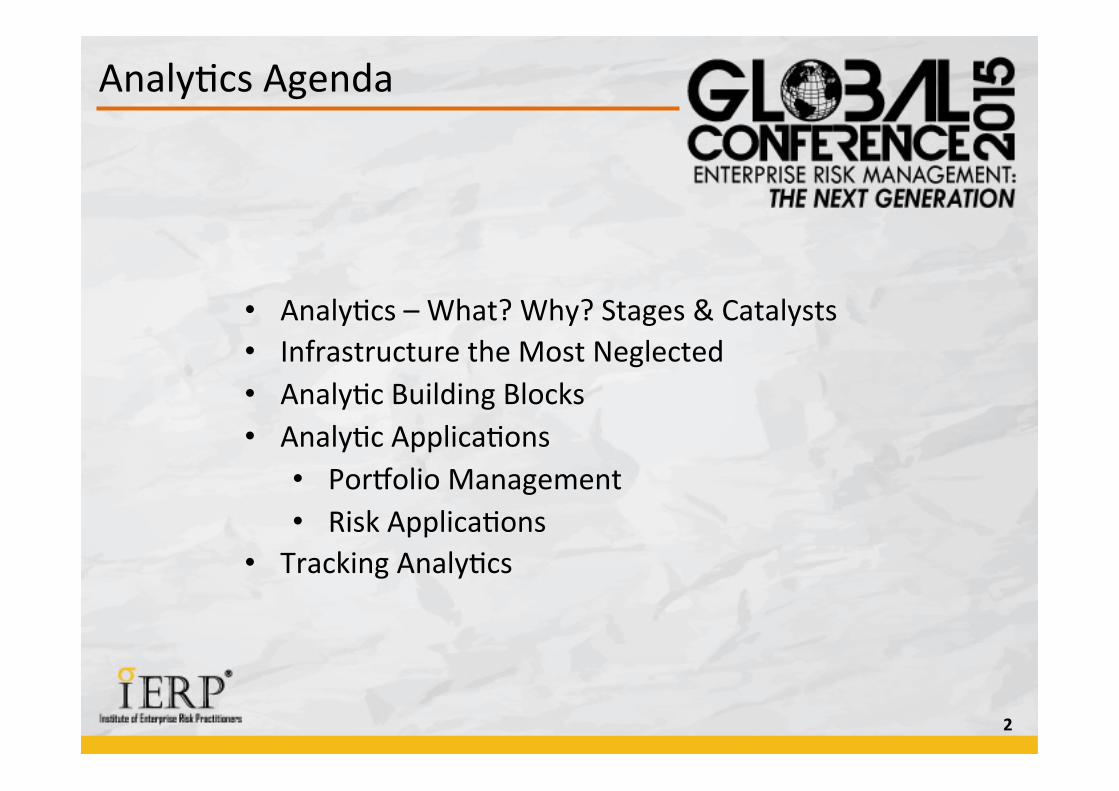
Analy&cs Agenda
2
• Analy&cs – What? Why? Stages & Catalysts • Infrastructure the Most Neglected • Analy&c Building Blocks • Analy&c Applica&ons
• PorJolio Management • Risk Applica&ons
• Tracking Analy&cs
Key Aspects
3
• Clarity on what business needs now and in future
• Avoid Silos. Need to Standardize.
• Central repository of Process, Risk and Control data.
• Cri&cal importance of quality data
• Capturing and managing accurate, &mely and relevant data is vital
• Building an effec&ve data analy&cs infrastructure
Key Aspects
4
• Flexible repor&ng framework
• Remember: Analy&cs is Big Data
• Automate and avoid manual errors
• All the above needs investment in systems, soUware and automa&on
• Select the appropriate tools for your requirements
• Have the best skilled people for Analy&cs
5
Analy&cs – What? Why? Stages & Catalysts
What is Analy&cs
6
“Analytics is all about deriving insights from relevant data to support fact-based decision-making”
“Analytics helps improve Top-line and Bottom-line
The Essence of Research has Shifted from Information Capture to its Transformation into Knowledge”
“In an uncertain world, one factor sets successful enterprises
apart: Intelligence”
“Intelligent enterprises apply data and process insights to make technology work smarter for them”
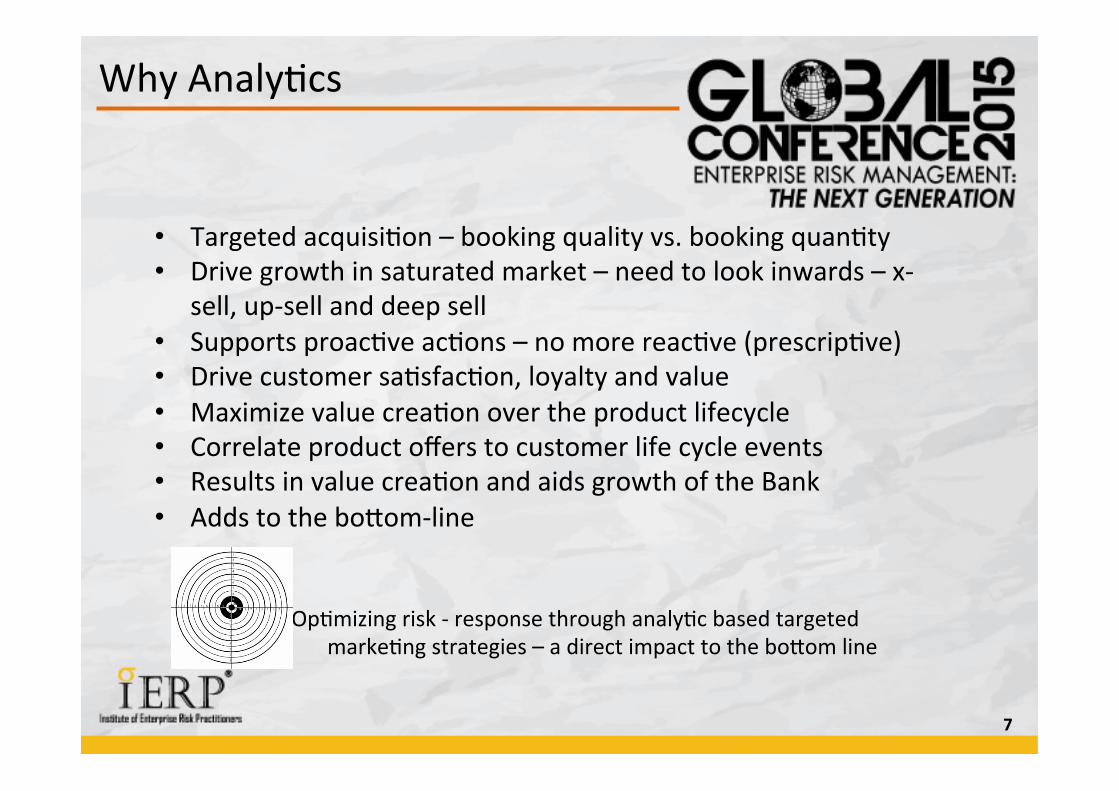
Why Analy&cs
7
• Targeted acquisi&on – booking quality vs. booking quan&ty • Drive growth in saturated market – need to look inwards – x-‐
sell, up-‐sell and deep sell • Supports proac&ve ac&ons – no more reac&ve (prescrip&ve) • Drive customer sa&sfac&on, loyalty and value • Maximize value crea&on over the product lifecycle • Correlate product offers to customer life cycle events • Results in value crea&on and aids growth of the Bank • Adds to the boYom-‐line
Op&mizing risk -‐ response through analy&c based targeted marke&ng strategies – a direct impact to the boYom line
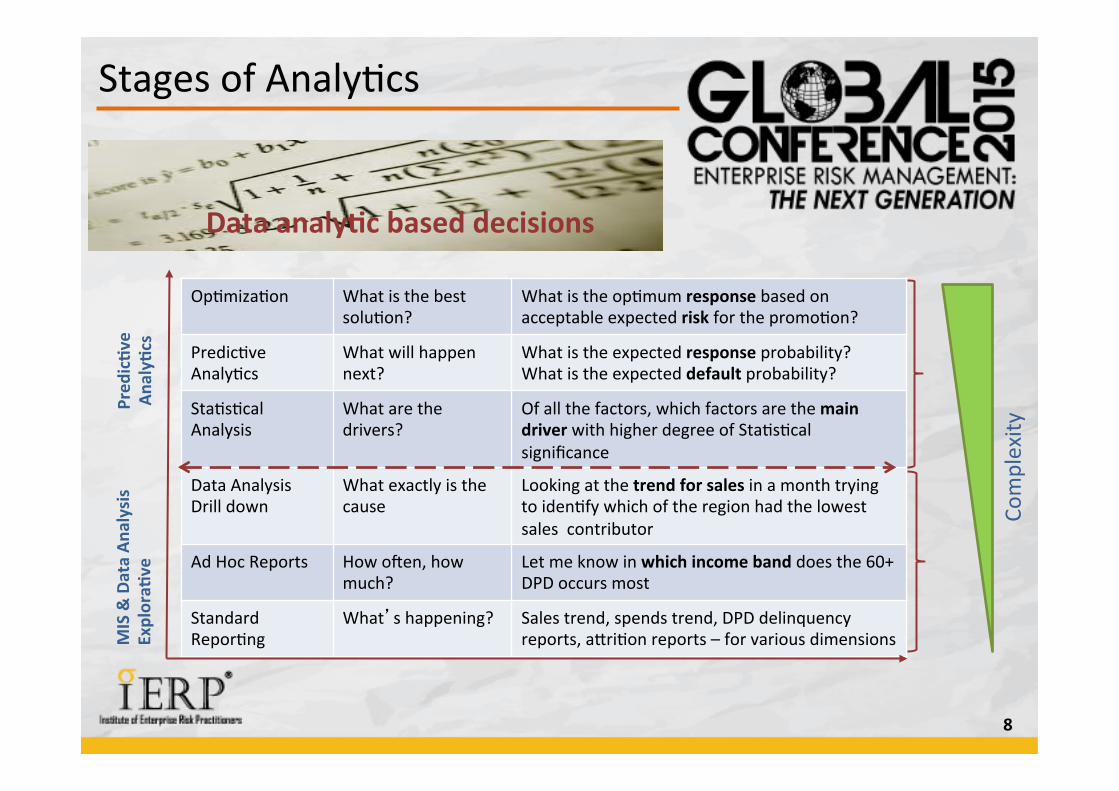
Stages of Analy&cs
8
Op&miza&on What is the best solu&on?
What is the op&mum response based on acceptable expected risk for the promo&on?
Predic&ve Analy&cs
What will happen next?
What is the expected response probability? What is the expected default probability?
Sta&s&cal Analysis
What are the drivers?
Of all the factors, which factors are the main driver with higher degree of Sta&s&cal significance
Data Analysis Drill down
What exactly is the cause
Looking at the trend for sales in a month trying to iden&fy which of the region had the lowest sales contributor
Ad Hoc Reports How oUen, how much?
Let me know in which income band does the 60+ DPD occurs most
Standard Repor&ng
What’s happening? Sales trend, spends trend, DPD delinquency reports, aYri&on reports – for various dimensions
Pred
ic>v
e
Analy>
cs
MIS & Data An
alysis
Explora>
ve
Complexity
Data analy>c based decisions
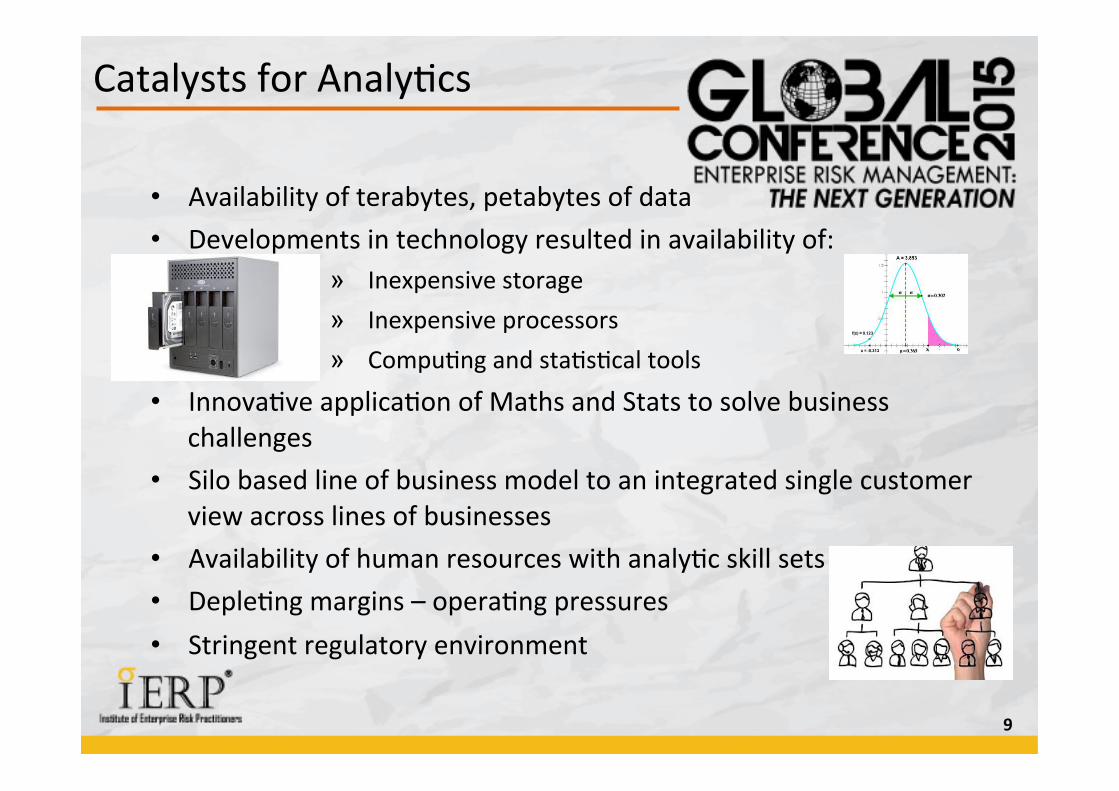
Catalysts for Analy&cs
9
• Availability of terabytes, petabytes of data • Developments in technology resulted in availability of:
» Inexpensive storage » Inexpensive processors » Compu&ng and sta&s&cal tools
• Innova&ve applica&on of Maths and Stats to solve business challenges
• Silo based line of business model to an integrated single customer view across lines of businesses
• Availability of human resources with analy&c skill sets • Deple&ng margins – opera&ng pressures • Stringent regulatory environment
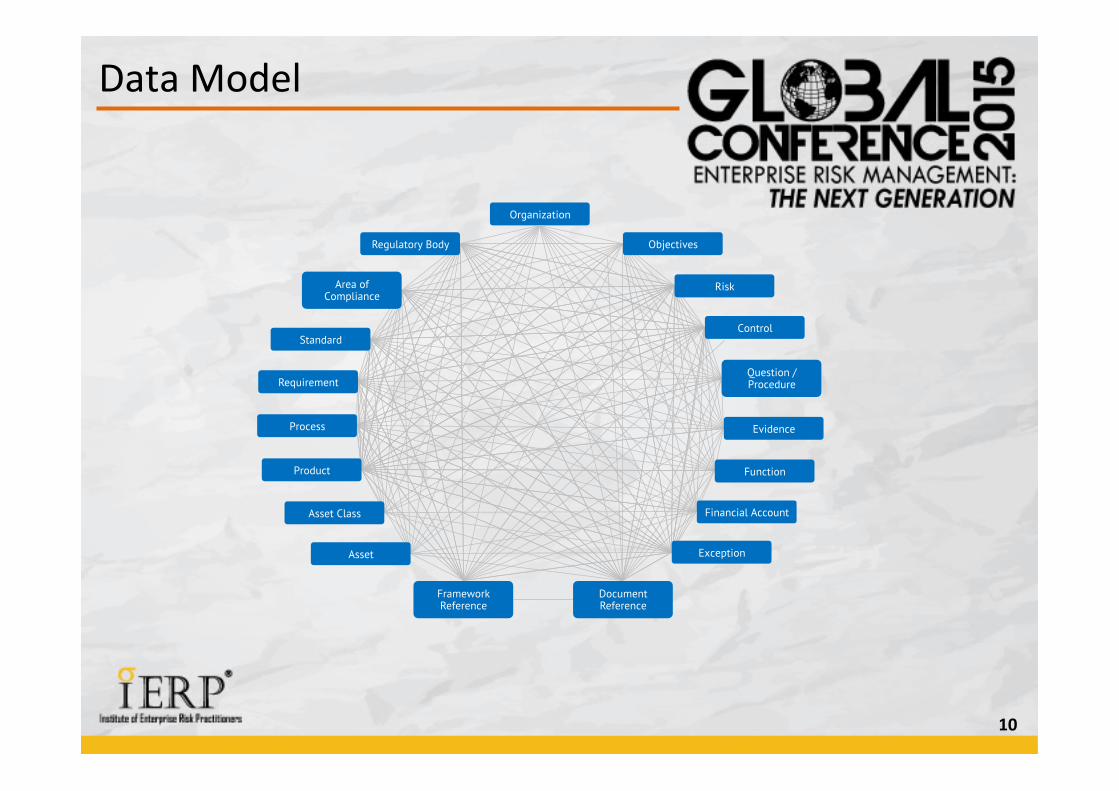
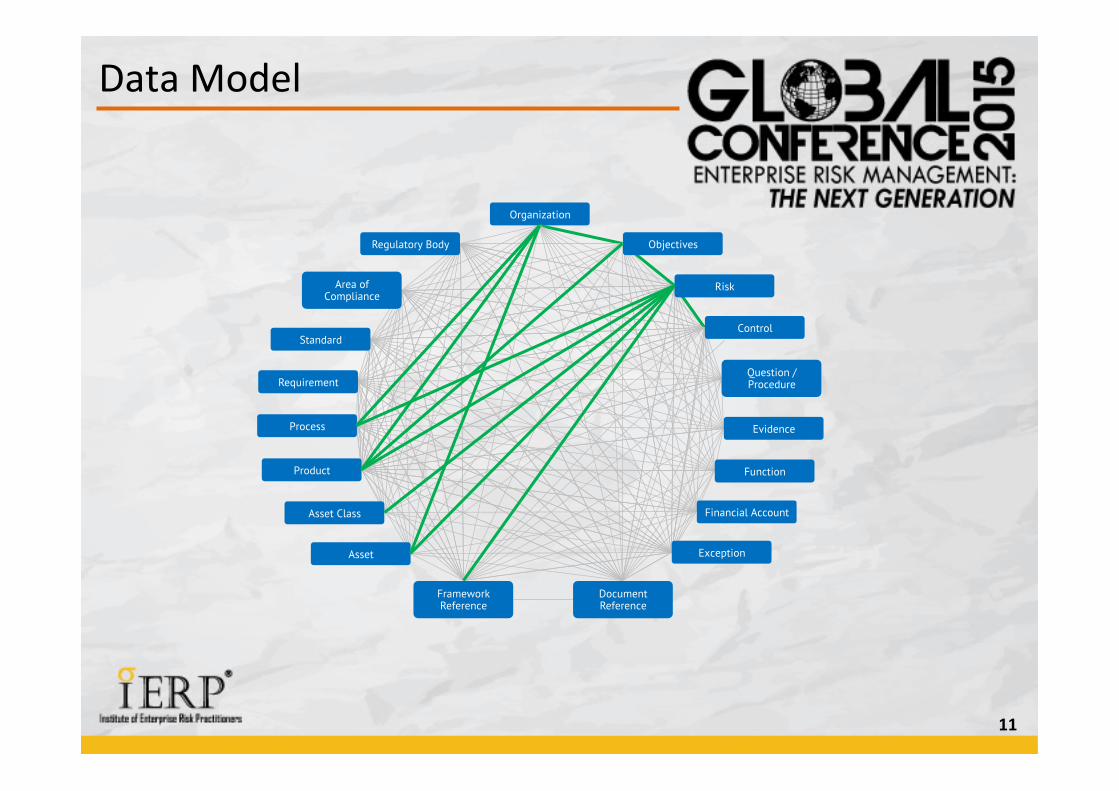
Data Model
10
Organization
Objectives
Risk
Control
Question / Procedure
Evidence
Function
Financial Account
Exception Asset
Asset Class
Product
Process
Requirement
Standard
Area of Compliance
Regulatory Body
Framework Reference
Document Reference
Data Model
11
Organization
Objectives
Risk
Control
Question / Procedure
Evidence
Function
Financial Account
Exception Asset
Asset Class
Product
Process
Requirement
Standard
Area of Compliance
Regulatory Body
Framework Reference
Document Reference
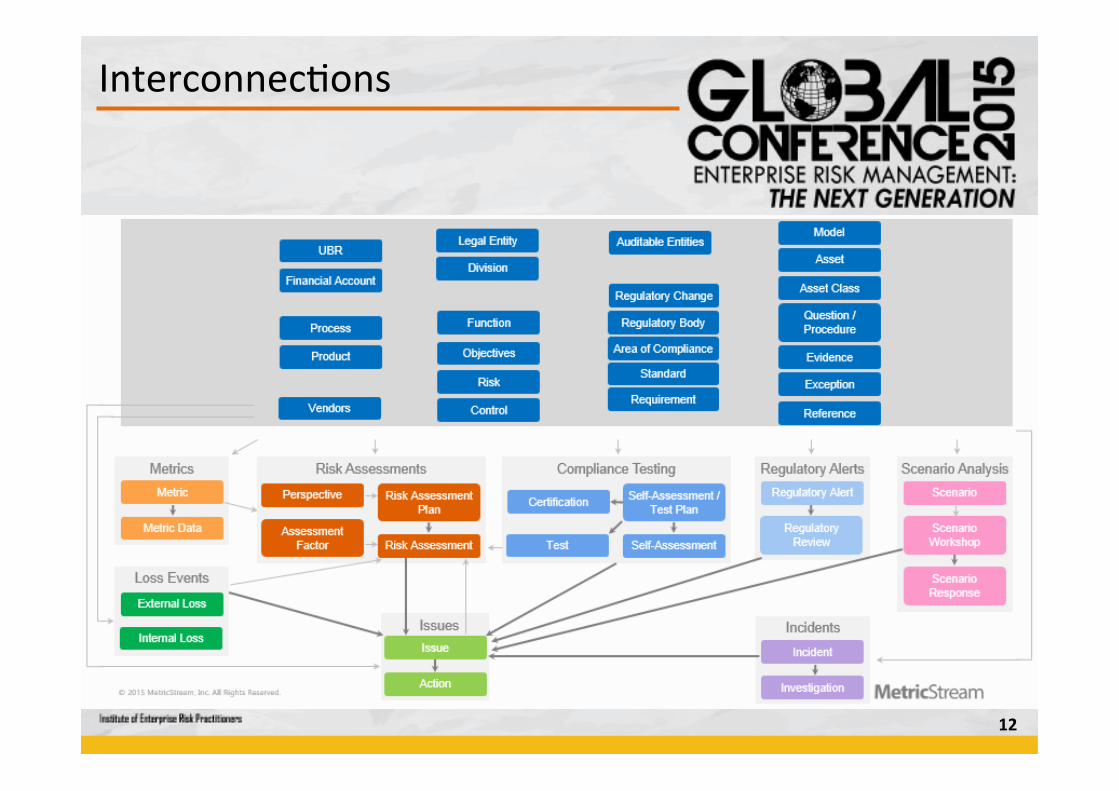
Interconnec&ons
12
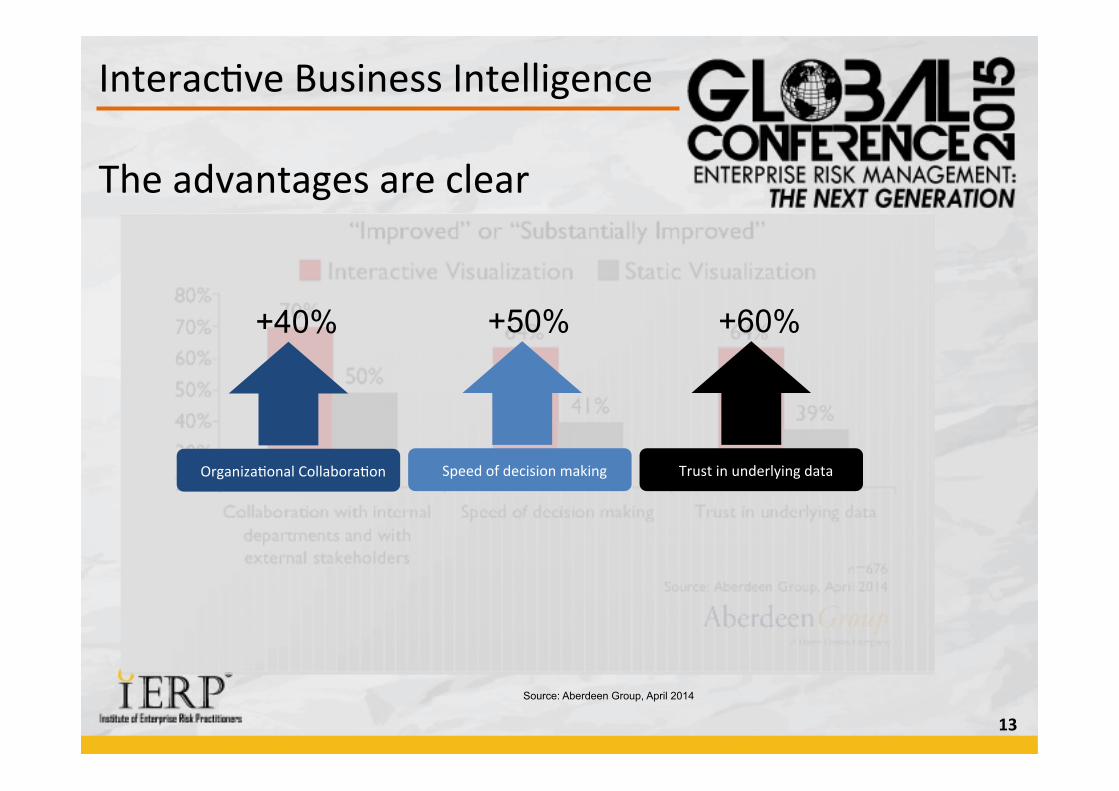
Interac&ve Business Intelligence The advantages are clear
13
+40%
Organiza&onal Collabora&on
+50%
Speed of decision making
+60%
Trust in underlying data
Source: Aberdeen Group, April 2014

14
Infrastructure The Most Neglected
15
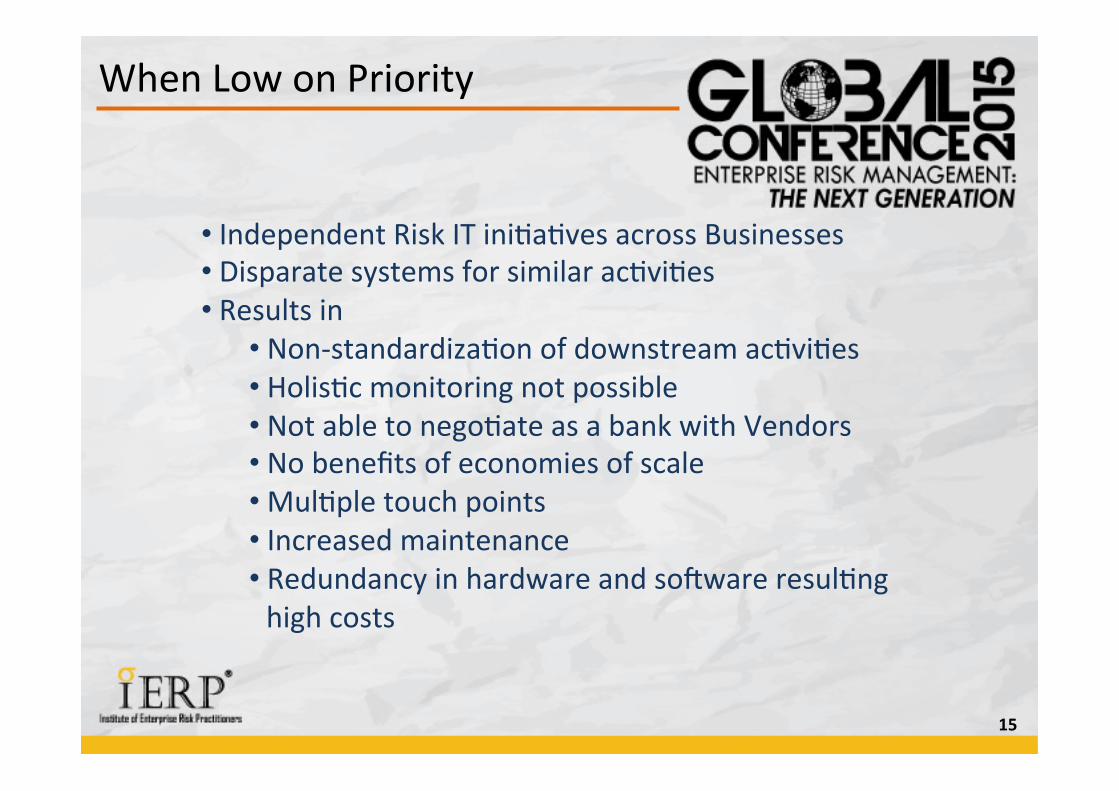
When Low on Priority
• Independent Risk IT ini&a&ves across Businesses • Disparate systems for similar ac&vi&es • Results in
• Non-‐standardiza&on of downstream ac&vi&es • Holis&c monitoring not possible • Not able to nego&ate as a bank with Vendors • No benefits of economies of scale • Mul&ple touch points • Increased maintenance • Redundancy in hardware and soUware resul&ng high costs
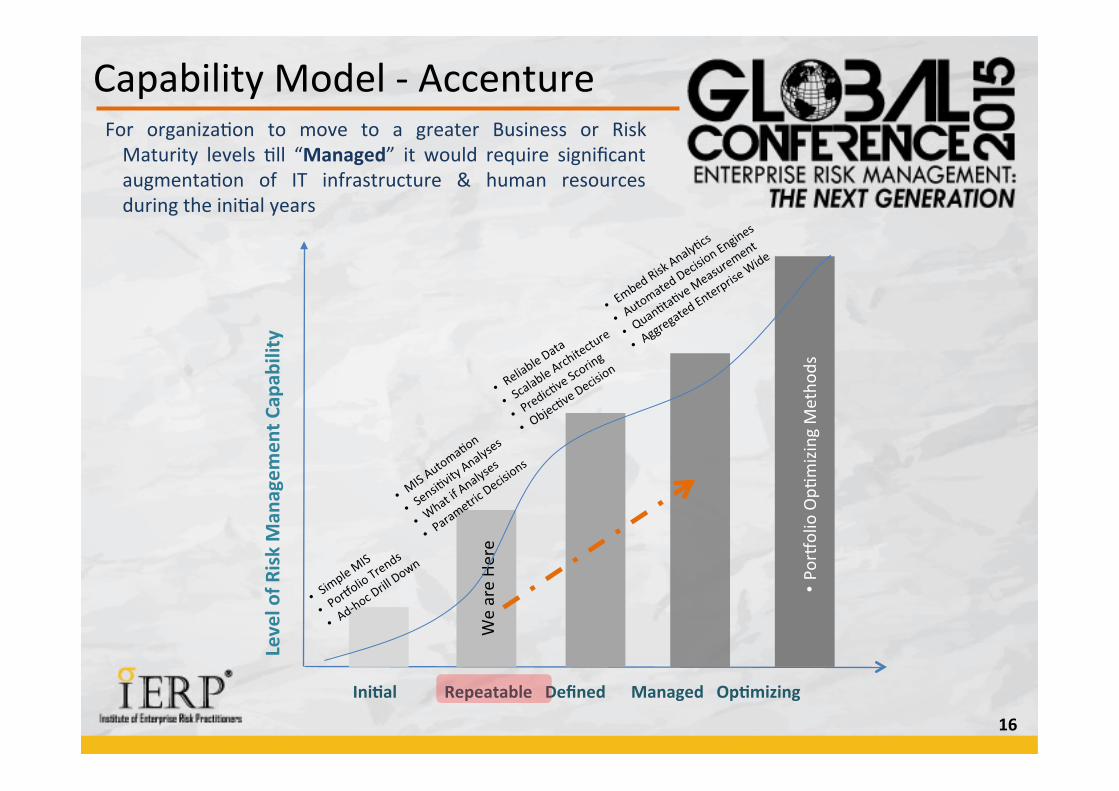
Capability Model -‐ Accenture
16
We are He
re
Level of R
isk Man
agem
ent C
apab
ility
Ini>al Repeatable Defined Managed Op>mizing
• PorJo
lio Op&
mizing M
etho
ds
For organiza&on to move to a greater Business or Risk Maturity levels &ll “Managed” it would require significant augmenta&on of IT infrastructure & human resources during the ini&al years
17
Analy&cs Building Blocks
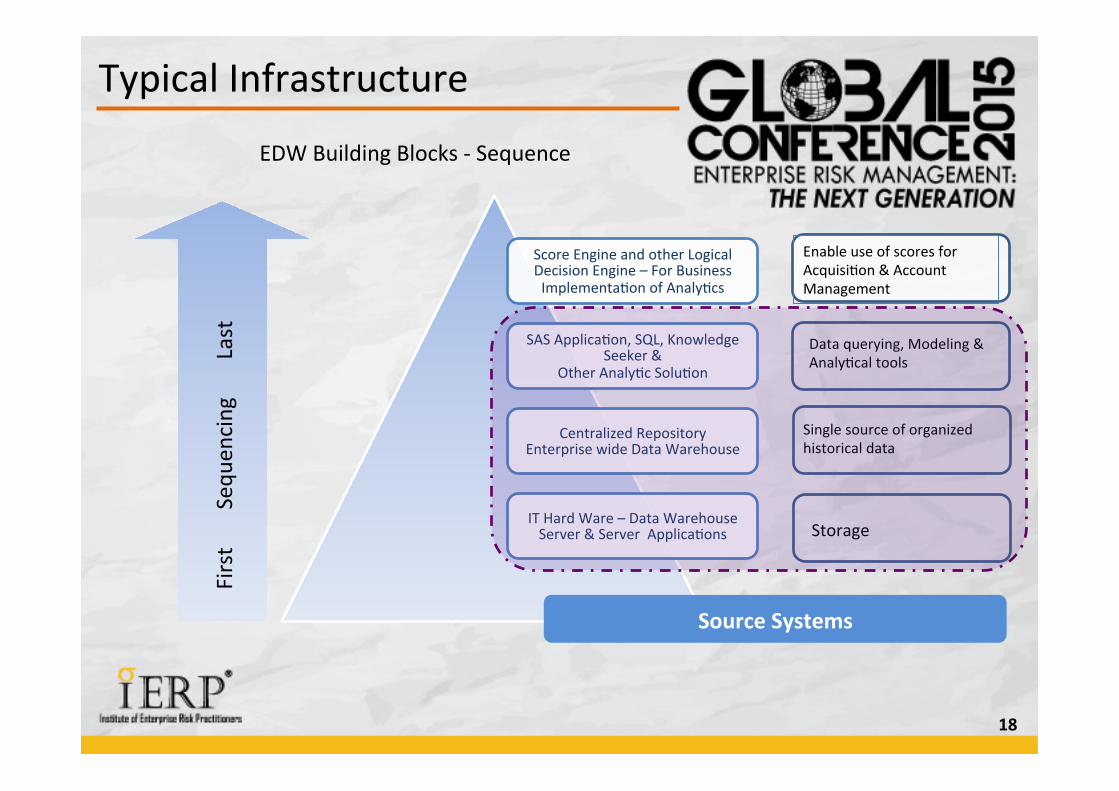
Typical Infrastructure
18
Enable use of scores for Acquisi&on & Account Management
Score Engine and other Logical Decision Engine – For Business Implementa&on of Analy&cs
SAS Applica&on, SQL, Knowledge Seeker &
Other Analy&c Solu&on
Centralized Repository Enterprise wide Data Warehouse
IT Hard Ware – Data Warehouse Server & Server Applica&ons
First Seq
uencing Last
Single source of organized historical data
Data querying, Modeling & Analy&cal tools
Storage
Source Systems
EDW Building Blocks -‐ Sequence
19
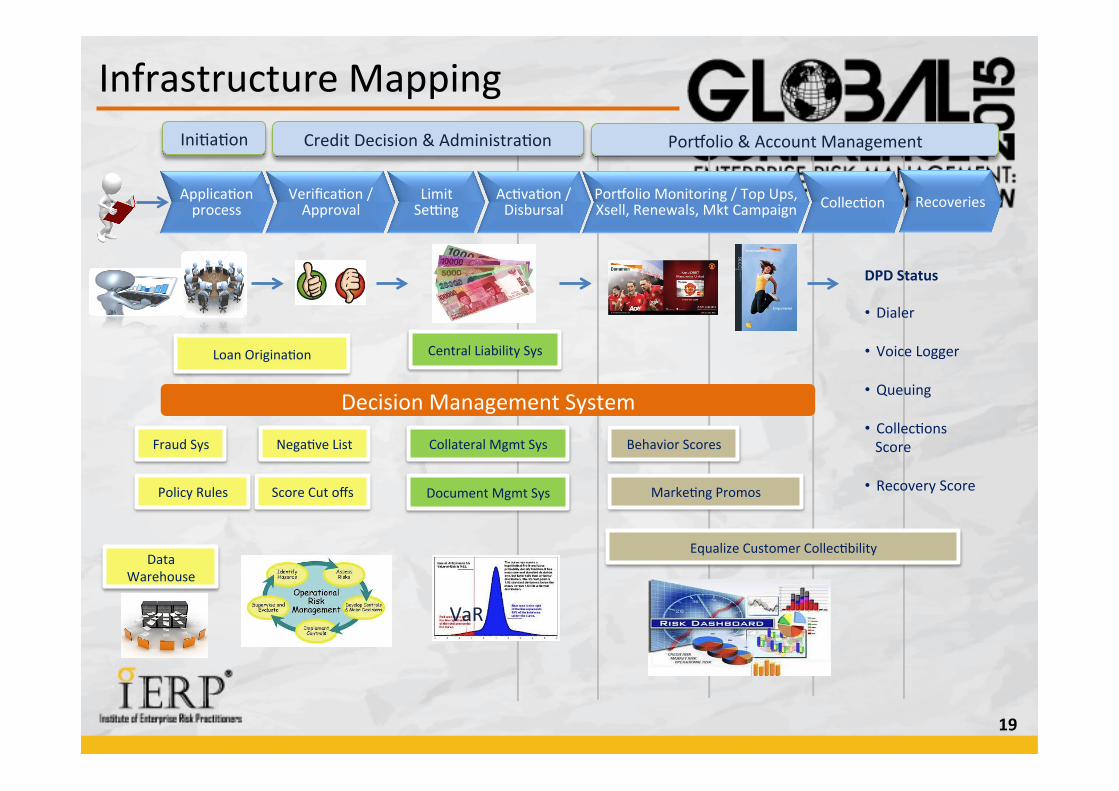
Infrastructure Mapping
Score Cut offs
Loan Origina&on
PorJolio & Account Management Credit Decision & Administra&on Ini&a&on
Applica&on process
Verifica&on / Approval
Limit Seeng
Ac&va&on / Disbursal
PorJolio Monitoring / Top Ups, Xsell, Renewals, Mkt Campaign Collec&on
Nega&ve List
Data Warehouse
Fraud Sys
Central Liability Sys
Equalize Customer Collec&bility
DPD Status • Dialer
• Voice Logger
• Queuing
• Collec&ons Score
• Recovery Score
Recoveries
Decision Management System
Document Mgmt Sys Policy Rules
Collateral Mgmt Sys Behavior Scores
VaR
Marke&ng Promos
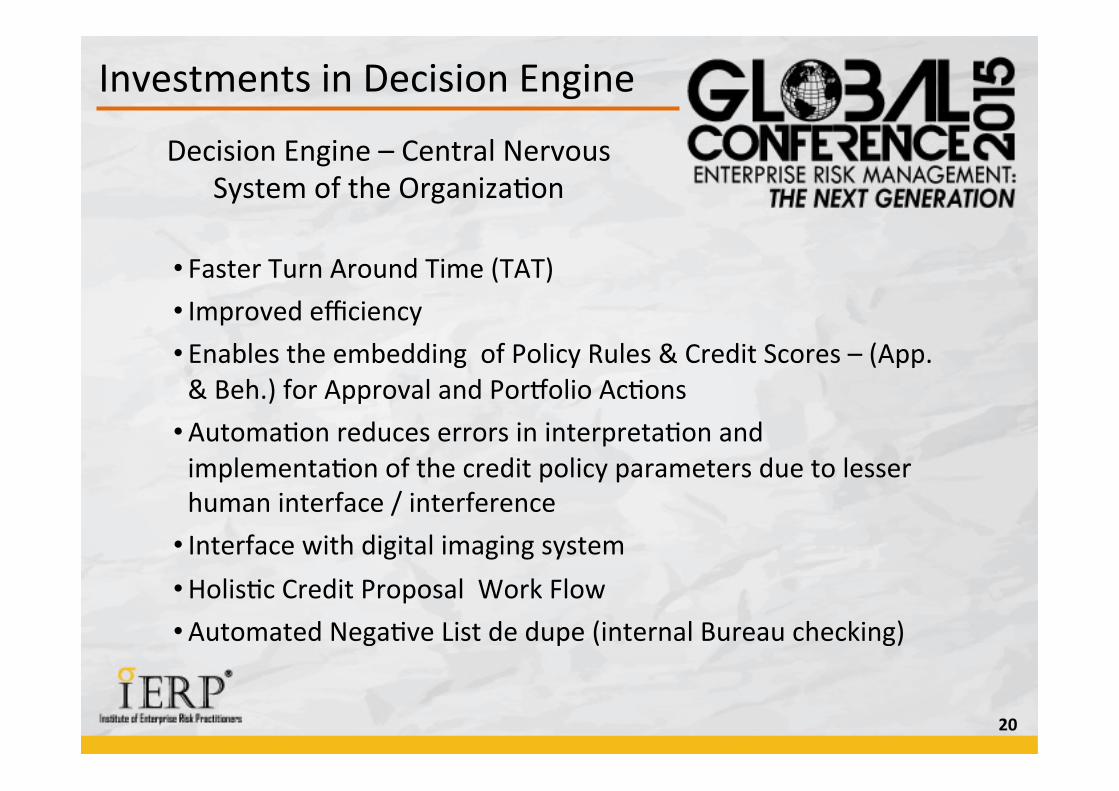
Investments in Decision Engine
20
Decision Engine – Central Nervous System of the Organiza&on
• Faster Turn Around Time (TAT) • Improved efficiency • Enables the embedding of Policy Rules & Credit Scores – (App. & Beh.) for Approval and PorJolio Ac&ons
• Automa&on reduces errors in interpreta&on and implementa&on of the credit policy parameters due to lesser human interface / interference
• Interface with digital imaging system • Holis&c Credit Proposal Work Flow • Automated Nega&ve List de dupe (internal Bureau checking)
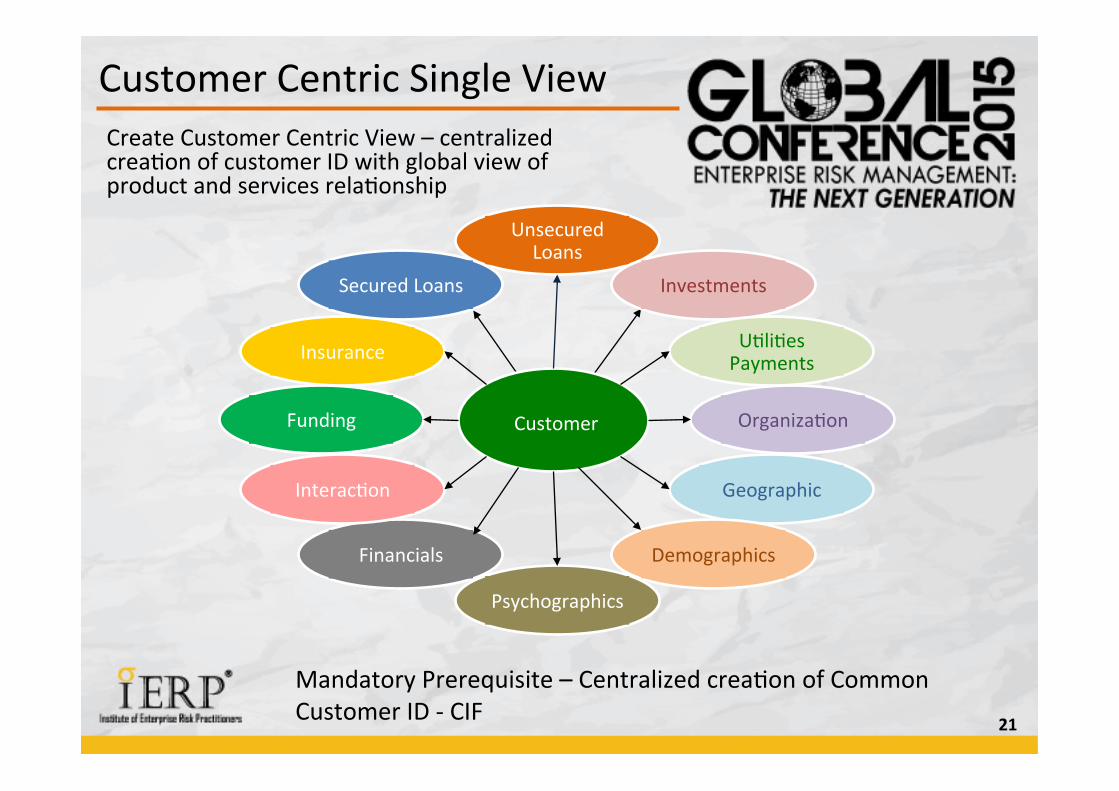
Customer Centric Single View
21
Create Customer Centric View – centralized crea&on of customer ID with global view of product and services rela&onship
Mandatory Prerequisite – Centralized crea&on of Common Customer ID -‐ CIF
Unsecured Loans
Investments
U&li&es Payments
Organiza&on
Geographic
Demographics
Psychographics
Financials
Interac&on
Funding
Insurance
Secured Loans
Customer
Analy&c Center of Excellence
22
Silo based Analy>c approach and Organiza>onal Concerns: Lack of understanding on how to use analy&cs to improve the business
––Disconnected projects causing silos of data to develop in pockets across the enterprise
––Weak or poorly understood business analy&cs strategy and roadmap • Projects that are misaligned with business needs, are compe&ng for priority
or lack execu&ve sponsorship and support • Lack of skills internally in the line of business
–– A lack of training and support to ensure that tools are used effec&vely, mee&ng ease of use and response &me expecta&ons
• Best prac&ces and standards that are not shared and applied consistently, affec&ng the efficiency of Finance, IT and user communi&es
Work towards an Analy&cs Center of Excellence (CoE) – move from silo to centralized organiza&on structure to enable the big picture view for the bank
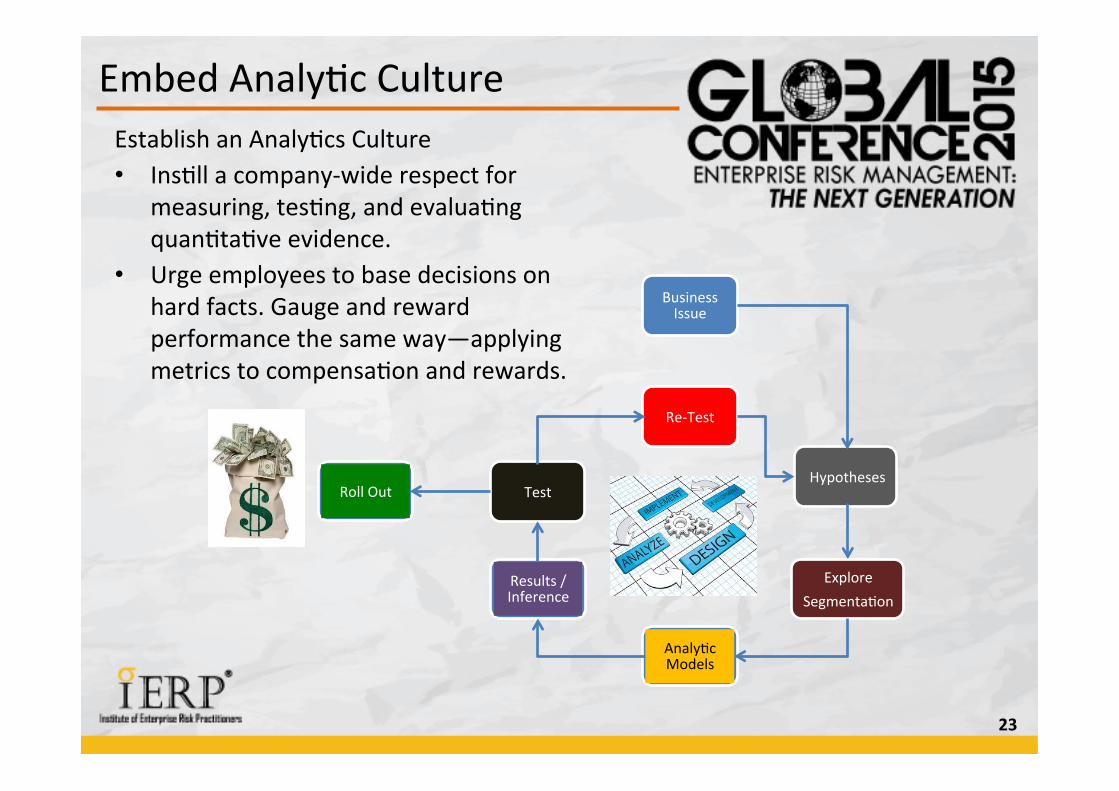
Embed Analy&c Culture
23
Establish an Analy&cs Culture • Ins&ll a company-‐wide respect for
measuring, tes&ng, and evalua&ng quan&ta&ve evidence.
• Urge employees to base decisions on hard facts. Gauge and reward performance the same way—applying metrics to compensa&on and rewards.
Business Issue
Hypotheses
Explore Segmenta&on
Analy&c Models
Results / Inference
Test Roll Out
Re-‐Test
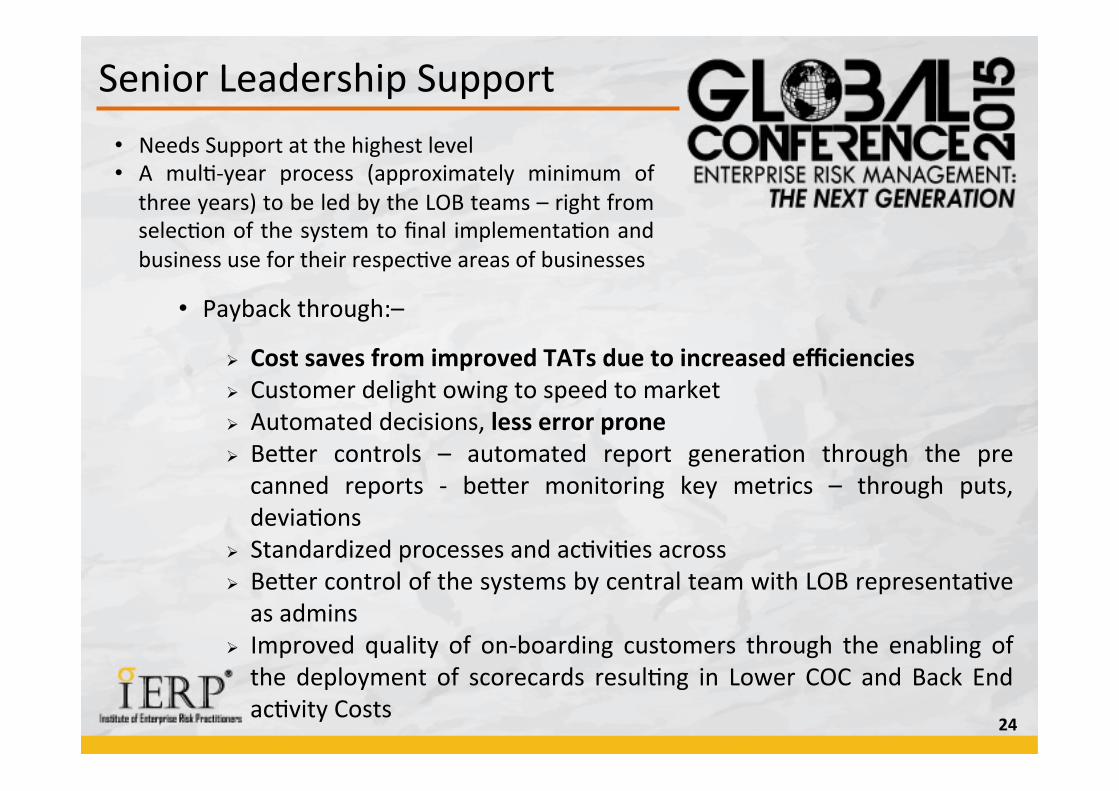
Senior Leadership Support
24
• Payback through:–
Ø Cost saves from improved TATs due to increased efficiencies Ø Customer delight owing to speed to market Ø Automated decisions, less error prone Ø BeYer controls – automated report genera&on through the pre canned reports -‐ beYer monitoring key metrics – through puts, devia&ons
Ø Standardized processes and ac&vi&es across Ø BeYer control of the systems by central team with LOB representa&ve as admins
Ø Improved quality of on-‐boarding customers through the enabling of the deployment of scorecards resul&ng in Lower COC and Back End ac&vity Costs
• Needs Support at the highest level • A mul&-‐year process (approximately minimum of three years) to be led by the LOB teams – right from selec&on of the system to final implementa&on and business use for their respec&ve areas of businesses
25
Analy&c Business Applica&ons
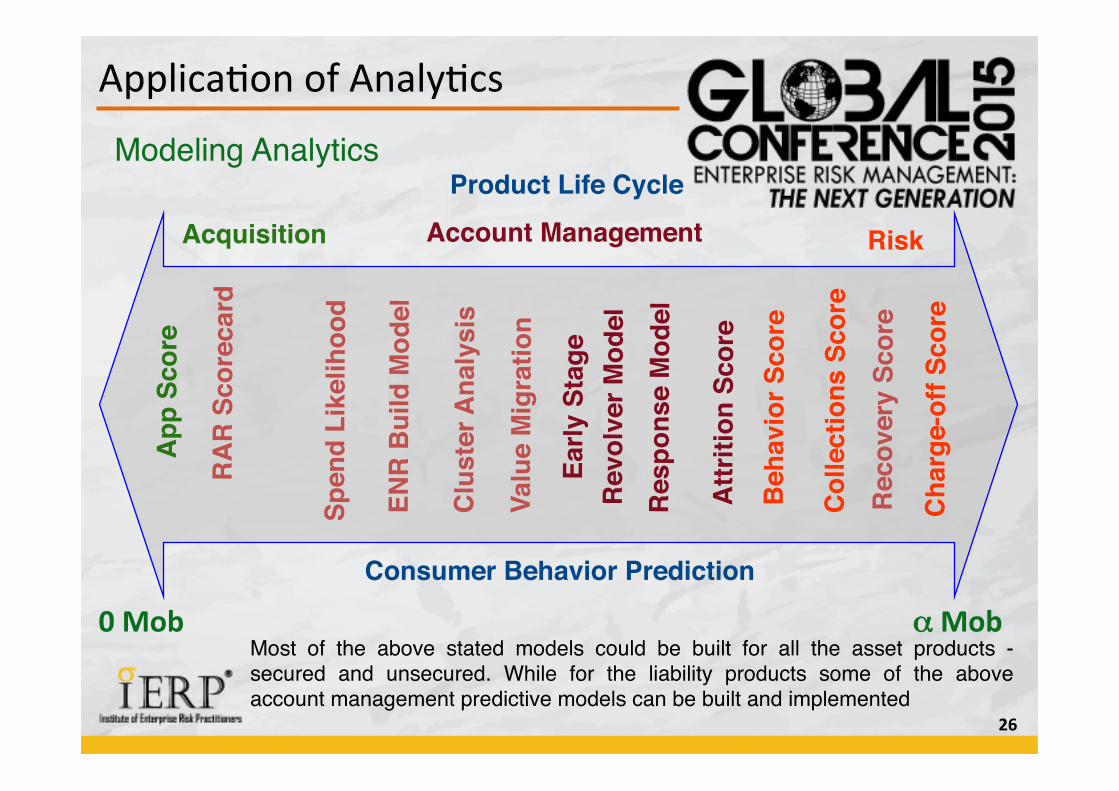
Applica&on of Analy&cs
26
App
Sco
re!
Attr
ition
Sco
re!
ENR
Bui
ld M
odel!
Early
Sta
ge !
!
Rev
olve
r Mod
el!
Res
pons
e M
odel!
Valu
e M
igra
tion!
Spen
d Li
kelih
ood!
Cha
rge-
off S
core!
Col
lect
ions
Sco
re!
Beh
avio
r Sco
re!
Rec
over
y Sc
ore!
Product Life Cycle!
Consumer Behavior Prediction!
Modeling Analytics
Acquisition! Account Management! Risk!
0 Mob α Mob Most of the above stated models could be built for all the asset products - secured and unsecured. While for the liability products some of the above account management predictive models can be built and implemented "
Clu
ster
Ana
lysi
s!
RA
R S
core
card!
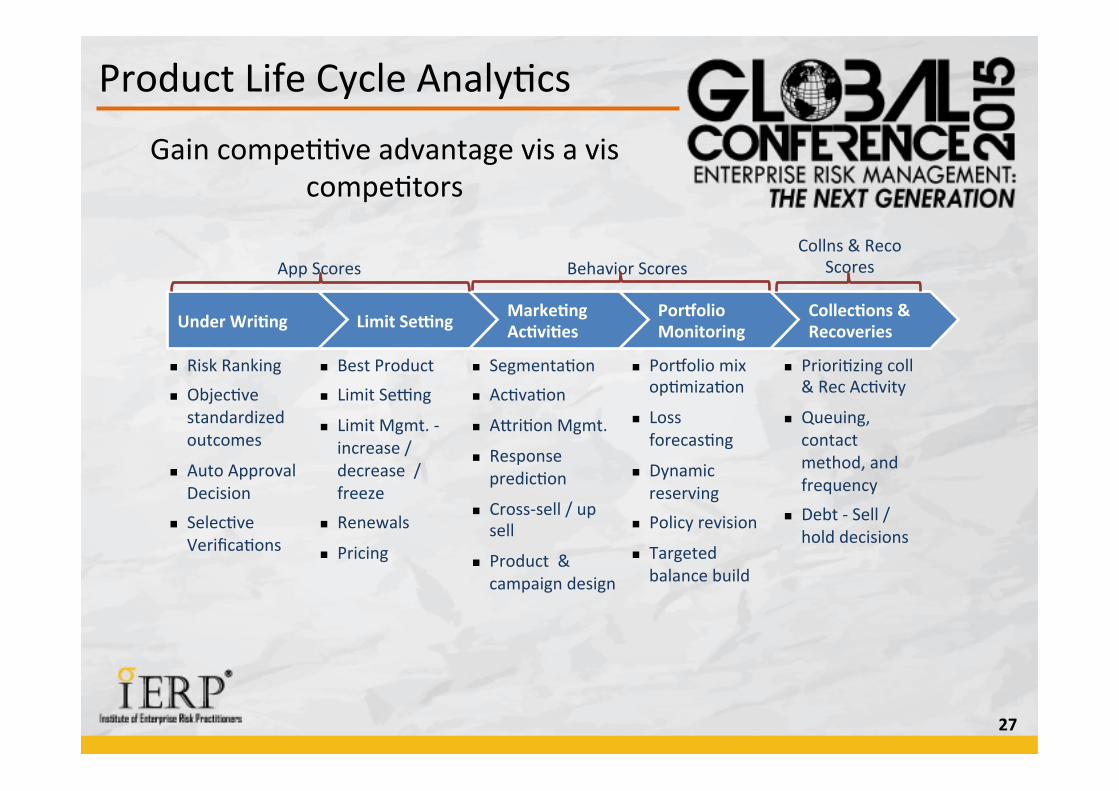
Product Life Cycle Analy&cs
27
n Best Product n Limit Seeng
n Limit Mgmt. -‐ increase / decrease / freeze
n Renewals
n Pricing
n Risk Ranking n Objec&ve standardized outcomes
n Auto Approval Decision
n Selec&ve Verifica&ons
n Segmenta&on n Ac&va&on
n AYri&on Mgmt.
n Response predic&on
n Cross-‐sell / up sell
n Product & campaign design
n PorJolio mix op&miza&on
n Loss forecas&ng
n Dynamic reserving
n Policy revision
n Targeted balance build
n Priori&zing coll & Rec Ac&vity
n Queuing, contact method, and frequency
n Debt -‐ Sell / hold decisions
Under Wri>ng Limit SeWng Marke>ng Ac>vi>es
PorXolio Monitoring
Collec>ons & Recoveries
App Scores Behavior Scores Collns & Reco
Scores
Gain compe&&ve advantage vis a vis compe&tors
28
Analy&cs Risk Applica&ons
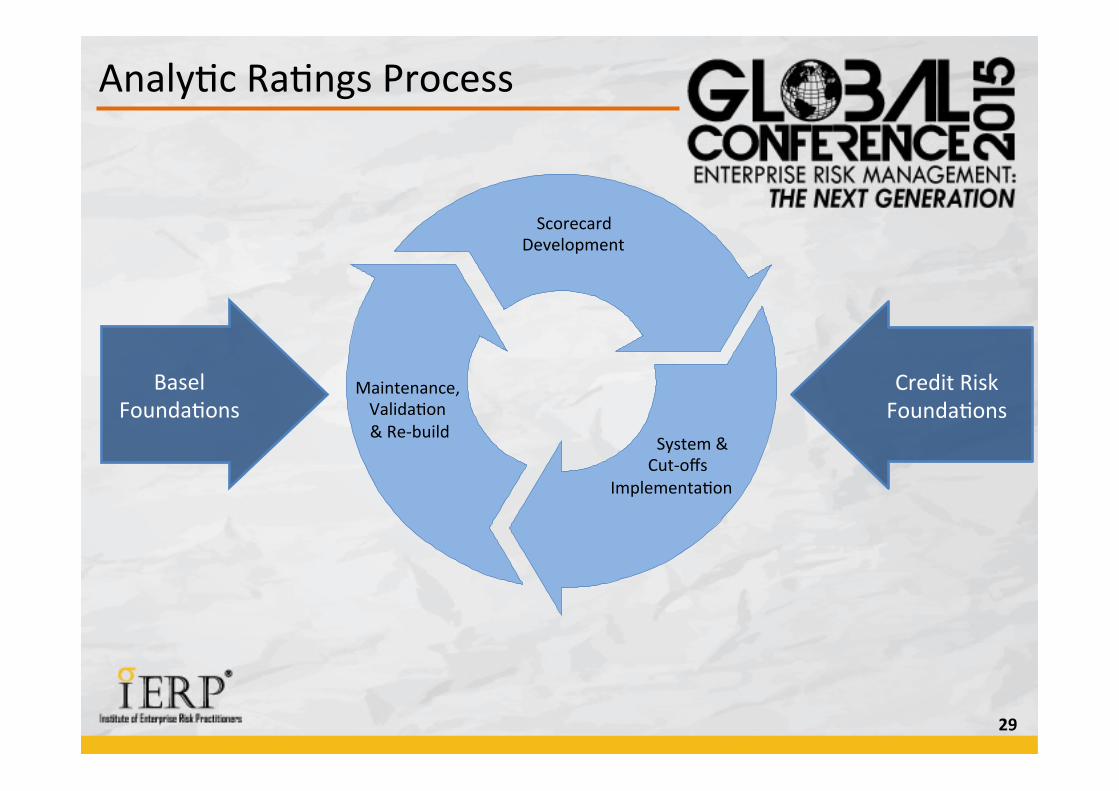
Analy&c Ra&ngs Process
29
Scorecard Development
System & Cut-‐offs
Implementa&on
Maintenance, Valida&on & Re-‐build
Basel Founda&ons
Credit Risk Founda&ons
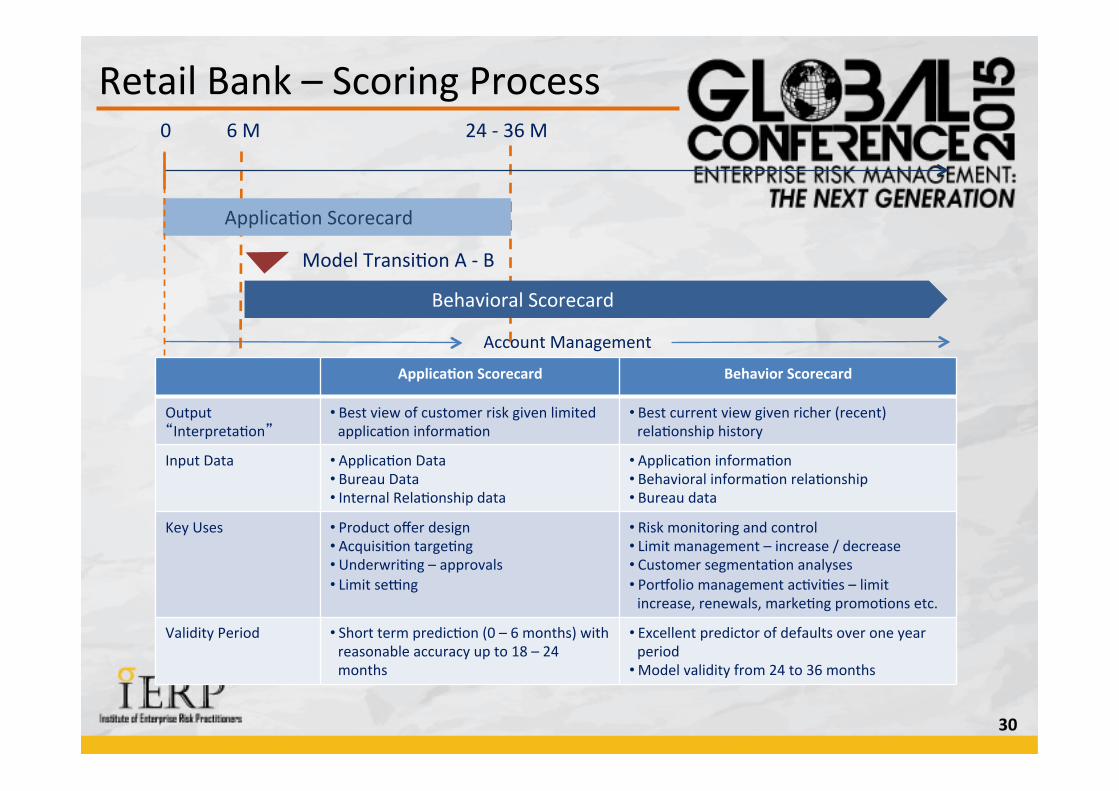
Retail Bank – Scoring Process
30
Applica>on Scorecard Behavior Scorecard
Output “Interpreta&on”
• Best view of customer risk given limited applica&on informa&on
• Best current view given richer (recent) rela&onship history
Input Data • Applica&on Data • Bureau Data • Internal Rela&onship data
• Applica&on informa&on • Behavioral informa&on rela&onship • Bureau data
Key Uses • Product offer design • Acquisi&on targe&ng • Underwri&ng – approvals • Limit seeng
• Risk monitoring and control • Limit management – increase / decrease • Customer segmenta&on analyses • PorJolio management ac&vi&es – limit increase, renewals, marke&ng promo&ons etc.
Validity Period • Short term predic&on (0 – 6 months) with reasonable accuracy up to 18 – 24 months
• Excellent predictor of defaults over one year period
• Model validity from 24 to 36 months
0 6 M 24 -‐ 36 M
Model Transi&on A -‐ B
Applica&on Scorecard
Behavioral Scorecard
Account Management
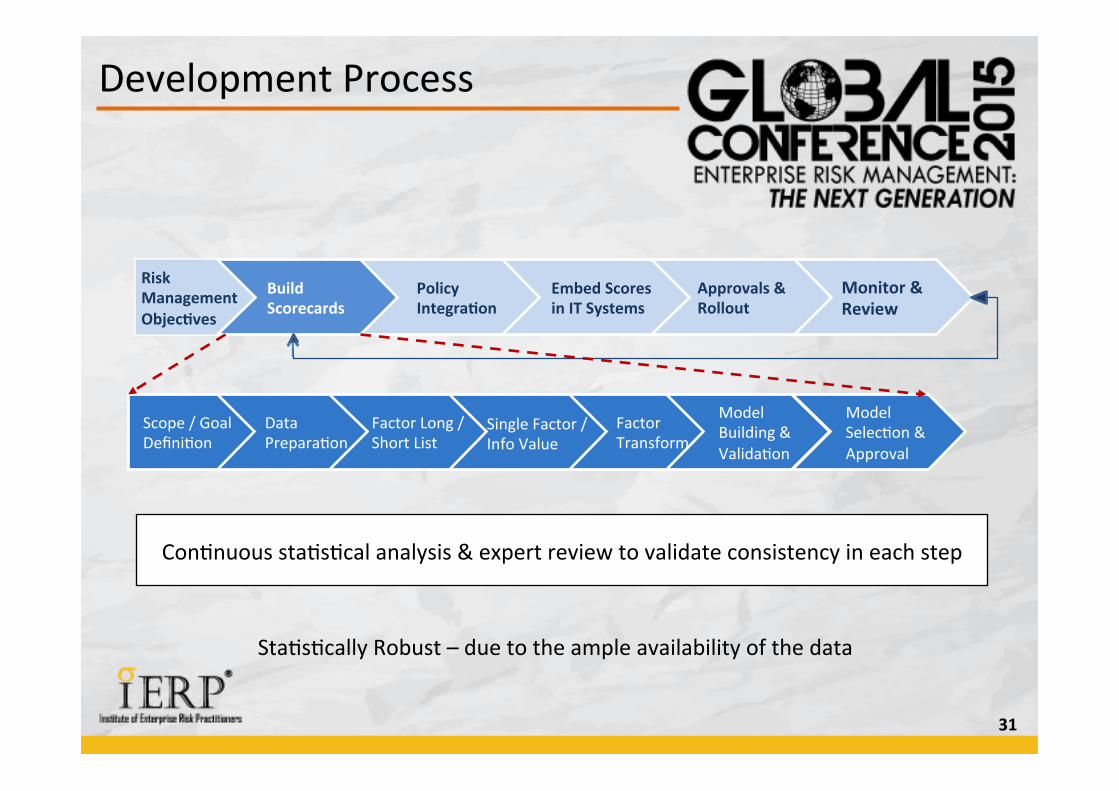
Development Process
31
Risk Management Objec>ves
Build Scorecards
Policy Integra>on
Embed Scores in IT Systems
Approvals & Rollout
Monitor & Review
Scope / Goal Defini&on
Data Prepara&on
Factor Long / Short List
Single Factor / Info Value
Factor Transform
Model Selec&on & Approval
Model Building & Valida&on
Con&nuous sta&s&cal analysis & expert review to validate consistency in each step
Sta&s&cally Robust – due to the ample availability of the data
32
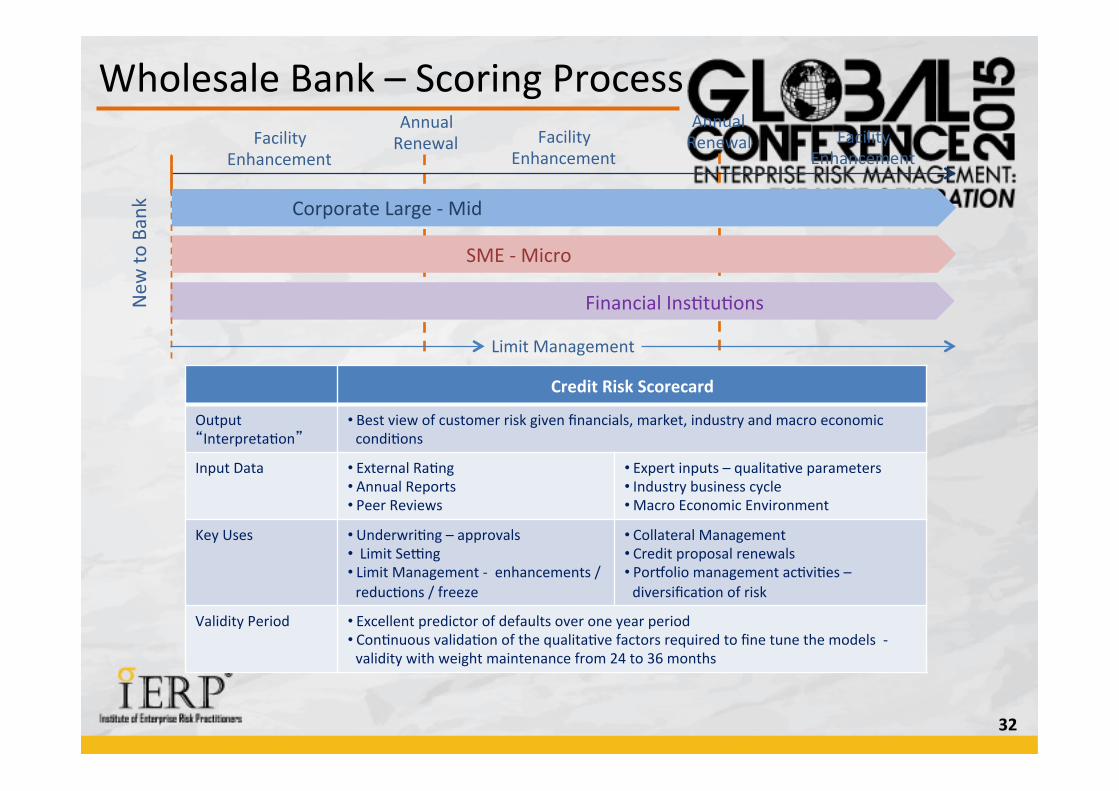
Credit Risk Scorecard
Output “Interpreta&on”
• Best view of customer risk given financials, market, industry and macro economic condi&ons
Input Data • External Ra&ng • Annual Reports • Peer Reviews
• Expert inputs – qualita&ve parameters • Industry business cycle • Macro Economic Environment
Key Uses • Underwri&ng – approvals • Limit Seeng • Limit Management -‐ enhancements / reduc&ons / freeze
• Collateral Management • Credit proposal renewals • PorJolio management ac&vi&es – diversifica&on of risk
Validity Period • Excellent predictor of defaults over one year period • Con&nuous valida&on of the qualita&ve factors required to fine tune the models -‐ validity with weight maintenance from 24 to 36 months
New
to Bank
Annual Renewal
Corporate Large -‐ Mid
SME -‐ Micro
Financial Ins&tu&ons
Facility Enhancement
Facility Enhancement
Facility Enhancement
Annual Renewal
Limit Management
Wholesale Bank – Scoring Process
33
Tracking Analy&cs
34
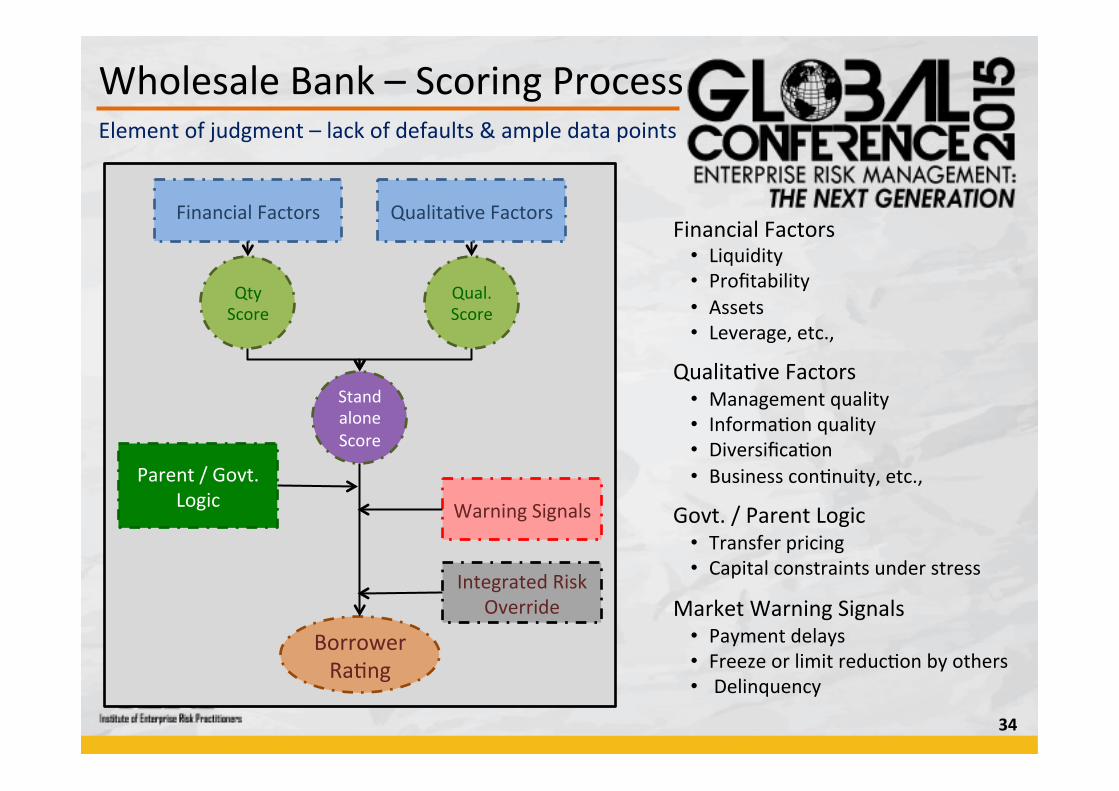
Financial Factors Qualita&ve Factors
Warning Signals
Qty Score
Qual. Score
Standalone Score
Integrated Risk Override
Borrower Ra&ng
Parent / Govt. Logic
Financial Factors • Liquidity • Profitability • Assets • Leverage, etc.,
Qualita&ve Factors • Management quality • Informa&on quality • Diversifica&on • Business con&nuity, etc.,
Govt. / Parent Logic • Transfer pricing • Capital constraints under stress
Market Warning Signals • Payment delays • Freeze or limit reduc&on by others • Delinquency
Element of judgment – lack of defaults & ample data points
Wholesale Bank – Scoring Process
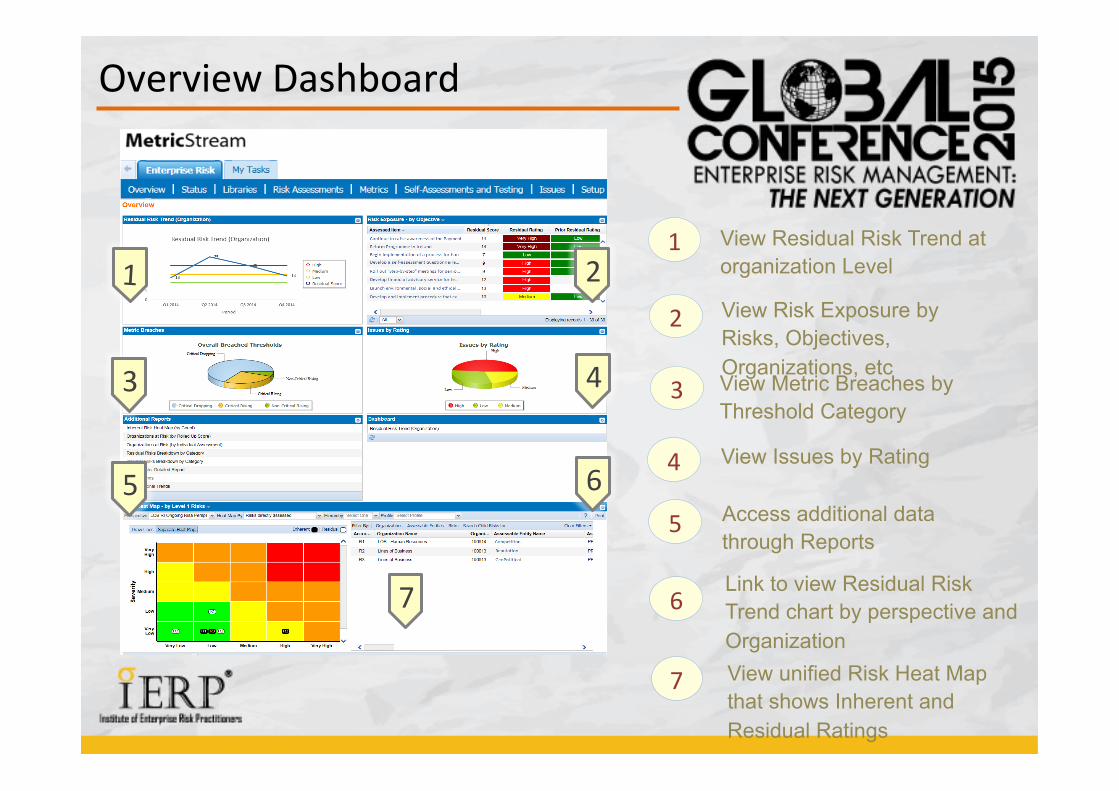
Overview Dashboard
1 2
3 4
5
1 View Residual Risk Trend at organization Level
2 View Risk Exposure by Risks, Objectives, Organizations, etc
3
4
View Metric Breaches by Threshold Category
5
View Issues by Rating
6
Access additional data through Reports
6
7 Link to view Residual Risk Trend chart by perspective and Organization
7 View unified Risk Heat Map that shows Inherent and Residual Ratings
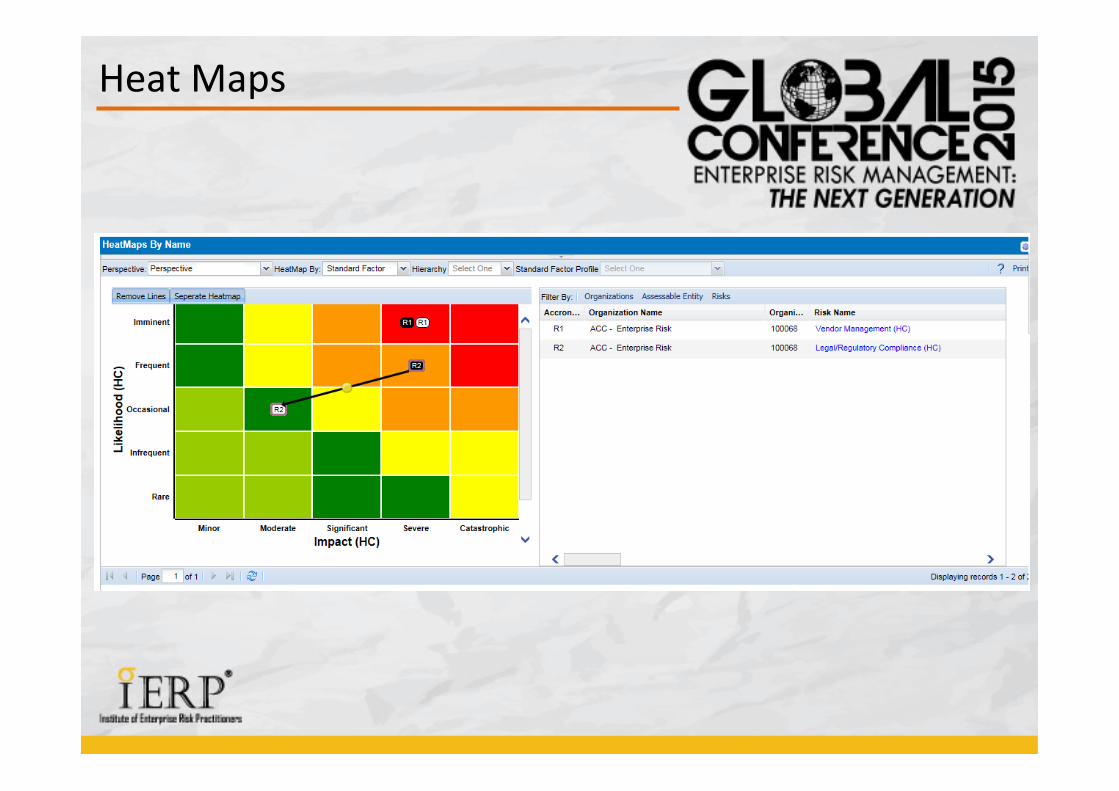
Heat Maps
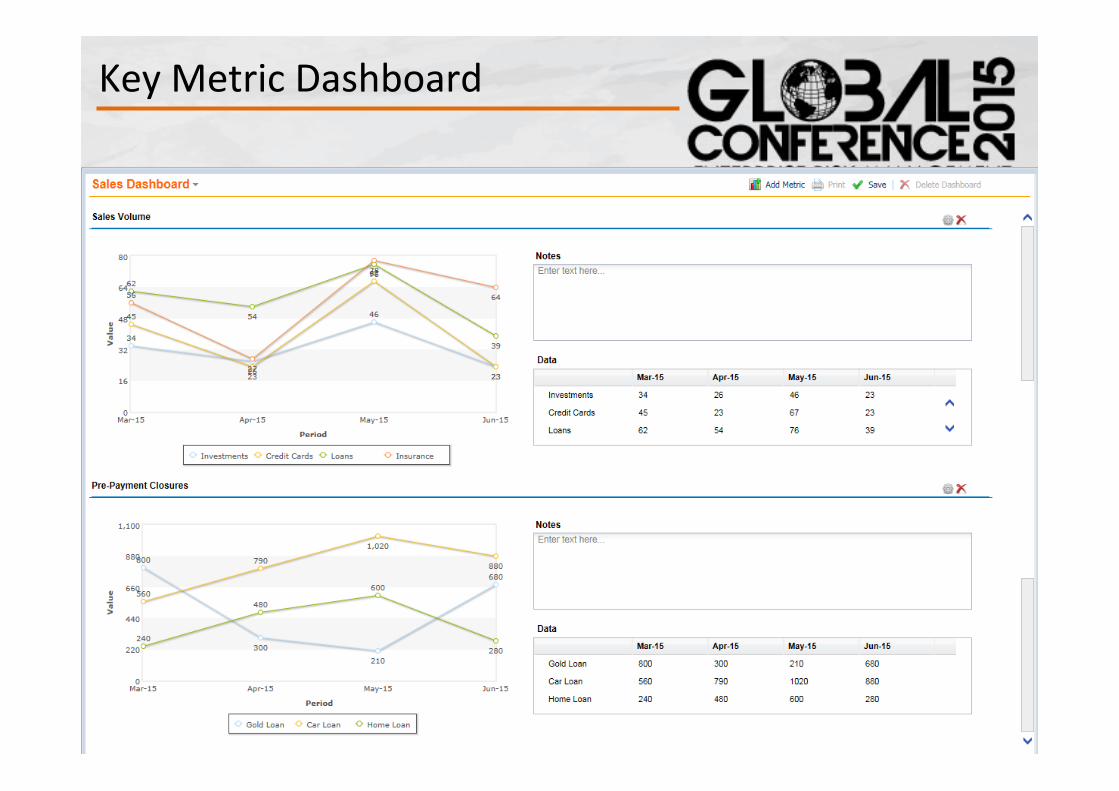
Key Metric Dashboard
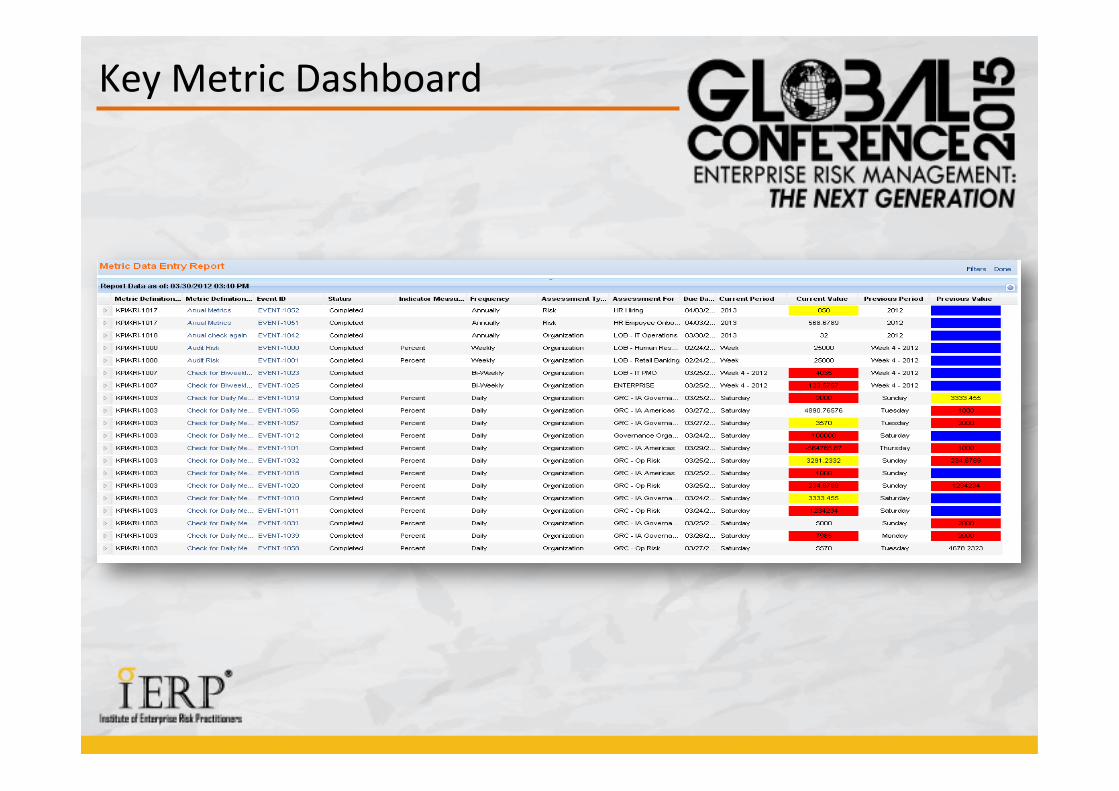
Key Metric Dashboard
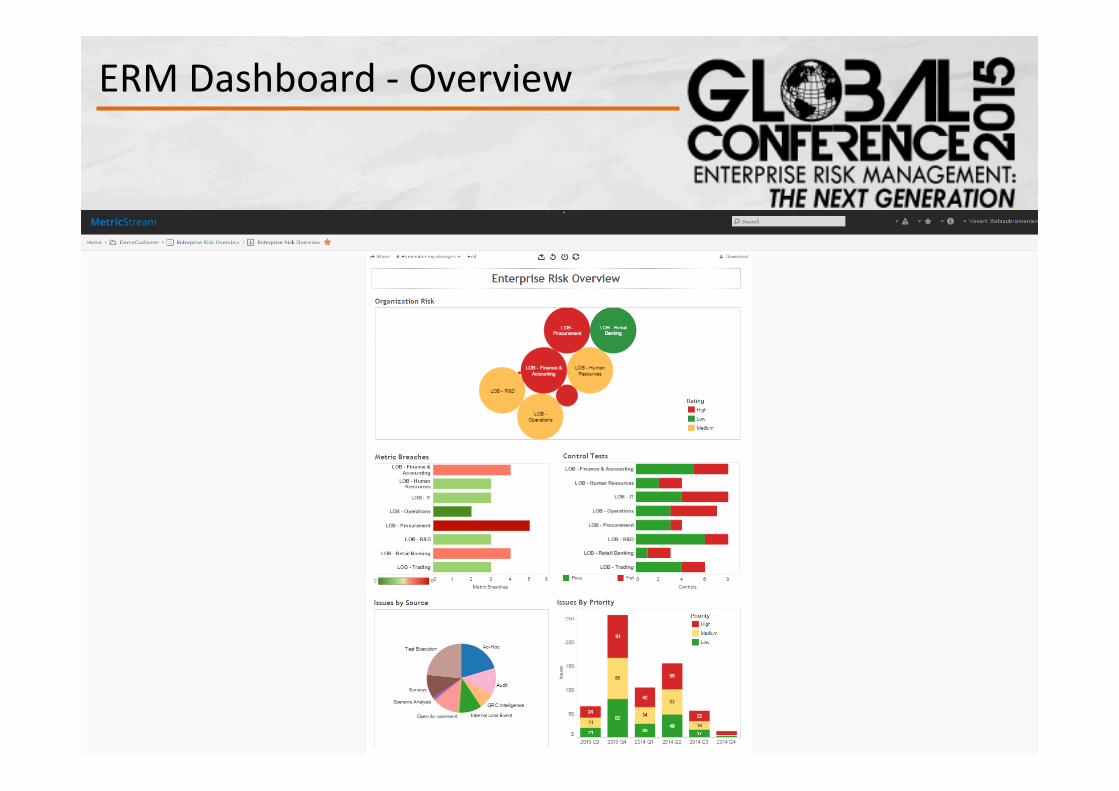
ERM Dashboard -‐ Overview
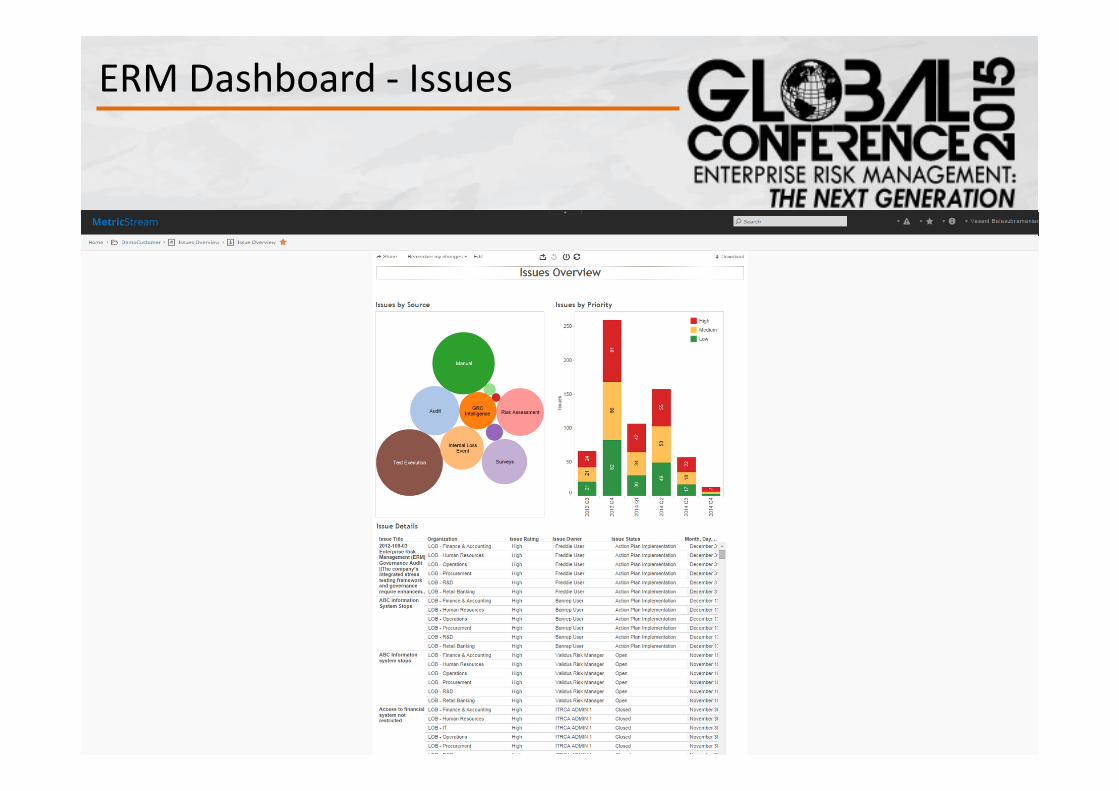
ERM Dashboard -‐ Issues
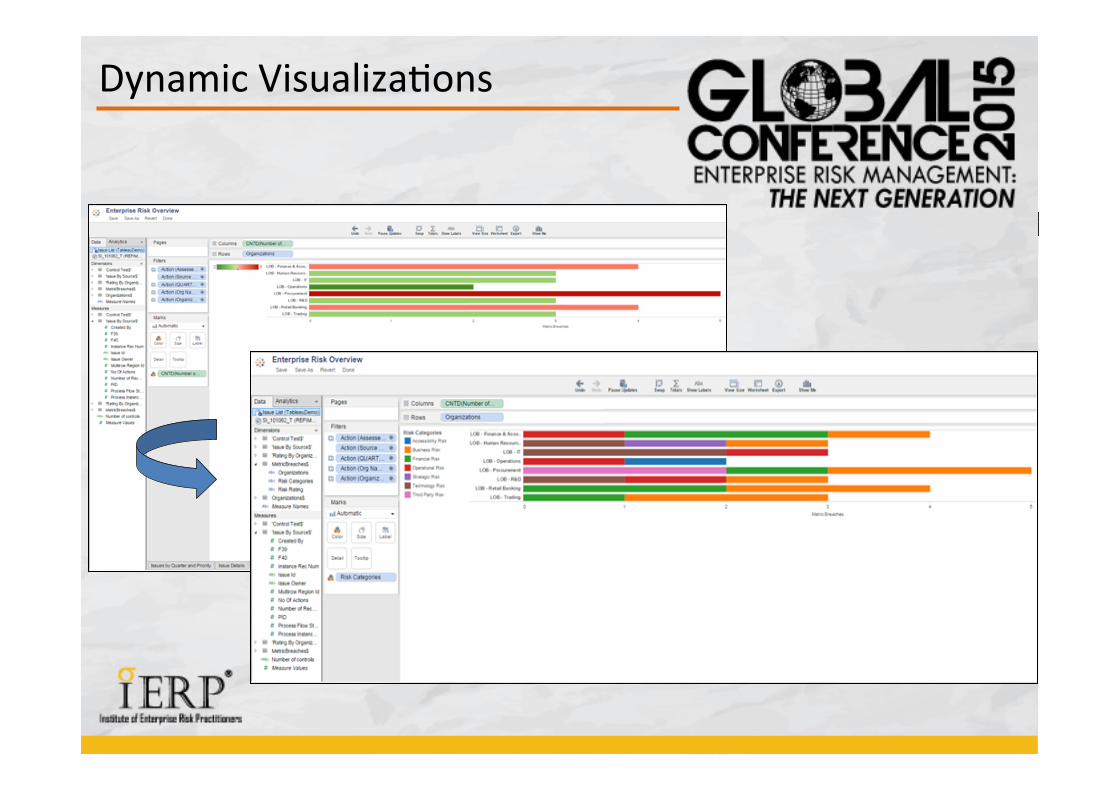
Dynamic Visualiza&ons
Dynamic Visualiza&ons
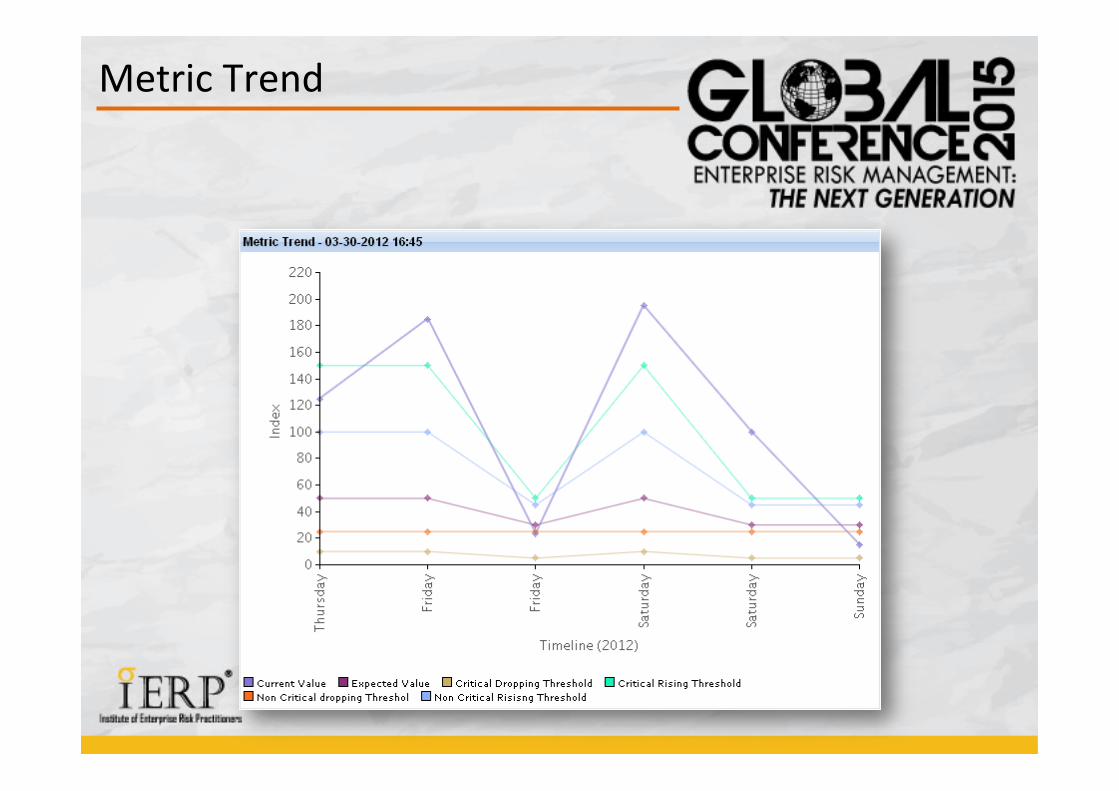
Metric Trend
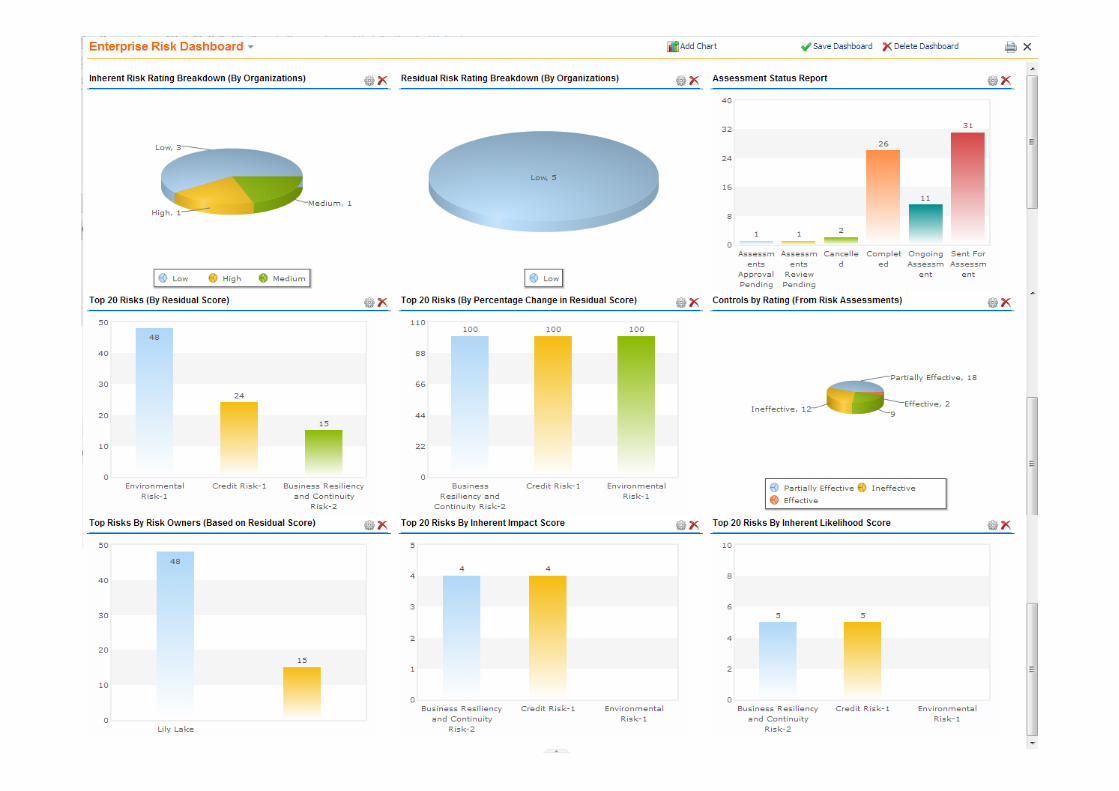
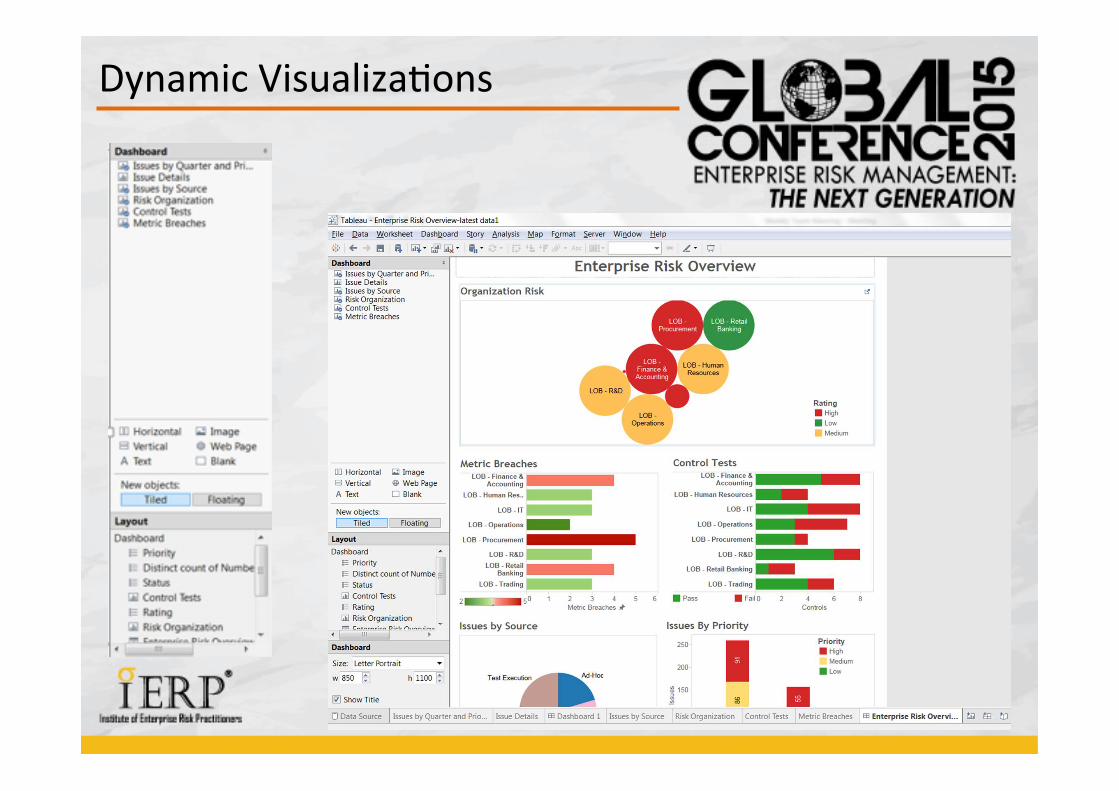
Dynamic Visualiza&ons
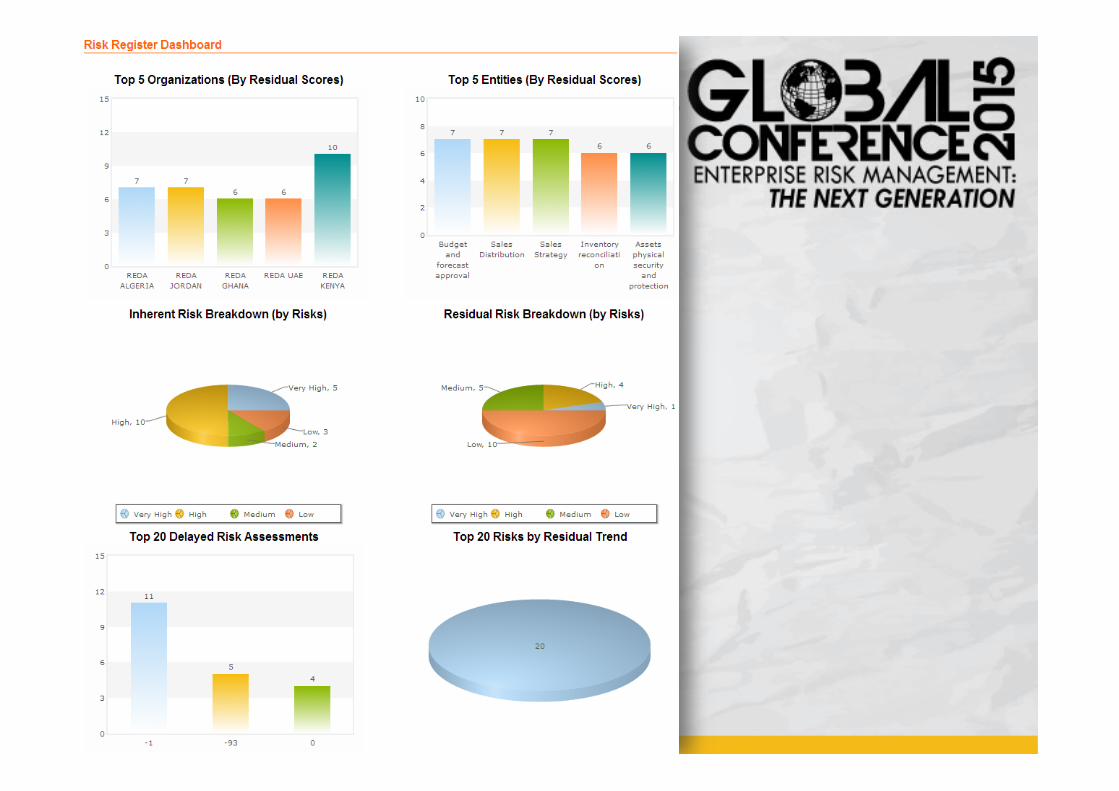
Dynamic Visualiza&ons
Benefits & Value Adds
46
Ø Enables Regulatory compliance in terms of iden&fica&on, measurement, mi&ga&on and management of risk
Ø Brining in process efficiencies, improved SLA and turn around &mes Ø Targeted ac&ons – in acquisi&ons or marke&ng promo&ons or risk mi&ga&on
ac&vi&es Ø Ability to make more accurate provisions to safe guard the capital Ø Improvement in overall quality of customers – resul&ng in lower cost of credit and
higher margins net of risk Ø Enables differen&a&on – whom to target, which customers, what products, pricing,
limits etc Ø Speed to market and ability to calibrate products and offerings in a nimble way Ø More transparent decision – to stakeholders, customers and staff Ø Predic&ve forward looking analy&c solu&ons enable management from taking
Reac&ve to a Proac&ve decision