Embed Size (px)
Citation preview

Abstract—This paper describes an analog signal processing
technique, for the development of a novel electronic circuit to be embedded in a photodiode sensor, as an integrated circuit board for electronic signal processing, to detect the energy centre of an optical signal, which represents the most accurate position measurement from a light emitter source mounted on a structure (like buildings, bridges, and mines). The Optical Scanning Sensor for (SHM) Structural Health Monitoring is proposed due to the fact that the signal processing stage is embedded in the sensor and does not require additional software processing, reducing the time and memory spacing requirements for information recording. The theoretical principle of operation, technological and experimental aspects of design, development and validation are presented.
Index Terms—Centroid, Energy signal centre, Estimation error, Light source, Optical scanning, Optical signal detection, Optical signal processing, Peak detection, SHM, SVMR.
I. INTRODUCTION
tructures experience through its time of service deterioration and damage due to environmental conditions
and excessive load conditions such as humidity, corrosion, earthquakes, gust waves, and traffic, among others. This results in structures deformation, cracking, dislocation and even collapses. Structures play in important role in safety and economy. Thus, the increasing demand for safest and functional structures has driven the SHM research of data acquisition and its analysis to obtain indicators of the structure health. Nowadays, there are SHM systems with sensors based on several technologies like optical fiber, video cameras, and optical scanner sensors. Each of them with their advantages and disadvantages regarding the type of structure and the variables to monitor and analyze according to the kind of potential damage that could suffer and is intended to prevent.
Manuscript received July 16, 2013. This work was supported by the
Engineering Institute of Autonomous University of Baja California, Mexicali, Baja California, Mexico.
W. Flores-Fuentes, M. Rivas-Lopez, O. Sergiyenko, J. Rivera-Castillo, D.
Hernandez-Balbuena are with the Engineering Institute of Autonomous University of Baja California, Mexicali, Baja California, Mexico. (phone: 011-52-686-566-4150; fax: 011-52-686-565-4431; e-mail: [email protected], [email protected], [email protected], [email protected], [email protected]
This work introduces a position measurement method based on an optical scanning sensor that is composed of a light emitter source mounted on a structure, and an optical scanning aperture. This deviates the light beam through a lens to a photodiode to convert it into a voltage output signal. Such output signal is electronically processed to detect the light energy centre which represents its most accurate position measurement to finally determine if any displacement has occurred [1]. The energy signal centre concept has been used before in different applications with signals from various types of transducers and numerous mathematical methods have been developed to post process it [2] - [14]. Some of these mathematical methods have been evaluated for optical scanning sensing; some of them are the Geometric Centroid, Power Spectrum Centroid and Peak Detection, but all of them require digital signal post processing time and memory storage [15]-[21]. Instead of a digital signal post processing, a real time electronic signal processing is developed embedded in the photodiode sensor.
II. THEORETICAL PRINCIPLE OF OPERATION
The light scanning sensor presented for SHM is a position measurement system. It is composed of a light emitter source installed on the structure under monitoring and an optical scanning aperture that is scanning the structure in search of the light emitter source to determine if it suffered a displacement.
A. Position Indicator
A light emitter source is used as a position indicator mounted on the structure under monitoring; it could be a coherent light emitter source such as a laser or an incoherent light source such as a bulb like the ones used in vehicles. Assuming that for any light emitter source there is only one energy centre that represents its punctual position.
B. Optical Scanning Aperture
The rotating optical aperture is designed as a 45° sloping mirror surface on a cylindrical rod for light beam deviation to a double convex lens with an interference filter and a
Analog Signal Processing in Light Scanning Sensors for Structural Health Monitoring
Accuracy Enhancement
W. Flores-Fuentes, M. Rivas-Lopez, O. Sergiyenko, J. Rivera-Castillo, and D. Hernandez-Balbuena
S
Proceedings of the World Congress on Engineering and Computer Science 2013 Vol II WCECS 2013, 23-25 October, 2013, San Francisco, USA
ISBN: 978-988-19253-1-2 ISSN: 2078-0958 (Print); ISSN: 2078-0966 (Online)
WCECS 2013
photodiode. While the cylindrical rod mounted, on a dc electrical motor shaft, is rotating, an electronic signal is generated. Fig. 1 illustrates a diagram with the main elements of the optical scanning aperture. When the mirror starts to spin, the sensor “s” is synchronized as the origin generates a pulse that indicates the 0° position and the starting of a cycle of 360° that finishes immediately before the “s” sensor generates the next beginning pulse. These pulses are used to calculate the scanning frequency and the zero reference to measure the angle where the light emitter source is found [22], [23].
Fig 2 shows a signal timing diagram that exemplifies the starting pulse and the optoelectronic signal relation to calculate the light emitter energy signal centre position as described in the equations below. The interval T2π is equal to the time between m1 and m1 as in (1), that are expressed by the code I2π as defined in (2).
(1)
(2)
The time tα is equal to the interval between m1 and m2, could be expressed by the code ∝as defined in (3). And finally the angle under measurement is calculated by (4) [24]. ∝ ∝ (3)
∝= ∝ ∝ ∝
∝ ∝2 (4)
Where:
is the interval of one cycle, from m1 to m1 ωistheangularspeedisthescanningfrequency cyclesinasecond . istheintervalcodeofonecycle,from m1 to m1 ∝ is the interval code from starting cycle to energy signal
centre ∝ is the interval from starting signal to energy signal centre,
from m1 to m2
C. The Energy Signal Centre
The optoelectronic signal generated is a Gaussian-like shape. The photodiode converts the light input to voltage while the mirror is rotating. This is mainly observed at long distance, at near distance the light emitter source looks like a punctual source, but at distance the source expands its radius as a cone-like or an even more complex shape depending on the properties of the medium through which the light is travelling. To reduce errors in position measurements, the best solution is taking the measurement in the energy centre of the optoelectronic signal.
Some digital methods for energy signal centre detection are: 1) Geometric Centroid and Power Spectrum Centroid, 2) Peak Detection and our proposed and 3) Electronic Circuit method is called “Saturation and Integration” [15]. In Fig 4 a graphical representation of each method is observed. Centroid calculation and peak calculations give excellent results when the optoelectronic signal is almost a perfect Gaussian-like shape. But most of the times are observed that the optoelectronic signals are asymmetrical with different shapes in function of the scanning frequency, light emitter source distance to optical scanning aperture, the ∝ length (interval from starting signal to energy signal centre) and the light emitter source tilt over the surface, due to motor eccentricity at low speed scanning, light emitter montage and other optical phenomena such as reflection, diffraction, absorption and refraction, as shown in Fig 5. The luminous flux loss (energy loss) due to these phenomena could results in signals with asymmetrical shape (signals with more than one peak, with peak displaced, or even more strange shapes, etc) instead of a symmetric Gaussian-like shape. Although it looks like two functions it is not a piecewise function, it still is just one continuous function, as it clear evident from our experimental screenshots at Fig. 5. As consequence, when the signal is asymmetrical the results tend to the highest light density side, and the electronic circuit “Saturation and Integration” method is not affected by the signal deformation, due once the optoelectronic signal reaches the level reference voltage reference level the measurement is performed at its half time interval.
Fig 1. Optical scanning aperture
Fig 2. Optical Scanning Aperture Timing Diagram
Proceedings of the World Congress on Engineering and Computer Science 2013 Vol II WCECS 2013, 23-25 October, 2013, San Francisco, USA
ISBN: 978-988-19253-1-2 ISSN: 2078-0958 (Print); ISSN: 2078-0966 (Online)
WCECS 2013

1) Geometric Centroid and Power Spectrum Centroid These methods make a correlation between the energy signal centre with "the centre of mass" of the light incident in the surface of the optical scanner mirror. The Geometric Centroid for continuous 1-D light intensity distribution is given by (5) where f(x) is the irradiance distribution at the position x on the1-D light intensity distribution (a voltage function of the signal shape generated by the scanner).
(5)
The Power Spectrum Centroid is calculated by (6) after processing the signal through Fourier Transformation to obtain the Power Spectrum which represents the signal energy by frequency to posterior correlate the power spectrum centroid calculated in the frequency domain to the corresponding centroid in time domain where SC is the power spectrum centroid in frequency (Hertz), is the magnitude
corresponding to frequency bin , k is the frequency bin (fs/N) in hertz and fs is the frequency sample, and N is the length of the Fourier transformation series [25], [26].
∑ ∗
∑ (6)
2) Peak Detection
Peak Signal Algorithms are simple statistic algorithms for non-normally distributed data series to find the peak signal through threshold criteria. The algorithms which identify peaks in a given normally distributed time-series are selected to be applied in a power distribution data, whose peaks indicate high demands, and the highest corresponds to the energy centre. Each different algorithm is based on specific formalization of the notion of a peak according to the characteristics of the optical signal, as (7) for this kind of optoelectronic signals.
, , , ⋯ ⋯
(7)
Where T is an optoelectronic signal containing N values. xi be a given ith point in T. k> 0 is a given integer of k temporal neighbours of xi (around the ith point), and S be a given peak function, S(i, xi, T) with ith element xi of the given time-series T. A given point xi in T is a peak if S(i, xi, T) > , where is a user-specified (or suitably calculated) threshold value.
3) Electronic Circuit “Saturation and Integration”
In this method the optoelectronic signal is processed by means of an electronic circuit. The signal captured by the photodiode is processed through a circuit. It sets a threshold to the optoelectronic signal produced by the light emitter spot to measure the time it reaches the threshold and calculates its half time interval, which corresponds to the energy signal centre. In base of this previous analysis we assume there is only one energy centre in a light source representing the position under monitoring. This approaches comes from the analysis of signal energy centre thru several methods just mentioned, where we could find that even when the optoelectronic signal could have more than one peak on the signal (light emitter source energy peaks), it could be found the energy signal centre by the centroid calculation on both time and frequency domains by geometric centroid and power spectrum centroid calculation respectively. However although the power spectrum centroid and the geometric centroid results well coincides in our experiments, it has been detected that when the signal is affected by noise in any of its sides it affects the centroid position displacing it to the respective side with noise. And the improvement has been developed, in the proposed method to saturate the signal and establish a threshold from which noise is left out to calculate its half time interval, which correspond to the energy signal centre concept we are looking for to correlate with the position under monitoring.
Fig 4. Optoelectronic energy signal centre detection methods
Fig 5. Optoelectronic Signals
Proceedings of the World Congress on Engineering and Computer Science 2013 Vol II WCECS 2013, 23-25 October, 2013, San Francisco, USA
ISBN: 978-988-19253-1-2 ISSN: 2078-0958 (Print); ISSN: 2078-0966 (Online)
WCECS 2013
III. TECHNOLOGICAL AND EXPERIMENTAL DESIGN
A. Measurement
The procedure below describes the steps to get the energy signal centre through the electronic circuit “Saturation and Integration” method:
1) Level detector
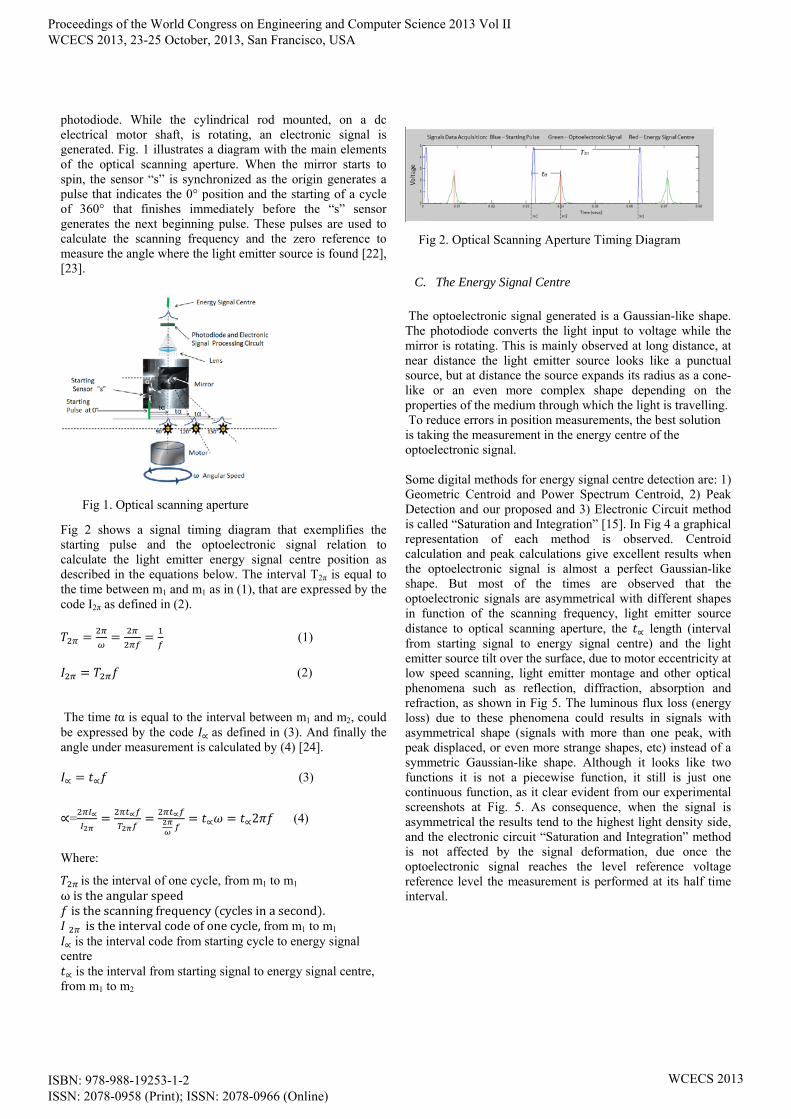
A JFET operational amplifier is used as a voltage level detector to convert the optoelectronic Gaussian-like signal to an square signal, when the optoelectronic signal is lower than the reference voltage the JFET gets down to the negative saturation voltage, and when the optoelectronic signal reaches the voltage reference the JFET gets up to the positive saturation voltage obtaining a signal as shown on Fig 6.
2) Integrator A JFET operational amplifier is used as an integrator to convert the square signal to a ramp signal to make the energy signal centre cross the zero reference as shown on Fig 7.
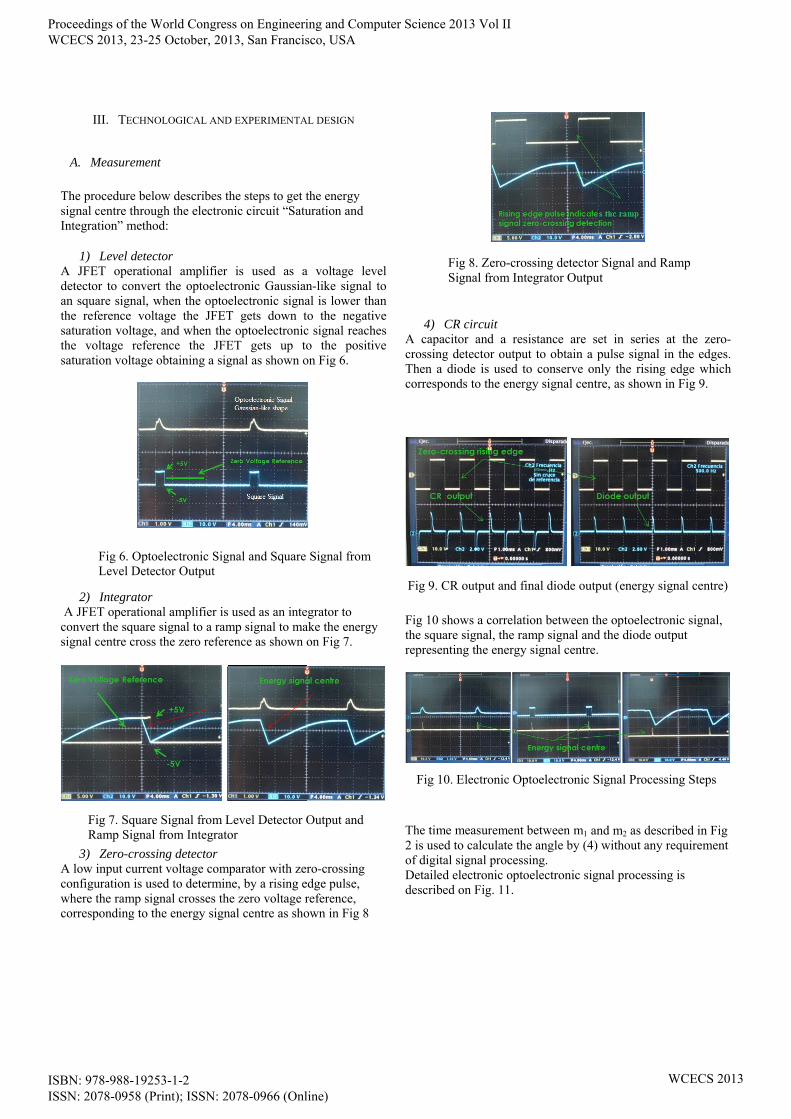
3) Zero-crossing detector A low input current voltage comparator with zero-crossing configuration is used to determine, by a rising edge pulse, where the ramp signal crosses the zero voltage reference, corresponding to the energy signal centre as shown in Fig 8
4) CR circuit A capacitor and a resistance are set in series at the zero-crossing detector output to obtain a pulse signal in the edges. Then a diode is used to conserve only the rising edge which corresponds to the energy signal centre, as shown in Fig 9.
Fig 10 shows a correlation between the optoelectronic signal, the square signal, the ramp signal and the diode output representing the energy signal centre.
The time measurement between m1 and m2 as described in Fig 2 is used to calculate the angle by (4) without any requirement of digital signal processing. Detailed electronic optoelectronic signal processing is described on Fig. 11.
Fig 6. Optoelectronic Signal and Square Signal from Level Detector Output
Fig 7. Square Signal from Level Detector Output and Ramp Signal from Integrator
Fig 8. Zero-crossing detector Signal and Ramp Signal from Integrator Output
Fig 9. CR output and final diode output (energy signal centre)
Fig 10. Electronic Optoelectronic Signal Processing Steps
Proceedings of the World Congress on Engineering and Computer Science 2013 Vol II WCECS 2013, 23-25 October, 2013, San Francisco, USA
ISBN: 978-988-19253-1-2 ISSN: 2078-0958 (Print); ISSN: 2078-0966 (Online)
WCECS 2013

B. Measurement Correction
During experimentation it was seen that the optoelectronic Gaussian-like shape signal experiences some deformation due to some internal and external error sources, , as shown in Fig.5. It is necessary to recognize that each set of measurements could be affected by different error sources generated due to environmental conditions or even errors due to the mechanism by itself. Hence, systematic and random errors do not follow a linear function, since their behavior is by the position -i.e. angle and distance, scanning frequency. For this reason, a digital rectification by a linear function is not suitable to the task at hand. Therefore, in this work it is used error approximation functions to perform the digital rectification by using a well know machine learning regression model, the Support Vector Machine (SVM). It is an intelligent algorithm to be trained with historical system behavior aimed to provide error predictions into the correction process at each measurement. The measurement correction to minimize random and systematic error is performed by (8) by way of a (SVMR) Support Vector Machine Regression to predict the error based on system historical behaviour [27] - [32].
(8)
Where: is the angle measurement by the system corrected.
is the angle measured by the system. is the predicted error by SVMR.
IV. DEVELOPMENT AND VALIDATION
A. Experimental Work
With the Energy Signal Centre measurements and the real value, the measurement error was calculated by (9).
| | (9)
Where: E is the measurement error, representing how far the measurement is from the real value. is the target angle. is the angle measured by the system.
Measurements were performed by scanning from 45° to 135°, each 5°, at ten different positions by angle (10 measurements were taken at each point (angle, distance)), as represented at Fig. 12. Obtaining a dataset with 1900 measurements.
All the data sets values were linear scaling to the range [-1,1] and were separated in training data set and test data set. X training regression data set was composed of 1266 objects with 3 attributes (Angle, Distance, and Frequency). Y training regression data set was composed of 1266 targets (Error measurement). X test regression data set was composed of 634 objects with 3 attributes (Angle, Distance, and Frequency). Y test regression data set predicted composed of 634 targets (Error predicted). The SVMR was performed with the radial basis function (RBF) kernel described by (10), with the following settings:
Fraction of objects outside the ‘data tube’ =[2E-6] Parameter=[2]
Epsilon (ε), with of the ‘data tube’=default value.
, 0 (10)
B. Results
Measurements show that the error distribution depends on the angle under measurement and the distance from the light emitter source to the aperture sensor.
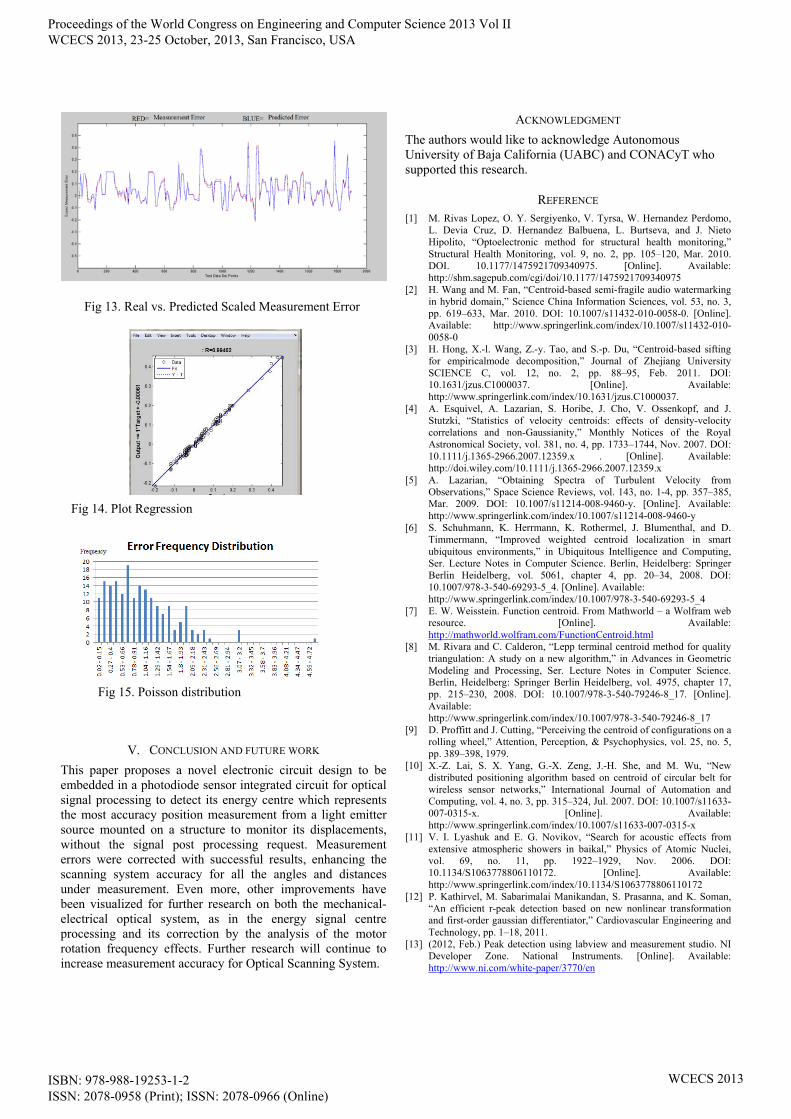
SVMR was used to predict the error with successful results as shown in Fig 13 where the red signal corresponds to the real measurement error and the blue signal corresponds to the predicted error. Linear regression is represented in Fig 14 obtaining an R SVM coefficient value of 0.99556 where data and fit results tend to the plot regression target. Finally, the angle measurement error was with a Poisson distribution as shown in Fig 15 with the probability of getting a measurement error > ±4 of 0.5% by (11), resulting in a 99.5% of probability on getting measurements with an error less than 4°
,!
(11)
Fig 11. Electronic Optoelectronic Signal Processing Prototype
Fig 12. Measurement map
Proceedings of the World Congress on Engineering and Computer Science 2013 Vol II WCECS 2013, 23-25 October, 2013, San Francisco, USA
ISBN: 978-988-19253-1-2 ISSN: 2078-0958 (Print); ISSN: 2078-0966 (Online)
WCECS 2013
V. CONCLUSION AND FUTURE WORK
This paper proposes a novel electronic circuit design to be embedded in a photodiode sensor integrated circuit for optical signal processing to detect its energy centre which represents the most accuracy position measurement from a light emitter source mounted on a structure to monitor its displacements, without the signal post processing request. Measurement errors were corrected with successful results, enhancing the scanning system accuracy for all the angles and distances under measurement. Even more, other improvements have been visualized for further research on both the mechanical-electrical optical system, as in the energy signal centre processing and its correction by the analysis of the motor rotation frequency effects. Further research will continue to increase measurement accuracy for Optical Scanning System.
ACKNOWLEDGMENT
The authors would like to acknowledge Autonomous University of Baja California (UABC) and CONACyT who supported this research.
REFERENCE [1] M. Rivas Lopez, O. Y. Sergiyenko, V. Tyrsa, W. Hernandez Perdomo,
L. Devia Cruz, D. Hernandez Balbuena, L. Burtseva, and J. Nieto Hipolito, “Optoelectronic method for structural health monitoring,” Structural Health Monitoring, vol. 9, no. 2, pp. 105–120, Mar. 2010. DOI. 10.1177/1475921709340975. [Online]. Available: http://shm.sagepub.com/cgi/doi/10.1177/1475921709340975
[2] H. Wang and M. Fan, “Centroid-based semi-fragile audio watermarking in hybrid domain,” Science China Information Sciences, vol. 53, no. 3, pp. 619–633, Mar. 2010. DOI: 10.1007/s11432-010-0058-0. [Online]. Available: http://www.springerlink.com/index/10.1007/s11432-010-0058-0
[3] H. Hong, X.-l. Wang, Z.-y. Tao, and S.-p. Du, “Centroid-based sifting for empiricalmode decomposition,” Journal of Zhejiang University SCIENCE C, vol. 12, no. 2, pp. 88–95, Feb. 2011. DOI: 10.1631/jzus.C1000037. [Online]. Available: http://www.springerlink.com/index/10.1631/jzus.C1000037.
[4] A. Esquivel, A. Lazarian, S. Horibe, J. Cho, V. Ossenkopf, and J. Stutzki, “Statistics of velocity centroids: effects of density-velocity correlations and non-Gaussianity,” Monthly Notices of the Royal Astronomical Society, vol. 381, no. 4, pp. 1733–1744, Nov. 2007. DOI: 10.1111/j.1365-2966.2007.12359.x . [Online]. Available: http://doi.wiley.com/10.1111/j.1365-2966.2007.12359.x
[5] A. Lazarian, “Obtaining Spectra of Turbulent Velocity from Observations,” Space Science Reviews, vol. 143, no. 1-4, pp. 357–385, Mar. 2009. DOI: 10.1007/s11214-008-9460-y. [Online]. Available: http://www.springerlink.com/index/10.1007/s11214-008-9460-y
[6] S. Schuhmann, K. Herrmann, K. Rothermel, J. Blumenthal, and D. Timmermann, “Improved weighted centroid localization in smart ubiquitous environments,” in Ubiquitous Intelligence and Computing, Ser. Lecture Notes in Computer Science. Berlin, Heidelberg: Springer Berlin Heidelberg, vol. 5061, chapter 4, pp. 20–34, 2008. DOI: 10.1007/978-3-540-69293-5_4. [Online]. Available: http://www.springerlink.com/index/10.1007/978-3-540-69293-5_4
[7] E. W. Weisstein. Function centroid. From Mathworld – a Wolfram web resource. [Online]. Available: http://mathworld.wolfram.com/FunctionCentroid.html
[8] M. Rivara and C. Calderon, “Lepp terminal centroid method for quality triangulation: A study on a new algorithm,” in Advances in Geometric Modeling and Processing, Ser. Lecture Notes in Computer Science. Berlin, Heidelberg: Springer Berlin Heidelberg, vol. 4975, chapter 17, pp. 215–230, 2008. DOI: 10.1007/978-3-540-79246-8_17. [Online]. Available: http://www.springerlink.com/index/10.1007/978-3-540-79246-8_17
[9] D. Proffitt and J. Cutting, “Perceiving the centroid of configurations on a rolling wheel,” Attention, Perception, & Psychophysics, vol. 25, no. 5, pp. 389–398, 1979.
[10] X.-Z. Lai, S. X. Yang, G.-X. Zeng, J.-H. She, and M. Wu, “New distributed positioning algorithm based on centroid of circular belt for wireless sensor networks,” International Journal of Automation and Computing, vol. 4, no. 3, pp. 315–324, Jul. 2007. DOI: 10.1007/s11633-007-0315-x. [Online]. Available: http://www.springerlink.com/index/10.1007/s11633-007-0315-x
[11] V. I. Lyashuk and E. G. Novikov, “Search for acoustic effects from extensive atmospheric showers in baikal,” Physics of Atomic Nuclei, vol. 69, no. 11, pp. 1922–1929, Nov. 2006. DOI: 10.1134/S1063778806110172. [Online]. Available: http://www.springerlink.com/index/10.1134/S1063778806110172
[12] P. Kathirvel, M. Sabarimalai Manikandan, S. Prasanna, and K. Soman, “An efficient r-peak detection based on new nonlinear transformation and first-order gaussian differentiator,” Cardiovascular Engineering and Technology, pp. 1–18, 2011.
[13] (2012, Feb.) Peak detection using labview and measurement studio. NI Developer Zone. National Instruments. [Online]. Available: http://www.ni.com/white-paper/3770/en
Fig 13. Real vs. Predicted Scaled Measurement Error
Fig 14. Plot Regression
Fig 15. Poisson distribution
Proceedings of the World Congress on Engineering and Computer Science 2013 Vol II WCECS 2013, 23-25 October, 2013, San Francisco, USA
ISBN: 978-988-19253-1-2 ISSN: 2078-0958 (Print); ISSN: 2078-0966 (Online)
WCECS 2013

[14] (2009, Jul.) Wavelet-based peak detection. NI Developer Zone. National Instruments. [Online]. Available:http://www.ni.com/white-paper/5432/en
[15] W. Flores Fuentes, M. Rivas Lopez, O. Sergiyenko, and J. Rivera Castillo, “Comparison of signal peak detection algorithms in the search of the signal energy center for measuring with optical scanning,” in Proc. IEEE Section Mexico, IEEE ROC&C2011:XXII autumn international conference on communications, computer, electronics, automation, robotics and industrial exposition, Guerrero, Mexico, Jan. 2011, CP10,PON15.
[16] P. Schaefer, R. Williams, G. Davis, and R. Ross, “Accuracy of position detection using a position-sensitive detector,” IEEE Transactions on Instrumentation and Measurement, vol. 47, no. 4, pp. 914–919, 1998. DOI: 10.1109/19.744642. [Online]. Available: http://ieeexplore.ieee.org/lpdocs/epic03/wrapper.htm?arnumber=744642
[17] C. Narayanan, A. Buckman, and I. Busch-Vishniac, “Position detection of multiple light beams using phase detection,” IEEE Transactions on Instrumentation and Measurement, vol. 43, no. 6, pp. 830–836, 1994. DOI: 10.1109/19.368089. [Online]. Available: http://ieeexplore.ieee.org/lpdocs/epic03/wrapper.htm?arnumber=368089.
[18] A. Rohrbach and E. H. K. Stelzer,, “Three-dimensional position detection of optically trapped dielectric particles,” Journal of Applied Physics, vol. 91, no. 8, pp. 5474–5488, 2002. DOI: 10.1063/1.1459748. [Online]. Available: http://link.aip.org/link/JAPIAU/v91/i8/p5474/s1&Agg=doi
[19] S. Suzuki, T. Yagi, Y. Kuno, and Y. Uchikawa, “A study on processing of position detection and data communication using illuminant devices and image sensor,” in Industrial Electronics Society, 2000. IECON 2000. 26th Annual Conference of the IEEE, vol. 2. IEEE, 2000, pp.936–941.
[20] F. Wells and S. Jachim, “A technique for improving the accuracy and dynamic range of beam position-detection equipment.” In Accelerator Science and Technology. IEEE, 1989, pp. 1595–1596. DOI: 10.1109/PAC.1989.72863. [Online]. Available: http://ieeexplore.ieee.org/lpdocs/epic03/wrapper.htm?arnumber=72863.
[21] W. Guanghui, P. Shum, X. Guoliang, and Z. Xuping, “Position detection improvement of position sensitive detector (PSD) by using analog and digital signal processing.” IEEE, Dec 2007, pp. 1–4. DOI: 10.1109/ICICS.2007.4449871. [Online]. Available: http://ieeexplore.ieee.org/lpdocs/epic03/wrapper.htm?arnumber=4449871
[22] (2012, Jun.) The basics of triangulation sensors. CyberOptics. [Online]. Available: http://archives.sensorsmag.com/articles/0598/tri0598/main.shtml
[23] M. Rivas Lopez, W. Flores Fuentes, J. Rivera Castillo, O. Sergiyenko, and D. Hernandez Balbuena, “A Method and Electronic Device to Detect the Optoelectronic Scanning Signal Energy Centre”. Croatia: In Tech, 2012, pp.1 - 30, (in Europe).
[24] M. Rivas, O. Sergiyenko, M. Aguirre, L. Devia, V. Tyrsa, and I. Rendon, “Spatial data acquisition by laser scanning for robot or shm task.” IEEE, Jun 2008, pp. 1458–1462. DOI: 10.1109/ISIE.2008.4676974. [Online]. Available: http://ieeexplore.ieee.org/lpdocs/epic03/wrapper.htm?arnumber=4676974
[25] A. Sekey, “Improved 1-bark bandwidth auditory filter,” The Journal of the Acoustical Society of America, vol. 75, no. 6, p. 1902, 1984. DOI: 10.1121/1.390954. [Online]. Available: http://link.aip.org/link/JASMAN/v75/i6/p1902/s1&Agg=doi
[26] T. Park, Introduction to digital signal processing: Computer musically speaking. World Scientific Publishing Company Incorporated, 2010.
[27] A. J. Smola and B. Schlkopf, “A tutorial on support vector regression,” Statist. Comput., vol. 14, pp. 199–222, 2004.
[28] J. Gascón-Moreno, E. Ortiz-García, S. Salcedo-Sanz, A. Paniagua-Tineo, B. Saavedra-Moreno, and J. Portilla-Figueras, “Multi-parametric Gaussian Kernel Function Optimization for ε-SVMr Using a Genetic Algorithm,” in Advances in Computational Intelligence, Ser. Lecture Notes in Computer Science. Berlin, Heidelberg: Springer Berlin Heidelberg, vol. 6692, chapter 15, pp. 113–120, 2011. DOI: 10.1007/978-3-642-21498-1_15. [Online]. Available: http://www.springerlink.com/index/10.1007/978-3-642-21498-1_15
[29] Z. Zhang, “Some recent progresses in network error correction coding theory.” IEEE, Jan 2008, pp. 1–5. [Online]. Available: http://ieeexplore.ieee.org/lpdocs/epic03/wrapper.htm?arnumber=4476186
[30] J. K. Choi, S. H. Park, D. J. Cho, and K. Y. Seo, “Correction error generation algorithm for differential positioning performance analysis of navigation equipment.” IEEE, Oct 2008, pp. 1099–1103. [Online]. Available: http://ieeexplore.ieee.org/lpdocs/epic03/wrapper.htm?arnumber=4694316
[31] C.-W. Hsu, C.-C. Chang, and C.-J. Lin, “A Practical Guide to Support Vector Classification” , Tech. Rep.,2003. DOI: Tech. Rep.
[32] R.P.W. Duin, P. Juszczak, P. Paclik, et al. “PRTools4: A Matlab
Toolbox for Pattern Recognition, Version 4.1”, 2007.
Proceedings of the World Congress on Engineering and Computer Science 2013 Vol II WCECS 2013, 23-25 October, 2013, San Francisco, USA
ISBN: 978-988-19253-1-2 ISSN: 2078-0958 (Print); ISSN: 2078-0966 (Online)
WCECS 2013