Embed Size (px)
Citation preview

Universidade de Aveiro
2009
Departamento de Química
Ana Rute Marques Ferreira
MODELLING THE CARBON DIOXIDE SOLUBILITY WITH CPA EOS MODELAÇÃO DA SOLUBILIDADE DO DIÓXIDO DE CARBONO COM A EQUAÇÃO DE ESTADO CUBIC PLUS ASSOCIATION

Universidade de Aveiro
2009
Departamento de Química
Ana Rute Marques Ferreira
MODELLING THE CARBON DIOXIDE SOLUBILITY WITH CPA EOS MODELAÇÃO DA SOLUBILIDADE DO DIÓXIDO DE CARBONO COM A EQUAÇÃO DE ESTADO CUBIC PLUS ASSOCIATION
Dissertação apresentada à Universidade de Aveiro para cumprimento dos requisitos necessários à obtenção do grau de Mestre em Engenharia Química, realizada sob a orientação científica do Dr. João Araújo Pereira Coutinho, Professor Associado com Agregação do Departamento de Química da Universidade de Aveiro.

ii
iii
Dedico este trabalho aos meus queridos pais e à minha manita. Sem o apoio e o esforço deles, terminar esta tese teria sido muito mais difícil. Obrigado por tudo!

iv
v
o júri
presidente Professora Doutora Maria Inês Purcell de Portugal Branco Professora auxiliar do Departamento de Química da Universidade de Aveiro
Professor Doutor João Manuel da Costa e Araújo Pereira Coutinho Professor associado com agregação do Departamento de Química da Universidade de Aveiro
Doutor António José Queimada Investigador auxiliar da Faculdade de Engenharia da Universidade do Porto

vi
vii
agradecimentos
Tenho de começar por agradecer ao meu Orientador e Professor João
Coutinho, pelo convite e pela oportunidade de poder trabalhar com estes novos solventes que tanto me fascinam, além de todo o incentivo e apoio que me foi dando ao longo do trabalho desenvolvido (“Só tu e mais umas duas ou três pessoas no mundo é que estão a fazer isto!”).
Não me posso esquecer de todos os membros do PATh: Catarina, Mi,
Ritinha, Claúdia, M. Jorge, Sónia, Juca, Mara, Ana, Samuel, Fatinha, Marise, Rui, Luciana, Bern, Liliana, Mayra, Kalpesh, mas principalmente da Mariana e do Pedro, foram quem mais e directamente me ajudaram:
Obrigado Marianita! És uma expert em CPA! Sem ti, não tinha ido muito longe! Não só pela imensa ajuda, como também por não me deixares desanimar quando os resultados não eram nada como nós gostávamos que fossem! És uma das melhores pessoas que já tive oportunidade de conhecer!
Obrigado Pedro! Por toda a tua paciência e vontade de ensinar! Foste fundamental na parte experimental deste trabalho! Davas um bom professor, sabias Chefinho?!
São um óptimo, divertido e inteligentíssimo grupo de investigação! Foi uma honra passar convosco este último ano! Muito obrigado a todos!
Obrigado Sofia, Clarinha, André, Vítor, João Tiago, Beto, Andreia, Nuno
Dineia, Daniela, Dárcio, Alicia, Caroline, Ana Sofia e Sílvio! São amigos como poucos se podem gabar de ter! Espero nunca vos perder!
Obrigado meu Joel! Sem dúvida alguma, foste e és a minha muleta!
Desculpa-me todos os maus momentos que esta tese te proporcionou e obrigado por partilhares o meu entusiasmo e os meus pequenos sucessos de modelação! Ajudaste-me muito mais do que imaginas!
E nem todos os obrigados do mundo eram capazes de quantificar a
gratidão que sinto pelos meus pais! Sem eles, tudo era impossível! Obrigado por me amarem, apoiarem, incentivarem, aturarem, sustentarem e permanecerem sempre a meu lado! Espero não vos desiludir! Amo-vos muito!
Tu Maninha linda! És especial! És a última a quem agradeço, mas és
quem está em primeiro lugar no meu coração! Obrigada por toda a loiça que lavaste e que não foi nada pouca! Desculpa por todo o meu mau humor e por tantas ser descarregado em ti! Espero que um dia consiga compensar-te! Obrigado por tudo! Gosto muito de ti! Obrigado do fundo do coração! Estou aqui, sempre que precisem!

viii
ix
palavras-chave
Dióxido de carbono, técnicas de captura de dióxido de carbono, líquidos iónicos,1-alquil-3-metilimidazólio bis(trifluorometilsulfonil)imida, equilíbrio líquido-vapor, equação de estado CPA, medições a altas pressões, dissulfureto de carbono, tetraclorometano.
resumo
As emissões de dióxido de carbono têm hoje uma grande importância na indústria de engenharia química, pelo que a sua captura e armazenamento são uma importante área de investigação. Os líquidos iónicos têm sido estudados como solventes (“green solvents”) para a separação de gases e captura de dióxido de carbono.
Os líquidos iónicos são uma nova classe de solventes orgânicos, que devido aos seus catiões orgânicos assimétricos e aos aniões inorgânicos, não podem constituir uma estrutura cristalina, permanecendo assim no estado líquido à temperatura ambiente ou temperaturas próximas desta.
Estes compostos apresentam uma vasta gama de propriedades interessantes, tais como a alta estabilidade térmica; o estado líquido numa grande amplitude térmica; a boa solvatação, tanto para compostos polares como não polares; e uma das mais interessantes, colocando-os como uma alternativa viável para substituir os solventes orgânicos voláteis, a sua pressão de vapor desprezável. Outra grande vantagem destes solventes "neotéricos" é a possibilidade de modelar as suas propriedades, através da infinita combinação de catiões e aniões, permitindo desenhar os líquidos iónicos de acordo com os objectivos específicos de uma operação particular melhorando o seu desempenho.
Já foram aplicadas várias equações de estado para descrever a solubilidade do dióxido de carbono nos líquidos iónicos (equilíbrio líquido-vapor), tais como a PC-SAFT, soft-SAFT, Peng-Robinson, Krichevsky-Kasarnovsky, entre outras equações de estado.
Neste trabalho, dados experimentais para o equilíbrio líquido-vapor do sistema de dióxido de carbono + 1-alquil-3-metilimidazólio bis(trifluorometilsulfonil)imida foram modelados pela primeira vez com a equação do estado Cubic Plus Association (CPA EoS), em que os parâmetros da equação são obtidos através do ajuste de dados experimentais de pressão de vapor e densidade. Com o objectivo de estudar a solubilidade do dióxido de carbono noutros compostos, foram também medidos os equilíbrios líquido-vapor dos sistemas dióxido de carbono + dissulfureto de carbono e dióxido de carbono + tetraclorometano, numa célula de alta pressão, e os dados experimentais obtidos foram igualmente modelados com a CPA EoS.
A equação de estado CPA já demonstrou ser uma ferramenta termodinamicamente flexível tendo descrito correctamente o equilíbrio líquido-vapor de misturas contendo componentes associativos e não associativos distribuídos por diferentes fases fluidas.
Mostra-se que este modelo permite uma boa descrição dos dados experimentais disponíveis.

x
xi
keywords
Carbon dioxide, CO2 capture tecniques, ionic liquids, 1-alkyl-3-methylimidazolium bis(trifluoromethylsulfonyl)imide, phase behavior, CPA EoS, high pressure experimental, carbon disulphide, carbon tetrachloride.
abstract
Carbon dioxide emissions have today a great importance in the
chemical engineering industry, so its capture and storage are an important field of research. Ionic liquids have been studied as green solvents in gases separation and for carbon dioxide capture.
Ionic liquids are a new class of organic solvents that due to their asymmetric organic cations and organic or inorganic anions cannot form an ordered crystal and therefore remain liquid at or near room temperature.
These compounds present a wide range of interesting properties, such as high thermal stability, large liquid temperature range, good solvation both for polar and non polar compounds, and one of the most interesting, putting them as a viable and ambient friendly alternative to replace the volatile organic solvents, is their negligible vapor pressure. Other major advantage of these “neoteric” solvents is the possibility of fine tune their properties through the endless combination of cations and anions. This designer characteristic allows one to build task-specific ionic liquids that have an enhanced performance for specific operations.
Several equations of state have been applied to describe the carbon dioxide solubility in ionic liquids (vapor-liquid equilibrium) such PC-SAFT, soft-SAFT, Peng-Robinson EoS, Krichevsky–Kasarnovsky EoS, among others.
In this work, the experimental vapour-liquid equilibrium data of the systems carbon dioxide + 1-alkyl-3-methylimidazolium bis(trifluoromethylsulfonyl) imide ionic liquids were modelled for the first time with the Cubic plus Association Equation of State (CPA EoS) with the EOS parameters fitted to vapor pressure and densities of the ionic liquids. In addition, it was used a high pressure cell to measure the vapour-liquid equilibrium of the binary systems carbon dioxide + carbon disulphide and carbon dioxide + carbon tetrachloride and the experimental data obtained were also modelled with the CPA EoS.
The CPA EoS had already demonstrated to be a flexible thermodynamic tool for correctly modelling the phase equilibrium of mixtures containing both associative and non-associative components distributed by different fluid phases.
It is shown that this model allows for a very good description of the experimental data available.

xii
xiii
CONTENTS
Contents ..................................................................................................................... xiii
List of Tables ............................................................................................................... xv
List of Figures ........................................................................................................... xvii
Nomenclature ............................................................................................................. xix
List of symbols ........................................................................................................... xix
Greek letters .............................................................................................................. xix
Superscripts................................................................................................................xx
Abbreviations ..............................................................................................................xx
1. Introduction ............................................................................................................... 1
1.1 Anthropogenic Carbon Dioxide .............................................................................. 3
1.1.1 Carbon dioxide sources and effects................................................................. 3
1.1.2 Carbon dioxide capture technologies............................................................... 5
1.2 Ionic Liquids ......................................................................................................... 11
1.3 Carbon Dioxide solubility in Ionic Liquids ............................................................. 14
2. Model ........................................................................................................................ 17
2.1 Cubic plus Association Equation of State ............................................................. 19
2.2 Results and Discussion ........................................................................................ 25
2.2.1 Compilation and selection of available data ................................................... 25
2.2.2 Correlation of the CPA pure compound parameters ...................................... 26
2.2.3 Correlation of the vapour–liquid equilibrium (VLE) ......................................... 34
3. Experimental measurements and CPA Modelling ................................................. 41
3.1 Materials .............................................................................................................. 43
3.2 Experimental Apparatus and Procedure............................................................... 43
3.3 Experimental Data ............................................................................................... 45
3.4 Experimental data modelling with CPA ................................................................ 48
3.4.1 Compilation and selection of available data ................................................... 48
3.4.2 Correlation of the CPA pure compound parameters ...................................... 48
3.4.3 Correlation of the vapour–liquid equilibrium (VLE) ......................................... 49
4. Conclusions ............................................................................................................. 53
Future work:............................................................................................................... 56
5. Bibliographic References ....................................................................................... 57
Appendix ...................................................................................................................... 65
A. Critical Properties .................................................................................................. 67
B. Vapour pressure and liquid density parameters correlation ................................... 68


xv
LIST OF TABLES Table 1 Names, abbreviations and structures of the most common cations and anions.12
Table 2 Henry’s law constants for carbon dioxide in several ionic liquids at 298 K [25]. 14
Table 3 Association schemes based on the terminology of Huang and Radosz [42]. .... 24
Table 4 Ionic liquids studied and availability of data. ..................................................... 26
Table 5 CPA pure compound parameters and modelling results for carbon dioxide. ..... 27
Table 6 CPA pure compound parameters and modelling results for [Cnmim][NTf2] series,
considering non- association. ........................................................................................ 28
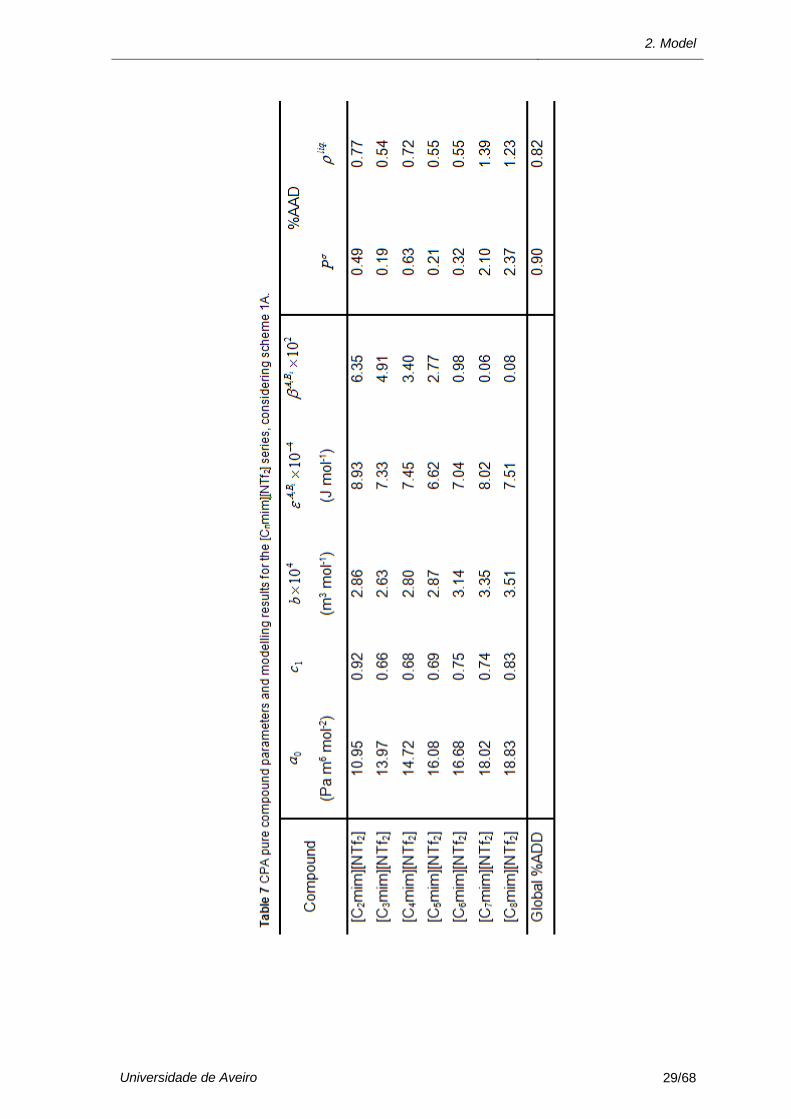
Table 7 CPA pure compound parameters and modelling results for the [Cnmim][NTf2]
series, considering scheme 1A. ..................................................................................... 29
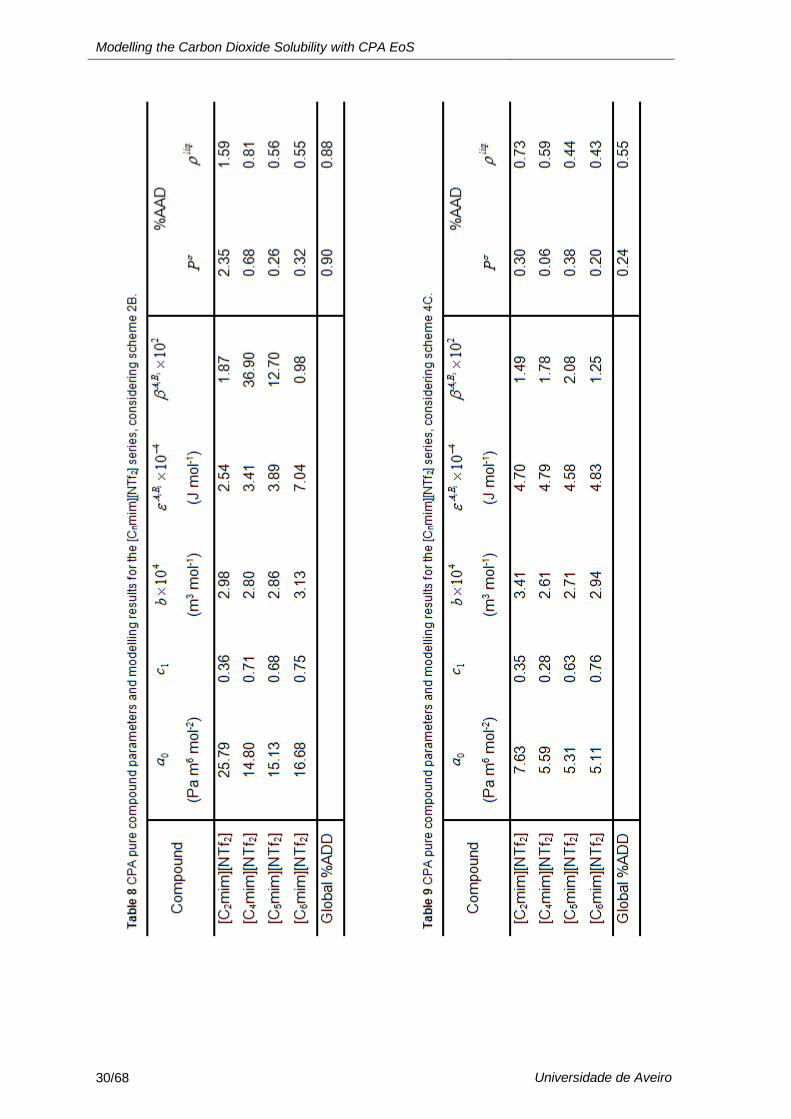
Table 8 CPA pure compound parameters and modelling results for the [Cnmim][NTf2]
series, considering scheme 2B. ..................................................................................... 30
Table 9 CPA pure compound parameters and modelling results for the [Cnmim][NTf2]
series, considering scheme 4C...................................................................................... 30
Table 10 Comparison between CPA pure compound parameters of [Cnmim][NTf2] and
other compounds depending on the association scheme considered. ........................... 34
Table 11 CPA VLE results for [C2mim][NTf2]+CO2 systems considering non-association
for 0ijk and 0ijk . .................................................................................................. 35
Table 12 CPA VLE results for [C2mim][NTf2]+CO2 systems and binary interaction
parameters considering association scheme 2B. ........................................................... 36
Table 13 CPA VLE results for [C4mim][NTf2]+CO2 systems and binary interaction
parameters considering association scheme 2B. ........................................................... 36
Table 14 CPA VLE results for [C2mim][NTf2]+CO2 and [C4mim][NTf2]+CO2 systems and
binary interaction parameters. ....................................................................................... 40
Table 15 Experimental solubility data of carbon dioxide in carbon tetrachloride (CCl4) for
different CO2 mole fractions and for 293.22, 313.26 and 333.22 K. ............................... 46
Table 16 Experimental solubility data of carbon dioxide in carbon disulphide (CS2) for
different CO2 mole fractions and for 293.27, 313.26 and 333.13 K. ............................... 46
Table 17 CPA pure compound parameters and modelling results for CO2, CS2, CCl4 and
CH4. .............................................................................................................................. 48
xvi
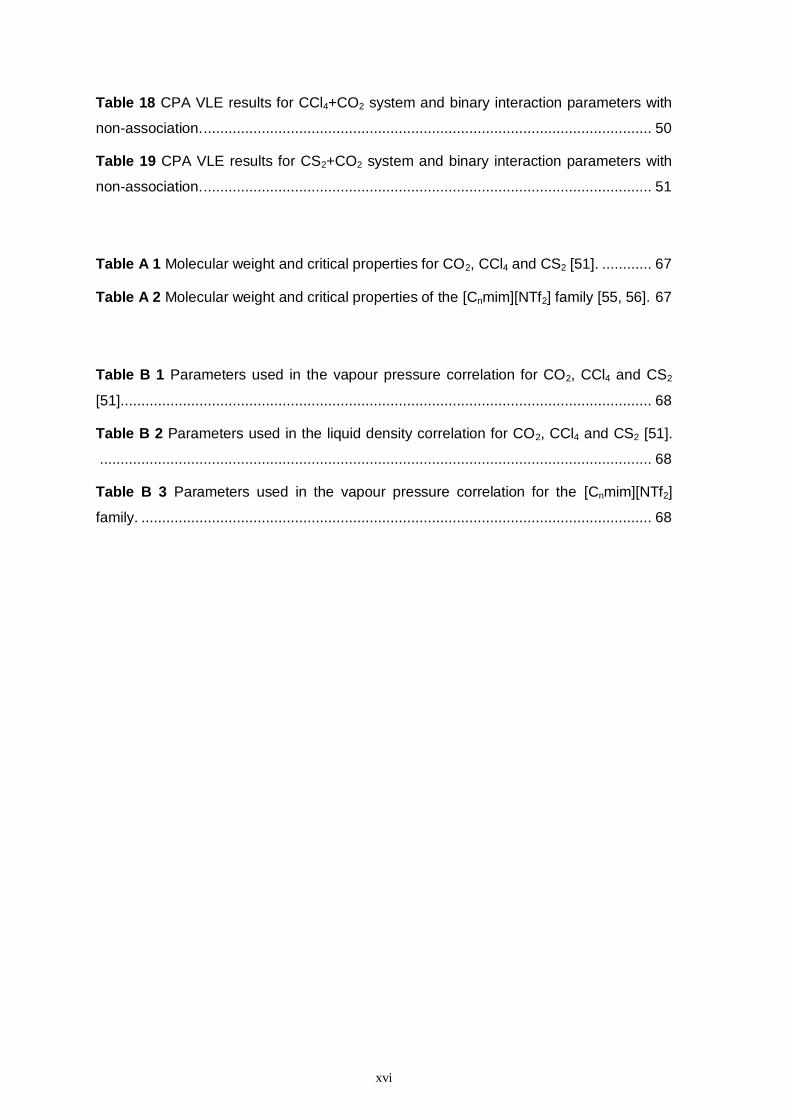
Table 18 CPA VLE results for CCl4+CO2 system and binary interaction parameters with
non-association. ............................................................................................................ 50
Table 19 CPA VLE results for CS2+CO2 system and binary interaction parameters with
non-association. ............................................................................................................ 51
Table A 1 Molecular weight and critical properties for CO2, CCl4 and CS2 [51]. ............ 67
Table A 2 Molecular weight and critical properties of the [Cnmim][NTf2] family [55, 56]. 67
Table B 1 Parameters used in the vapour pressure correlation for CO2, CCl4 and CS2
[51]. ............................................................................................................................... 68
Table B 2 Parameters used in the liquid density correlation for CO2, CCl4 and CS2 [51].
..................................................................................................................................... 68
Table B 3 Parameters used in the vapour pressure correlation for the [Cnmim][NTf2]
family. ........................................................................................................................... 68
xvii
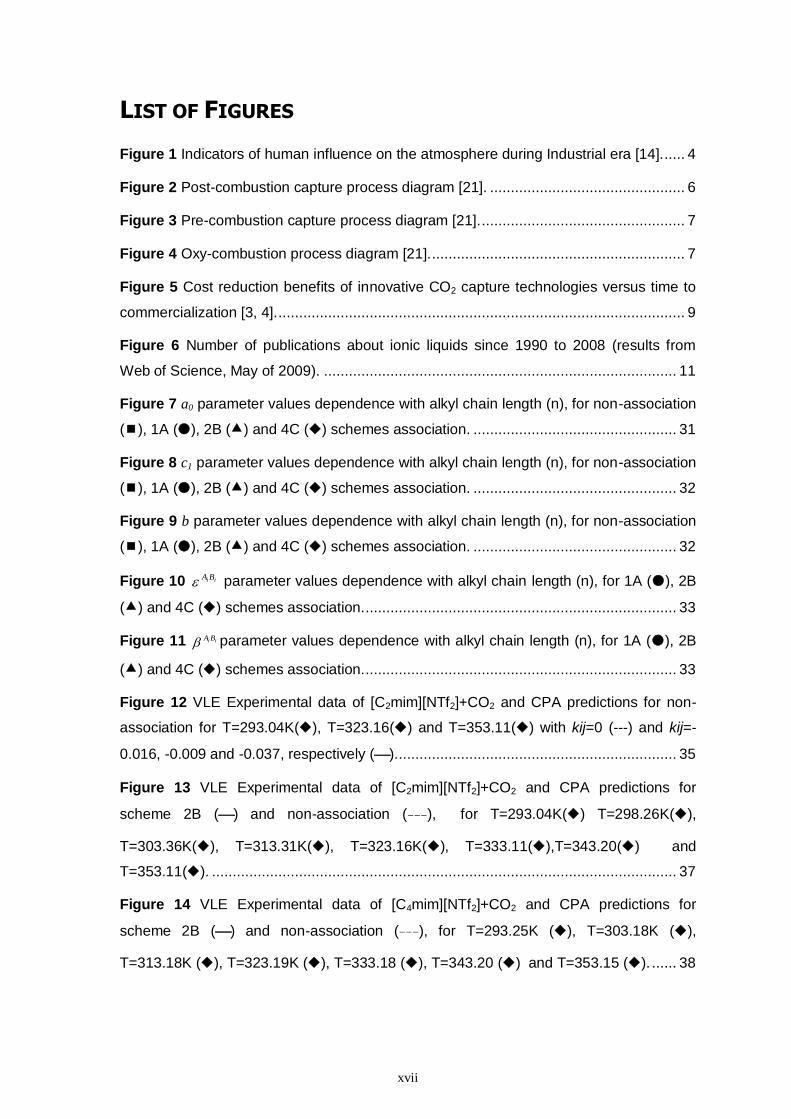
LIST OF FIGURES Figure 1 Indicators of human influence on the atmosphere during Industrial era [14]. ..... 4
Figure 2 Post-combustion capture process diagram [21]. ............................................... 6
Figure 3 Pre-combustion capture process diagram [21]. ................................................. 7
Figure 4 Oxy-combustion process diagram [21]. ............................................................. 7
Figure 5 Cost reduction benefits of innovative CO2 capture technologies versus time to
commercialization [3, 4]. .................................................................................................. 9
Figure 6 Number of publications about ionic liquids since 1990 to 2008 (results from
Web of Science, May of 2009). ..................................................................................... 11
Figure 7 a0 parameter values dependence with alkyl chain length (n), for non-association
(), 1A (), 2B () and 4C () schemes association. ................................................. 31
Figure 8 c1 parameter values dependence with alkyl chain length (n), for non-association
(), 1A (), 2B () and 4C () schemes association. ................................................. 32
Figure 9 b parameter values dependence with alkyl chain length (n), for non-association
(), 1A (), 2B () and 4C () schemes association. ................................................. 32
Figure 10 iiBA parameter values dependence with alkyl chain length (n), for 1A (), 2B
() and 4C () schemes association. ........................................................................... 33
Figure 11 iiBA parameter values dependence with alkyl chain length (n), for 1A (), 2B
() and 4C () schemes association. ........................................................................... 33
Figure 12 VLE Experimental data of [C2mim][NTf2]+CO2 and CPA predictions for non-
association for T=293.04K(), T=323.16() and T=353.11() with kij=0 (---) and kij=-
0.016, -0.009 and -0.037, respectively (). ................................................................... 35
Figure 13 VLE Experimental data of [C2mim][NTf2]+CO2 and CPA predictions for
scheme 2B () and non-association (---), for T=293.04K() T=298.26K(),
T=303.36K(), T=313.31K(), T=323.16K(), T=333.11(),T=343.20() and
T=353.11(). ................................................................................................................ 37
Figure 14 VLE Experimental data of [C4mim][NTf2]+CO2 and CPA predictions for
scheme 2B () and non-association (---), for T=293.25K (), T=303.18K (),
T=313.18K (), T=323.19K (), T=333.18 (), T=343.20 () and T=353.15 (). ...... 38
xviii
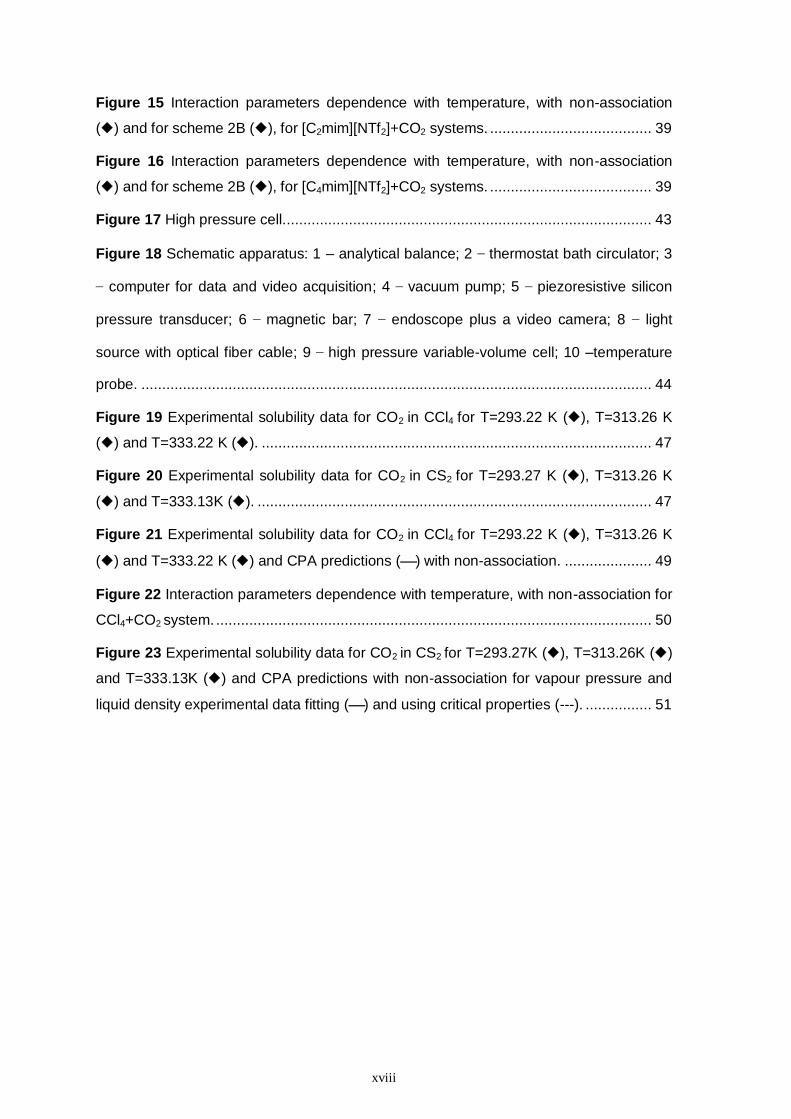
Figure 15 Interaction parameters dependence with temperature, with non-association
() and for scheme 2B (), for [C2mim][NTf2]+CO2 systems. ....................................... 39
Figure 16 Interaction parameters dependence with temperature, with non-association
() and for scheme 2B (), for [C4mim][NTf2]+CO2 systems. ....................................... 39
Figure 17 High pressure cell. ........................................................................................ 43
Figure 18 Schematic apparatus: 1 – analytical balance; 2 – thermostat bath circulator; 3
– computer for data and video acquisition; 4 – vacuum pump; 5 – piezoresistive silicon
pressure transducer; 6 – magnetic bar; 7 – endoscope plus a video camera; 8 – light
source with optical fiber cable; 9 – high pressure variable-volume cell; 10 –temperature
probe. ........................................................................................................................... 44
Figure 19 Experimental solubility data for CO2 in CCl4 for T=293.22 K (), T=313.26 K
() and T=333.22 K (). .............................................................................................. 47
Figure 20 Experimental solubility data for CO2 in CS2 for T=293.27 K (), T=313.26 K
() and T=333.13K (). ............................................................................................... 47
Figure 21 Experimental solubility data for CO2 in CCl4 for T=293.22 K (), T=313.26 K
() and T=333.22 K () and CPA predictions () with non-association. ..................... 49
Figure 22 Interaction parameters dependence with temperature, with non-association for
CCl4+CO2 system. ......................................................................................................... 50
Figure 23 Experimental solubility data for CO2 in CS2 for T=293.27K (), T=313.26K ()
and T=333.13K () and CPA predictions with non-association for vapour pressure and
liquid density experimental data fitting () and using critical properties (---). ................ 51
xix
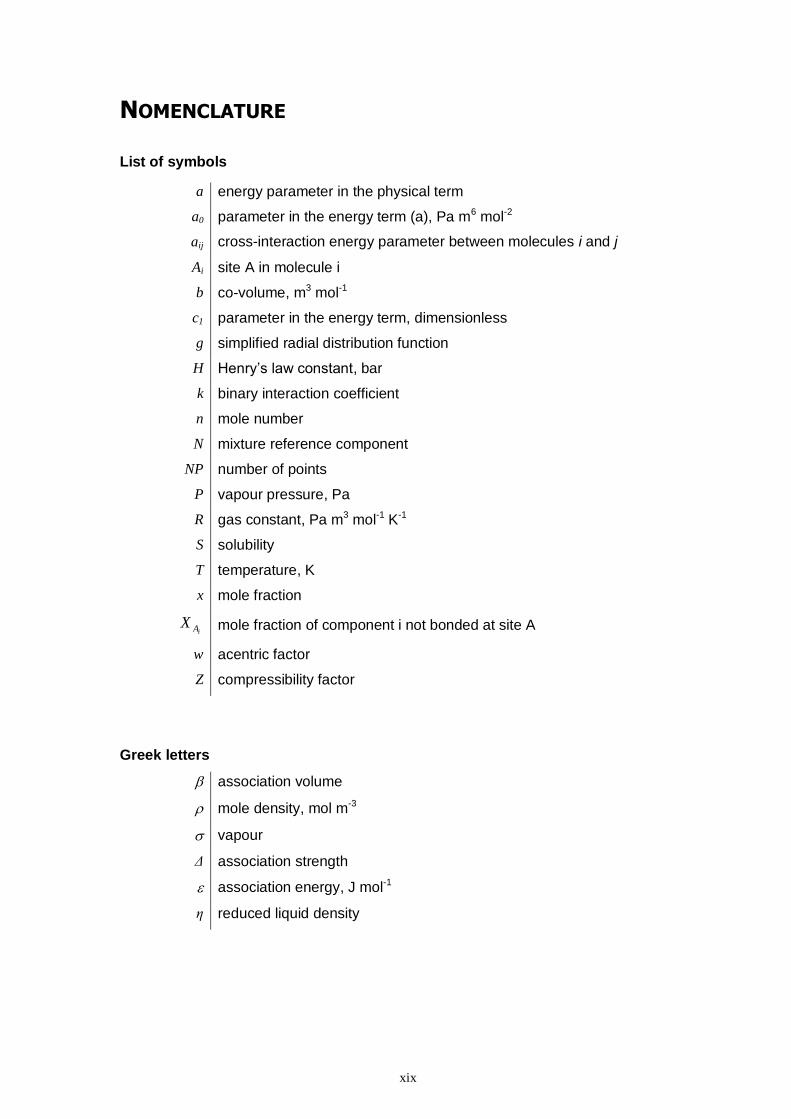
NOMENCLATURE
List of symbols
a energy parameter in the physical term
a0 parameter in the energy term (a), Pa m6 mol-2
aij cross-interaction energy parameter between molecules i and j
Ai site A in molecule i
b co-volume, m3 mol-1
c1 parameter in the energy term, dimensionless
g simplified radial distribution function
H Henry’s law constant, bar
k binary interaction coefficient
n mole number
N mixture reference component
NP number of points
P vapour pressure, Pa
R gas constant, Pa m3 mol-1 K-1
S solubility
T temperature, K
x mole fraction
iAX mole fraction of component i not bonded at site A
w acentric factor
Z compressibility factor
Greek letters
association volume
mole density, mol m-3
vapour
Δ association strength
association energy, J mol-1
η reduced liquid density

xx
Subscripts
c critical
i, j pure component indexes
liq. liquid
r reduced
Superscripts
assoc. association
phys. physical
Abbreviations
AAD average absolute deviation
COSMO-RS conductor-like screening model for real solvents
CPA cubic-plus-association equation of state
CR combining rule
DEA Diethanolamine
DIPA Diisopropanolamine
ECR Elliott combining rule
EoS equation of state
GC-EoS group contribution equation of state
Ils ionic liquids
LD length dependence
MDEA N-Methyldiethanolamine
MEA Monoethanolamine
OF objective function
PC-SAFT perturbed-chain statistical associating fluid theory
PR Peng-Robinson equation
RK-EoS Redlich-Kwong equation
SAFT statistical associating fluid theory
SRK Soave-Redlich-Kwong equation
SWCF square well chain fluid equation
tPC-SAFT truncated perturbed chain-polar statistical associating fluid theory
V Values
VLE vapour-liquid equilibrium
VOCs volatile organic compounds

1. INTRODUCTION

1. Introduction
Universidade de Aveiro 3/68
The Earth’s climate is largely a result of the physical and chemical properties of
the atmosphere [1]. With the coming of Industrial era about 150 years ago, fossil fuel
burning and forests clearing increased the atmospheric carbon dioxide levels to their
present levels and as a result the atmospheric chemistry has drastically changed with
dire consequences to the Earth’s climate [1, 2].
To mitigate anthropogenic carbon dioxide emissions and climate changes, it is
critical to develop new and more efficient technology to prevent carbon dioxide
emissions or remove it from atmosphere altogether. Studies are being done in this area,
such as the development of new industrial processes and new solvents and materials for
CO2 capture and storage [3-5].
Ionic liquids are one of the new classes of neoteric solvents in study, not only for
CO2 capture but also for many other applications in chemical process [6-9]. They are
composed by organic cations and organic or inorganic anions and their properties can be
tuned by changing the ions according to the desired properties. Their principal
characteristics are the negligible vapour pressure, which made them a probable
substitute for the organic volatile solvents, high thermal stability and being liquid in a
broad range of temperatures.
This work addresses the study of the CO2 solubility in ionic liquids and other
solvents such as CS2 and CCl4.
1.1 Anthropogenic Carbon Dioxide
1.1.1 Carbon dioxide sources and effects
Anthropogenic carbon dioxide, after water vapour, is one of the gases
responsible for the runaway greenhouse effect observed. Greenhouse effects is a
physical effect of Earth’s atmosphere [10] that consists on the trapping of the outgoing
radiation by atmospheric gases, being water vapour and carbon dioxide the main
contributors, in addition to others such methane, nitrous oxide, chlorofluorocarbons, etc.,
due to their great absorption capacity [11, 12]. These greenhouse gases are the
responsible for the increase in the global temperature [10, 11].
Modelling the Carbon Dioxide Solubility with CPA EoS
4/68 Universidade de Aveiro
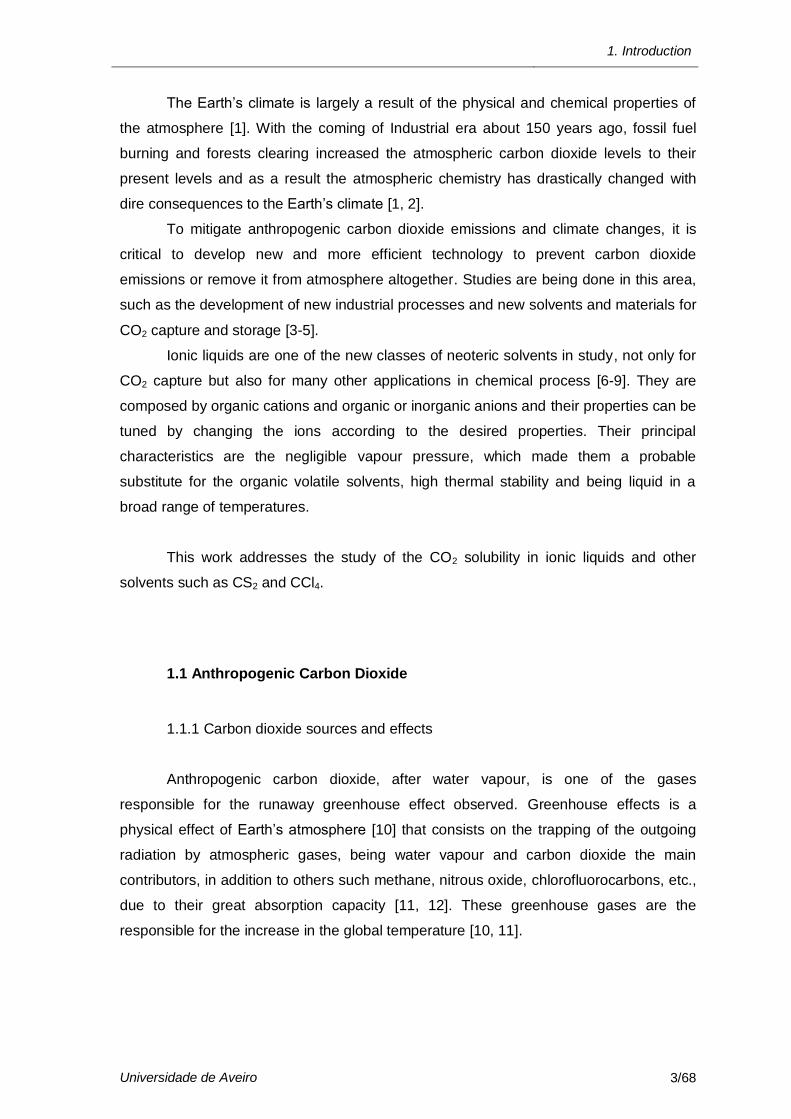
Greenhouse gases concentrations have been increasing due to human activity in
the atmosphere (see Figure 1), in particular carbon dioxide that increased approximately
33% during the last century [1], results in an intensification of the anthropogenic
greenhouse effects when compared to the natural greenhouse effect, trapping more
radiation (heat) which is believed to be one of the major causes of climate change [1, 10,
12, 13]. This temperature increase is responsible for the glaciers melting, sea level
rising and consequent problems [4].
Figure 1 Indicators of human influence on the atmosphere during Industrial era [14].
But there are other ambient problems due to the atmospheric carbon dioxide
concentration besides greenhouse effect and its consequences. The ocean is the largest
natural receptacle for carbon dioxide, that dissolved, generates carbonate and
bicarbonate ions. The increase of these ions increases ocean acidity, with unknown
consequences to marine life [4].
The largest point source of anthropogenic carbon dioxide emissions, being
responsible for more than 80% of the emissions [15], is the combustion of fossil fuels (oil,
coal and natural gas) used in power plants, transportation, industrial facilities and uses
such as in homes and commercial buildings (energy-related). There are yet other
1. Introduction
Universidade de Aveiro 5/68
sources that do not include fossil fuel combustion reaction but produce CO2 as a by-
product such as the cement industry, petroleum products in feedstock and end-uses,
chemical and metals production [16].
With the aim to reduce CO2 emissions many technologies, approaches, materials,
solvents and molecules have been investigated and developed such as [3-5, 17]:
- Improve vehicles, appliances, and industrial process efficiencies to reduce fossil
fuel consumption [4];
- Use alternative energy sources, such as wind, hydro, solar, nuclear, which are
carbon dioxide emissions free [4];
- Carbon dioxide capture and storage into a geologic formation (consists in three
steps: capture, transport and storage of carbon dioxide), ocean (which has been
abandoned due to the environmental impact) or terrestrial ecosystems (through natural
processes, such as the growth of plants and microorganisms) [4].
1.1.2 Carbon dioxide capture technologies
Carbon dioxide can be captured from power plants, industrial processes, or other
sources, and there are three technological pathways to do it: post-combustion capture,
pre-combustion capture, and oxy-combustion [2-5, 17-20], which rely on gas separation
technologies with solvent/sorbents, membranes and cryogenic distillation.
In general, carbon dioxide capture technologies can provide a reduction of about
95% of carbon dioxide emissions [12].
Post-combustion capture
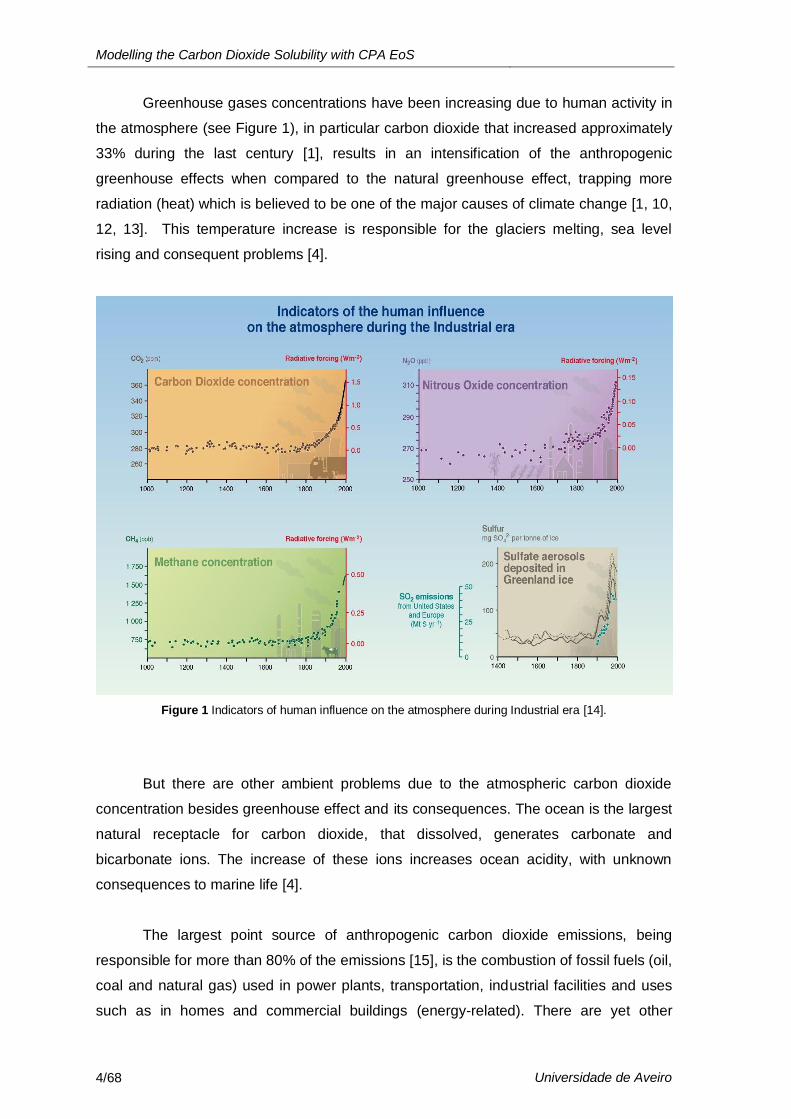
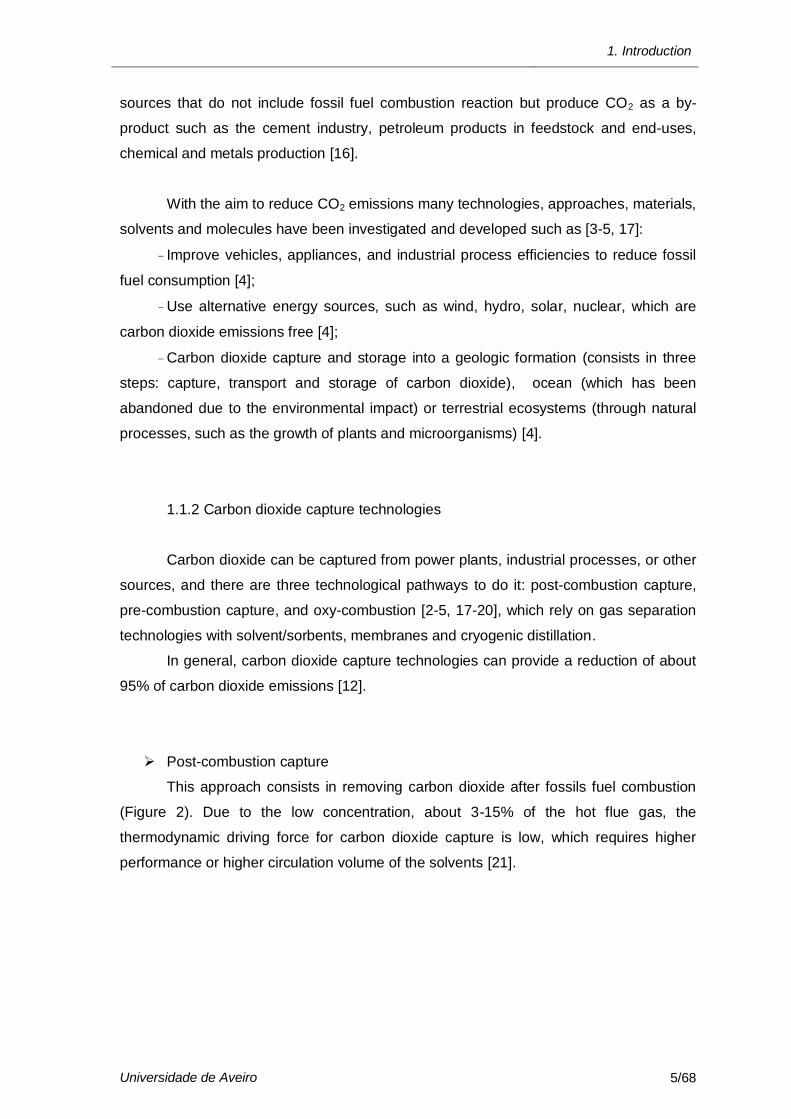
This approach consists in removing carbon dioxide after fossils fuel combustion
(Figure 2). Due to the low concentration, about 3-15% of the hot flue gas, the
thermodynamic driving force for carbon dioxide capture is low, which requires higher
performance or higher circulation volume of the solvents [21].
Modelling the Carbon Dioxide Solubility with CPA EoS
6/68 Universidade de Aveiro
Figure 2 Post-combustion capture process diagram [21].
Pre-combustion capture
In this approach, carbon dioxide is captured before fuel burning. Reduction in
size and costs of carbon dioxide capture facilities can be achieved, if the concentration
and pressure of CO2 can be increased [3, 19].
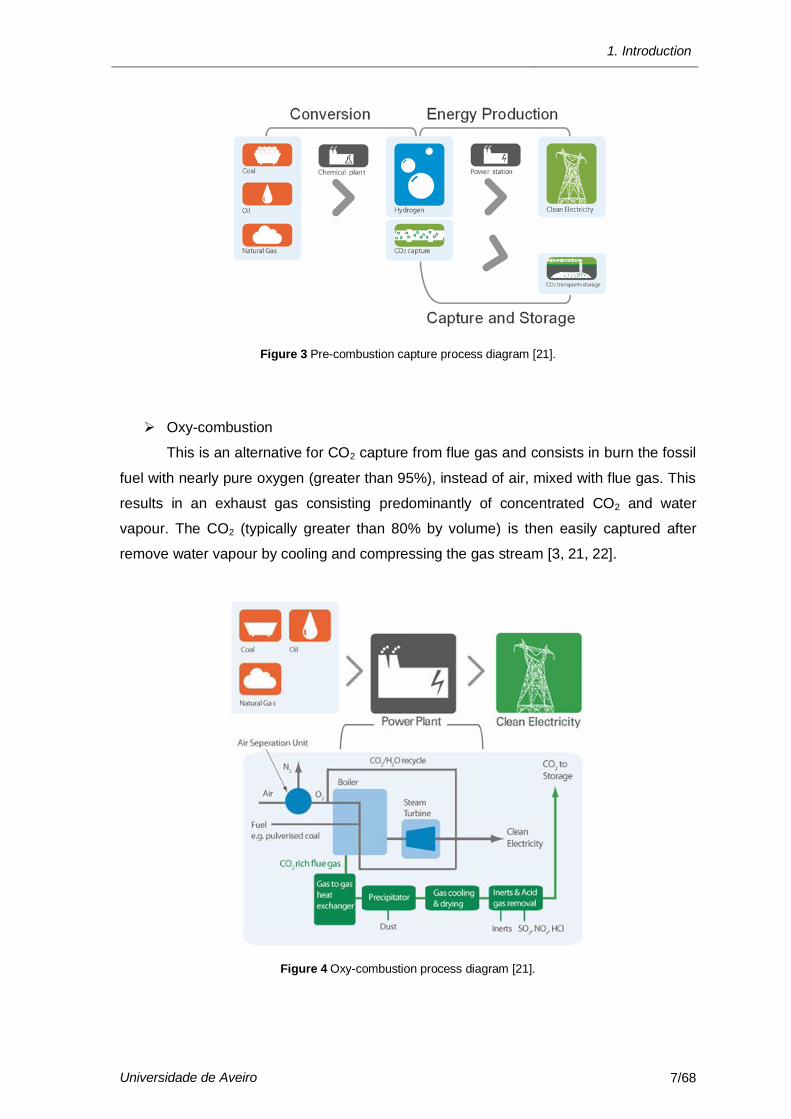
One method for this approach is the gasification process (Figure 3), which
converts the fuel in carbon monoxide and hydrogen - “syngas”. Then carbon monoxide
reacts with steam producing carbon dioxide (at high concentration (35-45%) and high
pressure) and additional hydrogen. After this second reaction, the carbon dioxide
produced can be captured by diverse separation technologies and the resulting
hydrogen can generate CO2-free electricity, producing only heat and water vapour of its
burning [3-5, 17, 19, 21, 22].
Despite being more complex and consequently more expensive than processes
involved in post-combustion, due to the high concentration of carbon dioxide produced
and its high partial pressure, this process can be cost-effectively used to make large
amounts of clean hydrogen for the power industry as well as in refineries and other
chemical industries [3, 19, 21].
1. Introduction
Universidade de Aveiro 7/68
Figure 3 Pre-combustion capture process diagram [21].
Oxy-combustion
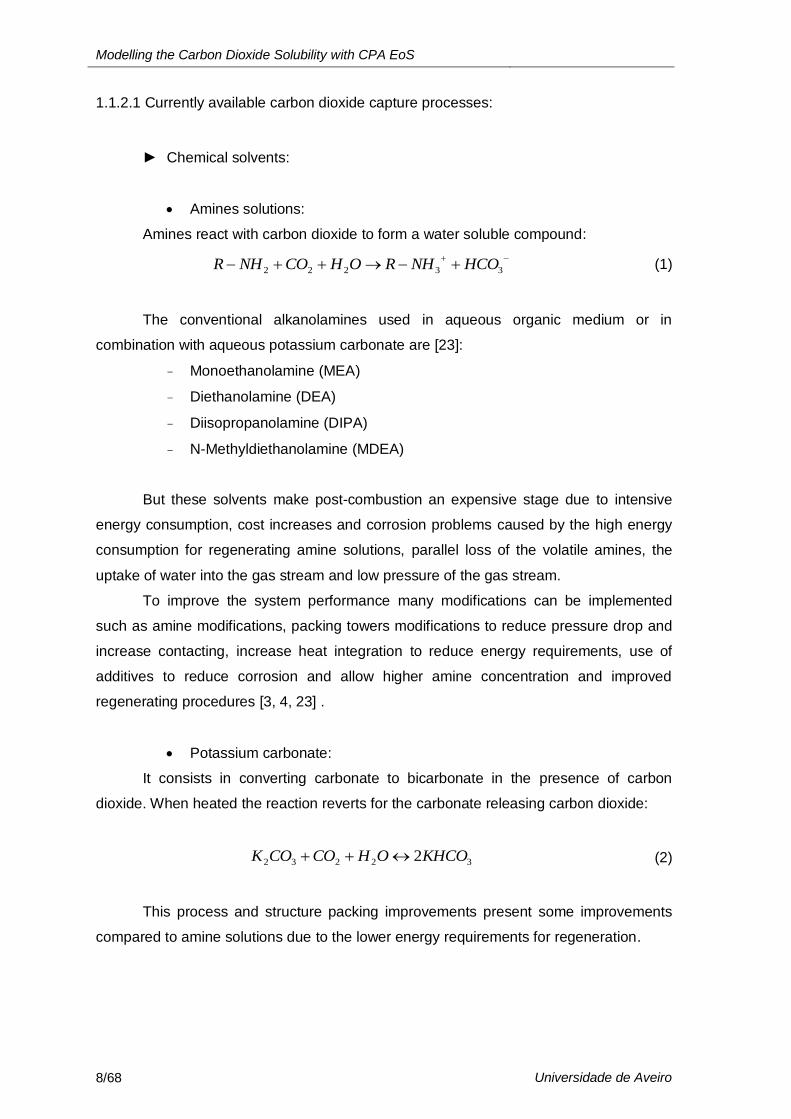
This is an alternative for CO2 capture from flue gas and consists in burn the fossil
fuel with nearly pure oxygen (greater than 95%), instead of air, mixed with flue gas. This
results in an exhaust gas consisting predominantly of concentrated CO2 and water
vapour. The CO2 (typically greater than 80% by volume) is then easily captured after
remove water vapour by cooling and compressing the gas stream [3, 21, 22].
Figure 4 Oxy-combustion process diagram [21].
Modelling the Carbon Dioxide Solubility with CPA EoS
8/68 Universidade de Aveiro
1.1.2.1 Currently available carbon dioxide capture processes:
► Chemical solvents:
Amines solutions:
Amines react with carbon dioxide to form a water soluble compound:
33222 HCONHROHCONHR (1)
The conventional alkanolamines used in aqueous organic medium or in
combination with aqueous potassium carbonate are [23]:
- Monoethanolamine (MEA)
- Diethanolamine (DEA)
- Diisopropanolamine (DIPA)
- N-Methyldiethanolamine (MDEA)
But these solvents make post-combustion an expensive stage due to intensive
energy consumption, cost increases and corrosion problems caused by the high energy
consumption for regenerating amine solutions, parallel loss of the volatile amines, the
uptake of water into the gas stream and low pressure of the gas stream.
To improve the system performance many modifications can be implemented
such as amine modifications, packing towers modifications to reduce pressure drop and
increase contacting, increase heat integration to reduce energy requirements, use of
additives to reduce corrosion and allow higher amine concentration and improved
regenerating procedures [3, 4, 23] .
Potassium carbonate:
It consists in converting carbonate to bicarbonate in the presence of carbon
dioxide. When heated the reaction reverts for the carbonate releasing carbon dioxide:
32232 2KHCOOHCOCOK (2)
This process and structure packing improvements present some improvements
compared to amine solutions due to the lower energy requirements for regeneration.
1. Introduction
Universidade de Aveiro 9/68
► Physical solvents:
The performance of physical solvents depends on the solvent used, the partial
pressure of carbon dioxide and operating temperature. Therefore higher loadings are
achieved with higher partial pressures and lower temperatures.
The most common physical solvents used are Selexol (mixture of dimethyl ethers
of polyethylene glycol), Rectisol (chilled methanol) and propylene carbonate [4, 17, 19].
► Emerging technologies:
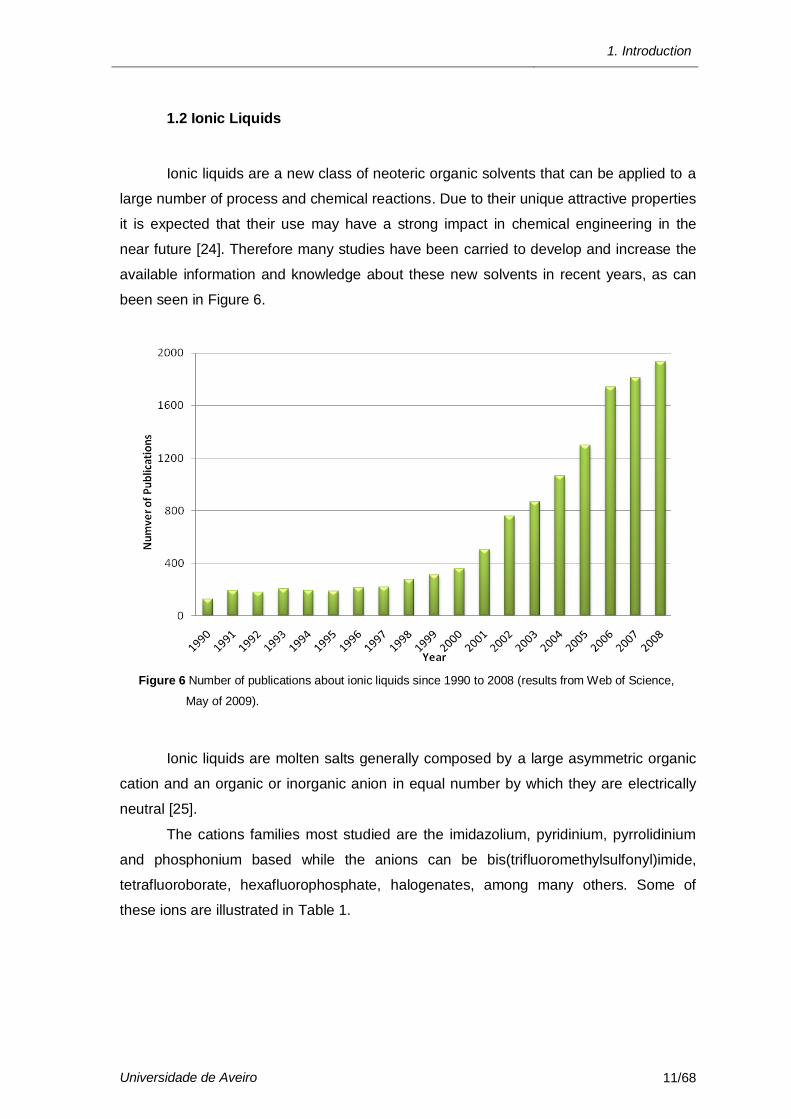
New technologies are being investigated to improve efficiency and costs over
carbon dioxide capture, being some of them reported below. In Figure 5 it can be seen
the potential cost reduction benefits once innovative carbon dioxide capture technologies
are commercialized.
Figure 5 Cost reduction benefits of innovative CO2 capture technologies versus
time to commercialization [3, 4].
Aqueous ammonia
Aqueous ammonia scrubbing principles are similar to those for amine systems.
Ammonia reacts with CO2 forming ammonium carbonate which can react with additional
CO2 to form ammonium bicarbonate:
HCONHOHCOCONH
CONHOHCONH
422324
324223
2
2
(3)
(4)

Modelling the Carbon Dioxide Solubility with CPA EoS
10/68 Universidade de Aveiro
This process has some advantages such as the lower heat of reaction which
results in energy savings, lower energy requirements at lower pressures, low cost,
potential for high carbon dioxide capacity, lack of degradation and higher tolerance for
oxygen in the flue gas [3, 4].
Membranes
In post-combustion capture, since the partial pressure of CO2 in a typical flue gas
is considerably low, vacuum is required on the permeate side or a sweep gas must be
used, requiring a further separation. Because of the higher partial pressure of CO2 in the
raw syngas, the use of membranes with pre-combustion capture is more promising [3, 4,
19].
Regenerable solid sorbents
Solids can act as physical sorbents or form a chemical compound at one set of
operating conditions and be regenerated at another set of conditions, releasing the
adsorbed CO2 and regenerating the original compound. One example of these
compounds is sodium carbonate [3, 4].
Handling difficulties are inherent to solids, where moving (or fluidized) beds for
the solids or fixed beds with periodic gas flow switching can be used. Due to the large
volume of flue gas from a typical coal-fired power plant, large equipments will be
necessary [3, 4].
Metal organic frameworks (MOFs)
MOFs are a new group of hybrid material with possible high CO2 capacity and low
energy requirements for regeneration. They are built from metal ions with well-defined
coordination geometry and organic bridging ligands and are extended structures with
carefully sized cavities that can adsorb CO2 [3, 4].
Enzyme-based systems
Carbozyme is developing enzyme-based systems which utilizes carbonic
anhydrase (CA) in a hollow fiber contained liquid membrane having, in laboratory scale,
the potential to capture 90% of CO2 followed by regeneration at ambient temperature.
These systems can capture and release carbon dioxide by mimicking of the mammalian
respiratory system [3, 19].
1. Introduction
Universidade de Aveiro 11/68
1.2 Ionic Liquids
Ionic liquids are a new class of neoteric organic solvents that can be applied to a
large number of process and chemical reactions. Due to their unique attractive properties
it is expected that their use may have a strong impact in chemical engineering in the
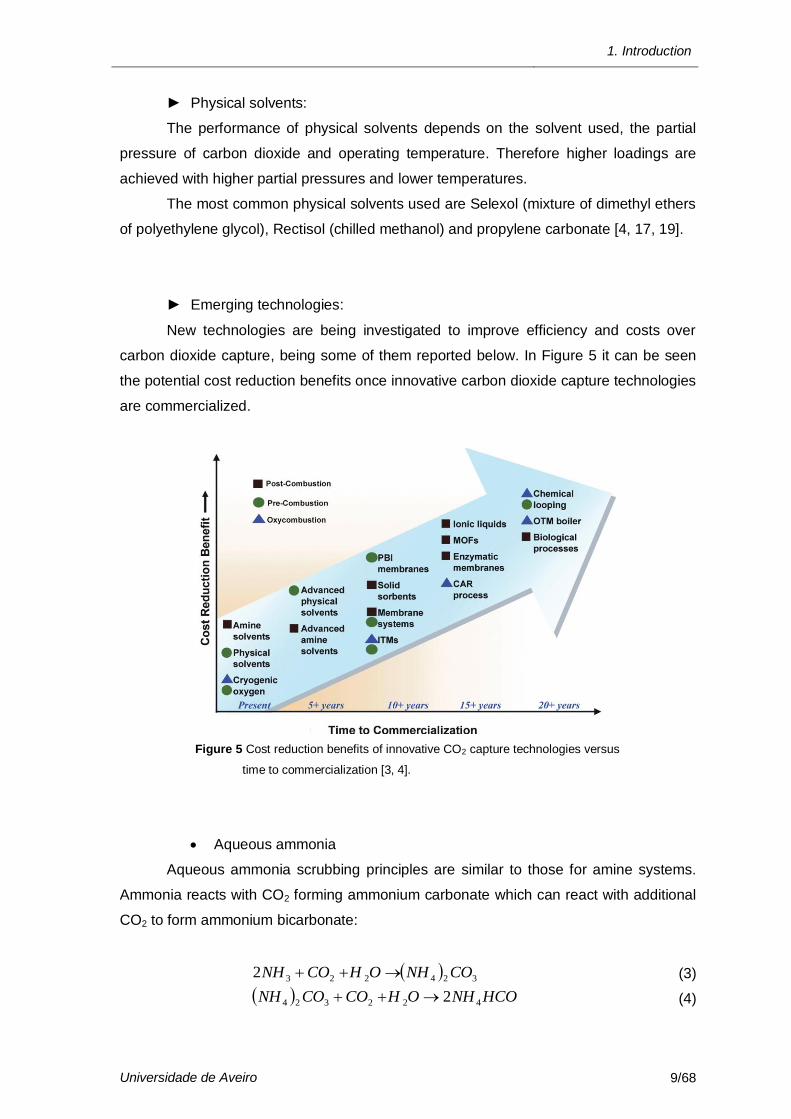
near future [24]. Therefore many studies have been carried to develop and increase the
available information and knowledge about these new solvents in recent years, as can
been seen in Figure 6.
Figure 6 Number of publications about ionic liquids since 1990 to 2008 (results from Web of Science,
May of 2009).
Ionic liquids are molten salts generally composed by a large asymmetric organic
cation and an organic or inorganic anion in equal number by which they are electrically
neutral [25].
The cations families most studied are the imidazolium, pyridinium, pyrrolidinium
and phosphonium based while the anions can be bis(trifluoromethylsulfonyl)imide,
tetrafluoroborate, hexafluorophosphate, halogenates, among many others. Some of
these ions are illustrated in Table 1.

Modelling the Carbon Dioxide Solubility with CPA EoS
12/68 Universidade de Aveiro
Table 1 Names, abbreviations and structures of the most common cations and anions.
Name Abbreviation Structure
Most common cations
1,3-dimethylimidazolium; R=CH3 [dmim]+
1-ethyl-3-methylimidazolium; R=C2H5 [C2mim]+ or [emim]+
1-butyl-3-methylimidazolium; R=C4H9 [C4mim]+ or [bmim]+
1-pentyl-3-methylimidazolium; R=C5H11 [C5mim]+ or [pmim]+
1-hexyl-3-methylimidazolium; R=C6H13 [C6mim]+ or [hmim]+
1-N-butyl-3-methylpyridinium; R=C4H9 [bmpy]+
1-N-hexyl-3-methylpyridinium; R=C5H11 [hmpy]+
1-butyl-1-methylpyrrolidinium [bmpyrr]+
Tetrabutylphosphonium [P(C4)4]+
Most common anions
Tetrafluoroborate [BF4]-
Hexafluorophosphate [PF6]-
Bis(trifluoromethylsulfonyl)imide [NTf2]-
1,1,2,3,3,3-Hexafluoropanesulfonate [HFPS]-
Methyl sulfate [MeSO4]-
1. Introduction
Universidade de Aveiro 13/68
By choosing specific ions and/or functional groups, ionic liquid properties can be
tuned and so the ionic liquids can be designed for a particular application.
In spite of this diversity, ionic liquids share some common properties such as
negligible vapour pressures, which results in very low volatility and reduce fire hazards,
high thermal stability, low melting points, large liquid range covering room or near room
temperatures, adjustable solvation behaviour with good solvating capacity for both
organic and inorganic compounds.
These salts are liquid in a wide range of temperatures due to their negative Gibbs
free energy of fusion, small lattice enthalpy and large entropy changes which are a result
from the large asymmetric cations, conformational flexibility of the ions and weak
coulombic forces, which cannot form a crystalline structure like common salts [6, 25-27].
There are many possible ionic liquid applications in the chemical industry. Ionic
liquids can be used as solvents in chemical reactions and process separation, such as in
catalytic reactions, cleaning and purifications operations, gas separations, liquids
separations and as gas storage, electrolyte in fuel cells, lubricants and heat transfer
fluids, being the most interesting research areas the replacement of volatile organic
compounds and gas separation [7-9, 26, 28-30].
Ionic liquids are considered a possible replacement for conventional volatile
organic compounds (VOCs) used in the chemical industry because of their negligible
vapour pressure, having a lower impact on air pollution and environmental benefits [26,
28, 29, 31, 32]. Yet they are miscible with water [33, 34] which can be a path to enter on
the environment. For some ionic liquids their toxicity and impact on aquatic ecosystems
has been studied. The imidazolium and pyridinium based Ils have a toxicity inferior to
most organic solvents that seems to increase with the cation alkyl chain length while the
anion influence is smaller than that of the cation. Their toxicity can also be controlled and
minimized tuning ionic liquid properties by an adequate choice of the ions that compose
the ionic liquid [33].
The interest in ionic liquids for gas separations results also from their non-
volatility which cannot contaminate gas streams, their high stability which made their use
possible at higher temperatures making possible their use in conventional absorbers and
strippers [26] or supported liquids membranes, reducing the amount of solvent
necessary because the reduced loss of solvent and not-degradation of the membrane
with time [26, 35].
Modelling the Carbon Dioxide Solubility with CPA EoS
14/68 Universidade de Aveiro
The knowledge of gas solubility in ionic liquid, among other mixture properties, is
essential for ionic liquids application in chemical processes and their development, being
carbon dioxide solubility one of the most investigated aiming at their use in CO2 capture
processes.
1.3 Carbon Dioxide solubility in Ionic Liquids
Carbon dioxide solubility in ionic liquids has not been studied only aiming at
carbon dioxide capture and gas separation, but also because supercritical carbon
dioxide can be used to extract compounds from ionic liquids and to separate ionic liquids
from organic liquid mixtures promoting phase separation without contamination of the
ionic liquid [7, 26, 36].
Some researchers have demonstrated that the carbon dioxide is one of the most
soluble gases in ionic liquids, making ionic liquids capable of gas separation for natural
gas and flue gas [26]. Carbon dioxide solubility in ionic liquids is affected by cations
and/or anions change, degree of fluorination of the anion or the cation and other CO2-
philic groups [26, 36].
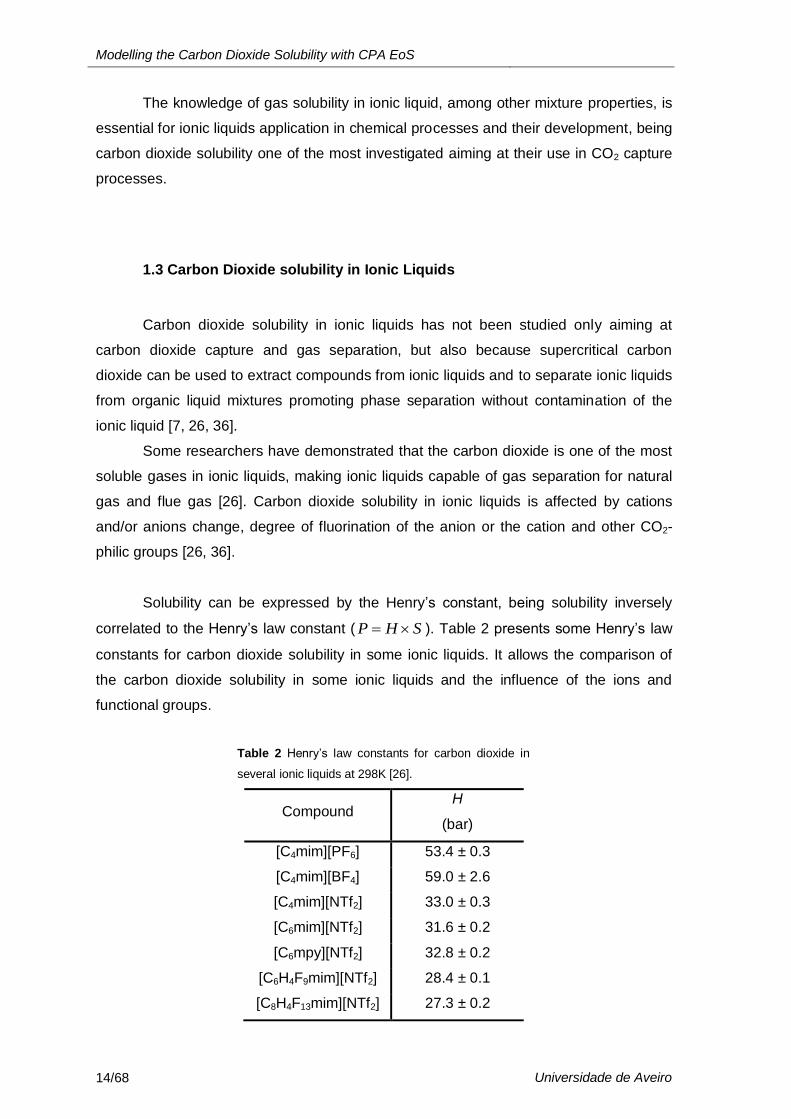
Solubility can be expressed by the Henry’s constant, being solubility inversely
correlated to the Henry’s law constant ( SHP ). Table 2 presents some Henry’s law
constants for carbon dioxide solubility in some ionic liquids. It allows the comparison of
the carbon dioxide solubility in some ionic liquids and the influence of the ions and
functional groups.
Table 2 Henry’s law constants for carbon dioxide in
several ionic liquids at 298K [26].
Compound H
(bar)
[C4mim][PF6] 53.4 ± 0.3
[C4mim][BF4] 59.0 ± 2.6
[C4mim][NTf2] 33.0 ± 0.3
[C6mim][NTf2] 31.6 ± 0.2
[C6mpy][NTf2] 32.8 ± 0.2
[C6H4F9mim][NTf2] 28.4 ± 0.1
[C8H4F13mim][NTf2] 27.3 ± 0.2
1. Introduction
Universidade de Aveiro 15/68
Cations changes do not have a considerable influence in carbon dioxide solubility
being this mostly affected by the anions [7, 26]. Fixing the cation [C4mim]+ and
comparing the anions [NTf2]-, [BF4]
- and [PF6]-, it can be observed that the solubility is
drastically different for each anion, noting that it decreases from [NTf2]- to [PF6]
- to [BF4]-
[26]. Fixing the anion [NTf2]- and varying the cation, such [C6mim]+, [C6mpy]+ and [N4111]
+,
the solubility is similar for all ionic liquids. For some cations, such as choline, carbon
dioxide solubility is lower, which can be explained by the stronger hydrogen bonding
between the choline and [NTf2]- making the anion less available to interact with the
carbon dioxide [26]. These comparisons suggest that the interaction of carbon dioxide
with the anion is higher than that with the cation.
Comparing imidazolium based ionic liquids, such [Cnmim][NTf2], [Cnmim][BF4] and
[Cnmim][PF6] the increase in the cation alkyl chain length slightly increases the carbon
dioxide solubility in the ionic liquids due to the highest free volume in the ionic liquid, but
this effect is minor compared to that of the anion [26].
Addition of fluoroalkyl groups to the cation or anion seems to increase the carbon
dioxide solubility, but this increase will occur only until the maximum CO2-philicity is
reached which correspond to an optimum number of fluorine atoms in the fluoroalkyl
chain [36].


2. MODEL

2. Model
Universidade de Aveiro 19/68
Due to the very large number of possible ionic liquids, it is necessary to develop
correlations and predictive models able to describe behaviours and properties based on
experimental measurements of selected systems. Several models have already been
applied to carbon dioxide and ionic liquid systems, such as tPC-SAFT [24, 37], soft-
SAFT [32], COSMO-RS [38], SWCF-EoS [28, 39], RK-EoS [29, 40], GC-EoS [41] and
Krichevsky–Kasarnovsky EoS [42] , but the Cubic Plus Association equation of state
(CPA EoS) is being applied for the first time in this work as a model for ionic liquids
systems.
The CPA EoS was proposed by Kontogeorgis and co-workers [43] and since
1995 has been developed and applied to diverse systems showing great results on the
description of phase behaviour. The systems for which it already have been applied were
composed by associating components and/or non associating components and the
results were improved compared to others obtained with equations that only take into
account one binary interaction parameter such as the PR EoS and the SRK EoS, among
others [43].
2.1 Cubic plus Association Equation of State
The CPA EoS is composed by two terms: one is the physical term described by
the Soave-Redlich-Kwong equation of state (SRK EoS), which takes into account the
physical interactions between the components, and the other is related to the associating
term and is described by the Wertheim’s theory accounting for the specific site-site
interactions due to hydrogen bonding and solvation effects [43].
In terms of the compressibility factor, the CPA EoS is expressed by the following
equation [43]:
i
i
A
A
i
i
assocphys
Xxg
bRT
a
b
ZZZ
1ln
12
1
)1(1
1
..
(5)
Modelling the Carbon Dioxide Solubility with CPA EoS
20/68 Universidade de Aveiro
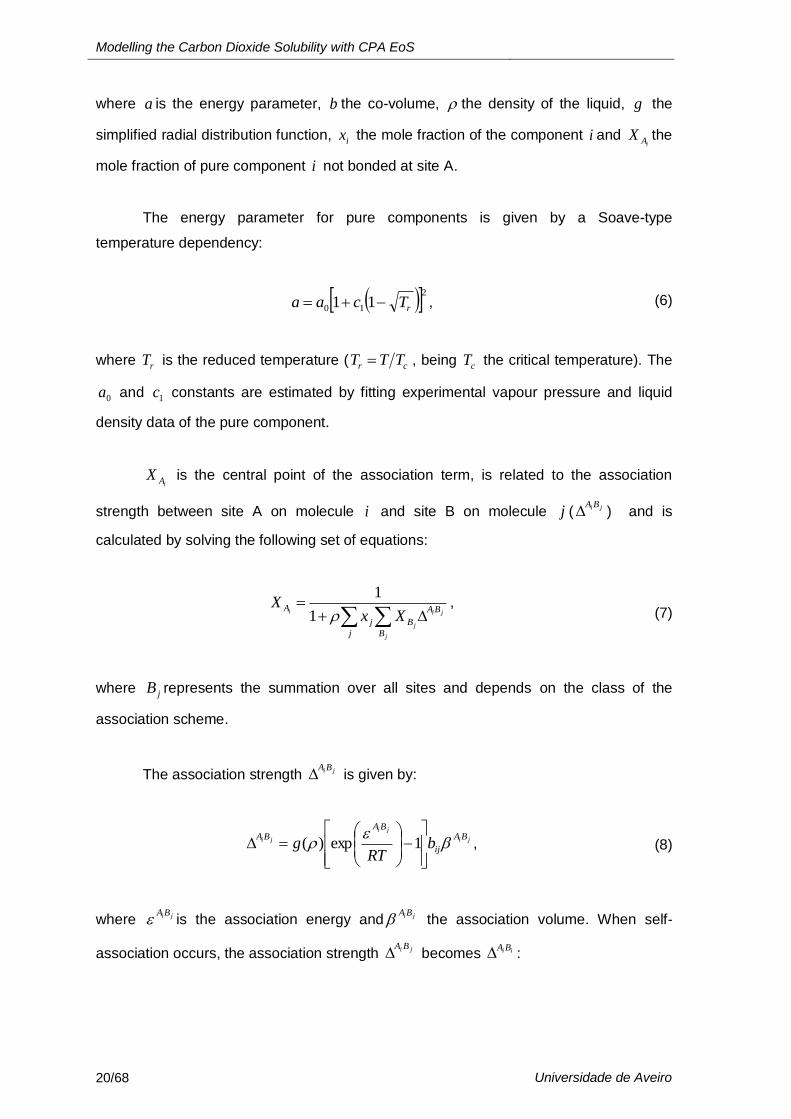
where a is the energy parameter, b the co-volume, the density of the liquid, g the
simplified radial distribution function, ix the mole fraction of the component i and iAX the
mole fraction of pure component i not bonded at site A.
The energy parameter for pure components is given by a Soave-type
temperature dependency:
210 11 rTcaa , (6)
where rT is the reduced temperature ( cr TTT , being cT the critical temperature). The
0a and 1c constants are estimated by fitting experimental vapour pressure and liquid
density data of the pure component.
iAX is the central point of the association term, is related to the association
strength between site A on molecule i and site B on molecule j ( jiBA ) and is
calculated by solving the following set of equations:
j B
BA
Bj
A
j
ji
j
iXx
X1
1,
(7)
where jB represents the summation over all sites and depends on the class of the
association scheme.
The association strength jiBA is given by:
ji
ji
ji BA
ij
BABA
bRT
g
1exp)( , (8)
where jiBA is the association energy and jiBA
the association volume. When self-
association occurs, the association strength ji BA becomes iiBA
:
2. Model
Universidade de Aveiro 21/68
ii
ii
ii BA
ii
BABA
bRT
g
1exp)( . (9)
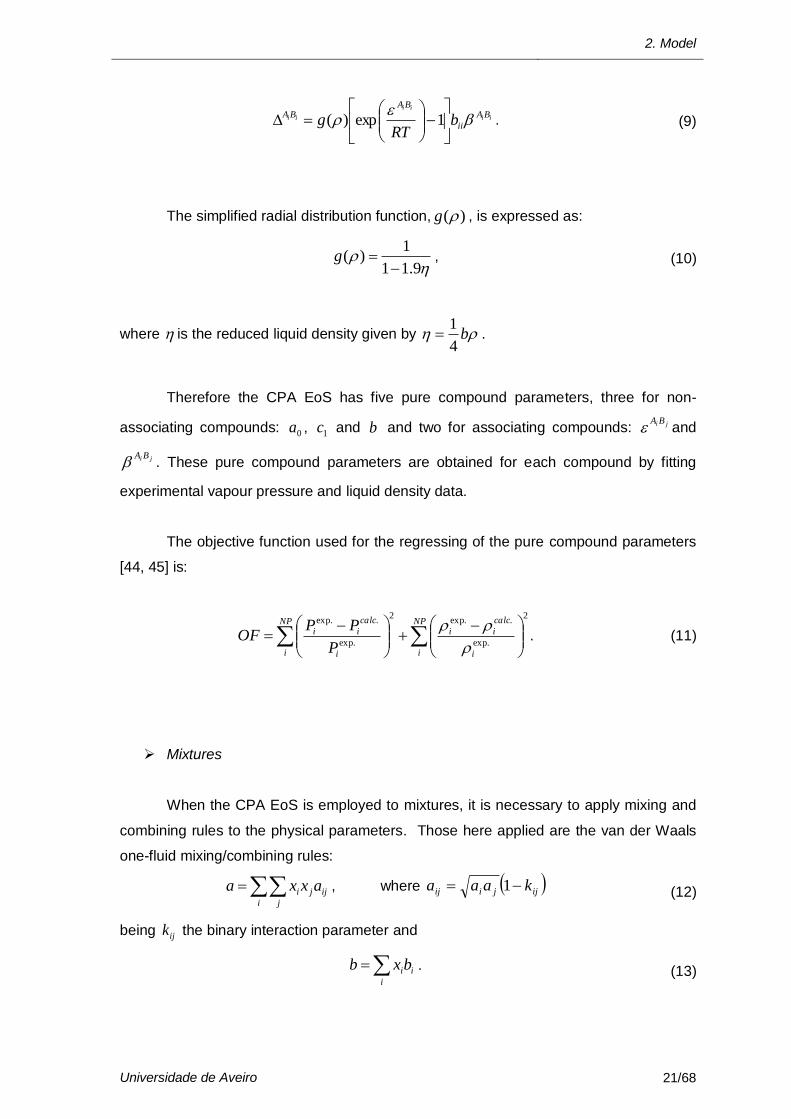
The simplified radial distribution function, )(g , is expressed as:
9.11
1)(
g , (10)
where is the reduced liquid density given by b4
1 .
Therefore the CPA EoS has five pure compound parameters, three for non-
associating compounds: 0a , 1c and b and two for associating compounds: ji BA and
ji BA . These pure compound parameters are obtained for each compound by fitting
experimental vapour pressure and liquid density data.
The objective function used for the regressing of the pure compound parameters
[44, 45] is:
2
.exp
..exp2
.exp
..exp
NP
i i
calc
iiNP
i i
calc
ii
P
PPOF
. (11)
Mixtures
When the CPA EoS is employed to mixtures, it is necessary to apply mixing and
combining rules to the physical parameters. Those here applied are the van der Waals
one-fluid mixing/combining rules:
i j
ijji axxa , where ijjiij kaaa 1 (12)
being ijk the binary interaction parameter and
i
iibxb . (13)
Modelling the Carbon Dioxide Solubility with CPA EoS
22/68 Universidade de Aveiro
The objective function used for the estimation of the binary interaction parameter
is:
2
.exp
..exp
NP
i i
calc
ii
x
xxOF (14)
When the system is composed only by non-associating compounds, the CPA
EoS reduces to the SKR EoS, being required only the three pure compound parameters
of the physical contribution.
For binary mixtures with self-associating and non-associating compounds, the
binary interaction parameter is the only adjustable parameter and combining rules are
not needed for the association energy and volume [44].
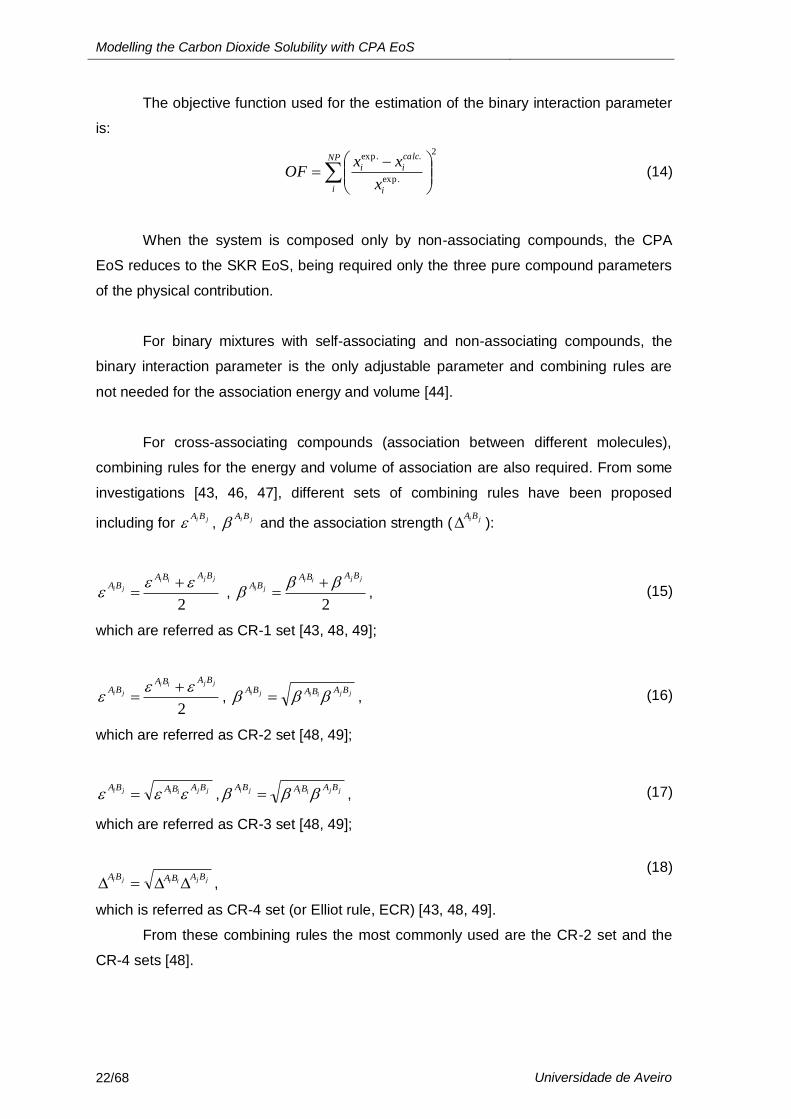
For cross-associating compounds (association between different molecules),
combining rules for the energy and volume of association are also required. From some
investigations [43, 46, 47], different sets of combining rules have been proposed
including for ji BA , ji BA
and the association strength ( jiBA ):
2
jjii
ji
BABABA
, 2
jjii
ji
BABABA
, (15)
which are referred as CR-1 set [43, 48, 49];
2
jjii
ji
BABABA
, jjiiji BABABA , (16)
which are referred as CR-2 set [48, 49];
jjiiji BABABA , jjiiji BABABA
, (17)
which are referred as CR-3 set [48, 49];
jjiiji BABABA ,
(18)
which is referred as CR-4 set (or Elliot rule, ECR) [43, 48, 49].
From these combining rules the most commonly used are the CR-2 set and the
CR-4 sets [48].
2. Model
Universidade de Aveiro 23/68
Association scheme
The association scheme is related to the number and type of association sites for
the associating compounds. There are several schemes classified by Huang and Radosz
[50], which can been seen in Table 3.
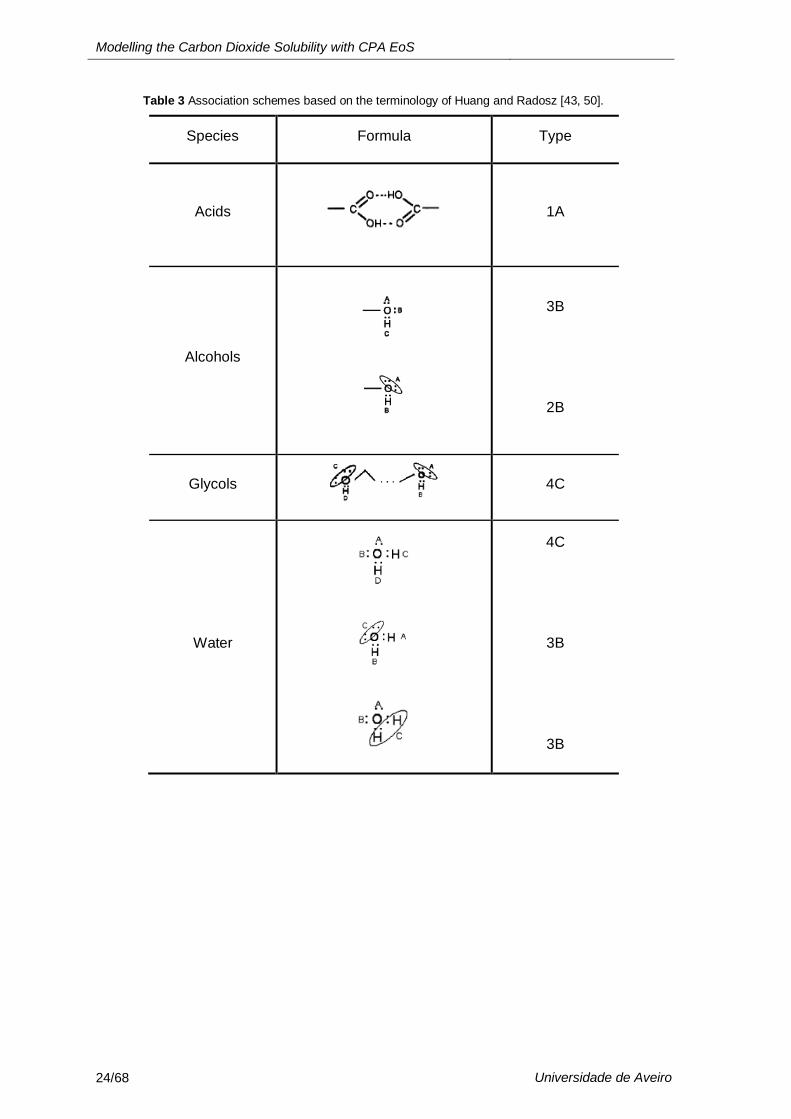
The 1A scheme is applied to acids and assumes that the acid groups work as a
glue spot able to bond with a lone pair of electrons, a H atom or a site of the same type.
The schemes 2B or 3B are applied to alcohols and amines. The scheme 2B
assumes that hydrogen bonding occurs between the hydroxyl hydrogen and one of the
lone pairs of electrons from the oxygen atom of another alcohol molecule.
The scheme 4C is used for highly hydrogen bonded substances, as glycols and
water, and assumes that hydrogen bonding occurs between the two hydrogen atoms and
the two lone pairs of electrons in the oxygen of another molecule.
Modelling the Carbon Dioxide Solubility with CPA EoS
24/68 Universidade de Aveiro
Table 3 Association schemes based on the terminology of Huang and Radosz [43, 50].
Species Formula Type
Acids
1A
Alcohols
3B
2B
Glycols
4C
Water
4C
3B
3B
2. Model
Universidade de Aveiro 25/68
2.2 Results and Discussion
Ionic liquids from the [Cnmim][NTf2] series were the ionic liquids selected for the
study of the CPA EoS application and its performance on describing carbon dioxide
solubility behaviour in ionic liquids.
2.2.1 Compilation and selection of available data
Before starting modelling, there are some experimental data required, such as
vapour pressure and liquid density data and critical properties for the compounds in
study.
Vapour pressure (P ) and liquid density (
.liq ) data for carbon dioxide were
obtained from the DIPPR database [51], which are described by the following
correlations (the constants are present in Table B 1 and Table B 2 (Appendix B)):
ETDTC
T
BAP lnexp
, (19)
D
C
T
liq
B
A
11
. . (20)
The usually reduced temperature range applied is from 0.45 to 0.85, which
covers most of the liquid range, from close to the triple point to the critical point.
However, due to the limited temperature range of the DIPPR database for carbon dioxide
data, the reduced temperature range covered was from 0.71 to 0.90.
Carbon dioxide critical properties were also obtained from the DIPPR database
[51] (Table A 1, Appendix A).
Being ionic liquids such new solvents, available data for some investigations is
sometimes scarce, which is why it was necessary a review of the available or supplied
vapour pressure, liquid density data and vapour-liquid equilibrium data (PTx) for the ionic
liquids under study (Table 4).

Modelling the Carbon Dioxide Solubility with CPA EoS
26/68 Universidade de Aveiro
Table 4 Ionic liquids studied and availability of data.
Compound P .liq PTx
[C2mim][NTf2]
[C3mim][NTf2]
[C4mim][NTf2]
[C5mim][NTf2]
[C6mim][NTf2]
[C7mim][NTf2]
[C8mim][NTf2]
Liquid phase density data for ionic liquids were obtained from the literature [52-
54] and vapour pressure data were obtained from a correlation (equation 21) provided by
Prof. Luis Belchior Santos, from University of Porto developed based on data measured
at his laboratory (constants in Table B 3, Appendix B).
T
BA
P
P
ln , with PaP 1 (21)
The critical properties for the ionic liquids studied were obtained from Valderrama
et al., estimated applying the modified Lydersen-Joback-Reid method there proposed
[55, 56] (Table A 2, Appendix A).
2.2.2 Correlation of the CPA pure compound parameters
The estimation of the pure compounds parameters is a crucial step before
applying the equation of state. It was carried out, as mentioned before, by simultaneous
regression of vapour pressure and liquid density data for non-associating and
associating compounds using the equation 11.
2. Model
Universidade de Aveiro 27/68
This was achieved using a FORTRAN routine based on a modified Marquardt
algorithm for non-linear least squares, which was obtained from the Harwell subroutine
library (http://hsl.rl.ac.uk/archive/cou.html). This routine allows constrained regression of
the CPA parameters, so the user can set up the range of allowed values for each
parameter, avoiding the regression of parameters with non-physical meaning.
The global average deviation (%AAD) for vapour pressure or liquid density is
calculated by:
1001
%1
exp,
,exp,
NP
ii
icalci
X
XXABS
NPAAD ,
(22)
where X can be vapour pressure or liquid density.
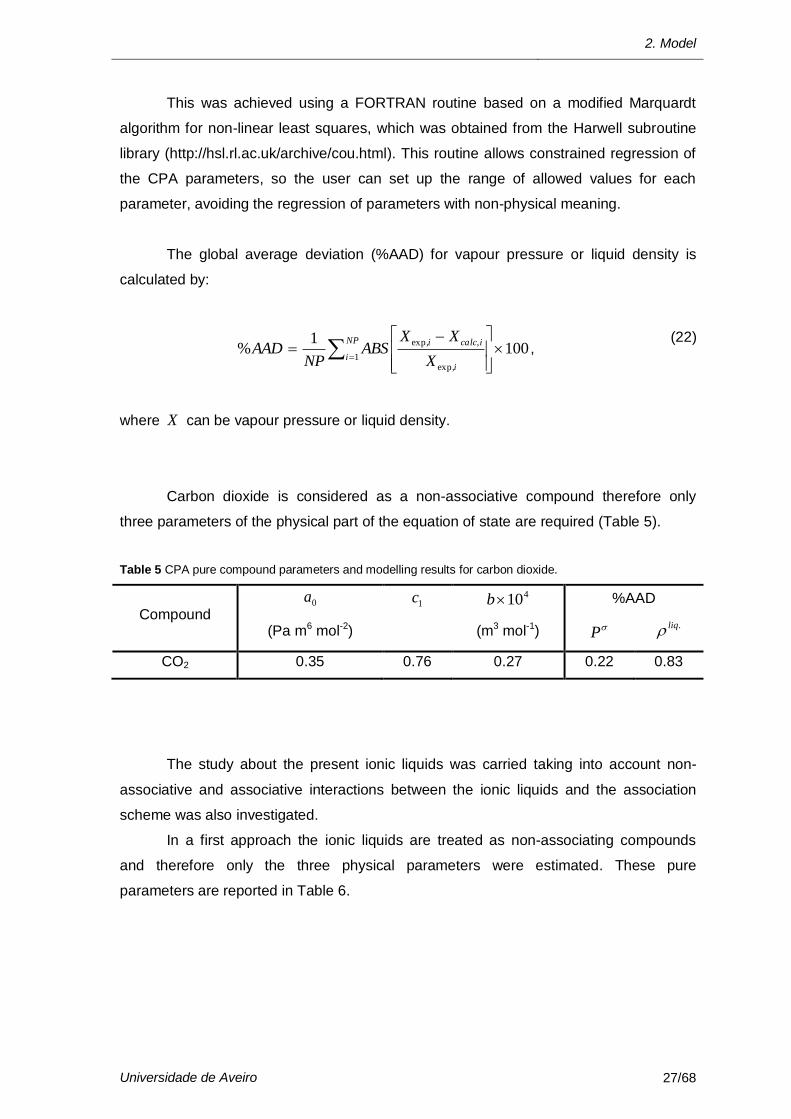
Carbon dioxide is considered as a non-associative compound therefore only
three parameters of the physical part of the equation of state are required (Table 5).
Table 5 CPA pure compound parameters and modelling results for carbon dioxide.
Compound 0a
1c 410b %AAD
(Pa m6 mol-2) (m3 mol-1) P .liq
CO2 0.35 0.76 0.27 0.22 0.83
The study about the present ionic liquids was carried taking into account non-
associative and associative interactions between the ionic liquids and the association
scheme was also investigated.
In a first approach the ionic liquids are treated as non-associating compounds
and therefore only the three physical parameters were estimated. These pure
parameters are reported in Table 6.
Modelling the Carbon Dioxide Solubility with CPA EoS
28/68 Universidade de Aveiro
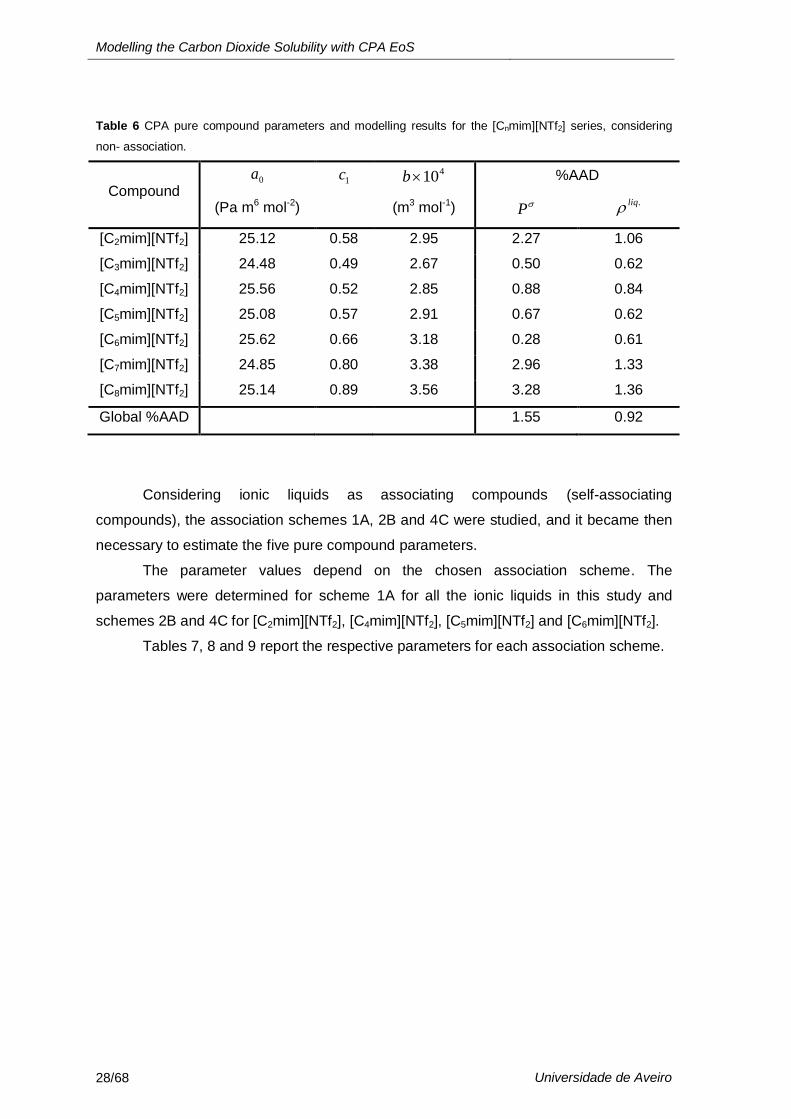
Table 6 CPA pure compound parameters and modelling results for the [Cnmim][NTf2] series, considering
non- association.
Compound 0a
1c 410b %AAD
(Pa m6 mol-2) (m3 mol-1) P .liq
[C2mim][NTf2] 25.12 0.58 2.95 2.27 1.06
[C3mim][NTf2] 24.48 0.49 2.67 0.50 0.62
[C4mim][NTf2] 25.56 0.52 2.85 0.88 0.84
[C5mim][NTf2] 25.08 0.57 2.91 0.67 0.62
[C6mim][NTf2] 25.62 0.66 3.18 0.28 0.61
[C7mim][NTf2] 24.85 0.80 3.38 2.96 1.33
[C8mim][NTf2] 25.14 0.89 3.56 3.28 1.36
Global %AAD 1.55 0.92
Considering ionic liquids as associating compounds (self-associating
compounds), the association schemes 1A, 2B and 4C were studied, and it became then
necessary to estimate the five pure compound parameters.
The parameter values depend on the chosen association scheme. The
parameters were determined for scheme 1A for all the ionic liquids in this study and
schemes 2B and 4C for [C2mim][NTf2], [C4mim][NTf2], [C5mim][NTf2] and [C6mim][NTf2].
Tables 7, 8 and 9 report the respective parameters for each association scheme.
2. Model
Universidade de Aveiro 29/68
Modelling the Carbon Dioxide Solubility with CPA EoS
30/68 Universidade de Aveiro
2. Model
Universidade de Aveiro 31/68
As can be seen from the previous tables, a good description of vapour pressure
and liquid densities can be achieved with CPA for carbon dioxide and the various ionic
liquids studied, being the global average deviation inferior to 1%, with a decrease in the
deviation when association is considered. The parameters obtained are higher than the
expected when compared to pure parameters for other compounds [43].
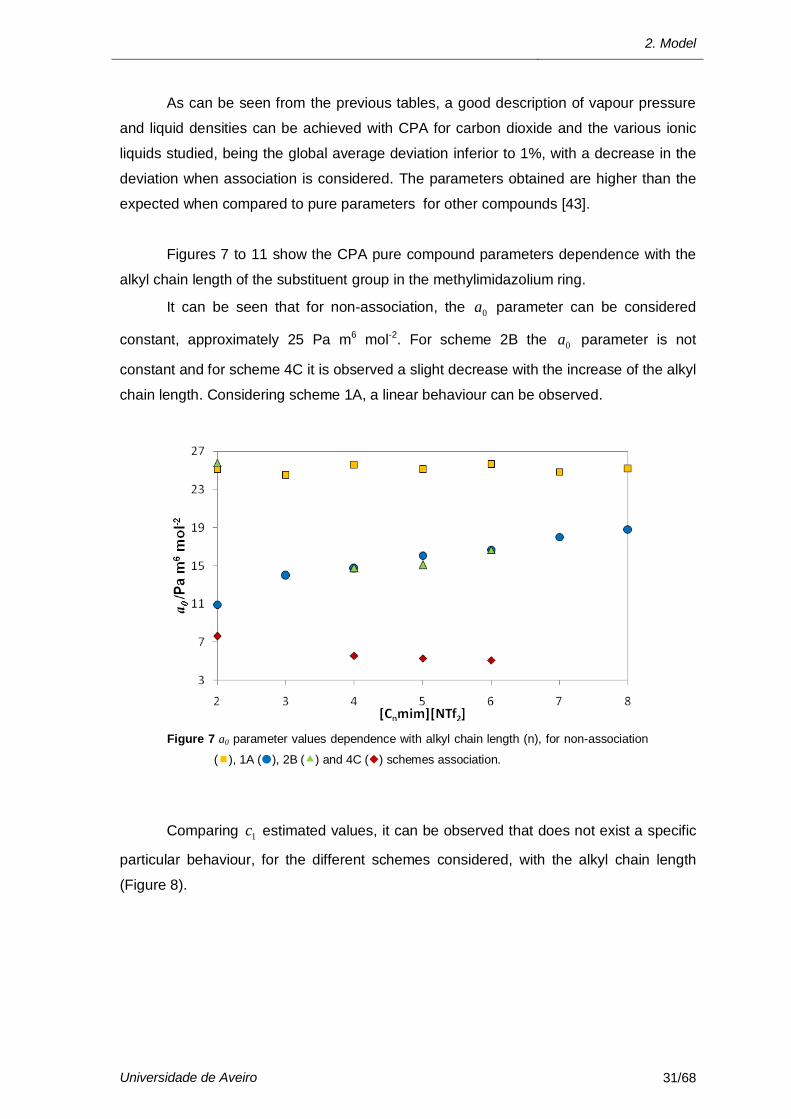
Figures 7 to 11 show the CPA pure compound parameters dependence with the
alkyl chain length of the substituent group in the methylimidazolium ring.
It can be seen that for non-association, the 0a parameter can be considered
constant, approximately 25 Pa m6 mol-2. For scheme 2B the 0a parameter is not
constant and for scheme 4C it is observed a slight decrease with the increase of the alkyl
chain length. Considering scheme 1A, a linear behaviour can be observed.
Figure 7 a0 parameter values dependence with alkyl chain length (n), for non-association
(), 1A (), 2B () and 4C () schemes association.
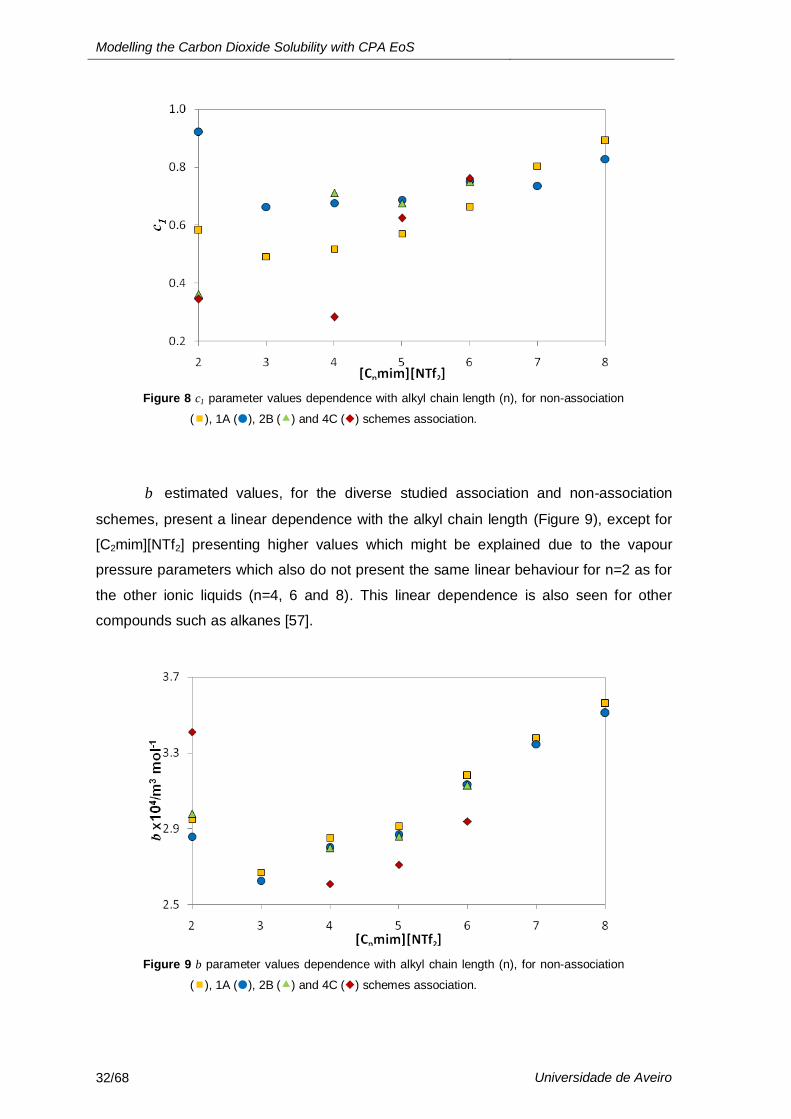
Comparing 1c estimated values, it can be observed that does not exist a specific
particular behaviour, for the different schemes considered, with the alkyl chain length
(Figure 8).
Modelling the Carbon Dioxide Solubility with CPA EoS
32/68 Universidade de Aveiro
Figure 8 c1 parameter values dependence with alkyl chain length (n), for non-association
(), 1A (), 2B () and 4C () schemes association.
b estimated values, for the diverse studied association and non-association
schemes, present a linear dependence with the alkyl chain length (Figure 9), except for
[C2mim][NTf2] presenting higher values which might be explained due to the vapour
pressure parameters which also do not present the same linear behaviour for n=2 as for
the other ionic liquids (n=4, 6 and 8). This linear dependence is also seen for other
compounds such as alkanes [57].
Figure 9 b parameter values dependence with alkyl chain length (n), for non-association
(), 1A (), 2B () and 4C () schemes association.
2. Model
Universidade de Aveiro 33/68
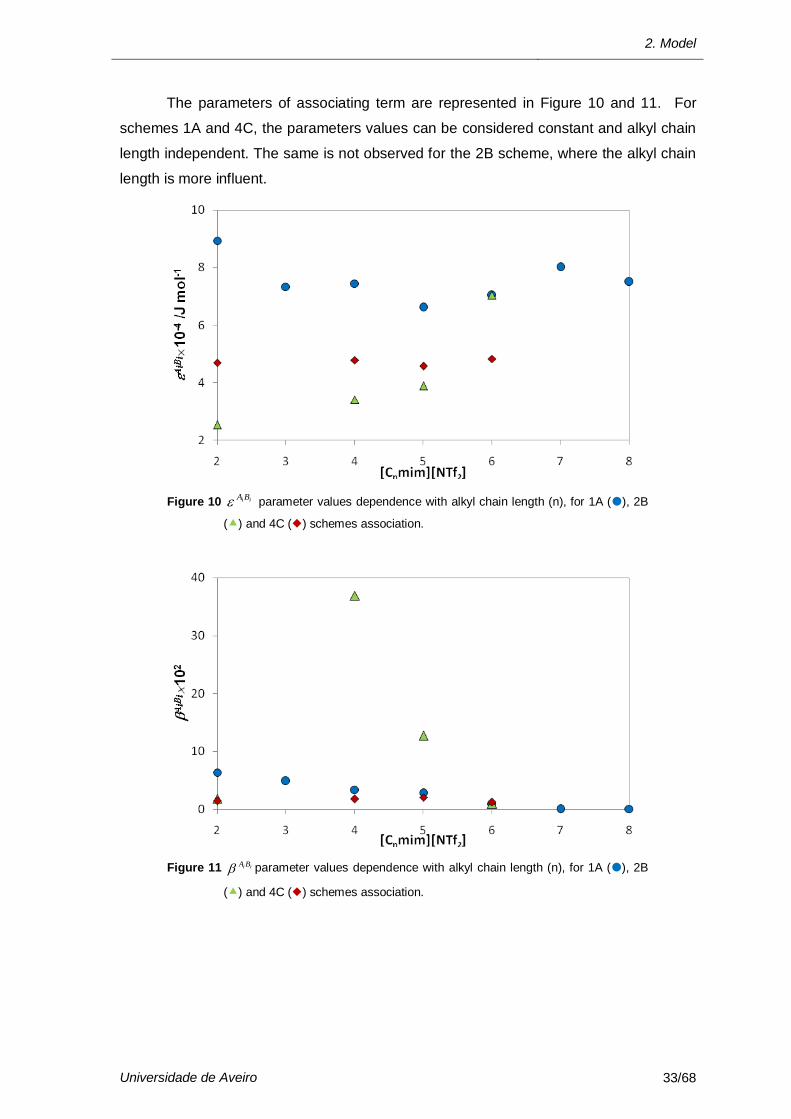
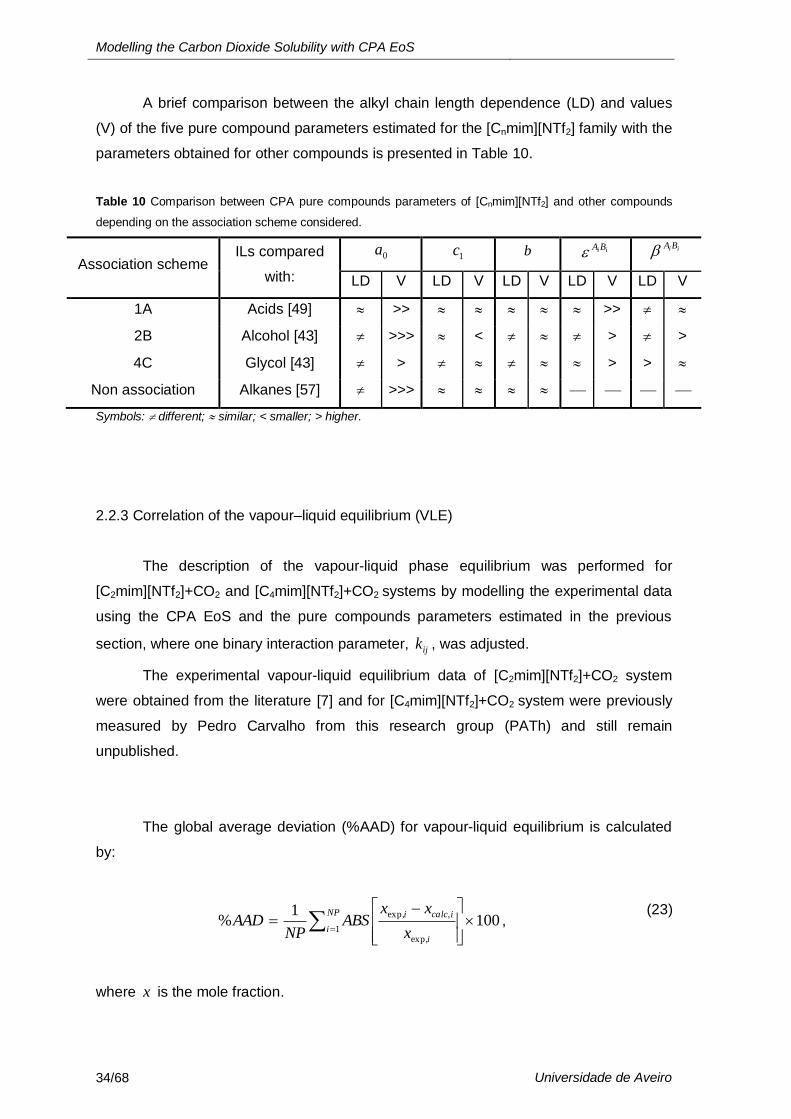
The parameters of associating term are represented in Figure 10 and 11. For
schemes 1A and 4C, the parameters values can be considered constant and alkyl chain
length independent. The same is not observed for the 2B scheme, where the alkyl chain
length is more influent.
Figure 10 iiBA parameter values dependence with alkyl chain length (n), for 1A (), 2B
() and 4C () schemes association.
Figure 11 iiBA parameter values dependence with alkyl chain length (n), for 1A (), 2B
() and 4C () schemes association.
Modelling the Carbon Dioxide Solubility with CPA EoS
34/68 Universidade de Aveiro
A brief comparison between the alkyl chain length dependence (LD) and values
(V) of the five pure compound parameters estimated for the [Cnmim][NTf2] family with the
parameters obtained for other compounds is presented in Table 10.
Table 10 Comparison between CPA pure compounds parameters of [Cnmim][NTf2] and other compounds
depending on the association scheme considered.
Association scheme ILs compared
with:
0a 1c b iiBA iiBA
LD V LD V LD V LD V LD V
1A Acids [49] >> >>
2B Alcohol [43] >>> < > >
4C Glycol [43] > > >
Non association Alkanes [57] >>>
Symbols: different; similar; < smaller; > higher.
2.2.3 Correlation of the vapour–liquid equilibrium (VLE)
The description of the vapour-liquid phase equilibrium was performed for
[C2mim][NTf2]+CO2 and [C4mim][NTf2]+CO2 systems by modelling the experimental data
using the CPA EoS and the pure compounds parameters estimated in the previous
section, where one binary interaction parameter, ijk , was adjusted.
The experimental vapour-liquid equilibrium data of [C2mim][NTf2]+CO2 system
were obtained from the literature [7] and for [C4mim][NTf2]+CO2 system were previously
measured by Pedro Carvalho from this research group (PATh) and still remain
unpublished.
The global average deviation (%AAD) for vapour-liquid equilibrium is calculated
by:
1001
%1
exp,
,exp,
NP
ii
icalci
x
xxABS
NPAAD ,
(23)
where x is the mole fraction.

2. Model
Universidade de Aveiro 35/68
An interaction parameter is needed to obtain a better vapour-liquid description as
can be seen in Figure 12, where the %AAD is slightly higher when 0ijk (Table 11),
being this more significant for higher temperatures. The study of ijk influence was made
only for some temperatures for the [C2mim][NTf2]+CO2 system, considering ionic liquids
as non-associating compounds.
Table 11 CPA VLE results for [C2mim][NTf2]+CO2 systems considering non-
association for 0ijk and 0ijk .
Temperature/K %AAD
0ijk 0ijk (Table 12)
293.04 22.94 16.56
323.16 18.70 15.84
353.11 23.00 9.56
Figure 12 VLE Experimental data of [C2mim][NTf2]+CO2 and CPA predictions for non-
association for T=293.04K(), T=323.16() and T=353.11() with kij=0 (---)
and kij=-0.016, -0.009 and -0.037, respectively ().
Modelling the Carbon Dioxide Solubility with CPA EoS
36/68 Universidade de Aveiro
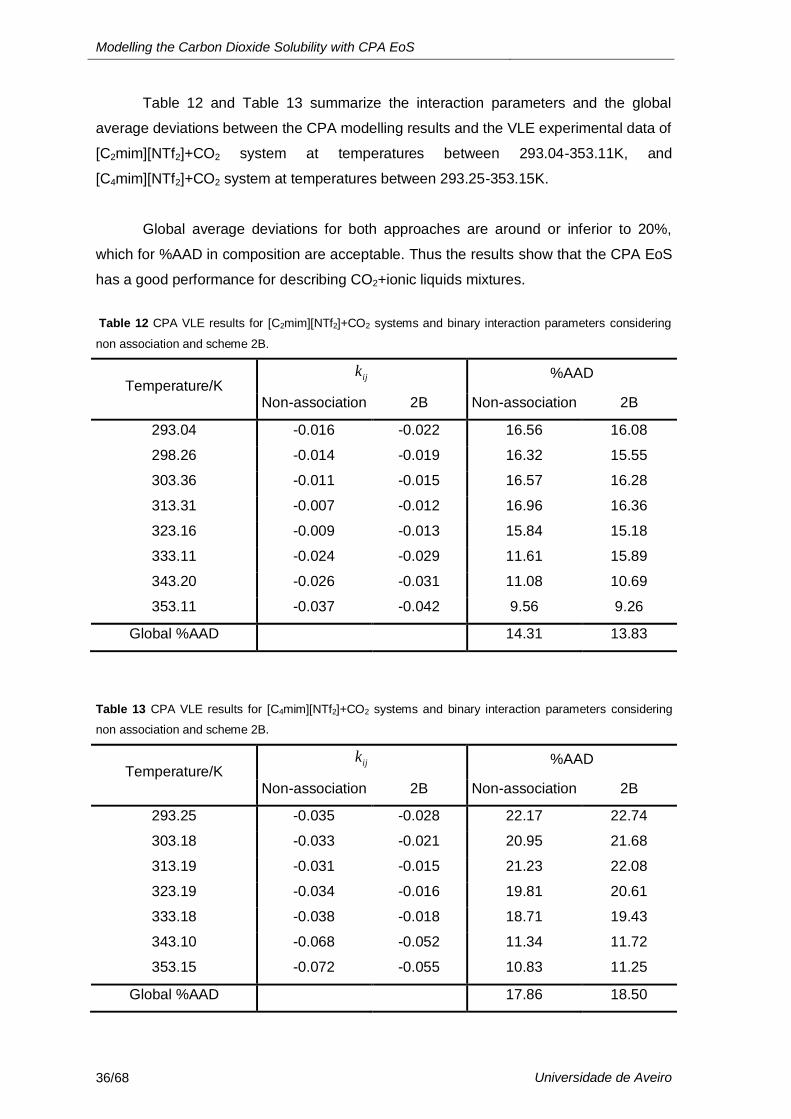
Table 12 and Table 13 summarize the interaction parameters and the global
average deviations between the CPA modelling results and the VLE experimental data of
[C2mim][NTf2]+CO2 system at temperatures between 293.04-353.11K, and
[C4mim][NTf2]+CO2 system at temperatures between 293.25-353.15K.
Global average deviations for both approaches are around or inferior to 20%,
which for %AAD in composition are acceptable. Thus the results show that the CPA EoS
has a good performance for describing CO2+ionic liquids mixtures.
Table 12 CPA VLE results for [C2mim][NTf2]+CO2 systems and binary interaction parameters considering
non association and scheme 2B.
Temperature/K ijk %AAD
Non-association 2B Non-association 2B
293.04 -0.016 -0.022 16.56 16.08
298.26 -0.014 -0.019 16.32 15.55
303.36 -0.011 -0.015 16.57 16.28
313.31 -0.007 -0.012 16.96 16.36
323.16 -0.009 -0.013 15.84 15.18
333.11 -0.024 -0.029 11.61 15.89
343.20 -0.026 -0.031 11.08 10.69
353.11 -0.037 -0.042 9.56 9.26
Global %AAD 14.31 13.83
Table 13 CPA VLE results for [C4mim][NTf2]+CO2 systems and binary interaction parameters considering
non association and scheme 2B.
Temperature/K ijk %AAD
Non-association 2B Non-association 2B
293.25 -0.035 -0.028 22.17 22.74
303.18 -0.033 -0.021 20.95 21.68
313.19 -0.031 -0.015 21.23 22.08
323.19 -0.034 -0.016 19.81 20.61
333.18 -0.038 -0.018 18.71 19.43
343.10 -0.068 -0.052 11.34 11.72
353.15 -0.072 -0.055 10.83 11.25
Global %AAD 17.86 18.50
2. Model
Universidade de Aveiro 37/68
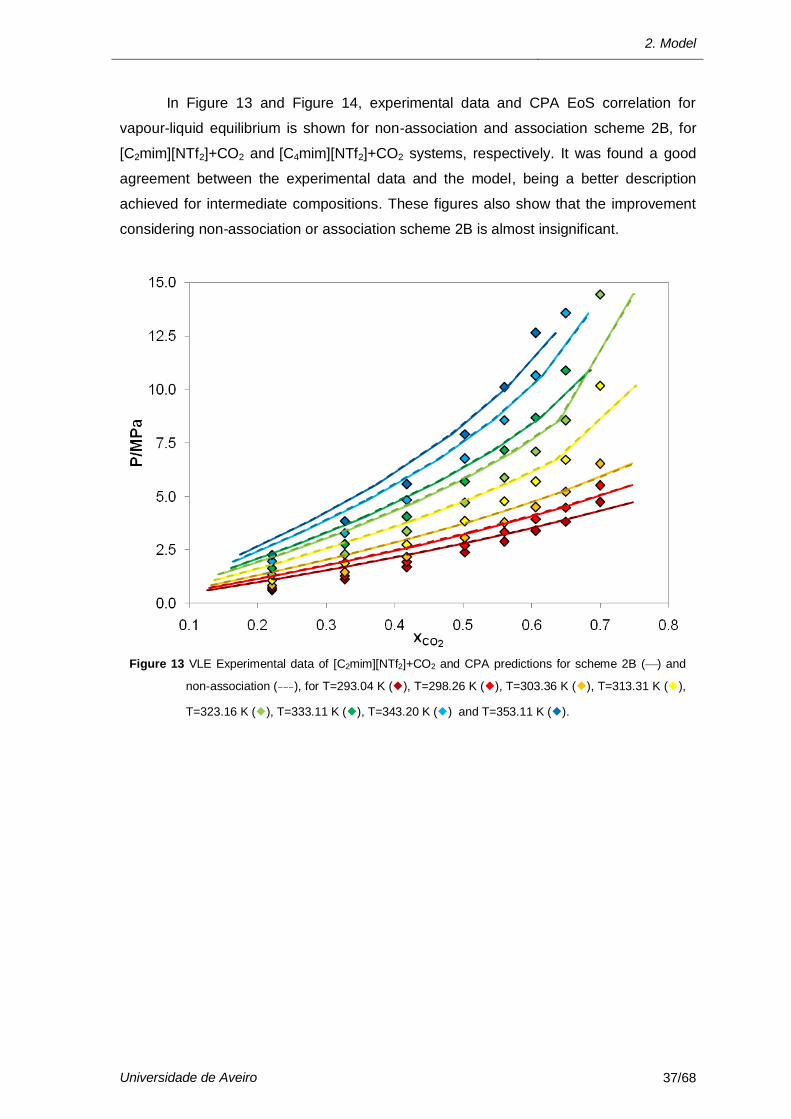
In Figure 13 and Figure 14, experimental data and CPA EoS correlation for
vapour-liquid equilibrium is shown for non-association and association scheme 2B, for
[C2mim][NTf2]+CO2 and [C4mim][NTf2]+CO2 systems, respectively. It was found a good
agreement between the experimental data and the model, being a better description
achieved for intermediate compositions. These figures also show that the improvement
considering non-association or association scheme 2B is almost insignificant.
Figure 13 VLE Experimental data of [C2mim][NTf2]+CO2 and CPA predictions for scheme 2B () and
non-association (---), for T=293.04 K (), T=298.26 K (), T=303.36 K (), T=313.31 K (),
T=323.16 K (), T=333.11 K (), T=343.20 K () and T=353.11 K ().
Modelling the Carbon Dioxide Solubility with CPA EoS
38/68 Universidade de Aveiro
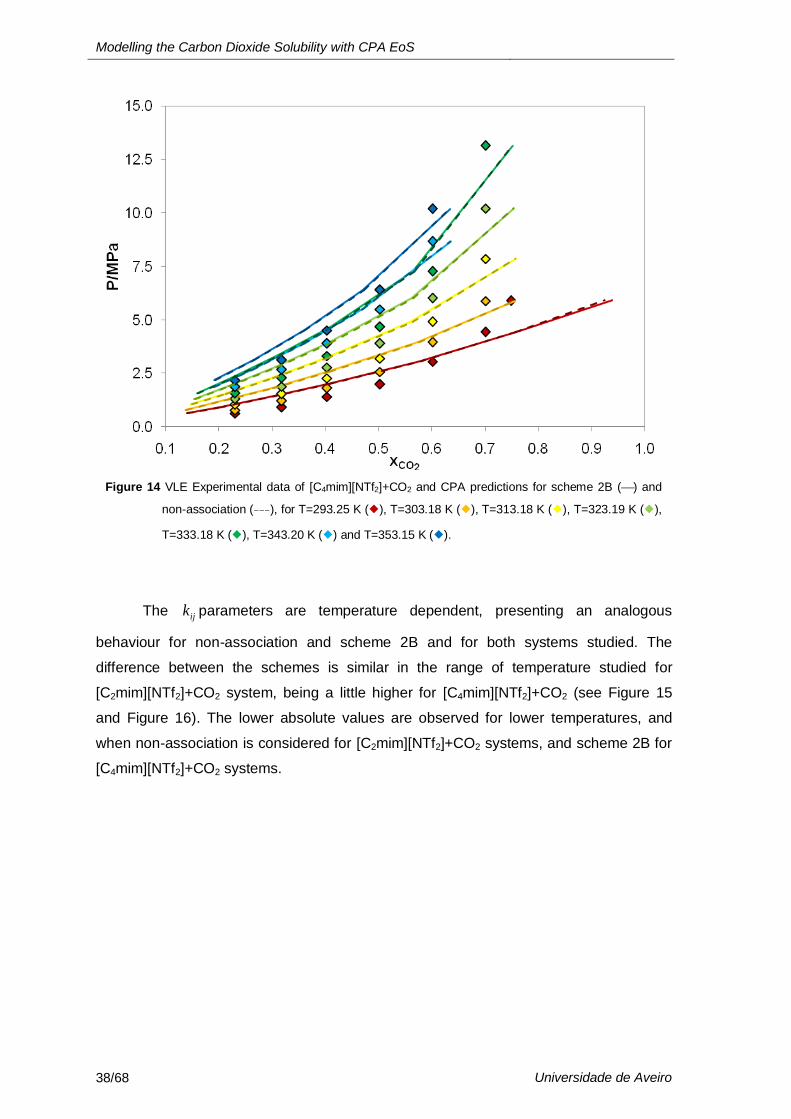
Figure 14 VLE Experimental data of [C4mim][NTf2]+CO2 and CPA predictions for scheme 2B () and
non-association (---), for T=293.25 K (), T=303.18 K (), T=313.18 K (), T=323.19 K (),
T=333.18 K (), T=343.20 K () and T=353.15 K ().
The ijk parameters are temperature dependent, presenting an analogous
behaviour for non-association and scheme 2B and for both systems studied. The
difference between the schemes is similar in the range of temperature studied for
[C2mim][NTf2]+CO2 system, being a little higher for [C4mim][NTf2]+CO2 (see Figure 15
and Figure 16). The lower absolute values are observed for lower temperatures, and
when non-association is considered for [C2mim][NTf2]+CO2 systems, and scheme 2B for
[C4mim][NTf2]+CO2 systems.
2. Model
Universidade de Aveiro 39/68
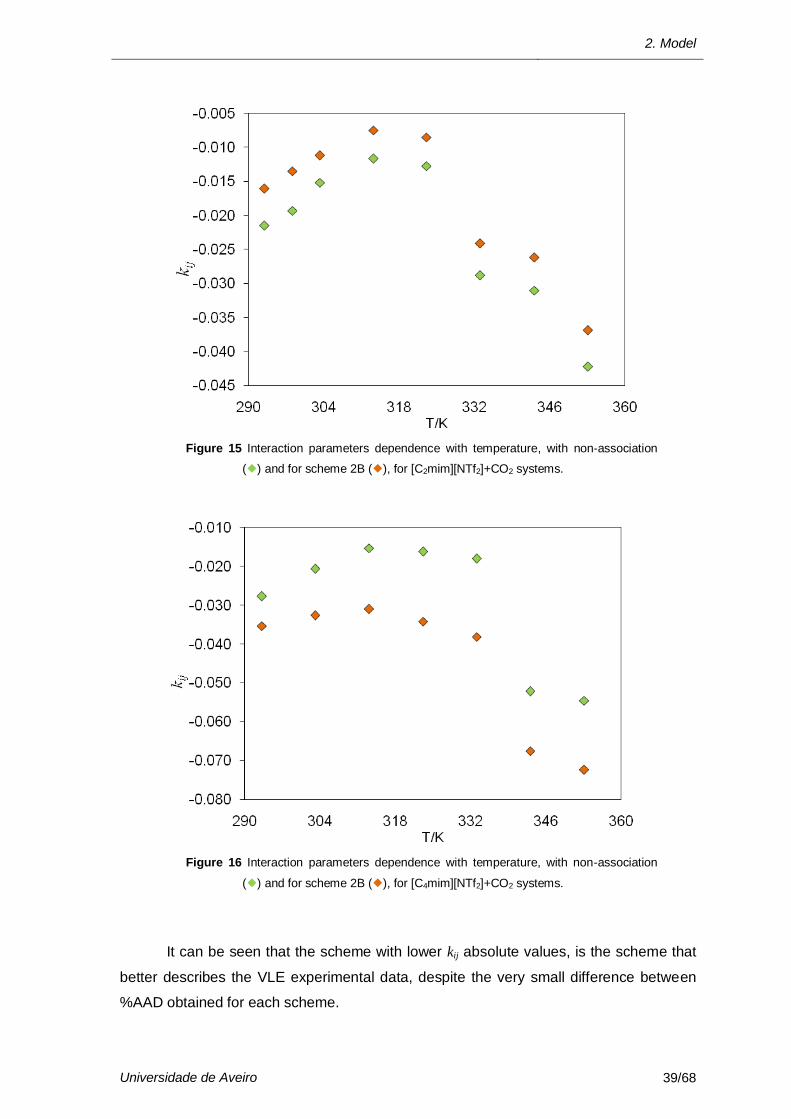
Figure 15 Interaction parameters dependence with temperature, with non-association
() and for scheme 2B (), for [C2mim][NTf2]+CO2 systems.
Figure 16 Interaction parameters dependence with temperature, with non-association
() and for scheme 2B (), for [C4mim][NTf2]+CO2 systems.
It can be seen that the scheme with lower kij absolute values, is the scheme that
better describes the VLE experimental data, despite the very small difference between
%AAD obtained for each scheme.
Modelling the Carbon Dioxide Solubility with CPA EoS
40/68 Universidade de Aveiro
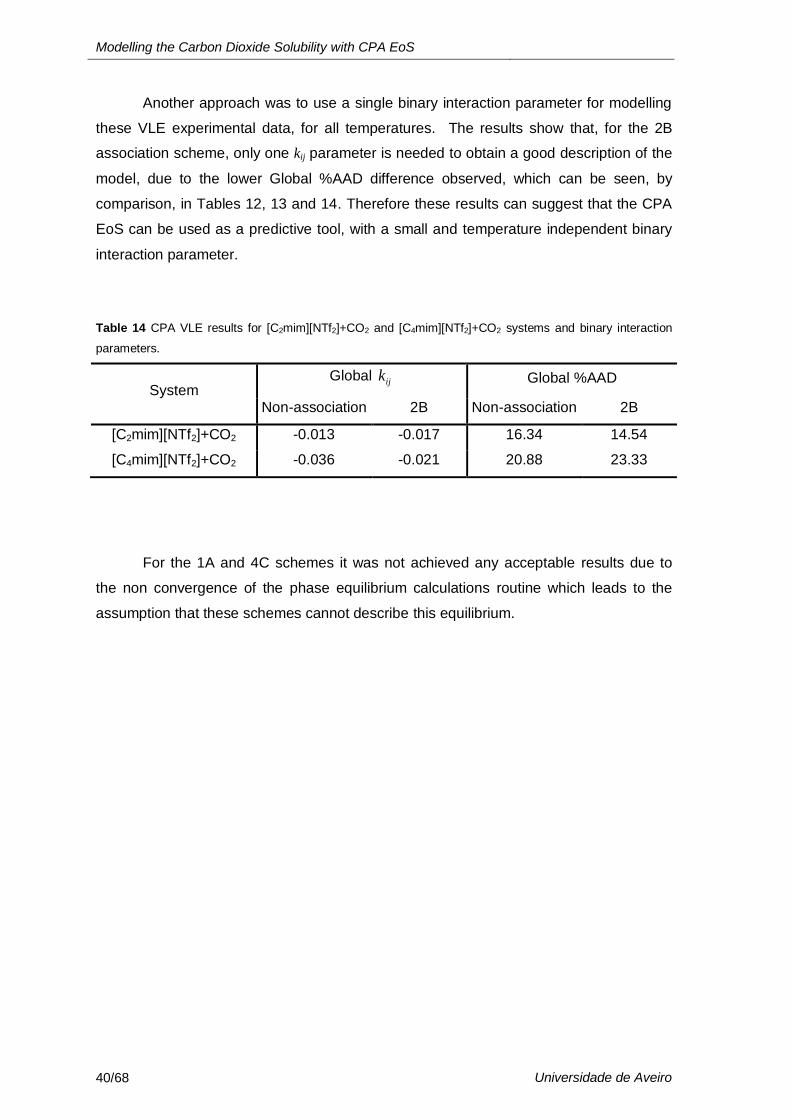
Another approach was to use a single binary interaction parameter for modelling
these VLE experimental data, for all temperatures. The results show that, for the 2B
association scheme, only one kij parameter is needed to obtain a good description of the
model, due to the lower Global %AAD difference observed, which can be seen, by
comparison, in Tables 12, 13 and 14. Therefore these results can suggest that the CPA
EoS can be used as a predictive tool, with a small and temperature independent binary
interaction parameter.
Table 14 CPA VLE results for [C2mim][NTf2]+CO2 and [C4mim][NTf2]+CO2 systems and binary interaction
parameters.
System Global ijk Global %AAD
Non-association 2B Non-association 2B
[C2mim][NTf2]+CO2 -0.013 -0.017 16.34 14.54
[C4mim][NTf2]+CO2 -0.036 -0.021 20.88 23.33
For the 1A and 4C schemes it was not achieved any acceptable results due to
the non convergence of the phase equilibrium calculations routine which leads to the
assumption that these schemes cannot describe this equilibrium.
3. EXPERIMENTAL MEASUREMENTS
AND CPA MODELLING

3. Experimental Measurements and CPA Modelling
Universidade de Aveiro 43/68
With the aim of further understanding the interactions between CO2 and solvents,
carbon dioxide solubility in carbon disulphide and carbon tetrachloride were also studied.
Carbon disulphide and carbon tetrachloride were chosen duo the similar
geometric structure to carbon dioxide and methane, respectively, and the influence that
the change of some atoms in the solvent molecule can have in the solubility.
Due to the lack of experimental data for these systems, carbon dioxide solubility
measurements were performed in a high pressure cell.
3.1 Materials
The chemicals used for the measurements were carbon disulphide, carbon
tetrachloride and carbon dioxide. Carbon disulphide was acquired from Panreac with
mass fraction purities 99.9 % and Carbon tetrachloride was acquired from SDS with
mass fraction purities 99.9 %.
The carbon dioxide used was from Air Liquide with a purity of ≥ 99.998 % and
H2O, O2, CnHm, N2 and H2 impurities volume fractions lower than (3, 2, 2, 8 and 0.5)10-6,
respectively.
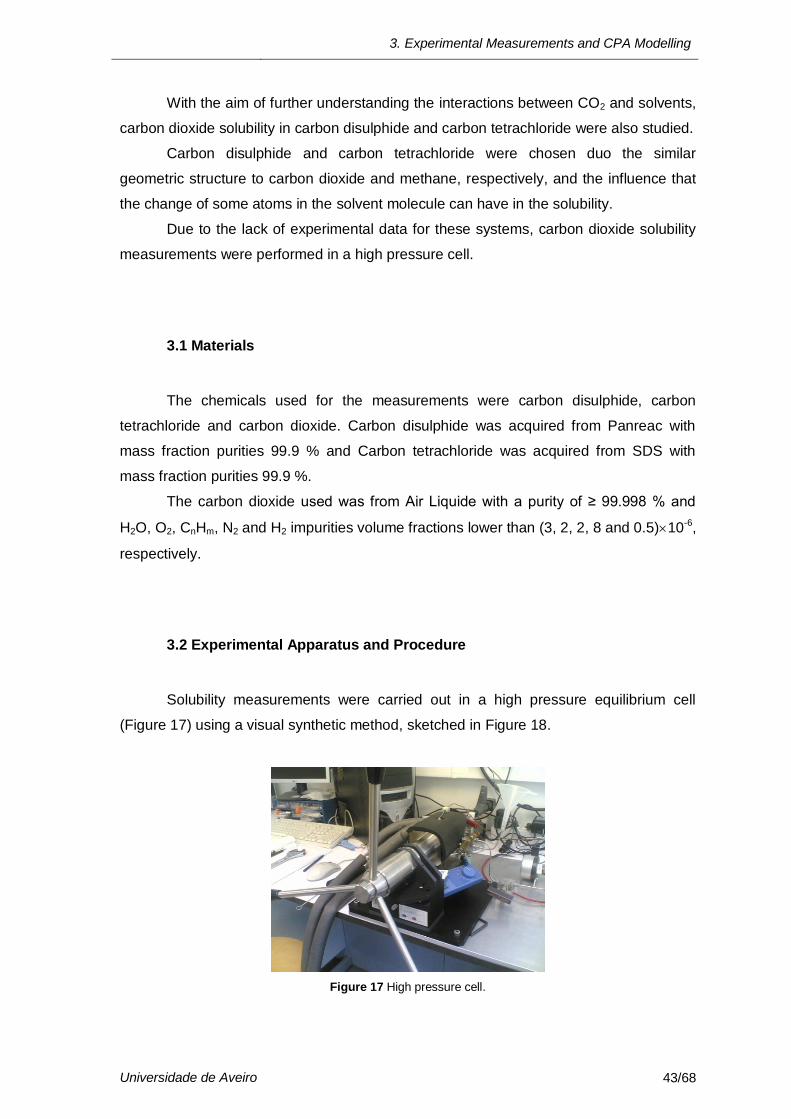
3.2 Experimental Apparatus and Procedure
Solubility measurements were carried out in a high pressure equilibrium cell
(Figure 17) using a visual synthetic method, sketched in Figure 18.
Figure 17 High pressure cell.
Modelling the Carbon Dioxide Solubility with CPA EoS
44/68 Universidade de Aveiro
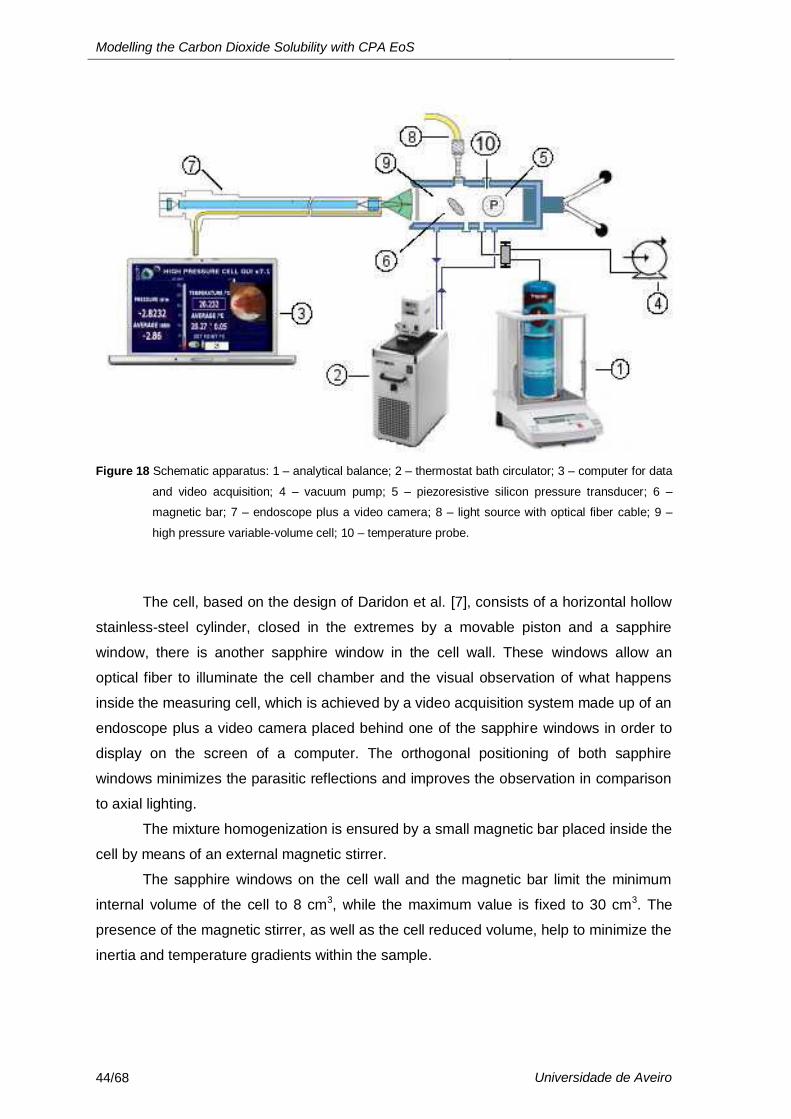
Figure 18 Schematic apparatus: 1 – analytical balance; 2 – thermostat bath circulator; 3 – computer for data
and video acquisition; 4 – vacuum pump; 5 – piezoresistive silicon pressure transducer; 6 –
magnetic bar; 7 – endoscope plus a video camera; 8 – light source with optical fiber cable; 9 –
high pressure variable-volume cell; 10 – temperature probe.
The cell, based on the design of Daridon et al. [7], consists of a horizontal hollow
stainless-steel cylinder, closed in the extremes by a movable piston and a sapphire
window, there is another sapphire window in the cell wall. These windows allow an
optical fiber to illuminate the cell chamber and the visual observation of what happens
inside the measuring cell, which is achieved by a video acquisition system made up of an
endoscope plus a video camera placed behind one of the sapphire windows in order to
display on the screen of a computer. The orthogonal positioning of both sapphire
windows minimizes the parasitic reflections and improves the observation in comparison
to axial lighting.
The mixture homogenization is ensured by a small magnetic bar placed inside the
cell by means of an external magnetic stirrer.
The sapphire windows on the cell wall and the magnetic bar limit the minimum
internal volume of the cell to 8 cm3, while the maximum value is fixed to 30 cm3. The
presence of the magnetic stirrer, as well as the cell reduced volume, help to minimize the
inertia and temperature gradients within the sample.
3. Experimental Measurements and CPA Modelling
Universidade de Aveiro 45/68
The cell is thermostatized by circulating a heat-carrier fluid, thermo-regulated with
a temperature stability of ±0.01 K by means of a thermostat bath circulator (Julabo MC),
through three flow lines directly managed into the cell. The temperature is measured with
a high precision thermometer, Model PN 5207 with an accuracy of 0.01 K, connected to
a calibrated platinum resistance inserted inside the cell close to the sample.
The pressure is measured by a piezoresistive silicon pressure transducer (Kulite)
fixed directly inside the cell to reduce dead volumes, that was previously calibrated and
certified by an independent laboratory with IPAC accreditation, following the EN 837-1
standard and with accuracy better than 0.2 %.
A fixed amount of liquid was introduced inside the cell and the exact mass
introduced is determined by weighting the liquid holder during its introduction with a
precision balance (Sartorius) with an accuracy of 1 mg.
The CO2 was introduced under pressure from an aluminum reservoir tank. Its
mass was measured with the precision balance by weighing the reservoir tank while
filling and introduced into the measuring cell by means of a flexible high pressure
capillary.
After preparation of a mixture of known composition at the desired temperature at
low pressure was reached, the pressure was then slowly increased at constant
temperature until the system becomes monophasic. The pressure at which the last
bubble disappears represents the equilibrium pressure (bubble pressure) for the fixed
temperature.
3.3 Experimental Data
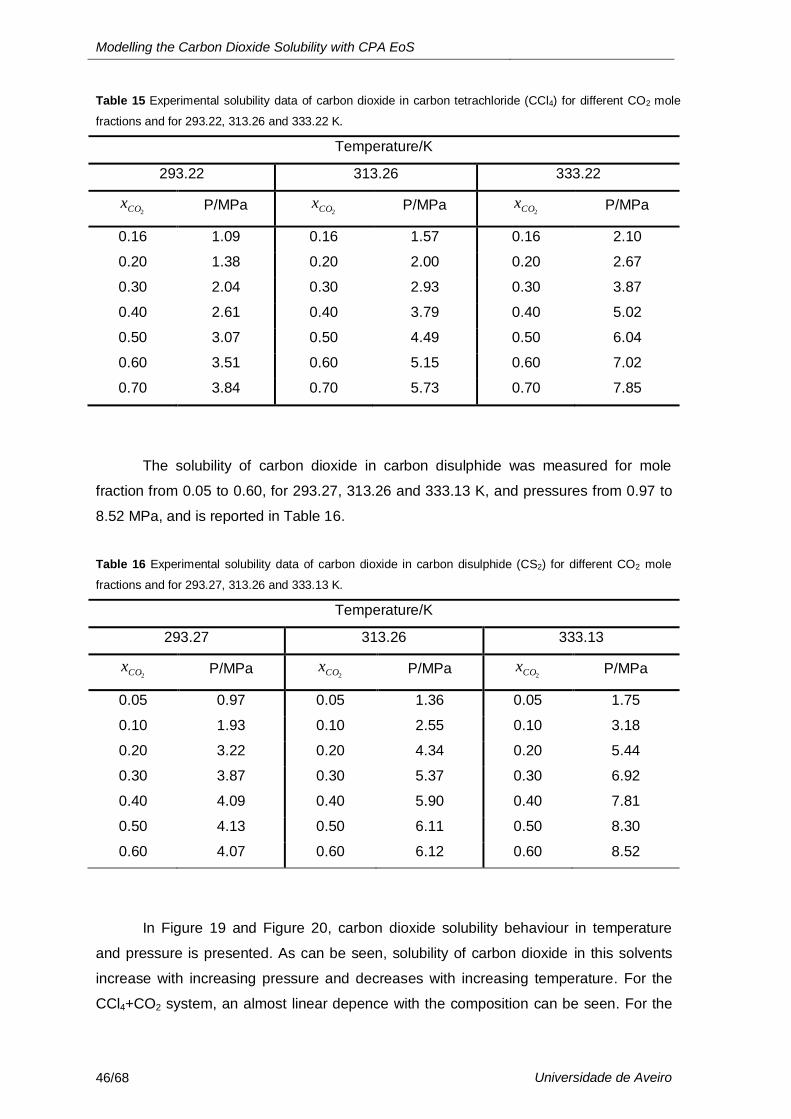
The solubility of carbon dioxide in carbon tetrachloride was measured for mole
fraction from 0.16 to 0.70, for 293.22, 313.26 and 333.22 K, and pressures from 1.09 to
7.85 MPa, and is reported in Table 15.
Modelling the Carbon Dioxide Solubility with CPA EoS
46/68 Universidade de Aveiro
Table 15 Experimental solubility data of carbon dioxide in carbon tetrachloride (CCl4) for different CO2 mole
fractions and for 293.22, 313.26 and 333.22 K.
Temperature/K
293.22 313.26 333.22
2COx P/MPa 2COx P/MPa
2COx P/MPa
0.16 1.09 0.16 1.57 0.16 2.10
0.20 1.38 0.20 2.00 0.20 2.67
0.30 2.04 0.30 2.93 0.30 3.87
0.40 2.61 0.40 3.79 0.40 5.02
0.50 3.07 0.50 4.49 0.50 6.04
0.60 3.51 0.60 5.15 0.60 7.02
0.70 3.84 0.70 5.73 0.70 7.85
The solubility of carbon dioxide in carbon disulphide was measured for mole
fraction from 0.05 to 0.60, for 293.27, 313.26 and 333.13 K, and pressures from 0.97 to
8.52 MPa, and is reported in Table 16.
Table 16 Experimental solubility data of carbon dioxide in carbon disulphide (CS2) for different CO2 mole
fractions and for 293.27, 313.26 and 333.13 K.
Temperature/K
293.27 313.26 333.13
2COx P/MPa 2COx P/MPa
2COx P/MPa
0.05 0.97 0.05 1.36 0.05 1.75
0.10 1.93 0.10 2.55 0.10 3.18
0.20 3.22 0.20 4.34 0.20 5.44
0.30 3.87 0.30 5.37 0.30 6.92
0.40 4.09 0.40 5.90 0.40 7.81
0.50 4.13 0.50 6.11 0.50 8.30
0.60 4.07 0.60 6.12 0.60 8.52
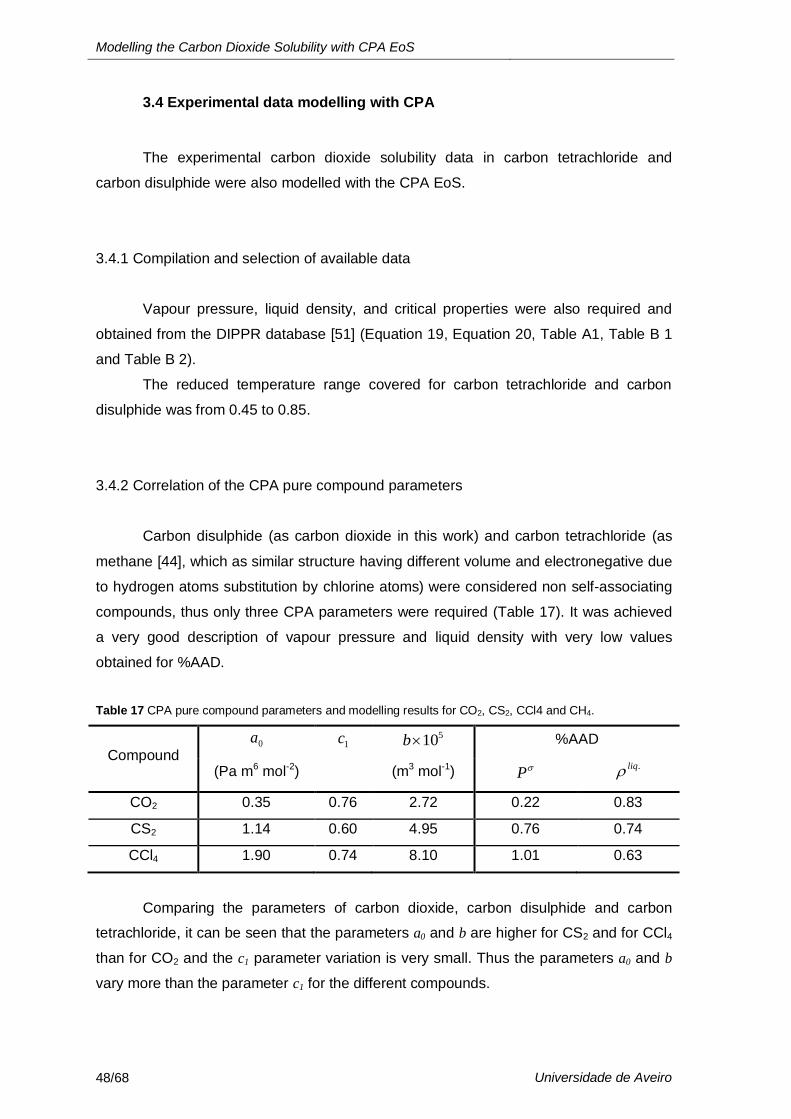
In Figure 19 and Figure 20, carbon dioxide solubility behaviour in temperature
and pressure is presented. As can be seen, solubility of carbon dioxide in this solvents
increase with increasing pressure and decreases with increasing temperature. For the
CCl4+CO2 system, an almost linear depence with the composition can be seen. For the
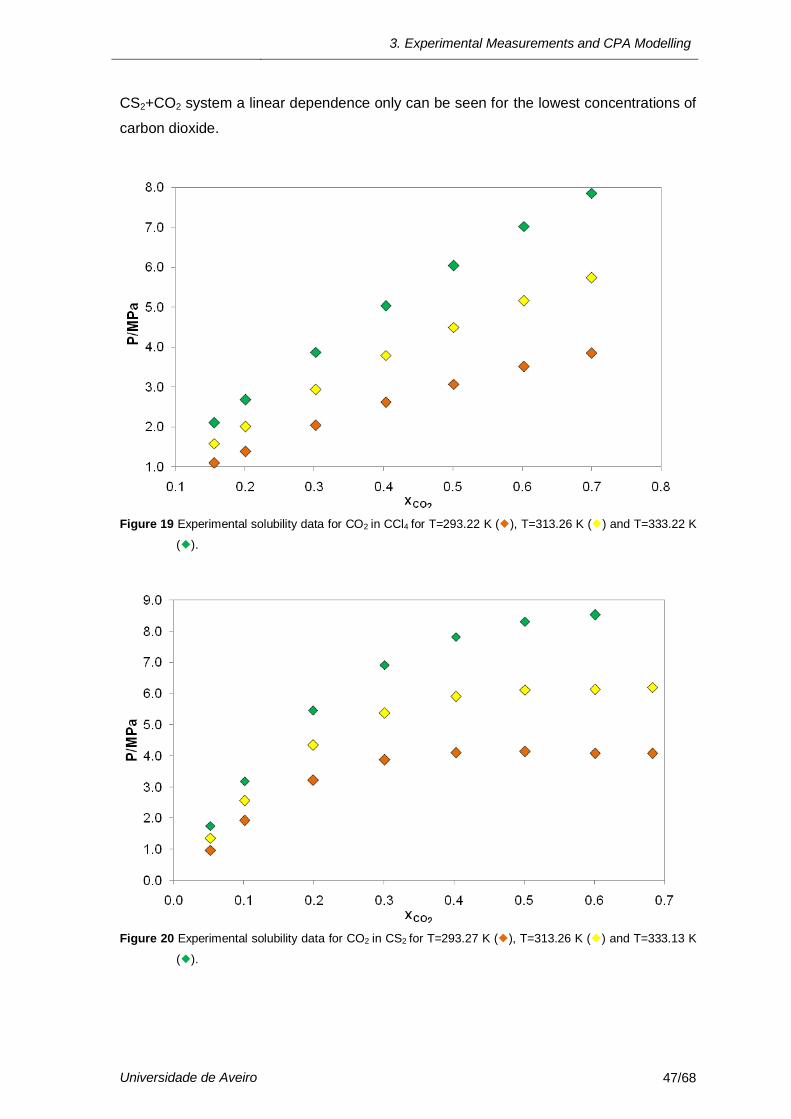
3. Experimental Measurements and CPA Modelling
Universidade de Aveiro 47/68
CS2+CO2 system a linear dependence only can be seen for the lowest concentrations of
carbon dioxide.
Figure 19 Experimental solubility data for CO2 in CCl4 for T=293.22 K (), T=313.26 K () and T=333.22 K
().
Figure 20 Experimental solubility data for CO2 in CS2 for T=293.27 K (), T=313.26 K () and T=333.13 K
().
Modelling the Carbon Dioxide Solubility with CPA EoS
48/68 Universidade de Aveiro
3.4 Experimental data modelling with CPA
The experimental carbon dioxide solubility data in carbon tetrachloride and
carbon disulphide were also modelled with the CPA EoS.
3.4.1 Compilation and selection of available data
Vapour pressure, liquid density, and critical properties were also required and
obtained from the DIPPR database [51] (Equation 19, Equation 20, Table A1, Table B 1
and Table B 2).
The reduced temperature range covered for carbon tetrachloride and carbon
disulphide was from 0.45 to 0.85.
3.4.2 Correlation of the CPA pure compound parameters
Carbon disulphide (as carbon dioxide in this work) and carbon tetrachloride (as
methane [44], which as similar structure having different volume and electronegative due
to hydrogen atoms substitution by chlorine atoms) were considered non self-associating
compounds, thus only three CPA parameters were required (Table 17). It was achieved
a very good description of vapour pressure and liquid density with very low values
obtained for %AAD.
Table 17 CPA pure compound parameters and modelling results for CO2, CS2, CCl4 and CH4.
Compound 0a
1c 510b %AAD
(Pa m6 mol-2) (m3 mol-1) P .liq
CO2 0.35 0.76 2.72 0.22 0.83
CS2 1.14 0.60 4.95 0.76 0.74
CCl4 1.90 0.74 8.10 1.01 0.63
Comparing the parameters of carbon dioxide, carbon disulphide and carbon
tetrachloride, it can be seen that the parameters a0 and b are higher for CS2 and for CCl4
than for CO2 and the c1 parameter variation is very small. Thus the parameters a0 and b
vary more than the parameter c1 for the different compounds.
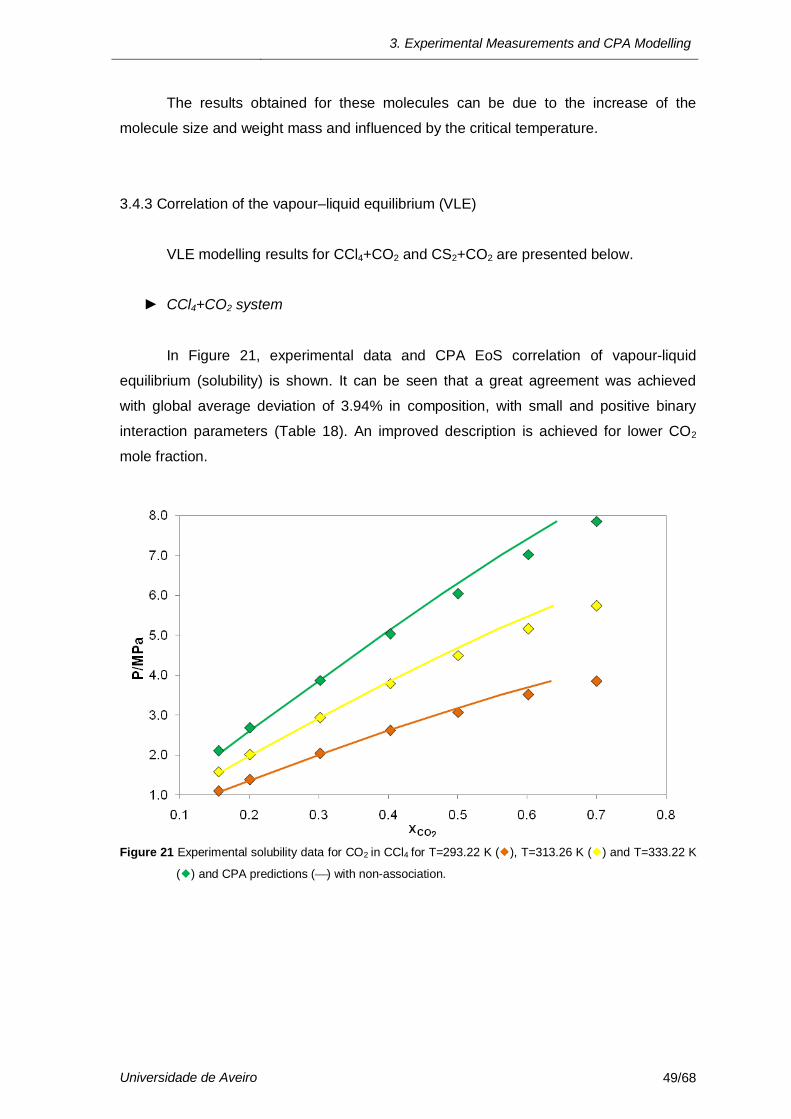
3. Experimental Measurements and CPA Modelling
Universidade de Aveiro 49/68
The results obtained for these molecules can be due to the increase of the
molecule size and weight mass and influenced by the critical temperature.
3.4.3 Correlation of the vapour–liquid equilibrium (VLE)
VLE modelling results for CCl4+CO2 and CS2+CO2 are presented below.
► CCl4+CO2 system
In Figure 21, experimental data and CPA EoS correlation of vapour-liquid
equilibrium (solubility) is shown. It can be seen that a great agreement was achieved
with global average deviation of 3.94% in composition, with small and positive binary
interaction parameters (Table 18). An improved description is achieved for lower CO2
mole fraction.
Figure 21 Experimental solubility data for CO2 in CCl4 for T=293.22 K (), T=313.26 K () and T=333.22 K
() and CPA predictions () with non-association.
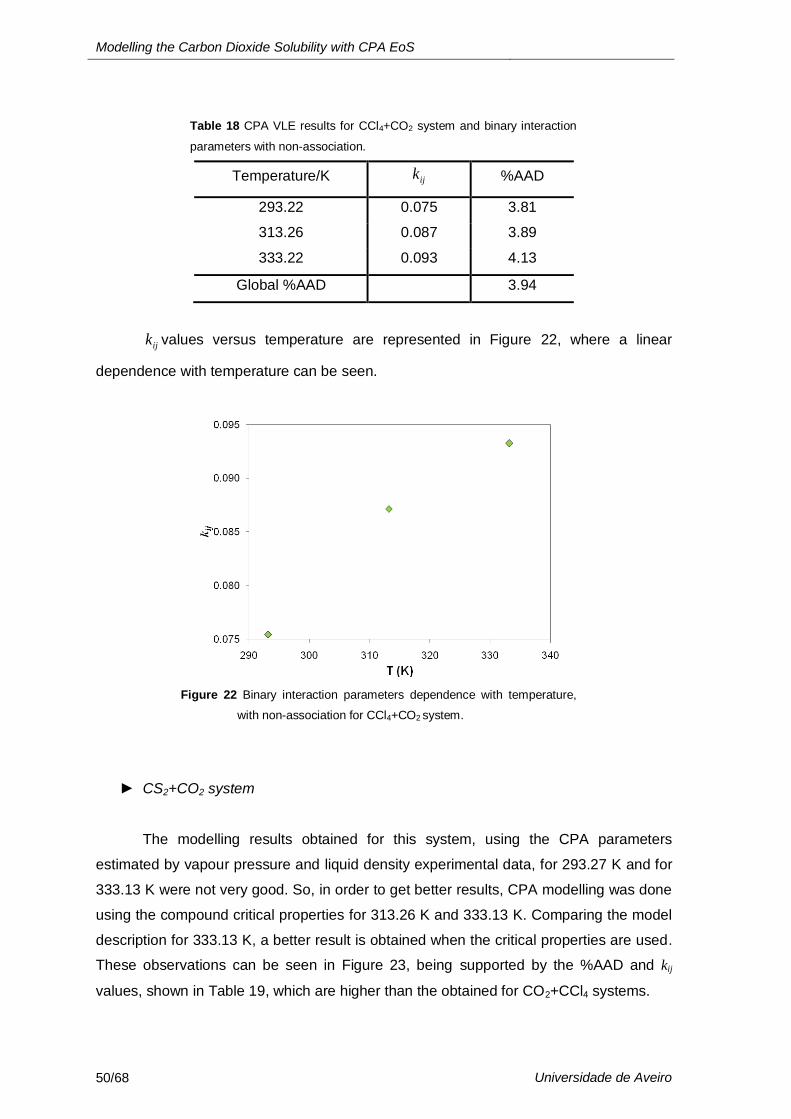
Modelling the Carbon Dioxide Solubility with CPA EoS
50/68 Universidade de Aveiro
Table 18 CPA VLE results for CCl4+CO2 system and binary interaction
parameters with non-association.
Temperature/K ijk %AAD
293.22 0.075 3.81
313.26 0.087 3.89
333.22 0.093 4.13
Global %AAD 3.94
ijk values versus temperature are represented in Figure 22, where a linear
dependence with temperature can be seen.
Figure 22 Binary interaction parameters dependence with temperature,
with non-association for CCl4+CO2 system.
► CS2+CO2 system
The modelling results obtained for this system, using the CPA parameters
estimated by vapour pressure and liquid density experimental data, for 293.27 K and for
333.13 K were not very good. So, in order to get better results, CPA modelling was done
using the compound critical properties for 313.26 K and 333.13 K. Comparing the model
description for 333.13 K, a better result is obtained when the critical properties are used.
These observations can be seen in Figure 23, being supported by the %AAD and kij
values, shown in Table 19, which are higher than the obtained for CO2+CCl4 systems.
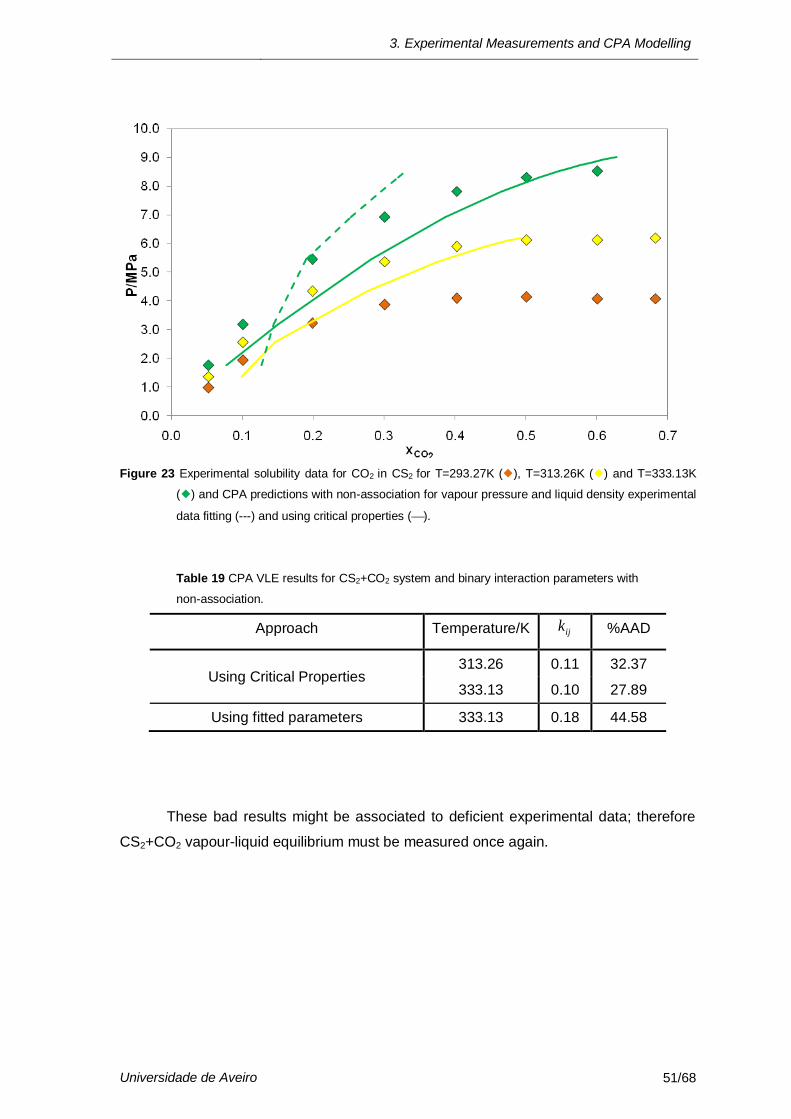
3. Experimental Measurements and CPA Modelling
Universidade de Aveiro 51/68
Figure 23 Experimental solubility data for CO2 in CS2 for T=293.27K (), T=313.26K () and T=333.13K
() and CPA predictions with non-association for vapour pressure and liquid density experimental
data fitting (---) and using critical properties ().
Table 19 CPA VLE results for CS2+CO2 system and binary interaction parameters with
non-association.
Approach Temperature/K ijk %AAD
Using Critical Properties 313.26 0.11 32.37
333.13 0.10 27.89
Using fitted parameters 333.13 0.18 44.58
These bad results might be associated to deficient experimental data; therefore
CS2+CO2 vapour-liquid equilibrium must be measured once again.


4. CONCLUSIONS

4. Conclusions
Universidade de Aveiro 55/68
Due to environmental issues originated by carbon dioxide emissions, its capture
has become critical and the processes employed are being improved and new processes
developed.
Ionic liquids are one of the new sorbents investigated for carbon dioxide capture,
being the solubility of carbon dioxide in some of these fluids higher than in conventional
solvents. Another important improvement obtained by using these solvents, due to their
negligible vapour pressure, is the possible replacement of volatile organic compounds
(VOCs) which are prejudicial to Man and the environment.
Due to the increasing utilization of ionic liquids in chemical and industrial
processes, it is necessary to develop correlations and predictive models able to describe
behaviours and properties.
Several models have already been applied to describe vapour-liquid equilibrium
data of carbon dioxide and ionic liquids systems, being for the first time, in this work, the
Cubic Plus Association equation of state applied (CPA EoS), where 1A, 2B and 4C
association schemes and non-association were studied.
CPA parameters were estimated by fitting vapour pressure and liquid density
experimental data for the [Cnmim][NTf2] ionic liquids selected and carbon dioxide and
good results were achieved with global deviation in vapour pressure and liquid density
inferior to 1% when association is considered for ionic liquids.
[C2mim][NTf2]+CO2 and [C4mim][NTf2] +CO2 vapour-liquid experimental data were
modelled and successful results were achieved, considering carbon dioxide a non-
associating compound and the ionic liquids as non associating and auto associating
compounds (scheme 2B), with global deviations in composition inferior to 20%. The
global deviation difference obtained for both cases is very low thus the use of the
association does not improve the performance of the CPA EoS. A good description of
vapour-liquid equilibrium data of the systems studied was also possible with a single
temperature independent binary interaction parameter.
In addition, carbon dioxide solubility in carbon disulphide and in carbon
tetrachloride were measured in a high pressure cell and also modelled with the CPA
EoS. Carbon dioxide solubility increase with increasing pressure and decreases with
increasing temperature, and was found to be higher in carbon tetrachloride than in
carbon disulphide. The CPA modelling results of the CO2+CCl4 system achieved had a
very good agreement with the experimental data, with global deviations in carbon dioxide
composition equal to 3.94%, but for the CO2+CS2 system results were not that good,
being necessary another approach, with better results, that is the modelling using the
critical properties.
Modelling the Carbon Dioxide Solubility with CPA EoS
56/68 Universidade de Aveiro
Due to the very satisfactory results obtained, the CPA EoS is a useful and
satisfactory model to accurately describe the vapour-liquid equilibrium of CO2 systems.
Future work:
CPA pure compound parameters optimization (try to reduce its values) and use
constant values for them for all the ionic liquids, to obtain improved modelling results with
CPA.
Vapour-liquid equilibrium experimental data modelling with constant CPA pure
compound parameters and temperature independent binary interaction parameters for
the [Cnmim][NTf2] ionic liquid family.
SRK EoS (reduced CPA EoS, using the critical properties) modelling with the
aim to compare the results obtained by vapour pressure and liquid density experimental
data fitting and the ones by the use of the critical properties.
Phase equilibrium measurements and CPA modelling for other carbon dioxide +
ionic liquids systems in order to find selective ionic liquids, or ionic liquids mixtures, that
improve carbon dioxide solubility.
Additional solubility measurements of carbon dioxide and carbon disulphide to
confirm the experimental data presented in this work, and its modelling.
Solubility measurements of other compounds usually associated to gas mixtures
in ionic liquids and carbon dioxide, to obtain more useful data for chemical and industrial
processes.

5. BIBLIOGRAPHIC REFERENCES

5. Bibliographic References
Universidade de Aveiro 59/68
1. Hardy, J.T., Climate Change: Causes, Effects and Solutions. 2003, Chichester:
Wiley
2. Abu-Khader, M.M., Recent progress in CO2 capture/sequestration: A review.
Energy Sources Part a-Recovery Utilization and Environmental Effects, 2006.
28(14): p. 1261-1279.
3. Figueroa, J.D., Fout, T., Plasynski, S., McIlvried, H., and Srivastava, R.D.,
Advances in CO2 capture technology - The US Department of Energy's Carbon
Sequestration Program. International Journal of Greenhouse Gas Control, 2008.
2(1): p. 9-20.
4. Plasynski, S.I., Litynski, J.T., McIlvried, H.G., and Srivastava, R.D., Progress and
New Developments in Carbon Capture and Storage. Critical Reviews in Plant
Sciences, 2009. 28(3): p. 123-138.
5. Perinline, H.W., Luebke, D.R., Jones, K.L., Myers, C.R., Morsi, B.I., Heintz, Y.J.,
and Ilconich, J.B., Progress in carbon dioxide capture and separation research for
gasification-based power generation point sources. Fuel Processing Technology,
2008. 89(9): p. 897-907.
6. El Seoud, O.A., Koschella, A., Fidale, L.C., Dorn, S., and Heinze, T., Applications
of ionic liquids in carbohydrate chemistry: A window of opportunities.
Biomacromolecules, 2007. 8(9): p. 2629-2647.
7. Carvalho, P.J., Alvarez, V.H., Machado, J.J.B., Pauly, J., Daridon, J.L., Marrucho,
I.M., Aznar, M., and Coutinho, J.A.P., High pressure phase behavior of carbon
dioxide in 1-alkyl-3-methylimidazolium bis(trifluoromethylsulfonyl)imide ionic
liquids. Journal of Supercritical Fluids, 2009. 48(2): p. 99-107.
8. Stracke, M.P., Migliorini, M.V., Lissner, E., Schrekker, H.S., Dupont, J., and
Goncalves, R.S., Imidazolium ionic liquids as electrolytes for manganese dioxide
free Leclanche batteries. Applied Energy, 2009. 86(9): p. 1512-1516.
9. Lu, J.M., Yan, F., and Texter, J., Advanced applications of ionic liquids in polymer
science. Progress in Polymer Science, 2009. 34(5): p. 431-448.
10. Wuebbles, D.J.E., J., Primer on Green Gases. 1991, Michigan: Lewis
Publishers,Inc.
Modelling the Carbon Dioxide Solubility with CPA EoS
60/68 Universidade de Aveiro
11. Watts, R.G., ed. Engineering Response to Global Climate Change: Planning a
Research and Development Agenda. 2000, CRC Press LLC: United States of
America.
12. Kondratyev, K.Y.C., A. P., Observing Global Climate Change. 1998, St.
Petersburg: Taylor & Francis Ltd.
13. Burroughs, W.J., Climate Change: A multidisciplinary Approach. 2007,
Cambridge: University Press.
14. I.P.o.C.C., http://www.ipcc.ch/graphics/index.htm.(14-05-09)
15. EIA, 2006, http://www.eia.doe.gov/oiaf/1605/ggrpt/carbon.html#total. (13-05-09)
16. http://www.epa.gov/climatechange/emissions/co2_human.html. (13-05-09)
17. Yang, H.Q., Xu, Z.H., Fan, M.H., Gupta, R., Slimane, R.B., Bland, A.E., and
Wright, I., Progress in carbon dioxide separation and capture: A review. Journal
of Environmental Sciences-China, 2008. 20(1): p. 14-27.
18. New CO2 capture technology advances. Chemical & Engineering News, 2008.
86(37): p. 30-30.
19. Gibbins, J. and Chalmers, H., Carbon capture and storage. Energy Policy, 2008.
36(12): p. 4317-4322.
20. Lackner, K.S., A guide to CO2 sequestration. Science, 2003. 300(5626): p. 1677-
1678.
21. CCP, 2008, http://www.co2captureproject.org/about_capture.html. (23-05-09)
22. Desideri, U., Arcioni, L., and Tozzi, M., Feasibility study for a carbon capture and
storage project in northern Italy. International Journal of Energy Research, 2008.
32(12): p. 1175-1183.
23. Paul, J.P., C., ed. Carbon Dioxide Chemistry: Environmental Issues. 1994, The
Royal Society of Chemistry: Cambridge.
5. Bibliographic References
Universidade de Aveiro 61/68
24. Karakatsani, E.K., Economou, L.G., Kroon, M.C., Peters, C.J., and Witkamp,
G.J., TPC-PSAFT modeling of gas solubility in imidazolium-based ionic liquids.
Journal of Physical Chemistry C, 2007. 111: p. 15487-15492.
25. Pratas, M.J., Medição da solubilidade de gases em líquidos iónicos com
microbalança de cristais de quartzo, in Departamento de Química., MSc Thesis,
2007, Universidade de Aveiro: Aveiro.
26. Anderson, J.L., Dixon, J.K., and Brennecke, J.F., Solubility of CO2,CH4, C2H6,
C2H4, O-2, and N-2 in 1-hexyl-3-methylpyridinium
bis(trifluoromethylsulfonyl)imide: Comparison to other ionic liquids. Accounts of
Chemical Research, 2007. 40: p. 1208-1216.
27. Krossing, I., Slattery, J.M., Daguenet, C., Dyson, P.J., Oleinikova, A., and
Weingartner, H., Why are ionic liquids liquid? A simple explanation based on
lattice and solvation energies. Journal of the American Chemical Society, 2006.
128(41): p. 13427-13434.
28. Wang, T.F., Peng, C.J., Liu, H.L., and Hu, Y., Description of the pVT behavior of
ionic liquids and the solubility of gases in ionic liquids using an equation of state.
Fluid Phase Equilibria, 2006. 250(1-2): p. 150-157.
29. Shiflett, M.B., Kasprzak, D.J., Junk, C.P., and Yokozeki, A., Phase behavior of
{carbon dioxide plus [bmim][Ac]} mixtures. Journal of Chemical Thermodynamics,
2008. 40(1): p. 25-31.
30. Dong, W.S., Lin, F.Q., Liu, C.L., and Li, M.Y., Synthesis of ZrO2 nanowires by
ionic-liquid route. Journal of Colloid and Interface Science, 2009. 333(2): p. 734-
740.
31. Andreu, J.S. and Vega, L.F., Capturing the solubility Behavior of CO2 in ionic
liquids by a simple model. Journal of Physical Chemistry C, 2007. 111: p. 16028-
16034.
32. Andreu, J.S. and Vega, L.F., Modeling the Solubility Behavior of CO2, H-2, and
Xe in [C-n-mim][Tf2N] Ionic Liquids. Journal of Physical Chemistry B, 2008.
112(48): p. 15398-15406.
Modelling the Carbon Dioxide Solubility with CPA EoS
62/68 Universidade de Aveiro
33. Couling, D.J., Bernot, R.J., Docherty, K.M., Dixon, J.K., and Maginn, E.J.,
Assessing the factors responsible for ionic liquid toxicity to aquatic organisms via
quantitative structure-property relationship modeling. Green Chemistry, 2006.
8(1): p. 82-90.
34. Freire, M.G., Ventura, S.P.M., Santos, L., Marrucho, I.M., and Coutinho, J.A.P.,
Evaluation of COSMO-RS for the prediction of LLE and VLE of water and ionic
liquids binary systems. Fluid Phase Equilibria, 2008. 268(1-2): p. 74-84.
35. Raeissi, S. and Peters, C.J., A potential ionic liquid for CO2-separating gas
membranes: selection and gas solubility studies. Green Chemistry, 2009. 11(2):
p. 185-192.
36. Muldoon, M.J., Aki, S., Anderson, J.L., Dixon, J.K., and Brennecke, J.F.,
Improving carbon dioxide solubility in ionic liquids. Journal of Physical Chemistry
B, 2007. 111(30): p. 9001-9009.
37. Kroon, M.C., Karakatsani, E.K., Economou, I.G., Witkamp, G.J., and Peters, C.J.,
Modeling of the carbon dioxide solubility in imidazolium-based ionic liquids with
the tPC-PSAFT equation of state. Journal of Physical Chemistry B, 2006.
110(18): p. 9262-9269.
38. Zhang, X.C., Liu, Z.P., and Wang, W.C., Screening of ionic liquids to capture
CO2 by COSMO-RS and experiments. Aiche Journal, 2008. 54(10): p. 2717-
2728.
39. Wang, T.F., Peng, C.J., Liu, H.L., Hu, Y., and Jiang, J.W., Equation of state for
the vapor-liquid equilibria of binary systems containing imidazolium-based ionic
liquids. Industrial & Engineering Chemistry Research, 2007. 46(12): p. 4323-
4329.
40. Shiflett, M.B. and Yokozeki, A., Solubility of CO2 in room temperature ionic liquid
[hmim][Tf2N]. Journal of Physical Chemistry B, 2007. 111(8): p. 2070-2074.
41. Breure, B., Bottini, S.B., Witkamp, G.J., and Peters, C.J., Thermodynamic
modeling of the phase behavior of binary systems of ionic liquids and carbon
dioxide with the group contribution equation of state. Journal of Physical
Chemistry B, 2007. 111(51): p. 14265-14270.
5. Bibliographic References
Universidade de Aveiro 63/68
42. Yuan, X.L., Zhang, S.J., Liu, J., and Lu, X.M., Solubilities of CO2 in hydroxyl
ammonium ionic liquids at elevated pressures. Fluid Phase Equilibria, 2007.
257(2): p. 195-200.
43. Kontogeorgis, G.M., Michelsen, M.L., Folas, G.K., Derawi, S., von Solms, N., and
Stenby, E.H., Ten years with the CPA (Cubic-Plus-Association) equation of state.
Part 1. Pure compounds and self-associating systems. Industrial & Engineering
Chemistry Research, 2006. 45(14): p. 4855-4868.
44. Oliveira, M.B., Coutinho, J.A.P., and Queimada, A.J., Mutual solubilities of
hydrocarbons and water with the CPA EoS. Fluid Phase Equilibria, 2007. 258(1):
p. 58-66.
45. Oliveira, V.L.H., Modelling the Aqueous Solubility of PAHs with CPA EoS, in
Departamento de Química., MSc Thesis, 2008, Universidade de Aveiro: Aveiro.
46. Fu, Y.H. and Sandler, S.I., A simplified SAFTt equation of state for associating
compounds and mixtures. Industrial & Engineering Chemistry Research, 1995.
34(5): p. 1897-1909.
47. Suresh, S.J. and Elliott, J.R., Multiphase equilibrium-analysis via a generalized
equation of state for associating mixtures. Industrial & Engineering Chemistry
Research, 1992. 31(12): p. 2783-2794.
48. Oliveira, M.B., Teles, A.R.R., Queimada, A.J., and Coutinho, J.A.P., Phase
equilibria of glycerol containing systems and their description with the Cubic-Plus-
Association (CPA) Equation of State. Fluid Phase Equilibria, 2009. 280 (1-2):p.
22-29.
49. Oliveira, M.B., Pratas, M.J., Marrucho, I.M., Queimada, A.J., and Coutinho,
J.A.P., Description of the Mutual Solubilities of Fatty Acids and Water With the
CPA EoS. Aiche Journal, 2009. 55(6): p. 1604-1613.
50. Huang, S.H. and Radosz, M., Equation of State for small, large, polydisperse and
associating molecules. 1990. 29: p. 2284.
51. Design Institute for Physical Property Data, DIPPR Database. 1998, AIChE: New
York.

Modelling the Carbon Dioxide Solubility with CPA EoS
64/68 Universidade de Aveiro
52. Esperanca, J., Visak, Z.P., Plechkova, N.V., Seddon, K.R., Guedes, H.J.R., and
Rebelo, L.P.N., Density, speed of sound, and derived thermodynamic properties
of ionic liquids over an extended pressure range. 4. [C(3)mim][NTf2] and
[C(5)mim][NTf2]. Journal of Chemical and Engineering Data, 2006. 51(6): p.
2009-2015.
53. de Azevedo, R.G., Esperanca, J., Szydlowski, J., Visak, Z.P., Pires, P.F.,
Guedes, H.J.R., and Rebelo, L.P.N., Thermophysical and thermodynamic
properties of ionic liquids over an extended pressure range: [bmim][NTf2] and
[hmim][NTf2]. Journal of Chemical Thermodynamics, 2005. 37(9): p. 888-899.
54. Gardas, R.L., Freire, M.G., Carvalho, P.J., Marrucho, I.M., Fonseca, I.M.A.,
Ferreira, A.G.M., and Coutinho, J.A.P., P rho T measurements of imidazolium-
based ionic liquids. Journal of Chemical and Engineering Data, 2007. 52: p.
1881-1888.
55. Valderrama, J.O., Sanga, W.W., and Lazzus, J.A., Critical properties, normal
boiling temperature, and acentric factor of another 200 ionic liquids. Industrial &
Engineering Chemistry Research, 2008. 47(4): p. 1318-1330.
56. Valderrama, J.O. and Robles, P.A., Critical properties, normal boiling
temperatures, and acentric factors of fifty ionic liquids. Industrial & Engineering
Chemistry Research, 2007. 46(4): p. 1338-1344.
57. Oliveira, M.B., Marrucho, I.M., Coutinho, J.A.P., and Queimada, A.J., Surface
tension of chain molecules through a combination of the gradient theory with the
CPA EoS. Fluid Phase Equilibria, 2008. 267(1): p. 83-91.

APPENDIX

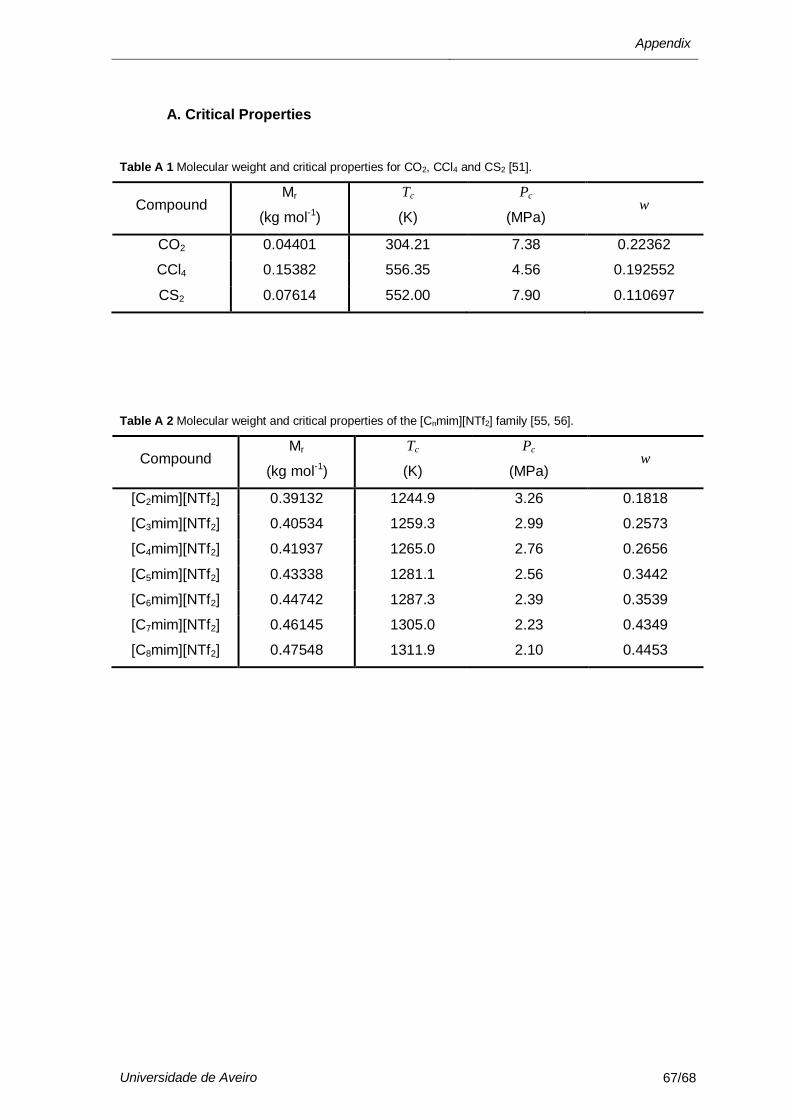
Appendix
Universidade de Aveiro 67/68
A. Critical Properties
Table A 1 Molecular weight and critical properties for CO2, CCl4 and CS2 [51].
Compound Mr
(kg mol-1)
Tc
(K)
Pc
(MPa) w
CO2 0.04401 304.21 7.38 0.22362
CCl4 0.15382 556.35 4.56 0.192552
CS2 0.07614 552.00 7.90 0.110697
Table A 2 Molecular weight and critical properties of the [Cnmim][NTf2] family [55, 56].
Compound Mr
(kg mol-1)
Tc
(K)
Pc
(MPa) w
[C2mim][NTf2] 0.39132 1244.9 3.26 0.1818
[C3mim][NTf2] 0.40534 1259.3 2.99 0.2573
[C4mim][NTf2] 0.41937 1265.0 2.76 0.2656
[C5mim][NTf2] 0.43338 1281.1 2.56 0.3442
[C6mim][NTf2] 0.44742 1287.3 2.39 0.3539
[C7mim][NTf2] 0.46145 1305.0 2.23 0.4349
[C8mim][NTf2] 0.47548 1311.9 2.10 0.4453
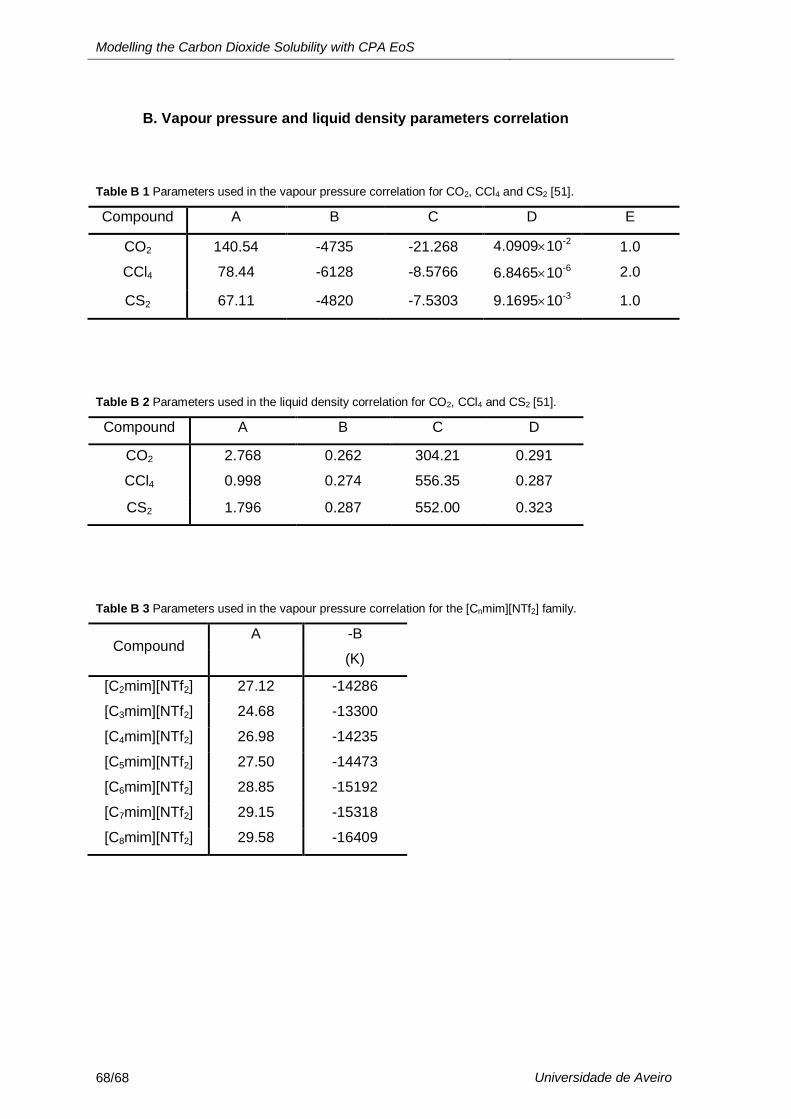
Modelling the Carbon Dioxide Solubility with CPA EoS
68/68 Universidade de Aveiro
B. Vapour pressure and liquid density parameters correlation
Table B 1 Parameters used in the vapour pressure correlation for CO2, CCl4 and CS2 [51].
Compound A B C D E
CO2
CCl4
140.54
78.44
-4735
-6128
-21.268
-8.5766
4.090910-2
6.846510-6
1.0
2.0
CS2 67.11 -4820 -7.5303 9.169510-3 1.0
Table B 2 Parameters used in the liquid density correlation for CO2, CCl4 and CS2 [51].
Compound A B C D
CO2
CCl4
2.768
0.998
0.262
0.274
304.21
556.35
0.291
0.287
CS2 1.796 0.287 552.00 0.323
Table B 3 Parameters used in the vapour pressure correlation for the [Cnmim][NTf2] family.
Compound A -B
(K)
[C2mim][NTf2] 27.12 -14286
[C3mim][NTf2] 24.68 -13300
[C4mim][NTf2] 26.98 -14235
[C5mim][NTf2] 27.50 -14473
[C6mim][NTf2] 28.85 -15192
[C7mim][NTf2] 29.15 -15318
[C8mim][NTf2] 29.58 -16409