Embed Size (px)
Citation preview
An Overview of State Tax Revenue Models for Four Natural
Resource Extractive Industries
Prepared for
Center for Michigan
Ann Arbor, Michigan
Prepared by
Public Sector Consultants
Lansing, Michigan
www.pscinc.com

1
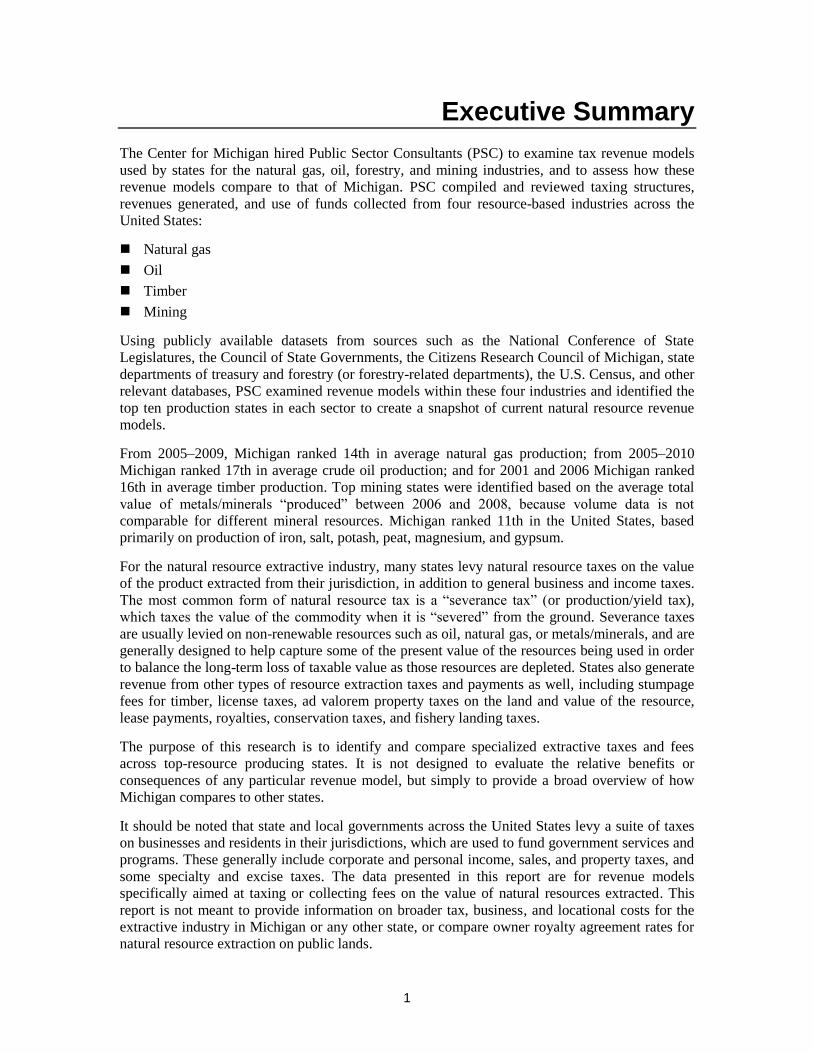
Executive Summary
The Center for Michigan hired Public Sector Consultants (PSC) to examine tax revenue models
used by states for the natural gas, oil, forestry, and mining industries, and to assess how these
revenue models compare to that of Michigan. PSC compiled and reviewed taxing structures,
revenues generated, and use of funds collected from four resource-based industries across the
United States:
Natural gas
Oil
Timber
Mining
Using publicly available datasets from sources such as the National Conference of State
Legislatures, the Council of State Governments, the Citizens Research Council of Michigan, state
departments of treasury and forestry (or forestry-related departments), the U.S. Census, and other
relevant databases, PSC examined revenue models within these four industries and identified the
top ten production states in each sector to create a snapshot of current natural resource revenue
models.
From 2005–2009, Michigan ranked 14th in average natural gas production; from 2005–2010
Michigan ranked 17th in average crude oil production; and for 2001 and 2006 Michigan ranked
16th in average timber production. Top mining states were identified based on the average total
value of metals/minerals “produced” between 2006 and 2008, because volume data is not
comparable for different mineral resources. Michigan ranked 11th in the United States, based
primarily on production of iron, salt, potash, peat, magnesium, and gypsum.
For the natural resource extractive industry, many states levy natural resource taxes on the value
of the product extracted from their jurisdiction, in addition to general business and income taxes.
The most common form of natural resource tax is a “severance tax” (or production/yield tax),
which taxes the value of the commodity when it is “severed” from the ground. Severance taxes
are usually levied on non-renewable resources such as oil, natural gas, or metals/minerals, and are
generally designed to help capture some of the present value of the resources being used in order
to balance the long-term loss of taxable value as those resources are depleted. States also generate
revenue from other types of resource extraction taxes and payments as well, including stumpage
fees for timber, license taxes, ad valorem property taxes on the land and value of the resource,
lease payments, royalties, conservation taxes, and fishery landing taxes.
The purpose of this research is to identify and compare specialized extractive taxes and fees
across top-resource producing states. It is not designed to evaluate the relative benefits or
consequences of any particular revenue model, but simply to provide a broad overview of how
Michigan compares to other states.
It should be noted that state and local governments across the United States levy a suite of taxes
on businesses and residents in their jurisdictions, which are used to fund government services and
programs. These generally include corporate and personal income, sales, and property taxes, and
some specialty and excise taxes. The data presented in this report are for revenue models
specifically aimed at taxing or collecting fees on the value of natural resources extracted. This
report is not meant to provide information on broader tax, business, and locational costs for the
extractive industry in Michigan or any other state, or compare owner royalty agreement rates for
natural resource extraction on public lands.
2
The tax rates presented in this report are nominal tax rates, not effective tax rates which take into
account incentives or other business tax breaks provided to the industry. While effective tax rates
present a truer picture of tax burden, they are not used in this report for two reasons: it was
difficult to consistently calculate an effective rate for natural resource taxes because of the vast
differences in how taxes are levied; and it was difficult to match the incentives and tax breaks
with the corresponding pool of revenue to which they were credited (e.g., severance, corporate
income, or property tax).
In this era of globalization and relatively high commodity prices, resource-based industries
continue to expand their activities and governments face the need to implement appropriate and
modern revenue structures. While Michigan is not currently among the top ten producing states
for any of these sectors, it is a strong player and largely in the top third of timber, mining, oil, and
natural gas producing states.
3
Types of Natural Resource Revenue Models
State and local governments across the United States levy a suite of taxes on businesses and
residents in their jurisdictions, which are used to fund government services and programs. These
generally include corporate and personal income, sales, and property taxes, and some specialty
and excise taxes. The business taxes are levied at various rates against commercial and industrial
businesses across most sectors.
In addition to general business and income taxes, the natural resource extractive industry is
subject to additional taxes and fees in many states. The most common natural resource-based
revenue streams for states include (but are not limited to) taxes, royalty and lease payments, and
license fees.
While this report focuses on severance and other natural resource tax systems that are levied by
states on the production of oil, natural gas, minerals, and timber, a brief description of other
natural resource revenue streams is included below.
Taxes
States impose several types of taxes on the natural resource extractive industry. The most
common is the “severance tax” (or production tax). Severance taxes are levied on the value or
quantity of the commodity when it is “severed” from the ground. In some states these are called
timber stumpage fees, conservation taxes, or fishery landing taxes.1 Severance taxes are usually
levied on resources such as oil, natural gas, timber, or metals/minerals, and are generally designed
to help capture some of the present value of the resources being used and to offset the cost to
other citizens of the facilities and services impacted by those activities (e.g., roads, public safety).
In addition, states levy ad valorem property taxes on all types of properties within their
jurisdiction. It is common for states that levy severance taxes to do so in lieu of property taxes,
but a small handful levy both severance and ad valorem taxes on the same resources (e.g., natural
gas reserves). States that do not impose severance taxes (or impose severance taxes only on
specific types of natural resources) generally levy property taxes on their natural resources. Ad
valorem property taxes are usually levied and collected at the local level, but the market value of
the resource (based on audited value of the reserve, net present value of potential income, or other
methodology) is often set by the state.
Royalty and Lease Payments
Royalties and lease payments are entirely different than taxes. When resource owners allow
private companies to explore, develop, and produce oil, natural gas, minerals, or timber on their
property, they will enter into a lease agreement with the developer company. The lease agreement
sets out the terms of the lease, including per-acre lease fees, boundaries, and royalty payments.
1 Judy Zelio and Lisa Houlihan, “State Energy Revenues Update,” National Conference of State
Legislatures. See:.http://www.ncsl.org/default.aspx?tabid=12674. (Accessed 8-23-11.)
4
Taxes are collected by governments acting as sovereign, and are collected to offset the costs of
extraction activities for the government and citizens of the state. Royalties, on the other hand, are
collected by the owners of a resource when the
lessee is sold the privilege of using the resource
and selling it for a profit.2 Royalties are usage-
based payments made by a licensee (in addition
to lease fees) to the state (or private owner) for
production of an asset, such as oil, natural gas,
mineral, or timber resources. Royalties can be
determined as a percentage of gross or net
sales derived from use of the asset or as a
fixed price per unit sold. Most leases allow
for the deduction of severance or other taxes
from royalty payments due to owners.
States collect royalty fees from natural resource
production activities on state lands, and usually
charge a per-acre lease fee and/or collect a lease
bonus payment. States make public lands
available for exploration and production through
auction and direct bid or negotiation, and royalty
fees vary based on how the land was made
available. Some states employ a flat percentage
for certain resources, and others negotiate leases
and royalty payments on a case by case basis. In
addition, states receive a share (currently 50
percent) of royalties collected by the federal
government for onshore oil, natural gas, and
mineral production that occurs on federal lands
within the states’ boundaries.
License Fees
License fees are flat or percentage fees to obtain a license to mine or harvest resources in the
state. These are usually based on income level of the license applicant or value of the resource,
and are generally used in lieu of a severance/production tax
2 Robert M. Nazzaro, “Information on Types of State Royalties, Number of Abandoned Mines, and Finan-
cial Assurances on BLM Land,” Testimony before the Subcommittee on Energy and Mineral Resources,
Committee on Natural Resources, House of Representatives, February 2009. Washington, D.C.: U.S. Gov-
ernment Accountability Office. See: http://www.gao.gov/new.items/d09429t.pdf . (Accessed 8-23-11.)
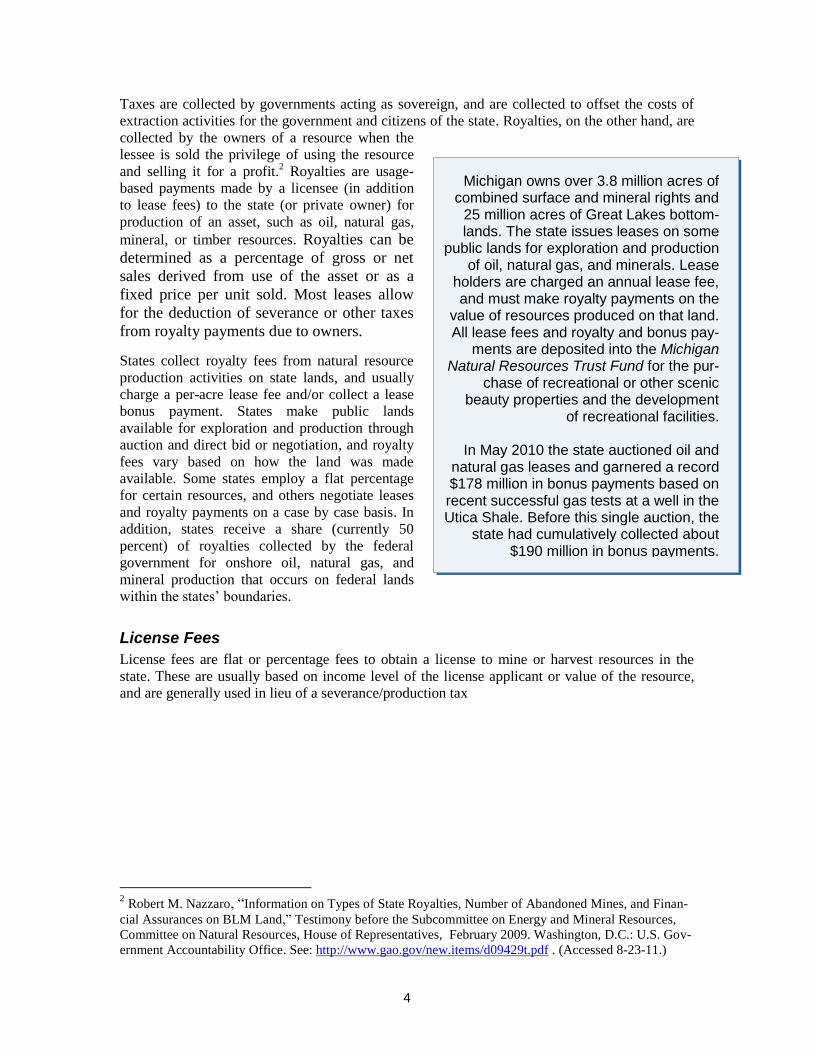
Michigan owns over 3.8 million acres of combined surface and mineral rights and
25 million acres of Great Lakes bottom-lands. The state issues leases on some
public lands for exploration and production of oil, natural gas, and minerals. Lease
holders are charged an annual lease fee, and must make royalty payments on the
value of resources produced on that land. All lease fees and royalty and bonus pay-
ments are deposited into the Michigan Natural Resources Trust Fund for the pur-
chase of recreational or other scenic beauty properties and the development
of recreational facilities.
In May 2010 the state auctioned oil and natural gas leases and garnered a record $178 million in bonus payments based on recent successful gas tests at a well in the Utica Shale. Before this single auction, the
state had cumulatively collected about $190 million in bonus payments.
5
Methodology
Using publicly available datasets from sources such as the National Conference of State
Legislatures, the Council of State Governments, the Citizens Research Council of Michigan, state
departments of treasury and forestry (or forestry-related departments), the U.S. Census, and other
relevant databases, PSC examined revenue models for natural gas, oil, timber, and mining
industry extraction activities, and identified the top ten production states in each sector to create a
snapshot of current natural resource revenue models.
This research is not designed to evaluate the relative benefits or consequences of any particular
revenue model, but simply to provide a broad overview of how Michigan compares to other
states. The data presented are for revenue models specifically aimed at taxing or collecting fees
on the value or quantity of natural resources extracted or “severed” from the earth. The report is
not meant to provide information on broader tax, business, and locational costs for the extractive
industry in Michigan or any other state.
The tax rates presented in this report are nominal tax rates, not effective tax rates which take into
account incentives or other business tax breaks provided to the industry. While effective tax rates
present a truer picture of tax burden, they are not used in this report for two reasons: it was
difficult to consistently calculate an effective rate for natural resources taxes because of the vast
differences in how states levy taxes; and it was difficult to match the incentives and tax breaks
with the corresponding pool of revenue to which they were credited (e.g., severance, corporate
income, or property tax).
Although states collect royalty payments from oil, gas, mineral, and timber leases on state lands,
and receive a share of federal royalty payments received by the U.S. government for these
activities on federal lands in their states, these payments are not included in this comparison of
natural resource tax revenue models because state royalty payment rates vary substantially by
resource type, geography, and method of lease.
Determination of Top Ten Production States
PSC identified the top ten states in terms of overall production of the relevant sectors: natural gas,
oil, timber, and minerals/metals. Figures 1–4 in this report show the makeup of the top natural
resource extracting states. Production figures for oil and natural gas were obtained from the
Energy Information Administration, and ranked based on average production during the periods
2005–2010 and 2005–2009, respectively. Michigan’s average production during those periods
ranked at 14th for natural gas and 17th for crude oil.3
Average annual timber harvest data from the U.S. Forest Service, Forest Inventory and Analysis
National Program were used to determine the top ten timber producing states. Michigan ranked
16th overall, with over 350 million cubic feet of timber produced.4
Data from the U.S. Geological Survey Mineral Commodity Summary were used to determine
mineral/metal production. Top mining states were identified based on the average total value of
3 Energy Information Administration (EIA). Natural Gas Gross Withdrawals and Production Database
http://www.eia.gov/dnav/ng/ng_prod_sum_a_epg0_fgw_mmcf_a.htm and Crude Oil Production Database
http://www.eia.gov/dnav/pet/pet_crd_pres_a_EPC0_R01_mmbbl_a.htm. (Accessed 8-23-11.) 4 U.S. Forest Service, Forest Inventory and Analysis National Program, “Timber Products Output Report
for the U.S., 2001 and 2006 (averaged).” See: http://srsfia2.fs.fed.us/php/tpo_2009/tpo_rpa_int1.php. (Ac-
cessed 8-23-11.)
6
metals/minerals “produced” between 2006 and 2008, because volume data are not comparable for
different mineral resources. Michigan ranked 11th in the United States, based primarily on
production of iron, salt, potash, peat, magnesium, and gypsum.5
Michigan is not among the top ten extractive states for any of these sectors, but is a strong player
and largely in the top third of timber, mining, oil, and gas producing states.
Comparison of Natural Resource Revenue Models
For the top ten states in each of these sectors, PSC compared Michigan’s severance (or other
extractive tax/fee system) in terms of rates, use of funds, and filing requirements. For the oil and
gas industries this comparison was very direct and straightforward, and in every case, states that
taxed these industries did so through a severance tax rate based on the market value of the
produced amount. The “tax” system for timber and mineral/metal products, however, varied more
among states, with some using a straight severance tax system and others using acreage or
stumpage fees, ad valorem taxes, or other systems.
In gathering and evaluating the data on revenue systems, PSC conducted a literature review of
national databases and individual state websites. In addition, PSC followed up directly with staff
in state agencies as necessary to obtain further details or clarification regarding their revenue
models.
5 U.S. Geological Survey, “Mineral Commodity Summaries 2011,” pp. 11–12. See:
http://minerals.usgs.gov/minerals/pubs/mcs/2011/mcs2011.pdf. (Accessed 8-23-11.)
7
Comparison of Tax Revenue Models Across the United States
Thirty-eight states leverage severance or other natural resource extraction taxes and/or use fee
systems that generate revenue based on the volume and value of resources produced.6 They are
usually levied in lieu of ad valorem property taxes on the land where the resource is located,
although some states utilize both methods. They are generally designed to help capture some of
the present value of the resources being used in order to balance the long-term loss of taxable
value as many of those resources are depleted.
As stated in the Types of Natural Resource Revenue Models section, states levy numerous other
taxes and collect fees and royalties on the oil, gas, mining, and timber industries. Most states levy
income and corporate taxes on individuals and companies participating in these industries, and
collect royalty payments for natural resource extraction on state lands.
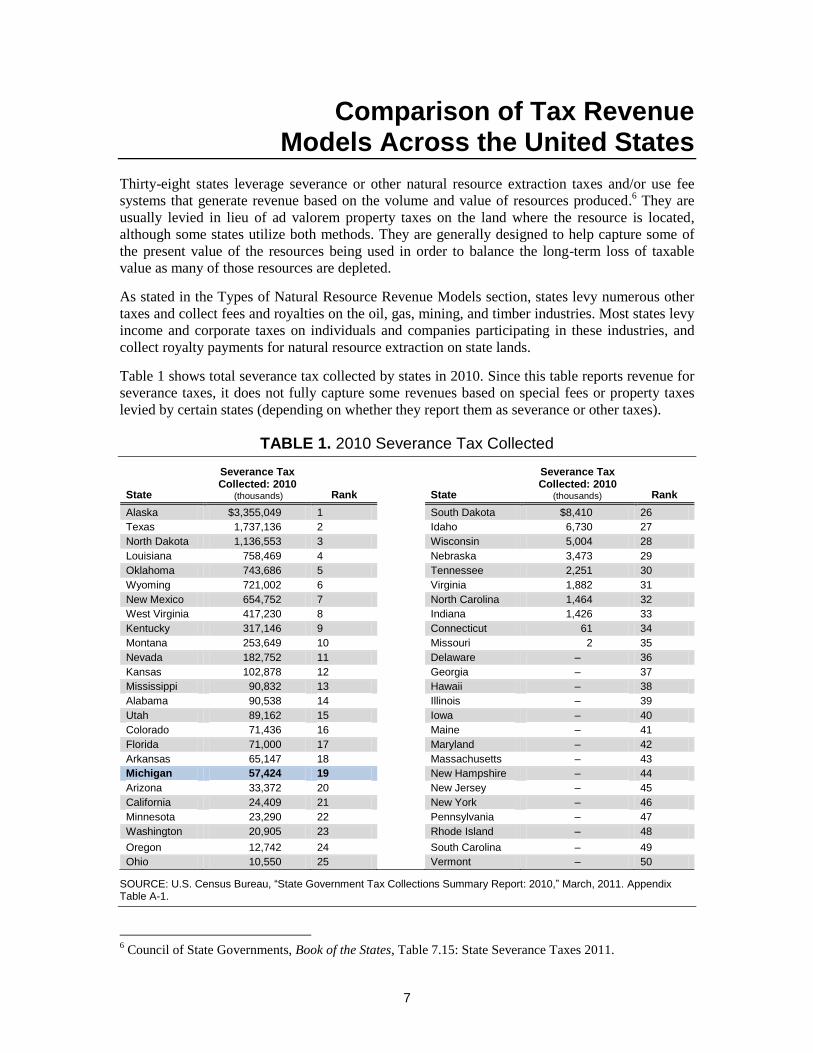
Table 1 shows total severance tax collected by states in 2010. Since this table reports revenue for
severance taxes, it does not fully capture some revenues based on special fees or property taxes
levied by certain states (depending on whether they report them as severance or other taxes).
TABLE 1. 2010 Severance Tax Collected
State
Severance Tax Collected: 2010
(thousands) Rank
State
Severance Tax Collected: 2010
(thousands) Rank
Alaska $3,355,049 1 South Dakota $8,410 26
Texas 1,737,136 2 Idaho 6,730 27
North Dakota 1,136,553 3 Wisconsin 5,004 28
Louisiana 758,469 4 Nebraska 3,473 29
Oklahoma 743,686 5 Tennessee 2,251 30
Wyoming 721,002 6 Virginia 1,882 31
New Mexico 654,752 7 North Carolina 1,464 32
West Virginia 417,230 8 Indiana 1,426 33
Kentucky 317,146 9 Connecticut 61 34
Montana 253,649 10 Missouri 2 35
Nevada 182,752 11 Delaware – 36
Kansas 102,878 12 Georgia – 37
Mississippi 90,832 13 Hawaii – 38
Alabama 90,538 14 Illinois – 39
Utah 89,162 15 Iowa – 40
Colorado 71,436 16 Maine – 41
Florida 71,000 17 Maryland – 42
Arkansas 65,147 18 Massachusetts – 43
Michigan 57,424 19 New Hampshire – 44
Arizona 33,372 20 New Jersey – 45
California 24,409 21 New York – 46
Minnesota 23,290 22 Pennsylvania – 47
Washington 20,905 23 Rhode Island – 48
Oregon 12,742 24 South Carolina – 49
Ohio 10,550 25 Vermont – 50
SOURCE: U.S. Census Bureau, “State Government Tax Collections Summary Report: 2010,” March, 2011. Appendix Table A-1.
6 Council of State Governments, Book of the States, Table 7.15: State Severance Taxes 2011.
8
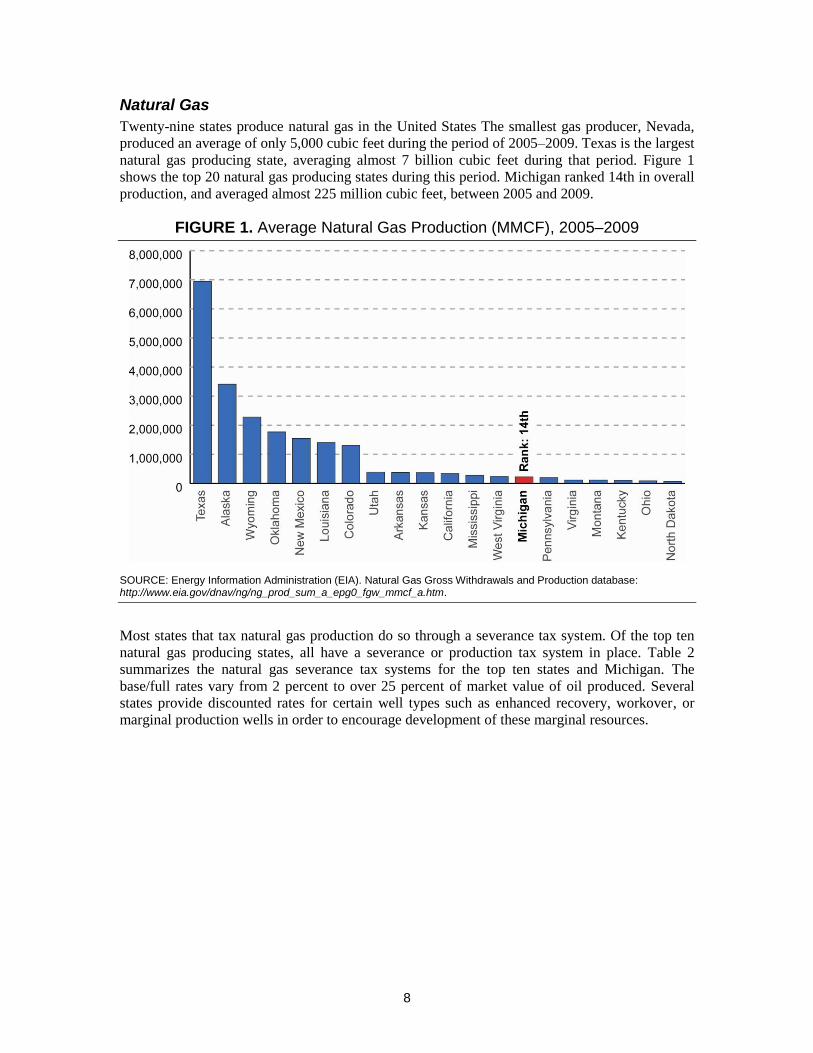
Natural Gas
Twenty-nine states produce natural gas in the United States The smallest gas producer, Nevada,
produced an average of only 5,000 cubic feet during the period of 2005–2009. Texas is the largest
natural gas producing state, averaging almost 7 billion cubic feet during that period. Figure 1
shows the top 20 natural gas producing states during this period. Michigan ranked 14th in overall
production, and averaged almost 225 million cubic feet, between 2005 and 2009.
FIGURE 1. Average Natural Gas Production (MMCF), 2005–2009
SOURCE: Energy Information Administration (EIA). Natural Gas Gross Withdrawals and Production database: http://www.eia.gov/dnav/ng/ng_prod_sum_a_epg0_fgw_mmcf_a.htm.
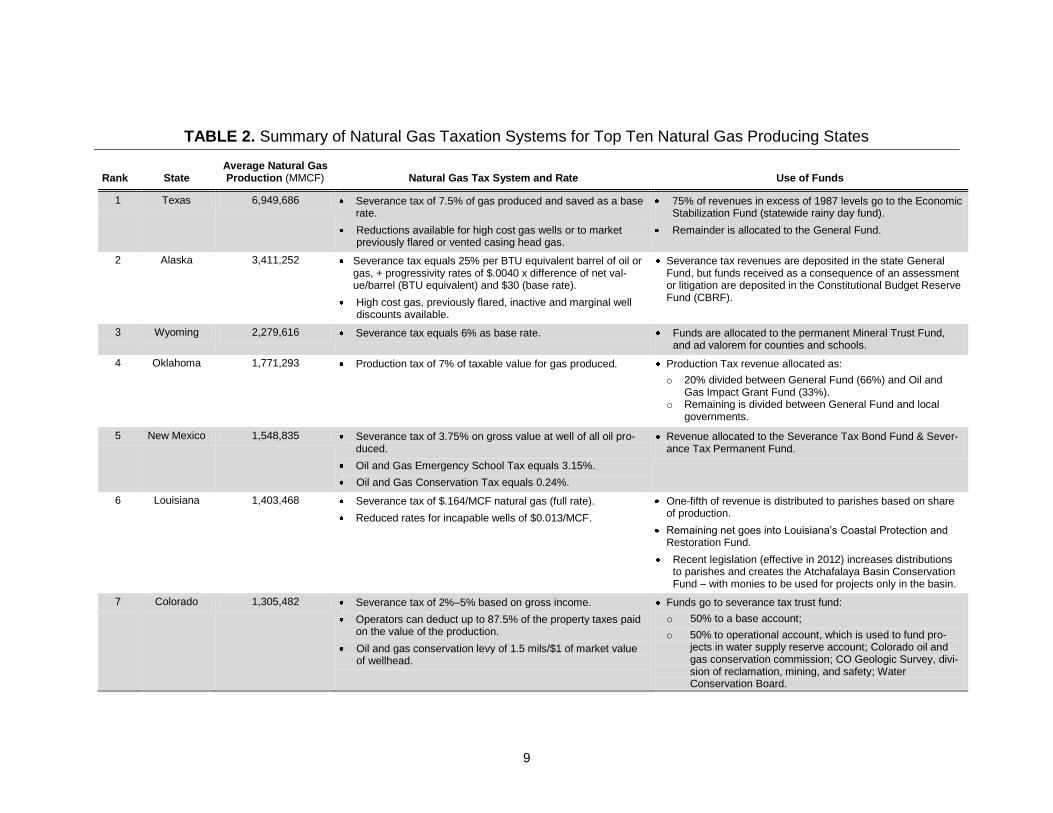
Most states that tax natural gas production do so through a severance tax system. Of the top ten
natural gas producing states, all have a severance or production tax system in place. Table 2
summarizes the natural gas severance tax systems for the top ten states and Michigan. The
base/full rates vary from 2 percent to over 25 percent of market value of oil produced. Several
states provide discounted rates for certain well types such as enhanced recovery, workover, or
marginal production wells in order to encourage development of these marginal resources.
9
TABLE 2. Summary of Natural Gas Taxation Systems for Top Ten Natural Gas Producing States
Rank State Average Natural Gas Production (MMCF) Natural Gas Tax System and Rate Use of Funds
1 Texas 6,949,686 Severance tax of 7.5% of gas produced and saved as a base rate.
Reductions available for high cost gas wells or to market previously flared or vented casing head gas.
75% of revenues in excess of 1987 levels go to the Economic Stabilization Fund (statewide rainy day fund).
Remainder is allocated to the General Fund.
2 Alaska 3,411,252 Severance tax equals 25% per BTU equivalent barrel of oil or gas, + progressivity rates of $.0040 x difference of net val-ue/barrel (BTU equivalent) and $30 (base rate).
High cost gas, previously flared, inactive and marginal well discounts available.
Severance tax revenues are deposited in the state General Fund, but funds received as a consequence of an assessment or litigation are deposited in the Constitutional Budget Reserve Fund (CBRF).
3 Wyoming 2,279,616 Severance tax equals 6% as base rate. Funds are allocated to the permanent Mineral Trust Fund, and ad valorem for counties and schools.
4 Oklahoma 1,771,293 Production tax of 7% of taxable value for gas produced. Production Tax revenue allocated as:
o 20% divided between General Fund (66%) and Oil and Gas Impact Grant Fund (33%).
o Remaining is divided between General Fund and local governments.
5 New Mexico 1,548,835 Severance tax of 3.75% on gross value at well of all oil pro-duced.
Oil and Gas Emergency School Tax equals 3.15%.
Oil and Gas Conservation Tax equals 0.24%.
Revenue allocated to the Severance Tax Bond Fund & Sever-ance Tax Permanent Fund.
6 Louisiana 1,403,468 Severance tax of $.164/MCF natural gas (full rate).
Reduced rates for incapable wells of $0.013/MCF.
One-fifth of revenue is distributed to parishes based on share of production.
Remaining net goes into Louisiana’s Coastal Protection and Restoration Fund.
Recent legislation (effective in 2012) increases distributions to parishes and creates the Atchafalaya Basin Conservation Fund – with monies to be used for projects only in the basin.
7 Colorado 1,305,482 Severance tax of 2%–5% based on gross income.
Operators can deduct up to 87.5% of the property taxes paid on the value of the production.
Oil and gas conservation levy of 1.5 mils/$1 of market value of wellhead.
Funds go to severance tax trust fund:
o 50% to a base account;
o 50% to operational account, which is used to fund pro-jects in water supply reserve account; Colorado oil and gas conservation commission; CO Geologic Survey, divi-sion of reclamation, mining, and safety; Water Conservation Board.
10
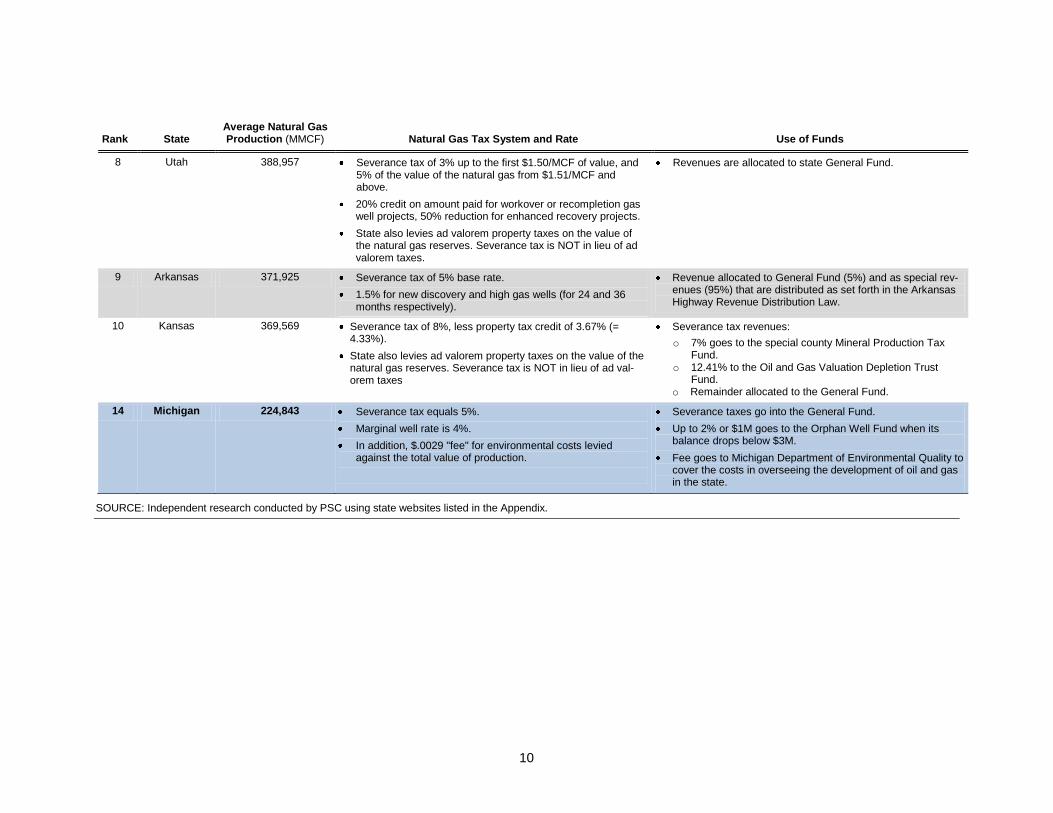
Rank State Average Natural Gas Production (MMCF) Natural Gas Tax System and Rate Use of Funds
8 Utah 388,957 Severance tax of 3% up to the first $1.50/MCF of value, and 5% of the value of the natural gas from $1.51/MCF and above.
20% credit on amount paid for workover or recompletion gas well projects, 50% reduction for enhanced recovery projects.
State also levies ad valorem property taxes on the value of the natural gas reserves. Severance tax is NOT in lieu of ad valorem taxes.
Revenues are allocated to state General Fund.
9 Arkansas 371,925 Severance tax of 5% base rate.
1.5% for new discovery and high gas wells (for 24 and 36 months respectively).
Revenue allocated to General Fund (5%) and as special rev-enues (95%) that are distributed as set forth in the Arkansas Highway Revenue Distribution Law.
10 Kansas 369,569 Severance tax of 8%, less property tax credit of 3.67% (= 4.33%).
State also levies ad valorem property taxes on the value of the natural gas reserves. Severance tax is NOT in lieu of ad val-orem taxes
Severance tax revenues:
o 7% goes to the special county Mineral Production Tax Fund.
o 12.41% to the Oil and Gas Valuation Depletion Trust Fund.
o Remainder allocated to the General Fund.
14 Michigan 224,843 Severance tax equals 5%.
Marginal well rate is 4%.
In addition, $.0029 "fee" for environmental costs levied against the total value of production.
Severance taxes go into the General Fund.
Up to 2% or $1M goes to the Orphan Well Fund when its balance drops below $3M.
Fee goes to Michigan Department of Environmental Quality to cover the costs in overseeing the development of oil and gas in the state.
SOURCE: Independent research conducted by PSC using state websites listed in the Appendix.
11
Alaska’s Clear and Equitable Share (ACES) severance tax legislation, passed under then
Governor Sarah Palin, gives Alaska the highest tax rate of any state, and it includes a progressive
sliding scale that increases the tax rate as the price of oil increases. Colorado has the lowest
severance tax rate of 2 percent for operators with gross income below $25,000, but climbs to 4
percent for income between $100,000 and $300,000 and 5 percent for incomes greater than
$300,000. Operators can also deduct up to 87.5 percent of the property taxes paid on the value of
the production from the previous year.
Use of revenues from natural gas severance tax varied among states. Six of the top ten states
deposit at least some portion of severance tax funds into a permanent trust at the state level. These
funds serve as either general or specific-purpose “rainy day” funds for the state, and allow for
transfer or allocation as needed by the state for budgetary shortfalls, usually only by order of the
governor or legislature. Some of these states allow for interest income in the trust to be
transferred to the General Fund each year. Three states (Michigan, Oklahoma, and Colorado) use
a portion of natural gas severance tax for environmental reclamation or remediation, particularly
those focused on extraction impacts. Louisiana uses some of its severance tax revenues for
conservation projects in Louisiana’s coastal zone and Atchafalaya Basin. Wyoming is the only
state that specifically allocates a small portion of severance tax proceeds for education-related
purposes.
Compared to the top ten states, Michigan’s 5 percent natural gas severance tax is slightly on the
low end of tax rates. Once property tax credits are applied, the rate in Kansas is comparable (and
could be higher depending on amount property tax paid), as are the rates in Utah and Arkansas.
Marginal well projects get a reduced tax rate of 4 percent in Michigan, similar to other states’
incentives for low-quality/high-risk wells. Michigan allocates up to $1 million of natural gas and
oil severance taxes for the Orphan Well Fund when its balance drops below $3 million, but
otherwise does not disburse severance tax revenues to any other environmental, education, or
other special program.
Crude Oil
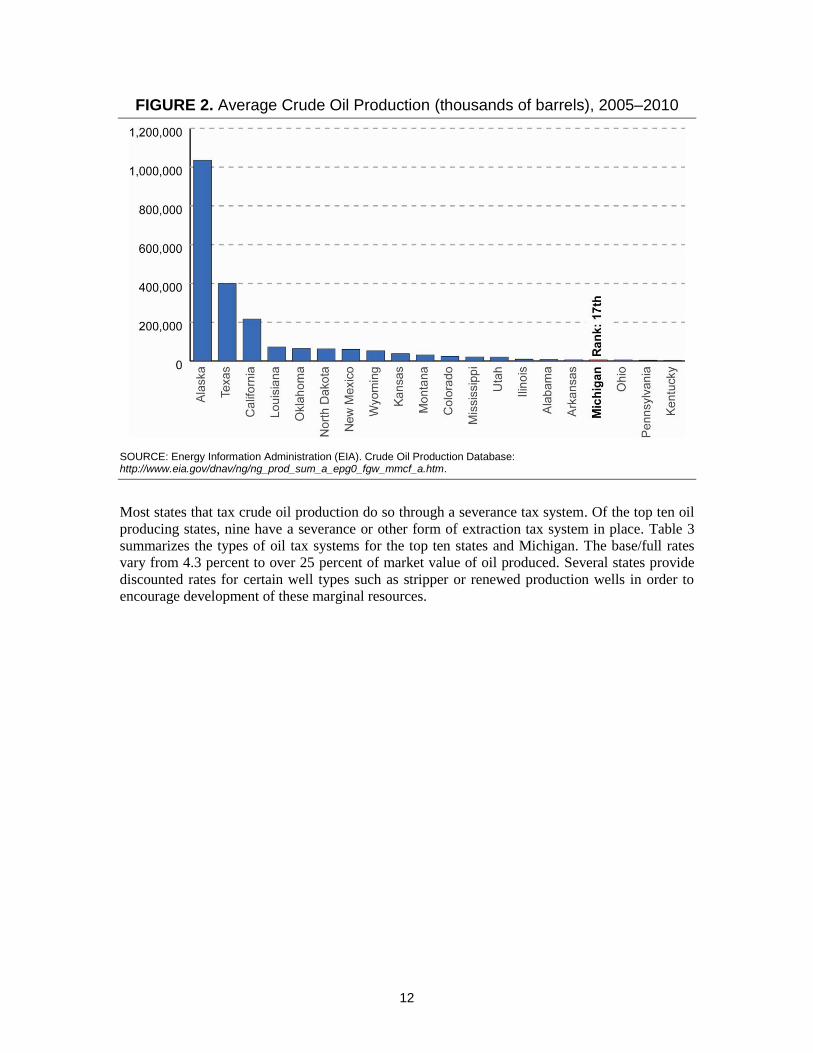
Thirty states produce crude oil in the United States, ranging from an average of ten thousand
gallons (Virginia) to one billion gallons (Alaska) per year during the period 2005–2010. Figure 2
shows the top 20 oil producing states during this period. Michigan ranked 17th in overall
production, with Alaska, Texas, and California producing over three times as much oil as the rest
of the states combined.
12
FIGURE 2. Average Crude Oil Production (thousands of barrels), 2005–2010
SOURCE: Energy Information Administration (EIA). Crude Oil Production Database: http://www.eia.gov/dnav/ng/ng_prod_sum_a_epg0_fgw_mmcf_a.htm.
Most states that tax crude oil production do so through a severance tax system. Of the top ten oil
producing states, nine have a severance or other form of extraction tax system in place. Table 3
summarizes the types of oil tax systems for the top ten states and Michigan. The base/full rates
vary from 4.3 percent to over 25 percent of market value of oil produced. Several states provide
discounted rates for certain well types such as stripper or renewed production wells in order to
encourage development of these marginal resources.
13
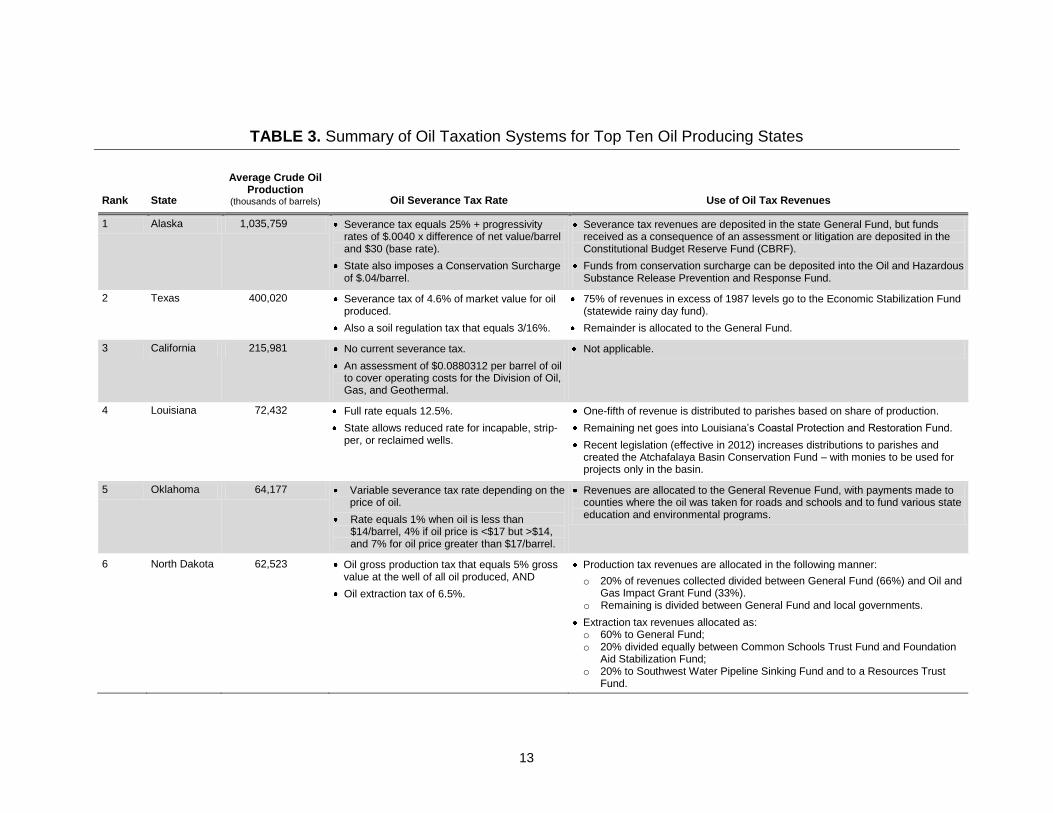
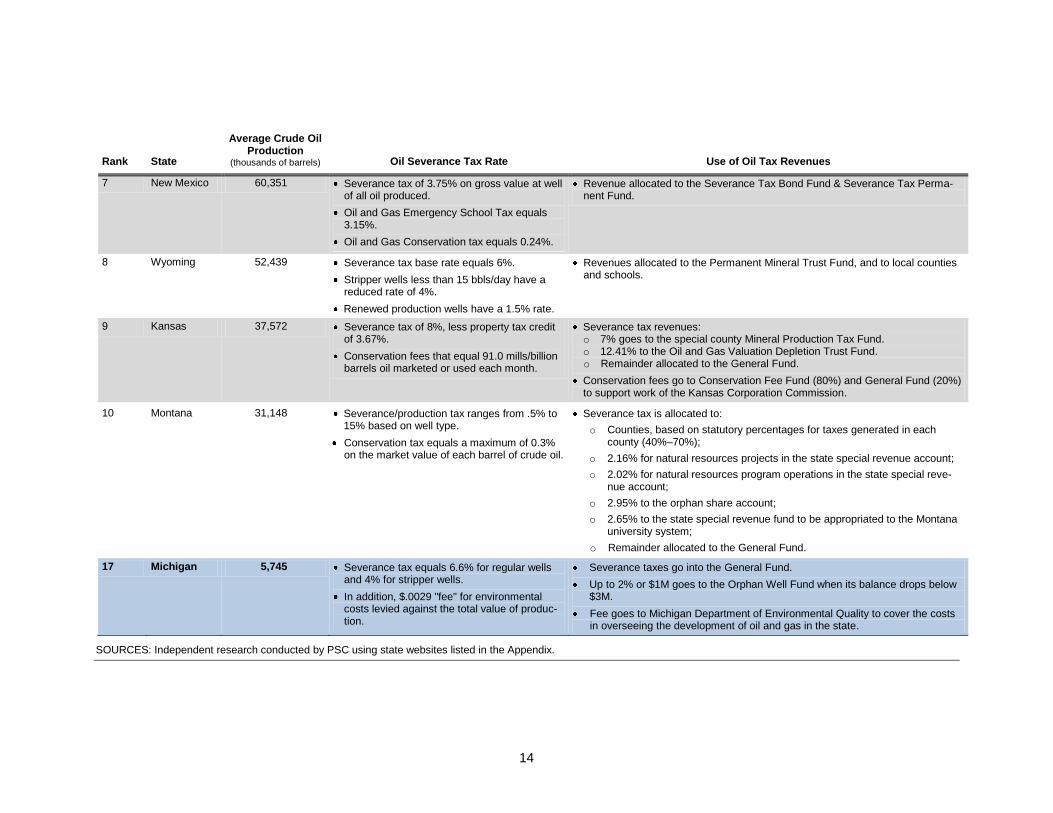
TABLE 3. Summary of Oil Taxation Systems for Top Ten Oil Producing States
Rank State
Average Crude Oil Production
(thousands of barrels) Oil Severance Tax Rate Use of Oil Tax Revenues
1 Alaska 1,035,759 Severance tax equals 25% + progressivity rates of $.0040 x difference of net value/barrel and $30 (base rate).
State also imposes a Conservation Surcharge of $.04/barrel.
Severance tax revenues are deposited in the state General Fund, but funds received as a consequence of an assessment or litigation are deposited in the Constitutional Budget Reserve Fund (CBRF).
Funds from conservation surcharge can be deposited into the Oil and Hazardous Substance Release Prevention and Response Fund.
2 Texas 400,020 Severance tax of 4.6% of market value for oil produced.
Also a soil regulation tax that equals 3/16%.
75% of revenues in excess of 1987 levels go to the Economic Stabilization Fund (statewide rainy day fund).
Remainder is allocated to the General Fund.
3 California 215,981 No current severance tax.
An assessment of $0.0880312 per barrel of oil to cover operating costs for the Division of Oil, Gas, and Geothermal.
Not applicable.
4 Louisiana 72,432 Full rate equals 12.5%.
State allows reduced rate for incapable, strip-per, or reclaimed wells.
One-fifth of revenue is distributed to parishes based on share of production.
Remaining net goes into Louisiana’s Coastal Protection and Restoration Fund.
Recent legislation (effective in 2012) increases distributions to parishes and created the Atchafalaya Basin Conservation Fund – with monies to be used for projects only in the basin.
5 Oklahoma 64,177 Variable severance tax rate depending on the price of oil.
Rate equals 1% when oil is less than $14/barrel, 4% if oil price is <$17 but >$14, and 7% for oil price greater than $17/barrel.
Revenues are allocated to the General Revenue Fund, with payments made to counties where the oil was taken for roads and schools and to fund various state education and environmental programs.
6 North Dakota 62,523 Oil gross production tax that equals 5% gross value at the well of all oil produced, AND
Oil extraction tax of 6.5%.
Production tax revenues are allocated in the following manner:
o 20% of revenues collected divided between General Fund (66%) and Oil and Gas Impact Grant Fund (33%).
o Remaining is divided between General Fund and local governments.
Extraction tax revenues allocated as: o 60% to General Fund; o 20% divided equally between Common Schools Trust Fund and Foundation
Aid Stabilization Fund; o 20% to Southwest Water Pipeline Sinking Fund and to a Resources Trust
Fund.
14
Rank State
Average Crude Oil Production
(thousands of barrels) Oil Severance Tax Rate Use of Oil Tax Revenues
7 New Mexico 60,351 Severance tax of 3.75% on gross value at well of all oil produced.
Oil and Gas Emergency School Tax equals 3.15%.
Oil and Gas Conservation tax equals 0.24%.
Revenue allocated to the Severance Tax Bond Fund & Severance Tax Perma-nent Fund.
8 Wyoming 52,439 Severance tax base rate equals 6%.
Stripper wells less than 15 bbls/day have a reduced rate of 4%.
Renewed production wells have a 1.5% rate.
Revenues allocated to the Permanent Mineral Trust Fund, and to local counties and schools.
9 Kansas 37,572 Severance tax of 8%, less property tax credit of 3.67%.
Conservation fees that equal 91.0 mills/billion barrels oil marketed or used each month.
Severance tax revenues: o 7% goes to the special county Mineral Production Tax Fund. o 12.41% to the Oil and Gas Valuation Depletion Trust Fund. o Remainder allocated to the General Fund.
Conservation fees go to Conservation Fee Fund (80%) and General Fund (20%) to support work of the Kansas Corporation Commission.
10 Montana 31,148 Severance/production tax ranges from .5% to 15% based on well type.
Conservation tax equals a maximum of 0.3% on the market value of each barrel of crude oil.
Severance tax is allocated to:
o Counties, based on statutory percentages for taxes generated in each county (40%–70%);
o 2.16% for natural resources projects in the state special revenue account;
o 2.02% for natural resources program operations in the state special reve-nue account;
o 2.95% to the orphan share account;
o 2.65% to the state special revenue fund to be appropriated to the Montana university system;
o Remainder allocated to the General Fund.
17 Michigan 5,745 Severance tax equals 6.6% for regular wells and 4% for stripper wells.
In addition, $.0029 "fee" for environmental costs levied against the total value of produc-tion.
Severance taxes go into the General Fund.
Up to 2% or $1M goes to the Orphan Well Fund when its balance drops below $3M.
Fee goes to Michigan Department of Environmental Quality to cover the costs in overseeing the development of oil and gas in the state.
SOURCES: Independent research conducted by PSC using state websites listed in the Appendix.
15
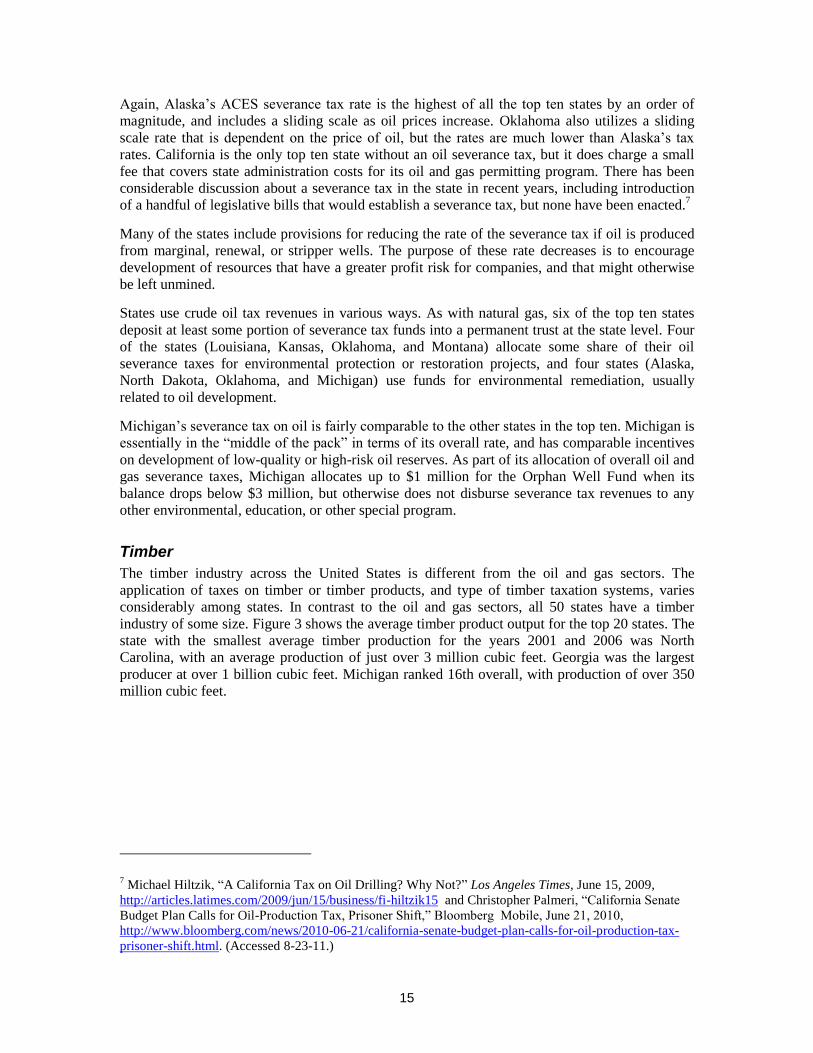
Again, Alaska’s ACES severance tax rate is the highest of all the top ten states by an order of
magnitude, and includes a sliding scale as oil prices increase. Oklahoma also utilizes a sliding
scale rate that is dependent on the price of oil, but the rates are much lower than Alaska’s tax
rates. California is the only top ten state without an oil severance tax, but it does charge a small
fee that covers state administration costs for its oil and gas permitting program. There has been
considerable discussion about a severance tax in the state in recent years, including introduction
of a handful of legislative bills that would establish a severance tax, but none have been enacted.7
Many of the states include provisions for reducing the rate of the severance tax if oil is produced
from marginal, renewal, or stripper wells. The purpose of these rate decreases is to encourage
development of resources that have a greater profit risk for companies, and that might otherwise
be left unmined.
States use crude oil tax revenues in various ways. As with natural gas, six of the top ten states
deposit at least some portion of severance tax funds into a permanent trust at the state level. Four
of the states (Louisiana, Kansas, Oklahoma, and Montana) allocate some share of their oil
severance taxes for environmental protection or restoration projects, and four states (Alaska,
North Dakota, Oklahoma, and Michigan) use funds for environmental remediation, usually
related to oil development.
Michigan’s severance tax on oil is fairly comparable to the other states in the top ten. Michigan is
essentially in the “middle of the pack” in terms of its overall rate, and has comparable incentives
on development of low-quality or high-risk oil reserves. As part of its allocation of overall oil and
gas severance taxes, Michigan allocates up to $1 million for the Orphan Well Fund when its
balance drops below $3 million, but otherwise does not disburse severance tax revenues to any
other environmental, education, or other special program.
Timber
The timber industry across the United States is different from the oil and gas sectors. The
application of taxes on timber or timber products, and type of timber taxation systems, varies
considerably among states. In contrast to the oil and gas sectors, all 50 states have a timber
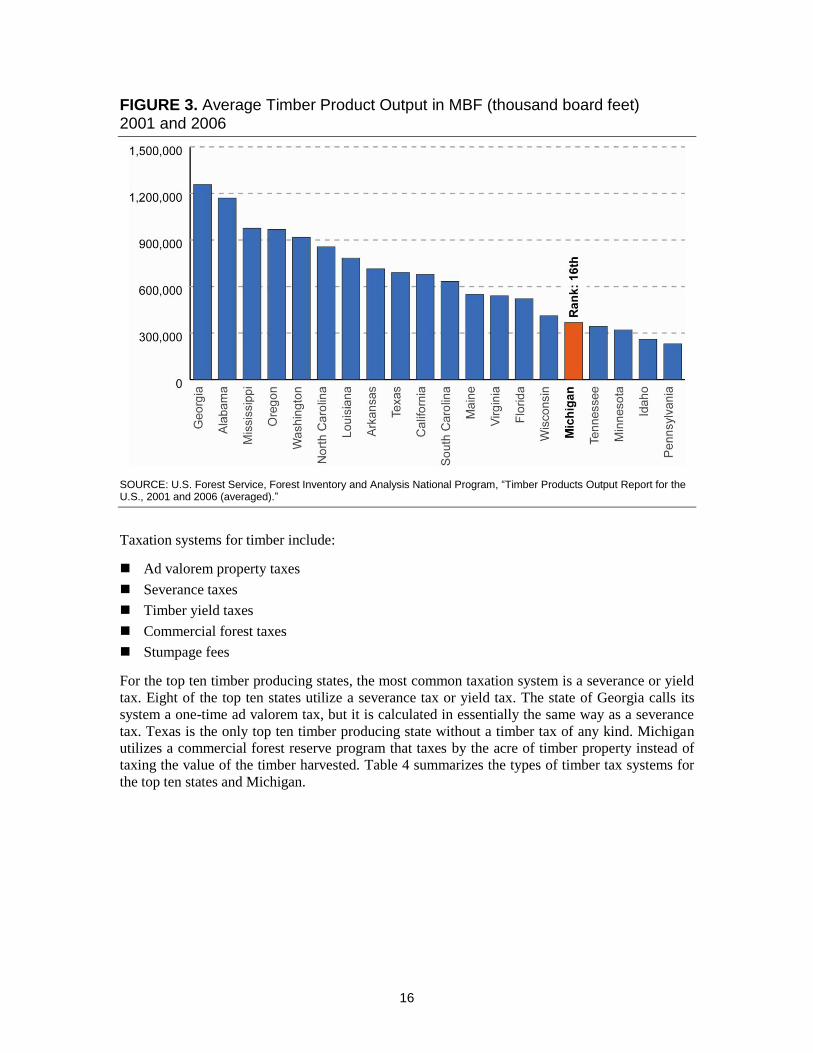
industry of some size. Figure 3 shows the average timber product output for the top 20 states. The
state with the smallest average timber production for the years 2001 and 2006 was North
Carolina, with an average production of just over 3 million cubic feet. Georgia was the largest
producer at over 1 billion cubic feet. Michigan ranked 16th overall, with production of over 350
million cubic feet.
7 Michael Hiltzik, “A California Tax on Oil Drilling? Why Not?” Los Angeles Times, June 15, 2009,
http://articles.latimes.com/2009/jun/15/business/fi-hiltzik15 and Christopher Palmeri, “California Senate
Budget Plan Calls for Oil-Production Tax, Prisoner Shift,” Bloomberg Mobile, June 21, 2010,
http://www.bloomberg.com/news/2010-06-21/california-senate-budget-plan-calls-for-oil-production-tax-
prisoner-shift.html. (Accessed 8-23-11.)
16
FIGURE 3. Average Timber Product Output in MBF (thousand board feet) 2001 and 2006
SOURCE: U.S. Forest Service, Forest Inventory and Analysis National Program, “Timber Products Output Report for the U.S., 2001 and 2006 (averaged).”
Taxation systems for timber include:
Ad valorem property taxes
Severance taxes
Timber yield taxes
Commercial forest taxes
Stumpage fees
For the top ten timber producing states, the most common taxation system is a severance or yield
tax. Eight of the top ten states utilize a severance tax or yield tax. The state of Georgia calls its
system a one-time ad valorem tax, but it is calculated in essentially the same way as a severance
tax. Texas is the only top ten timber producing state without a timber tax of any kind. Michigan
utilizes a commercial forest reserve program that taxes by the acre of timber property instead of
taxing the value of the timber harvested. Table 4 summarizes the types of timber tax systems for
the top ten states and Michigan.
17
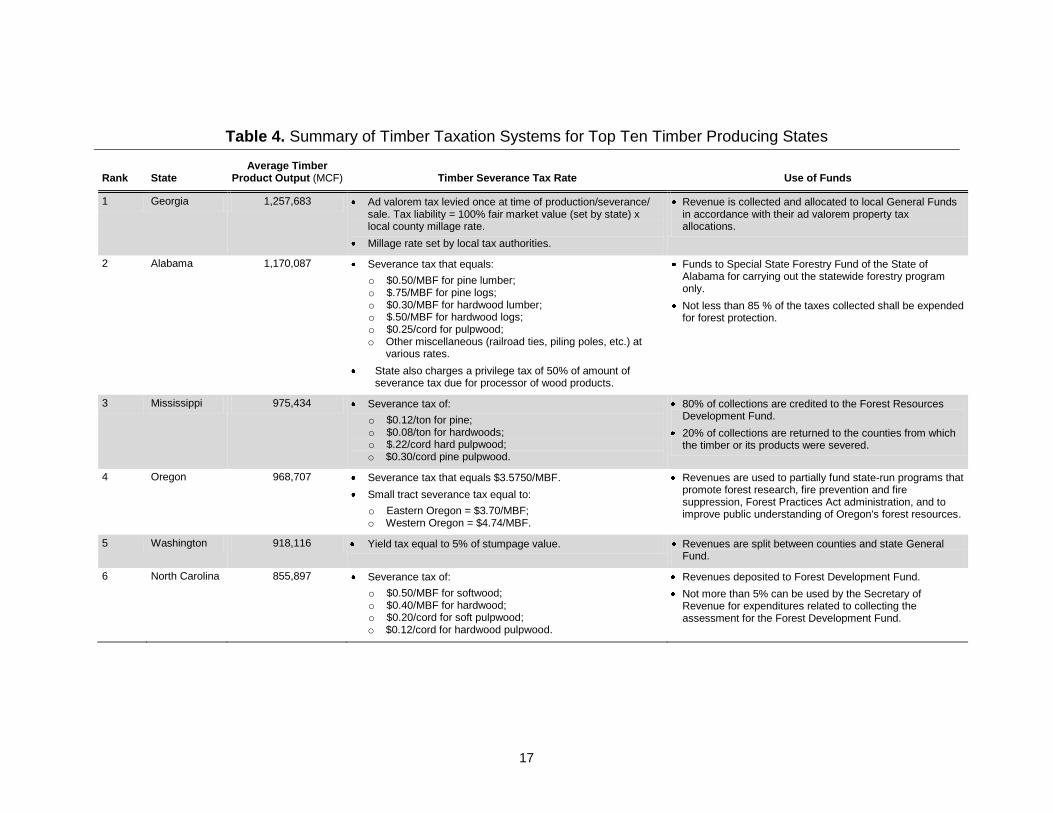
Table 4. Summary of Timber Taxation Systems for Top Ten Timber Producing States
Rank State Average Timber
Product Output (MCF) Timber Severance Tax Rate Use of Funds
1 Georgia 1,257,683 Ad valorem tax levied once at time of production/severance/ sale. Tax liability = 100% fair market value (set by state) x local county millage rate.
Millage rate set by local tax authorities.
Revenue is collected and allocated to local General Funds in accordance with their ad valorem property tax allocations.
2 Alabama 1,170,087 Severance tax that equals:
o $0.50/MBF for pine lumber; o $.75/MBF for pine logs; o $0.30/MBF for hardwood lumber; o $.50/MBF for hardwood logs; o $0.25/cord for pulpwood; o Other miscellaneous (railroad ties, piling poles, etc.) at
various rates.
State also charges a privilege tax of 50% of amount of severance tax due for processor of wood products.
Funds to Special State Forestry Fund of the State of Alabama for carrying out the statewide forestry program only.
Not less than 85 % of the taxes collected shall be expended for forest protection.
3 Mississippi 975,434 Severance tax of:
o $0.12/ton for pine; o $0.08/ton for hardwoods; o $.22/cord hard pulpwood; o $0.30/cord pine pulpwood.
80% of collections are credited to the Forest Resources Development Fund.
20% of collections are returned to the counties from which the timber or its products were severed.
4 Oregon 968,707 Severance tax that equals $3.5750/MBF.
Small tract severance tax equal to:
o Eastern Oregon = $3.70/MBF; o Western Oregon = $4.74/MBF.
Revenues are used to partially fund state-run programs that promote forest research, fire prevention and fire suppression, Forest Practices Act administration, and to improve public understanding of Oregon's forest resources.
5 Washington 918,116 Yield tax equal to 5% of stumpage value. Revenues are split between counties and state General Fund.
6 North Carolina 855,897 Severance tax of:
o $0.50/MBF for softwood; o $0.40/MBF for hardwood; o $0.20/cord for soft pulpwood; o $0.12/cord for hardwood pulpwood.
Revenues deposited to Forest Development Fund.
Not more than 5% can be used by the Secretary of Revenue for expenditures related to collecting the assessment for the Forest Development Fund.
18
Rank State Average Timber
Product Output (MCF) Timber Severance Tax Rate Use of Funds
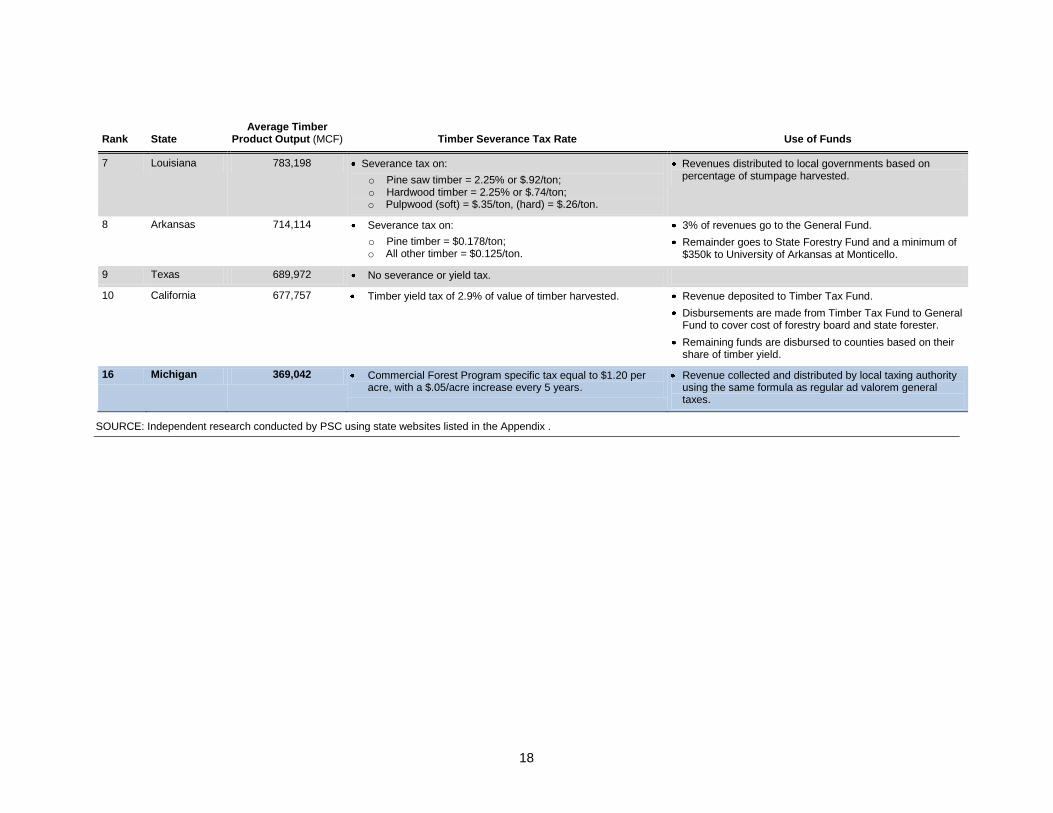
7 Louisiana 783,198 Severance tax on:
o Pine saw timber = 2.25% or $.92/ton; o Hardwood timber = 2.25% or $.74/ton; o Pulpwood (soft) = $.35/ton, (hard) = $.26/ton.
Revenues distributed to local governments based on percentage of stumpage harvested.
8 Arkansas 714,114 Severance tax on:
o Pine timber = $0.178/ton; o All other timber = $0.125/ton.
3% of revenues go to the General Fund.
Remainder goes to State Forestry Fund and a minimum of $350k to University of Arkansas at Monticello.
9 Texas 689,972 No severance or yield tax.
10 California 677,757 Timber yield tax of 2.9% of value of timber harvested. Revenue deposited to Timber Tax Fund.
Disbursements are made from Timber Tax Fund to General Fund to cover cost of forestry board and state forester.
Remaining funds are disbursed to counties based on their share of timber yield.
16 Michigan 369,042 Commercial Forest Program specific tax equal to $1.20 per acre, with a $.05/acre increase every 5 years.
Revenue collected and distributed by local taxing authority using the same formula as regular ad valorem general taxes.
SOURCE: Independent research conducted by PSC using state websites listed in the Appendix .
19
There is significant variation in rates among those taxation systems, with some states applying a
percentage at the state level, some setting rates at local levels, and others charging a flat rate per
ton, foot, cord, or acre. For those states that charge a severance tax based on a flat rate per thou-
sand board feet (MBF), the rates range from $0.30/MBF (Alabama) to $4.74/MBF (western
Oregon). Mississippi, Louisiana, and Arkansas all allow for flat taxes on a per-ton basis, and
range from $0.12/ton (Arkansas and Mississippi) to $0.92/ton (Louisiana). Three states use a per-
centage basis (including Louisiana, which allows for percentage or flat rate/ton). Rates range
from 2.25 percent to 5 percent.
Another difference with timber-related revenues compared to those for other natural resources is
the use of severance tax funds collected. There is a much stronger emphasis on disbursing these
funds to local communities where the timber was harvested and depositing it in forest funds that
are used for research, conservation, fire protection, or other forestry-related needs.
Michigan’s timber tax system is significantly different from those in the top ten timber producing
states. The state does not set a flat or percentage rate of tax based on the value of the “severed” or
harvested products. Instead, the state allows for timberland to be enrolled in the Commercial For-
est Program. An eligible commercial forest is "forestland" capable of producing (1) not less than
20 cubic feet per acre per year of forest growth upon maturity, (2) economically valuable trees,
and (3) a commercial stand of timber within a reasonable time. Commercial forestlands pay an
annual specific tax of $1.20/acre (with a $0.05/acre increase every 5 years) in lieu of ad valorem
property taxes.
Mining
The final type of severance or production tax deployed by many states is on non-energy miner-
al/metal resources. As with timber production, every state in the United States has some level of
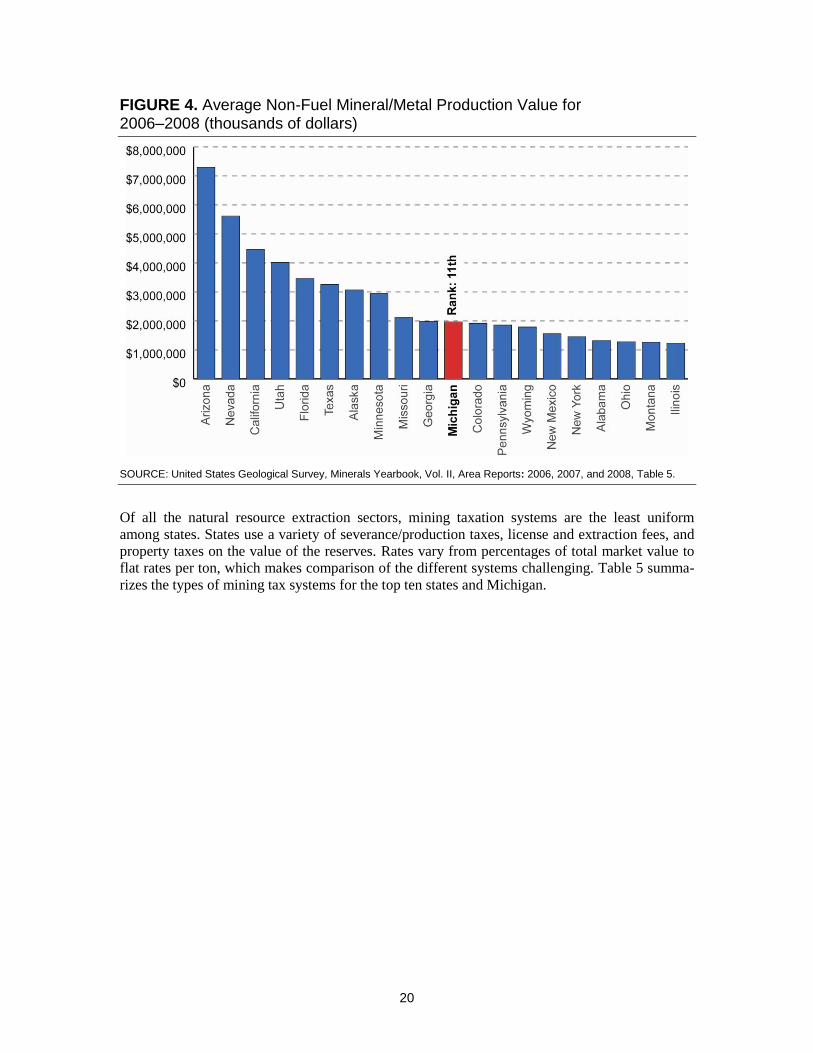
mineral/metal production. Figure 4 shows the average mining value for the top 20 states. Michi-
gan ranked 11th in total value of mineral/metal production, with almost $2 billion in average
annual mineral/metal production value between 2006 and 2008. The highest production value
state was Arizona, with over $7 billion in average production value during this period.
20
FIGURE 4. Average Non-Fuel Mineral/Metal Production Value for 2006–2008 (thousands of dollars)
SOURCE: United States Geological Survey, Minerals Yearbook, Vol. II, Area Reports: 2006, 2007, and 2008, Table 5.
Of all the natural resource extraction sectors, mining taxation systems are the least uniform
among states. States use a variety of severance/production taxes, license and extraction fees, and
property taxes on the value of the reserves. Rates vary from percentages of total market value to
flat rates per ton, which makes comparison of the different systems challenging. Table 5 summa-
rizes the types of mining tax systems for the top ten states and Michigan.
21
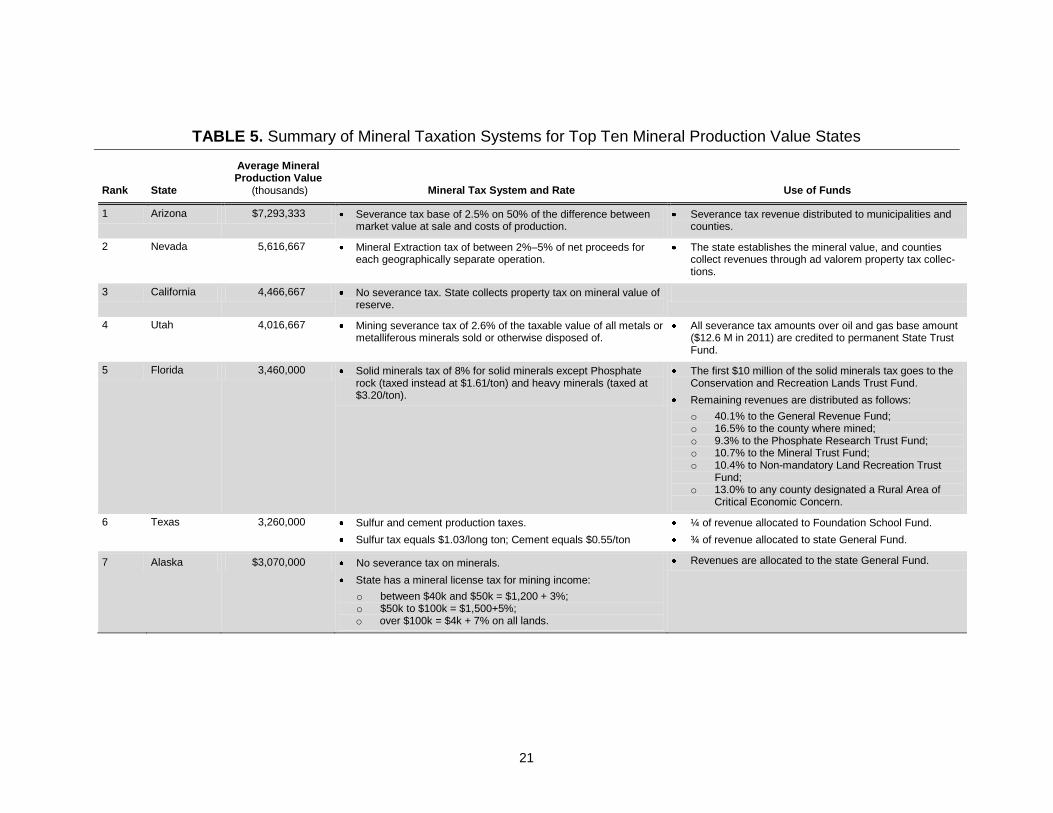
TABLE 5. Summary of Mineral Taxation Systems for Top Ten Mineral Production Value States
Rank State
Average Mineral Production Value
(thousands) Mineral Tax System and Rate Use of Funds
1 Arizona $7,293,333 Severance tax base of 2.5% on 50% of the difference between market value at sale and costs of production.
Severance tax revenue distributed to municipalities and counties.
2 Nevada 5,616,667 Mineral Extraction tax of between 2%–5% of net proceeds for each geographically separate operation.
The state establishes the mineral value, and counties collect revenues through ad valorem property tax collec-tions.
3 California 4,466,667 No severance tax. State collects property tax on mineral value of reserve.
4 Utah 4,016,667 Mining severance tax of 2.6% of the taxable value of all metals or metalliferous minerals sold or otherwise disposed of.
All severance tax amounts over oil and gas base amount ($12.6 M in 2011) are credited to permanent State Trust Fund.
5 Florida 3,460,000 Solid minerals tax of 8% for solid minerals except Phosphate rock (taxed instead at $1.61/ton) and heavy minerals (taxed at $3.20/ton).
The first $10 million of the solid minerals tax goes to the Conservation and Recreation Lands Trust Fund.
Remaining revenues are distributed as follows:
o 40.1% to the General Revenue Fund; o 16.5% to the county where mined; o 9.3% to the Phosphate Research Trust Fund; o 10.7% to the Mineral Trust Fund; o 10.4% to Non-mandatory Land Recreation Trust
Fund; o 13.0% to any county designated a Rural Area of
Critical Economic Concern.
6 Texas 3,260,000 Sulfur and cement production taxes.
Sulfur tax equals $1.03/long ton; Cement equals $0.55/ton
¼ of revenue allocated to Foundation School Fund.
¾ of revenue allocated to state General Fund.
7 Alaska $3,070,000 No severance tax on minerals.
State has a mineral license tax for mining income:
o between $40k and $50k = $1,200 + 3%; o $50k to $100k = $1,500+5%; o over $100k = $4k + 7% on all lands.
Revenues are allocated to the state General Fund.
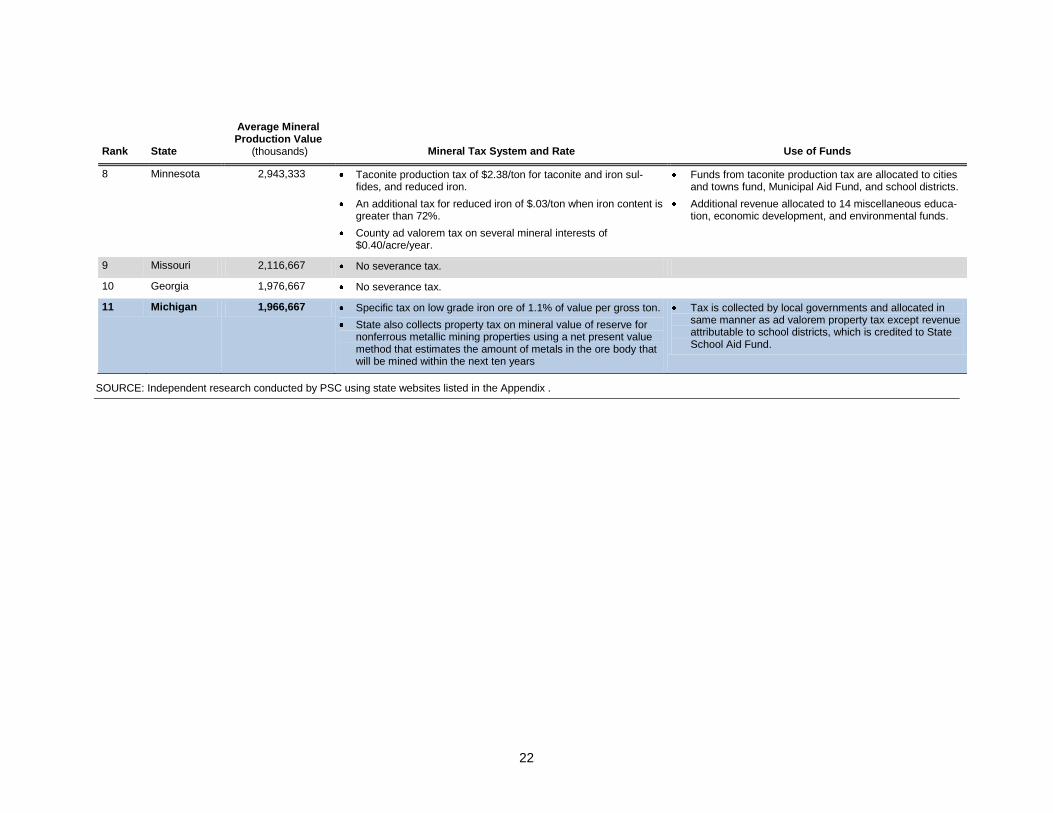
22
Rank State
Average Mineral Production Value
(thousands) Mineral Tax System and Rate Use of Funds
8 Minnesota 2,943,333 Taconite production tax of $2.38/ton for taconite and iron sul-fides, and reduced iron.
An additional tax for reduced iron of $.03/ton when iron content is greater than 72%.
County ad valorem tax on several mineral interests of $0.40/acre/year.
Funds from taconite production tax are allocated to cities and towns fund, Municipal Aid Fund, and school districts.
Additional revenue allocated to 14 miscellaneous educa-tion, economic development, and environmental funds.
9 Missouri 2,116,667 No severance tax.
10 Georgia 1,976,667 No severance tax.
11 Michigan 1,966,667 Specific tax on low grade iron ore of 1.1% of value per gross ton.
State also collects property tax on mineral value of reserve for nonferrous metallic mining properties using a net present value method that estimates the amount of metals in the ore body that will be mined within the next ten years
Tax is collected by local governments and allocated in same manner as ad valorem property tax except revenue attributable to school districts, which is credited to State School Aid Fund.
SOURCE: Independent research conducted by PSC using state websites listed in the Appendix .
23
Five states, including Michigan, charge a percentage of value mining tax. The rates range from
1.1 percent (Michigan) to 8 percent (Florida). Three states – Minnesota, Texas, and Florida – levy
taxes on a per-ton value basis. Florida uses a mixed percentage and per-ton system, with a per-
centage basis for solid minerals, and a flat rate on phosphate and heavy minerals. Michigan, along
with Minnesota and California, also levies ad valorem property taxes on the value of the mineral
reserve. Michigan collects this tax based on a net present value of the income derived from min-
ing that resource over the next ten years.
The top ten mineral/metal producing states use severance (or other) tax revenue in different ways.
Four states devote most of the revenue to local governments and local schools, and allow for local
collection of taxes. Three states primarily allocate funding to the state’s General Fund, and only
two are largely focused on special funds for research, conservation, or other special projects.
Michigan’s specific tax on low grade iron ore is the lowest rate among states that charge a per-
centage for mining tax, but the comparison must take into account how the tax is actually applied.
Arizona, for example, has a 2.5 percent rate, but only applies that to 50 percent of the difference
between market value at sale and costs of production.8 Michigan’s 1.1 percent rate is applied to
the current mine value per ton based on average annual production rates for the prior 5 years.9
Depending on the spot price of iron ore, Michigan’s 1.1 percent is comparable or slightly below
the tax rate of states that charge a flat rate per ton. For example, at average iron ore prices of $176
for the first half of 2011,10
Michigan would collect $1.91 for an individual ton. Minnesota, on the
other hand, charges a flat $2.38/ton – $0.47 more per ton.
Summary of Findings
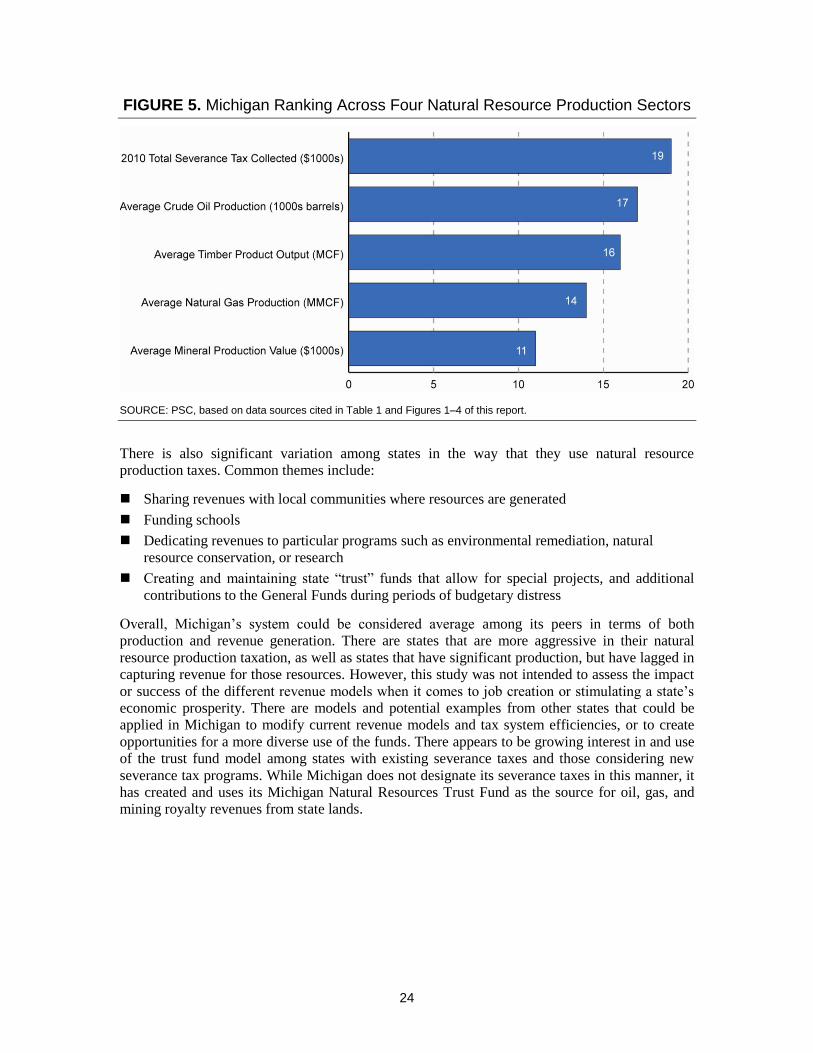
Michigan is a fairly strong player in the natural resource extraction field, as seen in Figure 5.
Michigan ranks in or close to the top one-third of producers of oil, gas, minerals/metals, and tim-
ber. The state ranks 19th overall in severance tax collected, which is comparable to its rank in
terms of overall production of these natural resources.
The top ten states in severance tax collection are roughly aligned with the top producers of oil,
gas, mining products, and timber. Two notable exceptions are West Virginia and Kentucky,
which rank 8th and 9th in revenue, respectively. Neither state, however, is in the top ten for pro-
duction of these four natural resources. Other states that rank as top ten producers for one or more
of these resources actually collect less severance tax revenue than Michigan. California and
Georgia, for example, both rank in the top ten for production of two or more resources, but have
substantially lower severance tax collections.
It is important to understand that directly comparing severance tax revenues and drawing compar-
isons among states is difficult because of how the tax systems are set up and reported. For
example, the severance tax category that is reported on by the U.S. Census does not include other
types of natural resource extraction tax revenues, such as ad valorem property taxes, yield taxes,
and license fees. These are captured in other categories, and are not broken down by source.
8 State of Arizona, “2010 Tax Handbook,” p. 22. See: http://www.azleg.gov/jlbc/10taxbook/10taxbk.pdf.
(Accessed 8-23-11.) 9State of Michigan, “Tax on Low Grade Iron Ore,” Act 77 of 1951, Section 211. See:
http://www.legislature.mi.gov/%28S%28kpppmq553hwnwq45ozo1mlrn%29%29/mileg.aspx?page=getObj
ect&objectName=mcl-211-623. (Accessed 8-23-11.) 10
Mundi Index. See: http://www.indexmundi.com/commodities/?commodity=iron-ore. (Accessed 8-23-
11.)
24
FIGURE 5. Michigan Ranking Across Four Natural Resource Production Sectors
SOURCE: PSC, based on data sources cited in Table 1 and Figures 1–4 of this report.
There is also significant variation among states in the way that they use natural resource
production taxes. Common themes include:
Sharing revenues with local communities where resources are generated
Funding schools
Dedicating revenues to particular programs such as environmental remediation, natural
resource conservation, or research
Creating and maintaining state “trust” funds that allow for special projects, and additional
contributions to the General Funds during periods of budgetary distress
Overall, Michigan’s system could be considered average among its peers in terms of both
production and revenue generation. There are states that are more aggressive in their natural
resource production taxation, as well as states that have significant production, but have lagged in
capturing revenue for those resources. However, this study was not intended to assess the impact
or success of the different revenue models when it comes to job creation or stimulating a state’s
economic prosperity. There are models and potential examples from other states that could be
applied in Michigan to modify current revenue models and tax system efficiencies, or to create
opportunities for a more diverse use of the funds. There appears to be growing interest in and use
of the trust fund model among states with existing severance taxes and those considering new
severance tax programs. While Michigan does not designate its severance taxes in this manner, it
has created and uses its Michigan Natural Resources Trust Fund as the source for oil, gas, and
mining royalty revenues from state lands.
25
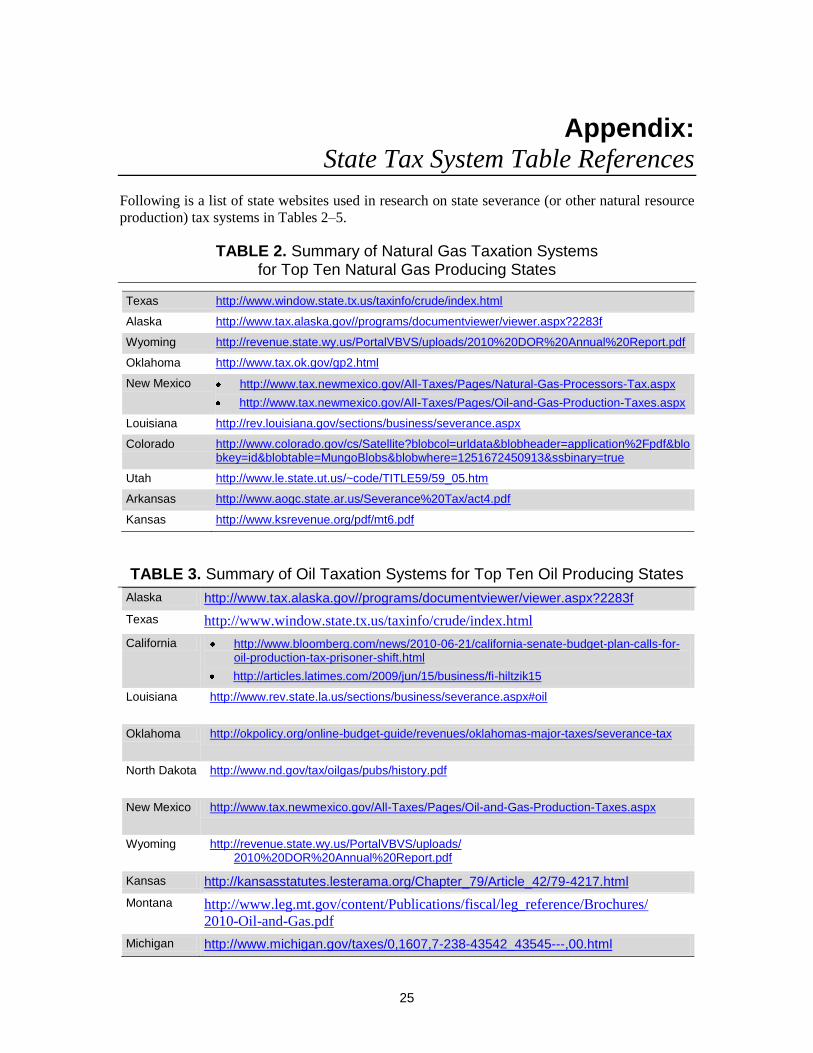
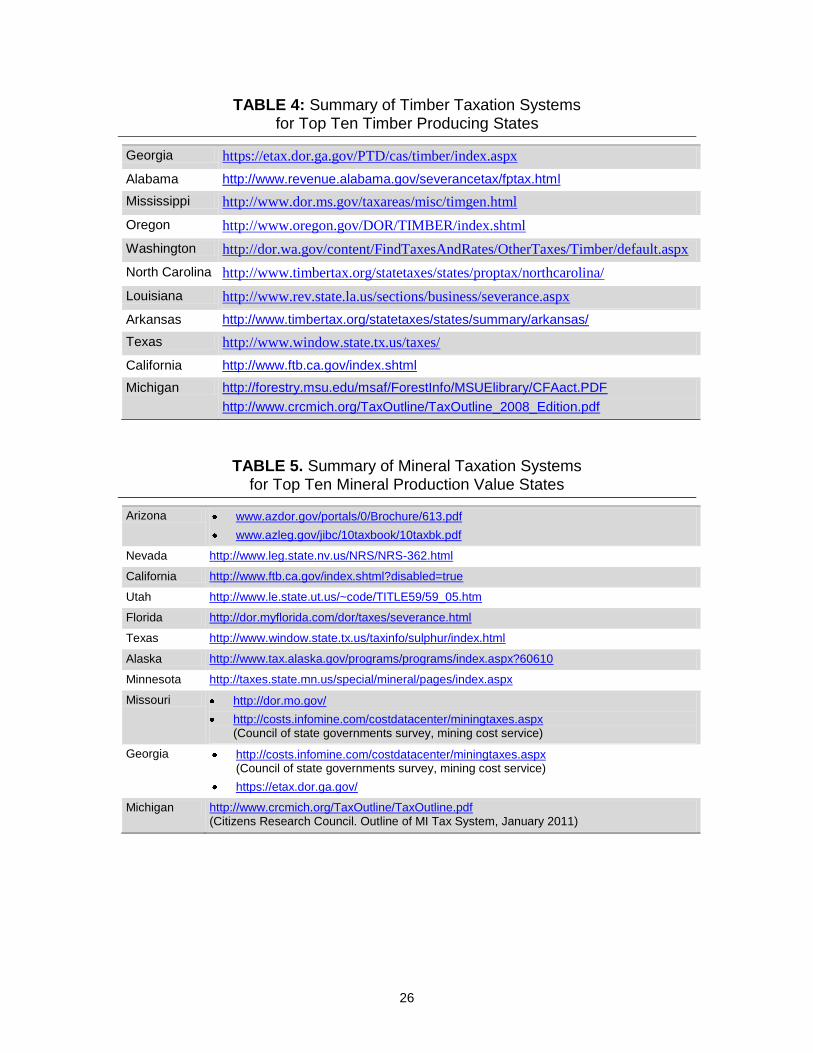
Appendix: State Tax System Table References
Following is a list of state websites used in research on state severance (or other natural resource
production) tax systems in Tables 2–5.
TABLE 2. Summary of Natural Gas Taxation Systems for Top Ten Natural Gas Producing States
Texas http://www.window.state.tx.us/taxinfo/crude/index.html
Alaska http://www.tax.alaska.gov//programs/documentviewer/viewer.aspx?2283f
Wyoming http://revenue.state.wy.us/PortalVBVS/uploads/2010%20DOR%20Annual%20Report.pdf
Oklahoma http://www.tax.ok.gov/gp2.html
New Mexico http://www.tax.newmexico.gov/All-Taxes/Pages/Natural-Gas-Processors-Tax.aspx
http://www.tax.newmexico.gov/All-Taxes/Pages/Oil-and-Gas-Production-Taxes.aspx
Louisiana http://rev.louisiana.gov/sections/business/severance.aspx
Colorado http://www.colorado.gov/cs/Satellite?blobcol=urldata&blobheader=application%2Fpdf&blobkey=id&blobtable=MungoBlobs&blobwhere=1251672450913&ssbinary=true
Utah http://www.le.state.ut.us/~code/TITLE59/59_05.htm
Arkansas http://www.aogc.state.ar.us/Severance%20Tax/act4.pdf
Kansas http://www.ksrevenue.org/pdf/mt6.pdf
TABLE 3. Summary of Oil Taxation Systems for Top Ten Oil Producing States
Alaska http://www.tax.alaska.gov//programs/documentviewer/viewer.aspx?2283f
Texas http://www.window.state.tx.us/taxinfo/crude/index.html
California http://www.bloomberg.com/news/2010-06-21/california-senate-budget-plan-calls-for-oil-production-tax-prisoner-shift.html
http://articles.latimes.com/2009/jun/15/business/fi-hiltzik15
Louisiana http://www.rev.state.la.us/sections/business/severance.aspx#oil
Oklahoma http://okpolicy.org/online-budget-guide/revenues/oklahomas-major-taxes/severance-tax
North Dakota http://www.nd.gov/tax/oilgas/pubs/history.pdf
New Mexico http://www.tax.newmexico.gov/All-Taxes/Pages/Oil-and-Gas-Production-Taxes.aspx
Wyoming http://revenue.state.wy.us/PortalVBVS/uploads/ 2010%20DOR%20Annual%20Report.pdf
Kansas http://kansasstatutes.lesterama.org/Chapter_79/Article_42/79-4217.html
Montana http://www.leg.mt.gov/content/Publications/fiscal/leg_reference/Brochures/
2010-Oil-and-Gas.pdf
Michigan http://www.michigan.gov/taxes/0,1607,7-238-43542_43545---,00.html
26
TABLE 4: Summary of Timber Taxation Systems for Top Ten Timber Producing States
Georgia https://etax.dor.ga.gov/PTD/cas/timber/index.aspx
Alabama http://www.revenue.alabama.gov/severancetax/fptax.html
Mississippi http://www.dor.ms.gov/taxareas/misc/timgen.html
Oregon http://www.oregon.gov/DOR/TIMBER/index.shtml
Washington http://dor.wa.gov/content/FindTaxesAndRates/OtherTaxes/Timber/default.aspx
North Carolina http://www.timbertax.org/statetaxes/states/proptax/northcarolina/
Louisiana http://www.rev.state.la.us/sections/business/severance.aspx
Arkansas http://www.timbertax.org/statetaxes/states/summary/arkansas/
Texas http://www.window.state.tx.us/taxes/
California http://www.ftb.ca.gov/index.shtml
Michigan http://forestry.msu.edu/msaf/ForestInfo/MSUElibrary/CFAact.PDF
http://www.crcmich.org/TaxOutline/TaxOutline_2008_Edition.pdf
TABLE 5. Summary of Mineral Taxation Systems for Top Ten Mineral Production Value States
Arizona www.azdor.gov/portals/0/Brochure/613.pdf
www.azleg.gov/jibc/10taxbook/10taxbk.pdf
Nevada http://www.leg.state.nv.us/NRS/NRS-362.html
California http://www.ftb.ca.gov/index.shtml?disabled=true
Utah http://www.le.state.ut.us/~code/TITLE59/59_05.htm
Florida http://dor.myflorida.com/dor/taxes/severance.html
Texas http://www.window.state.tx.us/taxinfo/sulphur/index.html
Alaska http://www.tax.alaska.gov/programs/programs/index.aspx?60610
Minnesota http://taxes.state.mn.us/special/mineral/pages/index.aspx
Missouri http://dor.mo.gov/
http://costs.infomine.com/costdatacenter/miningtaxes.aspx (Council of state governments survey, mining cost service)
Georgia http://costs.infomine.com/costdatacenter/miningtaxes.aspx (Council of state governments survey, mining cost service)
https://etax.dor.ga.gov/
Michigan http://www.crcmich.org/TaxOutline/TaxOutline.pdf (Citizens Research Council. Outline of MI Tax System, January 2011)