Embed Size (px)
Citation preview

MacRitchie Reservoir
AN OVERVIEW OF PUB SINGAPORE &
OUR WATER QUALITY CHALLENGES
Puah Aik Num
Chief Engineer, Water Supply (Plants) Department
www.pub.gov.sg
Presentation Overview
1
1. Brief overview of Singapore & PUB
2. Brief overview of Choa Chu Kang Waterworks
3. Our water quality challenges
4. Feasibility study of the SIX® technology

MacRitchie Reservoir
About Singapore & PUB
2

www.pub.gov.sg
Land Area ~719 km2
Population 5.6 mil
Average Annual Rainfall 2.328m
Average Water Demand 430MGD (1.95mil m3/day)
Singapore
Singapore

www.pub.gov.sg
Capture everydrop or water
Reuse water endlessly
Desalinateseawater
Technology & Innovation
Our Key Strategies

www.pub.gov.sg
Our Closed Water Loop
5

www.pub.gov.sg
Our Four National Taps

www.pub.gov.sg
Capture Every Drop
• 17 Reservoirs• 2/3 Catchment Area• 8 Waterworks (including Johor River Waterworks)
Local Catchment
Choa Chu Kang Waterworks

MacRitchie Reservoir
Choa Chu Kang Waterworks

www.pub.gov.sg
Capture Every DropChoa Chu Kang Waterworks
Choa Chu Kang Waterworks
KranjiReservoir
PandanReservoir
TengehReservoir
• Serves the western catchment• 3 raw water sources• Capacity of 80 MGD
• 40 MGD Phase 1: Membranes• 40 MGD Phase 2: Sand filters
www.pub.gov.sg
10
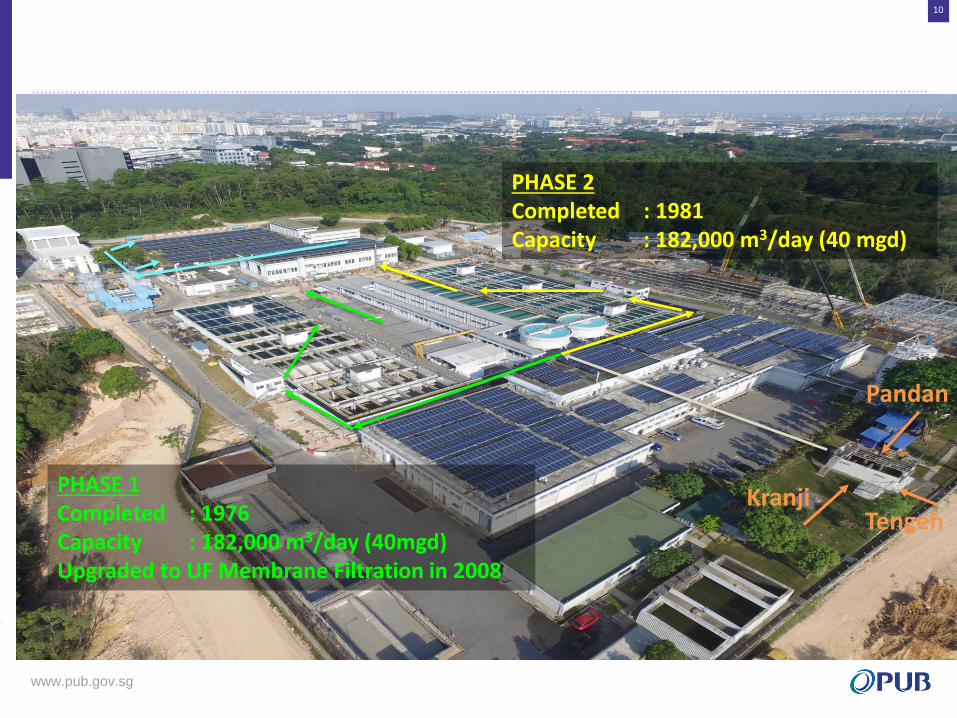
PHASE 1Completed : 1976 Capacity : 182,000 m3/day (40mgd)Upgraded to UF Membrane Filtration in 2008
PHASE 2Completed : 1981Capacity : 182,000 m3/day (40 mgd)
Kranji
Pandan
Tengeh

www.pub.gov.sg
11
To Service
Reservoir
Pumping
Station
Raw water
Reservoirs
To Service
Reservoir
Screening
Immersed Ultra
Filtration
Lime
Alum
Clear Water
Tank
Lime
Sodium
Hypo
Chlorine
Contact Tank
Fluoride
Coagulation
& Flocculation
Sedimentation
CCK Phase 1 (Membranes)
Sodium
Hypo
AmmoniaSodium
Hypo
Raw water
Reservoirs
Sludge Treatment
Plant
Coagulation
& Flocculation
Sedimentation Sand Filtration
Sodium
Hypo
Lime
Fluoride
CCK Phase 2 (Sand Filters)
Ozone
Sodium
Hypo
Pumping
Station
Ammonia
Lime
AlumPolymerSodium
Hypo
Clear Water
TankScreening
Treatment Process

MacRitchie Reservoir
Our Water Quality Challenges
12

www.pub.gov.sg
13
High TOC in raw water risks the formation of Disinfection By-products
High algae counts, particularly blue-green algae counts, can result in aesthetic issues, e.g.
visual impact (algal scum) and undesirable taste and odour compounds (MIB & geosmin)
Jurong Lake
Tengeh CCKWW
Poyan
Murai
Sarimbun
Pandan• Indirect catchment• Low turnover in dry period• Blue-green algae growth• Higher TOC
Kranji• Nutrient loads from
agricultural catchment • Blue-green algae growth• Higher TOC
Tengeh-Poyan• Blue-green algae
growth• Higher TOC
Kranji
Pandan
Reservoir Water Quality Challenges

www.pub.gov.sg
0,0
2,0
4,0
6,0
8,0
10,0
12,0
14,0
16,0
18,0
20,0
1 Jan 2012 1 Jan 2013 2 Jan 2014 3 Jan 2015 4 Jan 2016 4 Jan 2017 5 Jan 2018 6 Jan 2019 7 Jan 2020 7 Jan 2021 8 Jan 2022
TOC
(m
g/L
)
TOC Levels of Raw Water Sources
Kranji Pandan Tengeh Blended
Increasing TOC Levels of our Raw Waters
14
2X in 10 years

www.pub.gov.sg
0,0
1,0
2,0
3,0
4,0
5,0
6,0
7,0
8,0
9,0
10,0
1 Jan 2012 1 Jan 2013 2 Jan 2014 3 Jan 2015 4 Jan 2016 4 Jan 2017 5 Jan 2018 6 Jan 2019 7 Jan 2020 7 Jan 2021 8 Jan 2022
DO
C (
mg
/L)
DOC Levels of Raw Water Sources
Kranji Pandan Tengeh Blended
Increasing DOC Levels of our Raw Waters
15
2X in 10 years

www.pub.gov.sg
Varying Quality of Raw Waters
Unique DOC profiles for each water source
16
0
1
2
3
4
5
6
7
0 10 20 30 40 50 60 70 80 90 100
Rela
tiv
e S
ign
al
Resp
on
se
Retention Time (min)
Kranji
Pandan
Tengeh
Blended
Biopolymers
Humics
Building Blocks
LMW

www.pub.gov.sg
Impact of DOCs on CCKWW
18
• Increase chlorine demand
• Increase membrane fouling
• Increase DBP / TTHM formation potential
• Higher nitrification potential in distribution network
www.pub.gov.sg
Current Control Measures
19
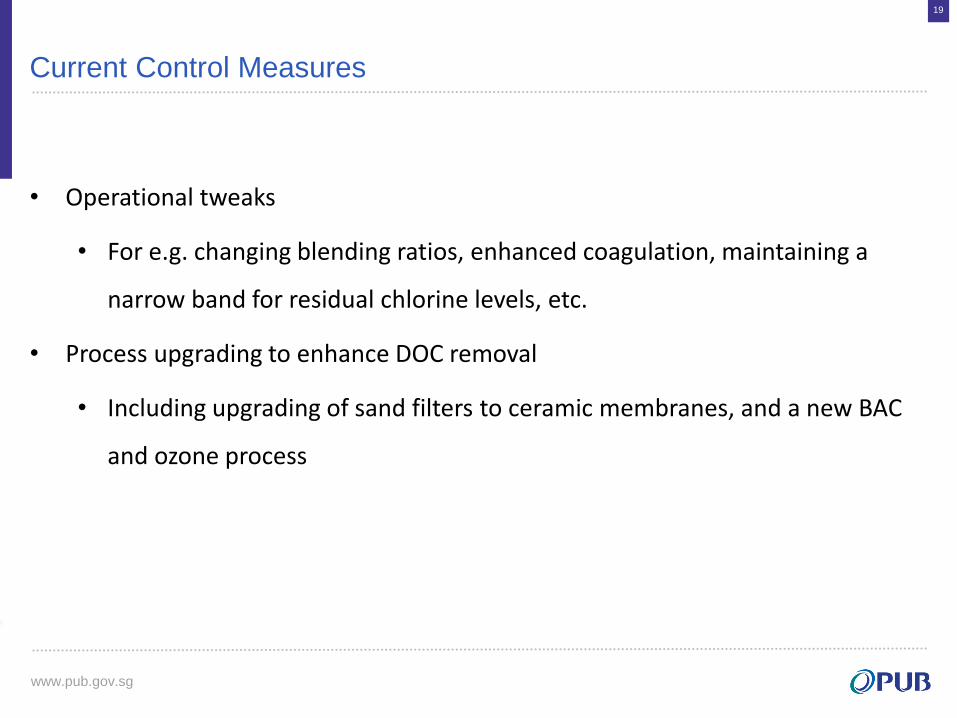
• Operational tweaks
• For e.g. changing blending ratios, enhanced coagulation, maintaining a
narrow band for residual chlorine levels, etc.
• Process upgrading to enhance DOC removal
• Including upgrading of sand filters to ceramic membranes, and a new BAC
and ozone process

MacRitchie Reservoir
Feasibility Study of SIX®
20

www.pub.gov.sg
Feasibility of SIX® at CCKWW
DOC removal by SIX®
21
• A 6-month bench-scale trial of SIX® was done in CCKWW (Dec 2017 to Jun 2018)
• Results showed the following optimal operating conditions:
Resin concentration 15 – 20 mL/L
Contact time 30 minutes
DOC removal 42% for blended water
UVT increase 17.6% for blended water

www.pub.gov.sg
0
1
2
3
4
5
0 10 20 30 40 50 60 70 80 90 100
Rel
ativ
e Si
gnal
Res
po
nse
Retention Time (min)
Blended RW (6 Feb 18)
SIX (LL 15mL/L) (6 Feb 18)
Settled Water (1 Feb 18)
Blended RW (1 Feb 18)
LC-OCD Sample Analysis
DOC removal by SIX® vs coagulation
22
Biopolymers
Humics
Building Blocks
LMW
SIX and coagulation target different DOC fractions.

www.pub.gov.sg
LC-OCD Sample Analysis
Further DOC removal using coagulation after SIX®
23
0
1
2
3
4
5
0 10 20 30 40 50 60 70 80 90 100
Rel
ativ
e Si
gnal
Res
po
nse
Retention Time (min)
Blended RW (6 Feb 18)
SIX (LL 15mL/L) (6 Feb 18)
SIX-FeCl3 (10ppm) (7 Feb 18)
SIX-Alum (15ppm) (7 Feb 18)
Biopolymers
Humics
Building Blocks
LMW
Enhanced DOC removal using lesser coagulant.

www.pub.gov.sg
Feasibility of SIX® at CCKWW
Brine challenges
24
• The regeneration process requires ~30 g/L NaCl solution
• A waste brine is generated:
Sewer discharge limits in Singapore:• TDS < 3,000 ppm• Cl- < 1,000 ppm
Amount of salt required 70 tonnes/day
Total amount of brine waste: ~2,346 m3/day
Chloride in the brine waste 6,150 ppm
TDS in the brine waste >6,150 ppm
*Values based on calculations for 80 MGD

www.pub.gov.sg
• Blending of brine with other waste streams
• On-site treatment of brine
• Discharging of brine into sea
• Injection into the ground
Feasibility of SIX® at CCKWW
Brine management options?
25
IDEAS?

MacRitchie Reservoir
Thank you