Embed Size (px)
Citation preview

An Overview of Poverty Reduction Strategies: First FYP to Fifth FYP
Presentation byDr. Muhammad G. Sarwar
Civil Service College, Dhaka13 June 2011

Presentation Contents
• Poverty in Post-Independent Bangladesh• Historical Context of Mid-Term Planning• Planning for Poverty Reduction– First Five Year Plan 1973-78– Tow Year Plan 1979-80– Second Five Year Plan 1981-85– Third Five Year Plan 1986-90– Fourth Five Year Plan 1991-95– Fifth Five Year Plan 1997-2001
2

Poverty in Post-Independent Bangladesh
Types of Poverty 1963/64 1973/74
Absolute Poverty 40 79
Extreme Poverty 05 42
3

Planning for Poverty Reduction: Bangladesh Development Planning is based on the State
Constitution (Part II, Articles 9 -20)
1. Article 14: emancipation of the peasants and workers from all forms of exploitation;
2. Article 15: provision of basic necessities of life- food, clothing, shelter, education, and medical care;
3. Article 16: rural and agricultural development;4. Article 17: free and compulsory education;5. Article 18: improvement of nutrition and public health;6. Article 19: equality of opportunity to all citizen;7. Article 10: participation of women in national life. 8. Article 9: promotion of local govt. institutions for improving
public service delivery;
4

Historical Context of Mid-Term Planning
• After Bolshevik Revolution Soviet Union initiated mid-tem five year centralized state planning in early 1920s
• Newly emerged decolonized independent countries in Asia and Africa followed the mid-term five year centralized mixed economy planning in 1950s after the Second World War
5

1970s: Dominant Development Planning Paradigm
In 1970s Dominant Development Planning Paradigm
was Keynesian economic model that advocates state
interventions in economic management. Technical
framework mostly based on H-D model along with
with I-O tables– First Five Year Plan 1974 – 1978
– Two Year Plan 1979 -1980
6

First Five Year Plan 1973-78:Plan Objectives
– To reduce poverty– To continue and complete the reconstruction work to the
benchmark of 1969/70– To expand the output of essential consumption items– To arrest the inflation (rising trend in the general price
level)– To increase the GDP growth rate – To increase per capita income – To attain self-sufficiency in food-grain production– To reduce population growth rate – To reduce dependency on foreign aid– To consolidate the gains made so far in socialist
transformation of Bangladesh 7

First Five Year Plan: targets
• Increasing GDP growth rate to 5.5% per annum• Increase per capita income at the rate of 2.5% per
annum • Employment creation of 54 lakh man-year (against
39.3 lakh man-year additional employment requirement in the Plan period)
• Reducing dependency on foreign aid to 27% of total investment requirement
• Reducing population growth rate to 2.8% from 3.0% per annum
8

First Five Year Plan: Plan outlay and its financing
(Crore Taka at 1972/73 prices)
Plan Outlay 4,455
Public 3,952(88.7%)
Private 503(11.3%)
Financing Domestic Recourse 2,656
(59.6%)
Foreign Aid 1,799(49.4%)
9

First Five Year Plan: strategies
• Recovery of the war damaged economy• Growth of Output and Income • Equitable distribution of income• Employment creation (generating 54 lakh man-year in
crop agriculture, rural works programme, construction, industry, and social sectors against 39.3 lakh man-year additional employment requirement in the Plan period)
10

First Five Year Plan: achievements /failures
• GDP growth rate per annum: 4.0% (GDP grew by 44%)
• Domestic resource mobilization: 20% of Plan outlay
• Money supply grew by 148%, so was the general price level
• Terms of trade deteriorated to 69 by 1978 from 100 in 1973
11

1980s: Dominant Development Planning Paradigm
Keynesian model was discredited 1098s due to bad performance of the State Enterprises, however, Keynesian Planning model continued. Technical Framework incorporated SAM in addition to I-O table
– Second Five Year Plan (1981 – 1985)
– Third Five Year Plan (1986 -1990)
12

Second Five Year Plan 1981-85: Plan Objectives/targets
– Attaining 5.4 % GDP growth rate per annum on average
– Equitable growth– Expansion of employment– Eliminate illiteracy and achieve universal primary
education– Reducing population growth rate– Strengthening local government– Domestic resource mobilization to attain self-
reliance13

Second Five Year Plan 1981-85:Plan Strategies
• Emphasis on rural development• Increasing agricultural production• Regional / spatial planning to reduce regional
disparity• Developing Institutional Framework for local level
production planning• Industrialization• Balancing public and private sector development• Population planning
14

Second Five Year Plan 1981-85:Plan Outlay and Financing
(Crore Taka at 1979/80 prices)
Plan Outlay 17,200 Public 11,100
(64.5%)
Private 6,100(35.5%)
Financing
Domestic Recourse 9,100(52.9%)
Foreign Aid 8,100(47.1%)
15
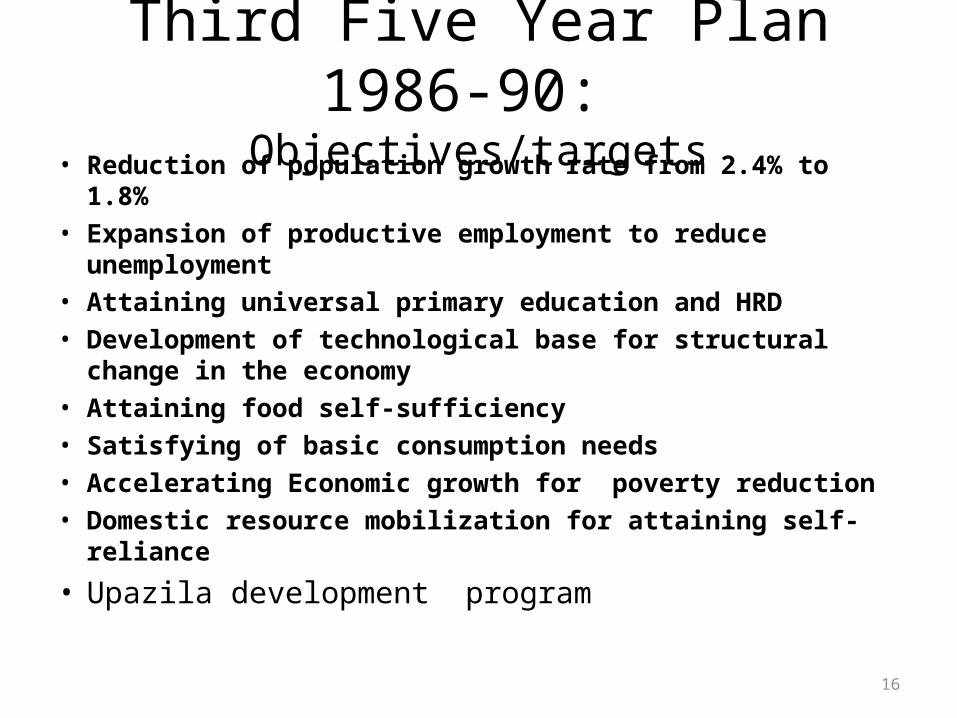
Third Five Year Plan 1986-90: Objectives/targets
• Reduction of population growth rate from 2.4% to 1.8%• Expansion of productive employment to reduce
unemployment• Attaining universal primary education and HRD• Development of technological base for structural change in
the economy• Attaining food self-sufficiency• Satisfying of basic consumption needs• Accelerating Economic growth for poverty reduction• Domestic resource mobilization for attaining self-reliance
• Upazila development program
16

Third Five Year Plan 1986-90:Plan Outlay and Financing
(Crore Taka at 1984/85 prices)
Plan Outlay 38,600
Public 25,000(64.8%)
Private 13,600(35.2%)
Financing Domestic Recourse 17,572
(45.5%)
Foreign Aid 21,028(54.5%)
17
1990s: Dominant Development Planning Paradigm
• In 1990s Neo-liberal ‘Washington Consensus’ emerged that advocated market liberalization for higher economic growth and targeted safety-net programs for poverty reduction.
• Keynesian Planning Model along with neo-classical growth model with more emphasis on market economy followed-
Fourth Five Year Plan (1991 – 1995)Fifth Five Year Plan (1998 – 2002)
18

Fourth Five Year Plan 1991-95
• Plan Objectives/targets– Attaining 5% per annum average economic
growth in the plan period – Poverty Alleviation and HRD– Increasing self-reliance
19

Fourth Five Year Plan 1991-95:Strategies
• Export led economic growth• Intra-sectoral balance in sectoral planning• Efficiency culture in the economy• Mainstreaming women development in Planning• Reduction of population growth rate• Restructuring administrative system• Increasing private and public investment• Community participation through NGOs• Local level (district level) planning
20

Fourth Five Year Plan 1991-95:Plan Outlay and Financing
(Crore Taka at 1989/90 prices)
Plan Outlay 62,000
Public 34,700(56.0%)
Private 27,300(44.0%)
Financing
Domestic Recourse 43,400(70.0%)
Foreign Aid 18,600(30.0%)
21

Fifth Five Year Plan 1997-2001:objectives
• Poverty alleviation through accelerated economic growth rate
• Employment generation• Creating an equitable soceity• Attaining food self-sufficiancy• Human Resources Development• Development of Physical Infrastructure• Development of CHT, north-west and coastal regions
22

Fifth Five Year Plan 1997-2001:objectives (contd.)
• Reducing population growth rate• Strengthening scientific and technological
base• Protection of environment• Closing gender gap• Establishing social justice• Development of local governments.
23

Fifth Five Year Plan 1997-2001:targets
• Achieving on average 7% per annum GDP growth rate in the plan period
• Reducing population growth rate to 1.3 % per annum at the terminal year of the Plan.
24

Fifth Five Year Plan 1997-2001:plan outlay and financing
(Crore Taka at 1996/97 prices)
Plan Outlay 195,952
Public 85,894(43.8%)
Private 110,058(56.2%)
Financing
Domestic Recourse 151,976(77.5%)
Foreign Aid 43,976(22.5%)
25

Five Year Plans: Public vs. Private Investment
26

Financing Five Year Plans:Domestic vs. Foreign aid
27

Comparative Performance of Five Year Plans(Million Taka at respective base year prices)
Plan Period Plan Size Actual Expenditure
Growth Targets (%)
Realized Growth Rate (%)
First Plan 44,550 20,740 5.5 4.0
Two Year Plan
38,610 33,590 5.6 3.5
Second Plan 172,000 152,970 5.4 3.8
Third Plan 386,000 270,110 5.4 3.8
Fourth Plan 620,000 598,480 5.0 4.2
Fifth Plan 1959,521 7.0 5 .128

Realized GDP Growth Rate in Mid-Term Plans
29

Trends in Poverty and Inequalityover the Plan Periods
1973 1981 1991 2000 2005
Absolute Poverty(Headcount Rate)
79% 58.8% 49.8% 40.0%
Gini Index of Inequality
0.259 0.306 0.467
30

Poverty Trends. 1974 - 2005
31

Inequality Trend 1991 - 2005
32

Critique of Development Planning in Bangladesh
• All the Five Year Plans were implemented only partially indicating the lack of political will and institutional capacity to implement successive Five Year Plans
• Non of the Five Year Plan did set specific poverty reduction targets implying stated ‘poverty reduction’ objective has been a political economy rhetoric to some extent
• While Bangladesh has a success story to tell to some extent regarding ‘poverty reduction’ but the down side of planning has been the rising inequality
33

Thanks !
34