Embed Size (px)
Citation preview
AN OVERVIEW OF ECONOMIC, SOCIAL,AND DEMOGRAPHIC TRENDS
AFFECTING THE US LABOR MARKET
Robert I. LermanStefanie R. Schmidt
The Urban InstituteWashington, D.C.
Final ReportAugust 1999
This report was prepared at the Urban Institute for US Department of Labor, Office of theAssistant Secretary for Policy, under DOL Contract No. J-9-M-0048, #23. The views expressedare those of the authors and should not be attributed to the Department of Labor, the UrbanInstitute, its trustees, or its funders.
i
Abstract
This paper offers an assessment of broad social, economic, and demographic trends affecting theUS labor force now—in this time of strong economic growth—and in the future. The focus is ondemographic trends, work and family issues, health and pension patterns, technical change,adjustment to low unemployment, globalization, and the plight of low-skilled workers. Thepaper identifies several important trends and patterns, including: 1) the largest demographic shiftrelevant to the job market is the impending decline in the share of prime-age workers; 2) over 60percent of workers do not have their own children in their home, but an increasing share ofworkers care for elderly relatives; 3) the impact of the substantial shift from defined-benefit(DB) to defined-contribution (DC) pension plans on workers is unclear, but some estimatessuggest that the typical worker will gain financially; 4) while investment in computers is spurringtechnical change, the impacts on productivity in firms vary a great deal because of the varyingorganizational responses to technology; 5) the labor market has adjusted surprisingly well to lowunemployment, partly because college-educated workers have accounted for over 90 percent ofthe net growth in employed adult workers during the 1992-99 expansion; 6) globalization ofproduction is unlikely to have weakened the position of US workers because overall foreigninvestment in the US has exceeded US investment abroad and foreign direct investment has beennearly as high as US direct investment; 7) while the economic expansion greatly reducedunemployment and expanded job opportunities for low-skill workers, many less-educated menwho left the labor force in earlier years have not reentered the job market.
Brief Description
This paper offers an assessment of broad social, economic, and demographic trends affecting theUS labor force now—in this time of strong economic growth—and in the future. The focus is ondemographic trends, work and family issues, health and pension patterns, technical change,adjustment to low unemployment, globalization, and the plight of low-skilled workers.
Keywords: Labor Market, Jobs, Economic, Social, Demographic
ii
Table of Contents
Introduction 1
I. Demographic Change and the Future Workforce 2
II. Trends in Work and Family, Health Insurance, Pensions 12
III. Trends in Employer-Provided Health and Pension Benefits and Families 24
IV. Technology and Work Organization 27
V. Adapting to Tight Labor Markets 34
VI. Globalization 55
VII. The Low-Skilled Labor Market 79
iii
Tables
Table 1: The Changing Mix of the US Labor Force by Age, Ethnicity, and Sex:1976-2006 4
Table 2: Participation in Job-Related Education and Training by Age Group inthe US and Other Selected Countries 10
Table 3: Percent of Women in the Labor Force in Various Types of Families:Second Quarter of 1998 14
Table 4: Percent of men in the Labor Force in Various Types of Families:Second Quarter of 1998 14
Table 5: Annual Work Hours of Husbands and Wives with at Least One Child 19
Table 6: Gains in Employment-Population Ratios and Unemployment RateReductions by Age, Ethnicity, and Education: 1992-1998 39
Table 7: Distribution of Net Employment Growth of Population, Ages 25 andOver, by Educational Status: 1992-1998, 1st Half 41
Table 8: Relationship Between Changes in Wage Rates and Weekly Earningsand State Labor market Conditions: 1995:I to 1998:I 45
Figures
Figure 1: Relationship Between Unemployment Rate, Consumer Price Index (CPI),and Employment Cost Index (ECI): 1980-1998 36
Figure 2: Trends in Unemployment Rates and Labor Force Participation Rates:1970-1998 38
Figure 3: Distribution of Unemployment Rates by State: 1998:I 43
Figure 4: Average of Exports Plus Imports as a Share of Gross Domestic Product:1959-1998 58
1
The recent performance of the US job market has proved surprisingly strong.
Unemployment rates are at a 30 year low and far below what most macroeconomists predicted
could be reached without substantial increases in inflation. Job growth has been strong.
Employers have expanded their recruitment to reach large numbers of youth, low-skilled
workers, mothers heading families, and other groups generally not favored in the labor market.
Even wages, which had been rising only slowly, have been increasing more rapidly.
In the context of today’s good times, it makes sense to step back and assess the broader
trends affecting the job market of today and the future. One rationale is to put in place policies
that can help sustain the economic expansion without spurring a new round of inflation. A
second rationale is to improve our understanding of the interactions between the job market,
emerging social, economic, and demographic trends, and public policies. What forces will
policymakers have to confront in the future? Is wage inequality likely to increase in the future?
How can we best meet employer demands while giving priority to the needs of low-skilled
workers and their families?
The purpose of this paper is to contribute to the dialogue about these and related
questions. We review seven broad social, economic, and demographic trends affecting the US
labor force now and in the future. The seven topics deal in turn with demographic trends, work
and family issues, health and pension patterns, technical change, adjustment to low
unemployment, globalization, and low-skilled workers. The purpose is first, to set the context for
new research by bringing together existing knowledge and second, to provide some initial ideas
relevant to public policy. Clearly, government policies have a considerable influence on the job
market. If new policies are derived informed by the latest research, better policies may
2
materialize.
I. Demographic Change and the Future Workforce
Important demographic trends will take place in the workforce over the next 10-15 years.
The emerging patterns are the result of ups and downs in birth rates (low in the late 1920s and
early 1930s, high in the late 1940s through the early 1960s, and modest growth in the late 1970s
through the early 1990s). The population and labor force will continue to diversify, as
immigration continues to account for a sizable part of population growth. Projections suggest that
the Hispanic and Asian shares of the population will rise from 14 percent in 1995 to 19 percent in
2020.
BLS projections imply that over the next decade, 40 million people will enter the work
force, about 25 million will leave the work force, and 109 million will remain. Although only a
modest reduction will take place in the overall growth in the workforce (from 1.3 percent per
year to 1.1 percent per year), the composition of growth will generate rising shares of young
(under 25) and older (45 and over) workers and a decline in the share of middle-age workers.
These trends constitute a sharp reversal of the last decades. Consider the trends in the
youth labor force (16-24 year-olds). After declining by 9 percent from 1986-96 and not growing
between 1976 and 1986, the youth labor force will keep pace with the overall labor force with an
expected 15 percent increase over the next decade. More dramatic are the changing patterns of
growth among prime age workers and older workers. The prime age group of 25-54 year-olds
accounted for virtually all the workers added to the labor force over the last two decades.
Between 1976 and 1996, 38 million prime age workers and 1.7 million workers 55 and over
3
joined the labor force, while reductions in the youth labor force amounted to about 2.1 million.
Over the next decade, instead of having nearly all increases in employment coming from the 25-
54 year-old age group, fewer than one in three (31 percent) of the added workers will be in this
category. Nearly half of the additional workers will come from the 55 and older category, while
about one in five will come from the youth labor force.
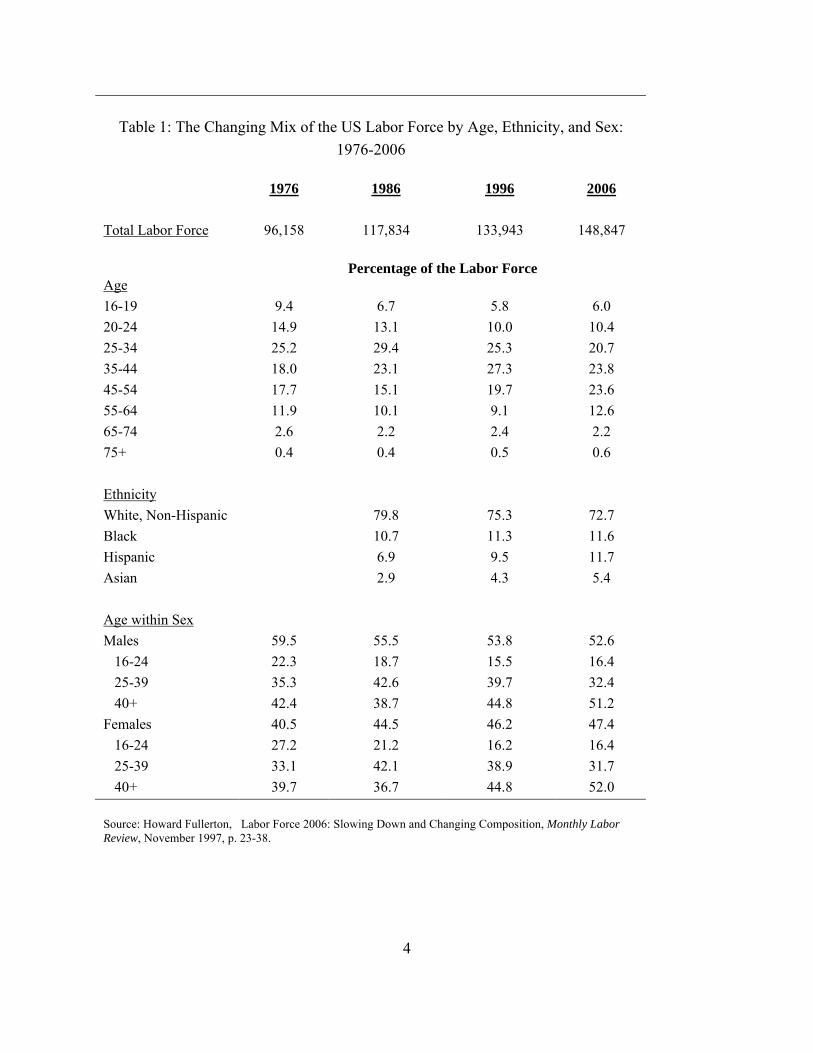
The overall reversal in the prime age category of workers masks a major change within
the group. Note in Table 1 that the most experienced workers (45-54 year-olds) will expand
rapidly enough to raise their share of the labor force. At the same time, declines will take place in
the absolute numbers of 25-34 year-olds and of 35-44 year-olds. As a result, the proportion of 25-
44 year-olds in the labor force will decline from 52.6 percent in 1996 to 44.5 percent in 2006.
Workers in the 45+ categories will raise their demographic share from 32 percent to 39 percent.
These are large and dramatic changes for a decade. The labor force share is increasing among
older workers (from 28.8 percent to 36.2 percent among 45-64 year-olds) and younger workers
(from 15.8 percent to 16.4 percent among 16-24 year-olds). However, the proportion of workers
beyond the normal retirement age of 65 will remain below 3 percent.
The specific trends in the age composition of the work force vary with future time periods
and are subject to uncertainty related to labor force participation rates. The aging of the
population is largely the result of boom in births during the 1946-64 period. Over the coming
decade (through 2005), substantial growth will occur among 45-64 year-olds, but the number
over age 65 will increase only modestly (by five percent). However, between 2005 and 2010, the
population of 65-69 year-olds will rise by 17 percent and then explode by another 37 percent in
the 2010-2020 period. The jump in the 70 and over population will occur between 2010 and
4
Table 1: The Changing Mix of the US Labor Force by Age, Ethnicity, and Sex:1976-2006
1976 1986 1996 2006
Total Labor Force 96,158 117,834 133,943 148,847
Percentage of the Labor ForceAge
16-19 9.4 6.7 5.8 6.0
20-24 14.9 13.1 10.0 10.4
25-34 25.2 29.4 25.3 20.7
35-44 18.0 23.1 27.3 23.8
45-54 17.7 15.1 19.7 23.6
55-64 11.9 10.1 9.1 12.6
65-74 2.6 2.2 2.4 2.2
75+ 0.4 0.4 0.5 0.6
Ethnicity
White, Non-Hispanic 79.8 75.3 72.7
Black 10.7 11.3 11.6
Hispanic 6.9 9.5 11.7
Asian 2.9 4.3 5.4
Age within Sex
Males 59.5 55.5 53.8 52.6
16-24 22.3 18.7 15.5 16.4
25-39 35.3 42.6 39.7 32.4
40+ 42.4 38.7 44.8 51.2
Females 40.5 44.5 46.2 47.4
16-24 27.2 21.2 16.2 16.4
25-39 33.1 42.1 38.9 31.7
40+ 39.7 36.7 44.8 52.0
Source: Howard Fullerton, �Labor Force 2006: Slowing Down and Changing Composition, Monthly LaborReview, November 1997, p. 23-38.
5
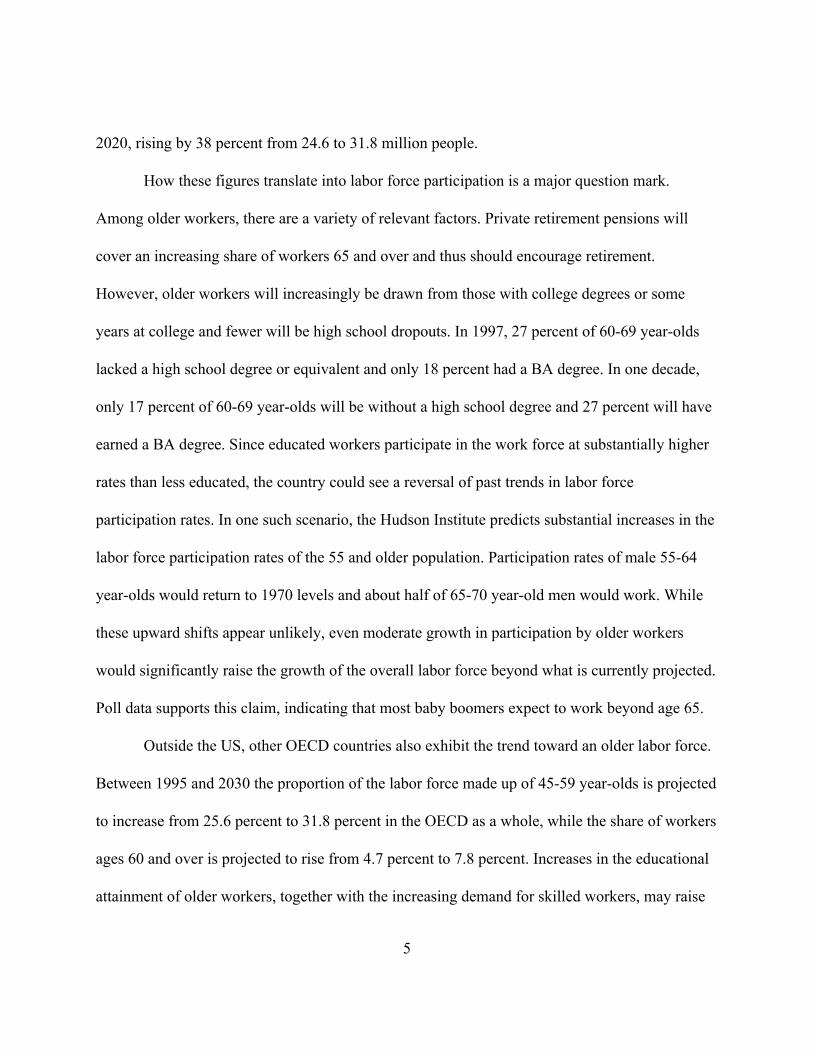
2020, rising by 38 percent from 24.6 to 31.8 million people.
How these figures translate into labor force participation is a major question mark.
Among older workers, there are a variety of relevant factors. Private retirement pensions will
cover an increasing share of workers 65 and over and thus should encourage retirement.
However, older workers will increasingly be drawn from those with college degrees or some
years at college and fewer will be high school dropouts. In 1997, 27 percent of 60-69 year-olds
lacked a high school degree or equivalent and only 18 percent had a BA degree. In one decade,
only 17 percent of 60-69 year-olds will be without a high school degree and 27 percent will have
earned a BA degree. Since educated workers participate in the work force at substantially higher
rates than less educated, the country could see a reversal of past trends in labor force
participation rates. In one such scenario, the Hudson Institute predicts substantial increases in the
labor force participation rates of the 55 and older population. Participation rates of male 55-64
year-olds would return to 1970 levels and about half of 65-70 year-old men would work. While
these upward shifts appear unlikely, even moderate growth in participation by older workers
would significantly raise the growth of the overall labor force beyond what is currently projected.
Poll data supports this claim, indicating that most baby boomers expect to work beyond age 65.
Outside the US, other OECD countries also exhibit the trend toward an older labor force.
Between 1995 and 2030 the proportion of the labor force made up of 45-59 year-olds is projected
to increase from 25.6 percent to 31.8 percent in the OECD as a whole, while the share of workers
ages 60 and over is projected to rise from 4.7 percent to 7.8 percent. Increases in the educational
attainment of older workers, together with the increasing demand for skilled workers, may raise
6
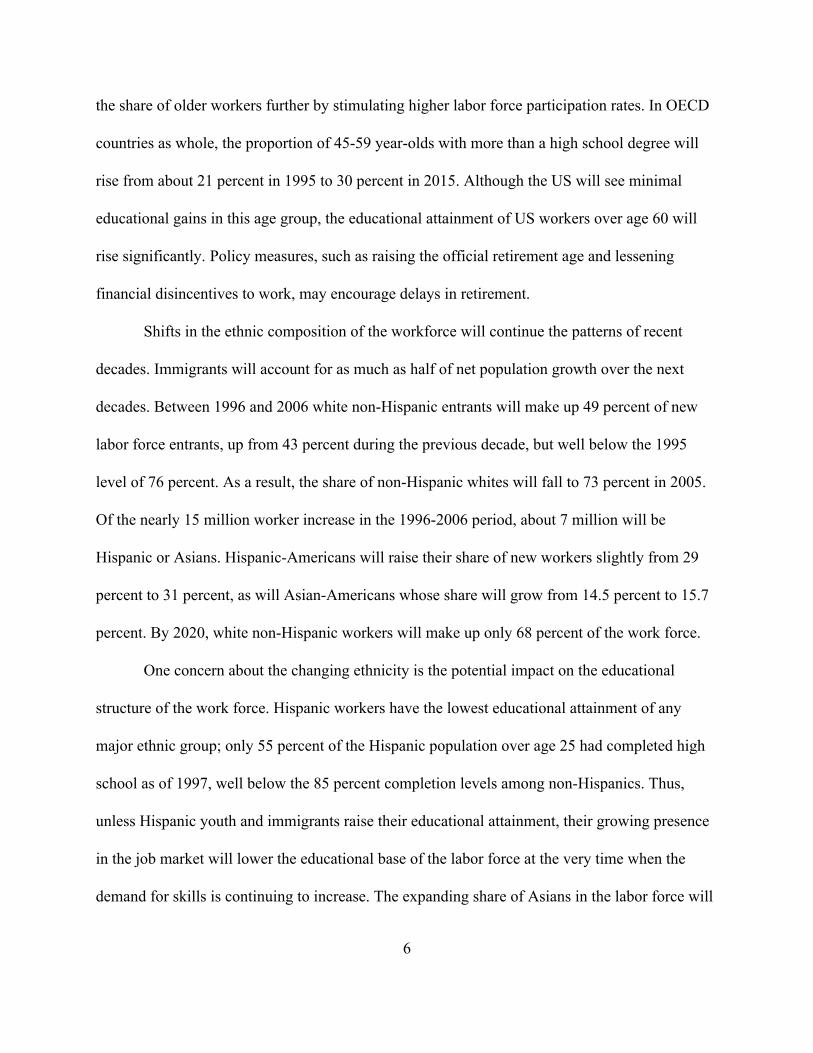
the share of older workers further by stimulating higher labor force participation rates. In OECD
countries as whole, the proportion of 45-59 year-olds with more than a high school degree will
rise from about 21 percent in 1995 to 30 percent in 2015. Although the US will see minimal
educational gains in this age group, the educational attainment of US workers over age 60 will
rise significantly. Policy measures, such as raising the official retirement age and lessening
financial disincentives to work, may encourage delays in retirement.
Shifts in the ethnic composition of the workforce will continue the patterns of recent
decades. Immigrants will account for as much as half of net population growth over the next
decades. Between 1996 and 2006 white non-Hispanic entrants will make up 49 percent of new
labor force entrants, up from 43 percent during the previous decade, but well below the 1995
level of 76 percent. As a result, the share of non-Hispanic whites will fall to 73 percent in 2005.
Of the nearly 15 million worker increase in the 1996-2006 period, about 7 million will be
Hispanic or Asians. Hispanic-Americans will raise their share of new workers slightly from 29
percent to 31 percent, as will Asian-Americans whose share will grow from 14.5 percent to 15.7
percent. By 2020, white non-Hispanic workers will make up only 68 percent of the work force.
One concern about the changing ethnicity is the potential impact on the educational
structure of the work force. Hispanic workers have the lowest educational attainment of any
major ethnic group; only 55 percent of the Hispanic population over age 25 had completed high
school as of 1997, well below the 85 percent completion levels among non-Hispanics. Thus,
unless Hispanic youth and immigrants raise their educational attainment, their growing presence
in the job market will lower the educational base of the labor force at the very time when the
demand for skills is continuing to increase. The expanding share of Asians in the labor force will
7
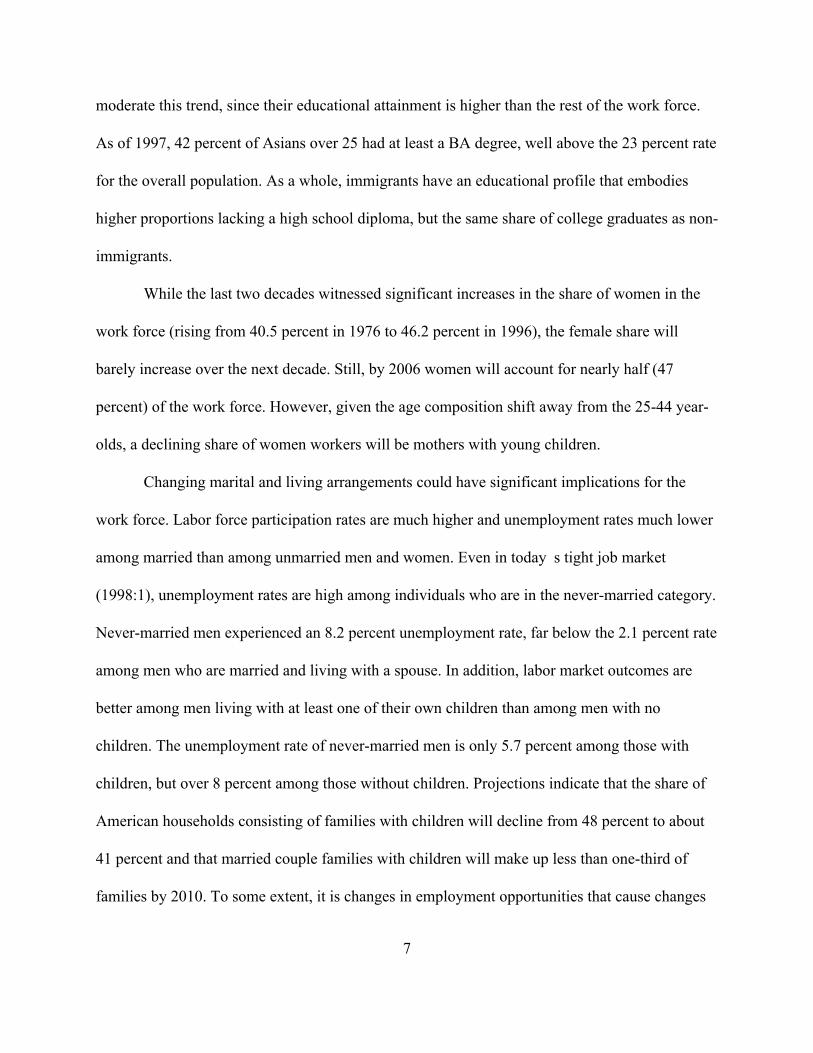
moderate this trend, since their educational attainment is higher than the rest of the work force.
As of 1997, 42 percent of Asians over 25 had at least a BA degree, well above the 23 percent rate
for the overall population. As a whole, immigrants have an educational profile that embodies
higher proportions lacking a high school diploma, but the same share of college graduates as non-
immigrants.
While the last two decades witnessed significant increases in the share of women in the
work force (rising from 40.5 percent in 1976 to 46.2 percent in 1996), the female share will
barely increase over the next decade. Still, by 2006 women will account for nearly half (47
percent) of the work force. However, given the age composition shift away from the 25-44 year-
olds, a declining share of women workers will be mothers with young children.
Changing marital and living arrangements could have significant implications for the
work force. Labor force participation rates are much higher and unemployment rates much lower
among married than among unmarried men and women. Even in today�s tight job market
(1998:1), unemployment rates are high among individuals who are in the never-married category.
Never-married men experienced an 8.2 percent unemployment rate, far below the 2.1 percent rate
among men who are married and living with a spouse. In addition, labor market outcomes are
better among men living with at least one of their own children than among men with no
children. The unemployment rate of never-married men is only 5.7 percent among those with
children, but over 8 percent among those without children. Projections indicate that the share of
American households consisting of families with children will decline from 48 percent to about
41 percent and that married couple families with children will make up less than one-third of
families by 2010. To some extent, it is changes in employment opportunities that cause changes
8
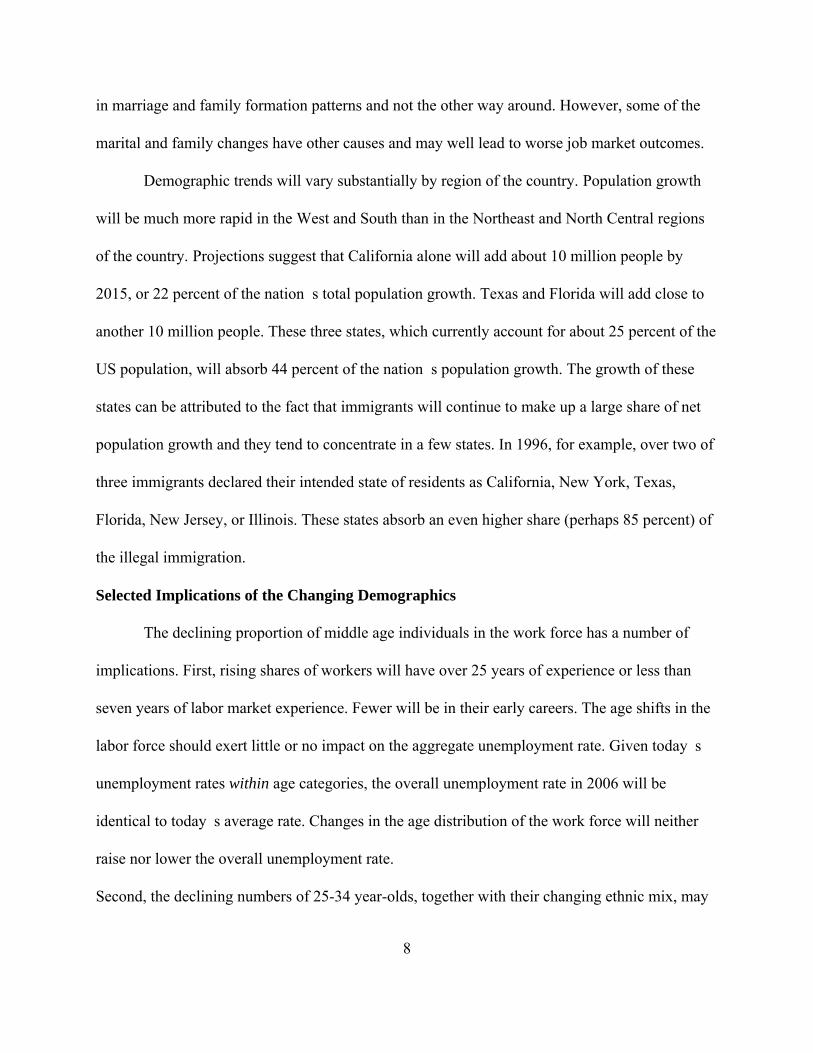
in marriage and family formation patterns and not the other way around. However, some of the
marital and family changes have other causes and may well lead to worse job market outcomes.
Demographic trends will vary substantially by region of the country. Population growth
will be much more rapid in the West and South than in the Northeast and North Central regions
of the country. Projections suggest that California alone will add about 10 million people by
2015, or 22 percent of the nation�s total population growth. Texas and Florida will add close to
another 10 million people. These three states, which currently account for about 25 percent of the
US population, will absorb 44 percent of the nation�s population growth. The growth of these
states can be attributed to the fact that immigrants will continue to make up a large share of net
population growth and they tend to concentrate in a few states. In 1996, for example, over two of
three immigrants declared their intended state of residents as California, New York, Texas,
Florida, New Jersey, or Illinois. These states absorb an even higher share (perhaps 85 percent) of
the illegal immigration.
Selected Implications of the Changing Demographics
The declining proportion of middle age individuals in the work force has a number of
implications. First, rising shares of workers will have over 25 years of experience or less than
seven years of labor market experience. Fewer will be in their early careers. The age shifts in the
labor force should exert little or no impact on the aggregate unemployment rate. Given today�s
unemployment rates within age categories, the overall unemployment rate in 2006 will be
identical to today�s average rate. Changes in the age distribution of the work force will neither
raise nor lower the overall unemployment rate.
Second, the declining numbers of 25-34 year-olds, together with their changing ethnic mix, may
9
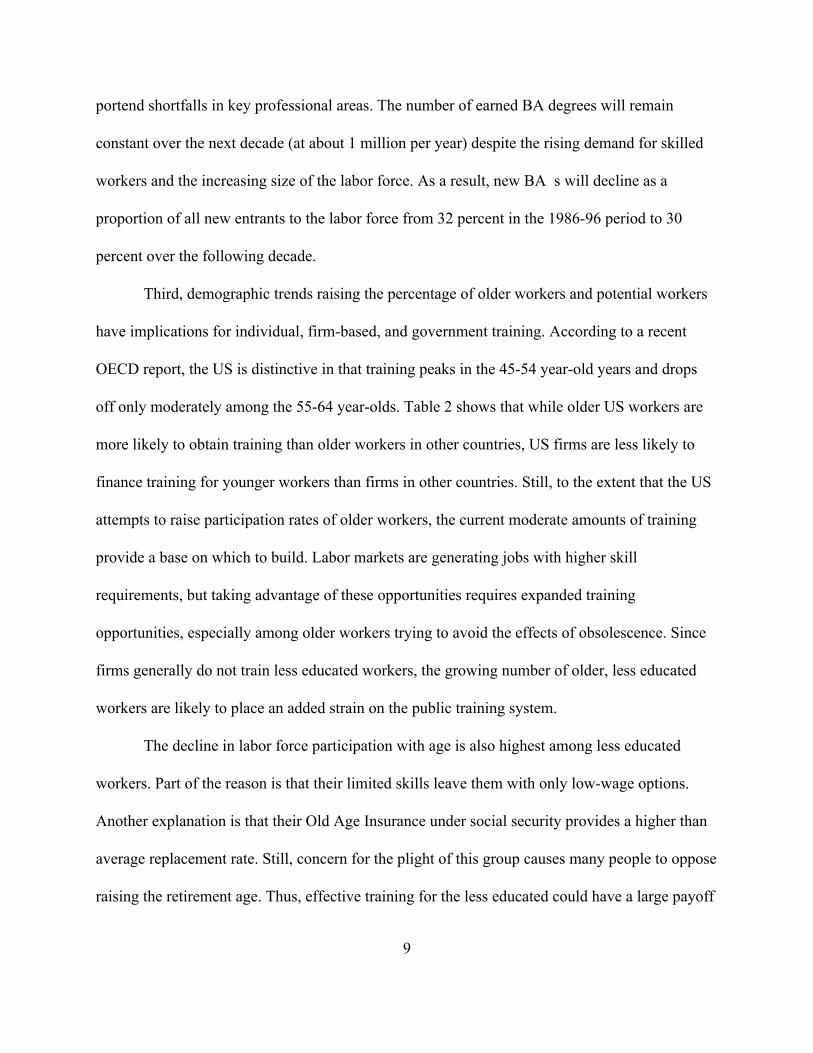
portend shortfalls in key professional areas. The number of earned BA degrees will remain
constant over the next decade (at about 1 million per year) despite the rising demand for skilled
workers and the increasing size of the labor force. As a result, new BA�s will decline as a
proportion of all new entrants to the labor force from 32 percent in the 1986-96 period to 30
percent over the following decade.
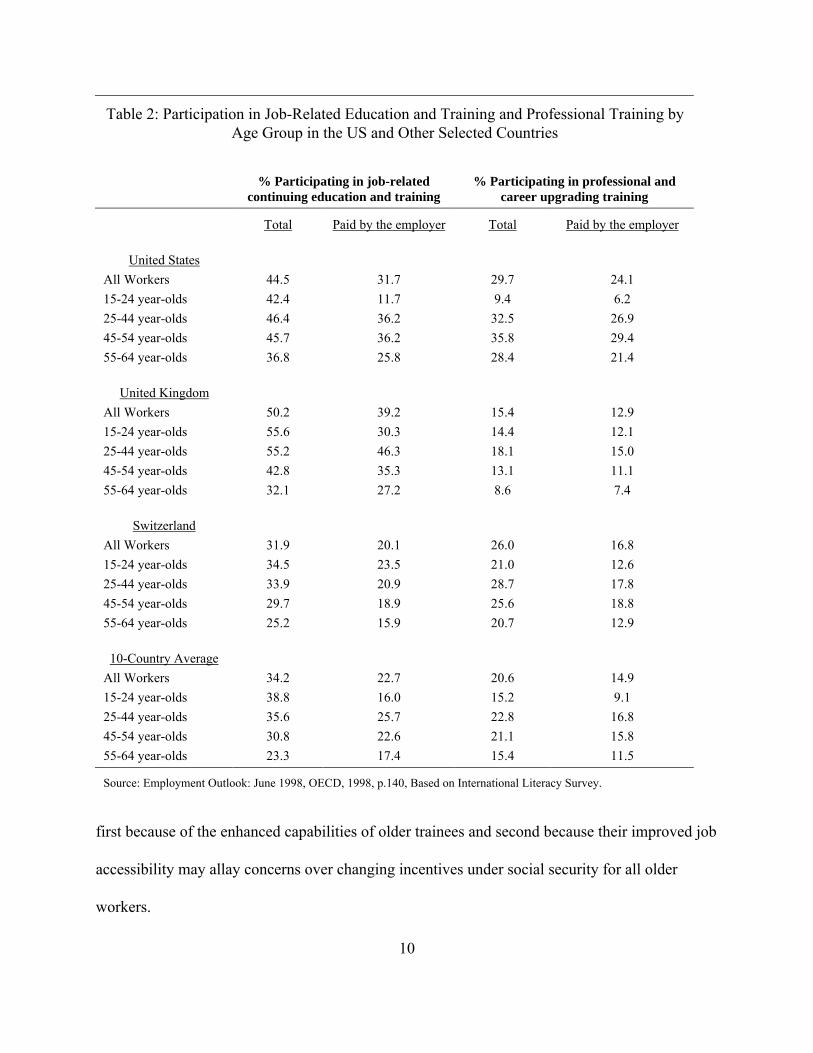
Third, demographic trends raising the percentage of older workers and potential workers
have implications for individual, firm-based, and government training. According to a recent
OECD report, the US is distinctive in that training peaks in the 45-54 year-old years and drops
off only moderately among the 55-64 year-olds. Table 2 shows that while older US workers are
more likely to obtain training than older workers in other countries, US firms are less likely to
finance training for younger workers than firms in other countries. Still, to the extent that the US
attempts to raise participation rates of older workers, the current moderate amounts of training
provide a base on which to build. Labor markets are generating jobs with higher skill
requirements, but taking advantage of these opportunities requires expanded training
opportunities, especially among older workers trying to avoid the effects of obsolescence. Since
firms generally do not train less educated workers, the growing number of older, less educated
workers are likely to place an added strain on the public training system.
The decline in labor force participation with age is also highest among less educated
workers. Part of the reason is that their limited skills leave them with only low-wage options.
Another explanation is that their Old Age Insurance under social security provides a higher than
average replacement rate. Still, concern for the plight of this group causes many people to oppose
raising the retirement age. Thus, effective training for the less educated could have a large payoff
10
Table 2: Participation in Job-Related Education and Training and Professional Training byAge Group in the US and Other Selected Countries
% Participating in job-relatedcontinuing education and training
% Participating in professional andcareer upgrading training
Total Paid by the employer Total Paid by the employer
United States
All Workers 44.5 31.7 29.7 24.1
15-24 year-olds 42.4 11.7 9.4 6.2
25-44 year-olds 46.4 36.2 32.5 26.9
45-54 year-olds 45.7 36.2 35.8 29.4
55-64 year-olds 36.8 25.8 28.4 21.4
United Kingdom
All Workers 50.2 39.2 15.4 12.9
15-24 year-olds 55.6 30.3 14.4 12.1
25-44 year-olds 55.2 46.3 18.1 15.0
45-54 year-olds 42.8 35.3 13.1 11.1
55-64 year-olds 32.1 27.2 8.6 7.4
Switzerland
All Workers 31.9 20.1 26.0 16.8
15-24 year-olds 34.5 23.5 21.0 12.6
25-44 year-olds 33.9 20.9 28.7 17.8
45-54 year-olds 29.7 18.9 25.6 18.8
55-64 year-olds 25.2 15.9 20.7 12.9
10-Country Average
All Workers 34.2 22.7 20.6 14.9
15-24 year-olds 38.8 16.0 15.2 9.1
25-44 year-olds 35.6 25.7 22.8 16.8
45-54 year-olds 30.8 22.6 21.1 15.8
55-64 year-olds 23.3 17.4 15.4 11.5
Source: Employment Outlook: June 1998, OECD, 1998, p.140, Based on International Literacy Survey.
first because of the enhanced capabilities of older trainees and second because their improved job
accessibility may allay concerns over changing incentives under social security for all older
workers.
11
Public training programs such as JTPA are likely to face rising shares of older workers
among eligibles seeking services. The majority of older workers calling on JTPA services have
utilized the displaced worker program and not the standard training programs. However, the
share of young people is growing as well, especially among groups traditionally eligible for
programs for the disadvantaged. Thus, JTPA will simultaneously see increases in the job
displacement problems of older workers and in the initial training requirements for young
workers.
From the standpoint of employers, there are advantages and disadvantages in hiring older
workers. Their health care costs are disproportionately high and, since many will have more
seniority than younger workers, they may receive higher pay and qualify for longer vacations. On
the other hand, older workers are less likely to move and less likely to have an accident at work
(though it takes longer for them to recover).
Third, a declining share of workers will have very young children. Women in the 25-44
age category will make up 21.1 percent of the work force of 2006, down from 24.2 percent in
1996. These figures incorporate an expected rise in the labor force participation rates of 25-44
year-old women from 76 percent to 79 percent. On the other hand, more women and men will
have to care for elderly parents.
Fourth, the work force will increasingly become more heterogeneous by educational
status and by gender. The proportions with BA degrees are especially variable by ethnic status
among younger workers. As of March, 1997, a striking 51 percent of Asian 25-29 year-olds had
earned a BA, as compared to 29 percent of whites, 14 percent of blacks, and 11 percent of
Hispanics. Except for Hispanics, rates of high school completion were similar across groups, at
12
about 85 percent. Another recent phenomenon is the emerging gender differences among black
and Hispanic workers. Among 25-29 year-olds in the labor force, 20 percent of black women but
only 13 percent of black men had earned BA degrees; among Hispanics, 17 percent of women
but only nine percent of men had graduated college. These educational patterns are indicative of
broader trends indicating that minority worker problems are becoming more concentrated among
men.
II. Trends in Work and Family, Health Insurance, Pensions
The complications embedded in efforts to combine work and family are not a new
phenomenon. Throughout the first half of the century, it was mainly low income and/or black
women who faced the biggest struggle balancing work and family. These women often remained
in the labor force after the birth of a child because they could not afford to quit working. Women
married to middle- and upper-income men typically did not work for pay while their children
were young, but waited to reenter the labor force at least until their children were school aged
(Klerman and Leibowitz, 1994). Few children lived in single parent families.
Since the 1960s, several demographic trends have changed the structure of the American
family and the way that parents balance work and family responsibilities. Women married to men
at all income levels have increased rapidly their participation in the labor force, with the most
rapid growth among college educated women married to relatively high income men. The
majority of women now return to paid work within a year of the birth of a child. The rising
divorce rate and the growing prevalence of children born to unmarried mothers means that many
children live in single parent families.
13
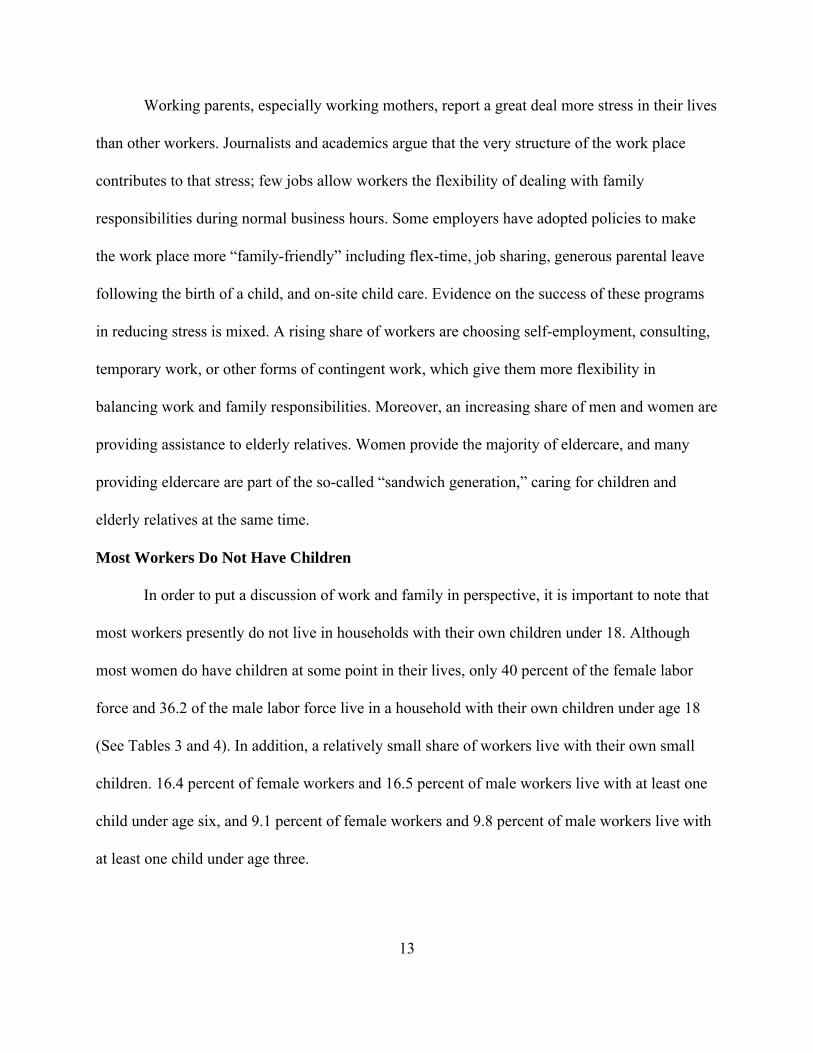
Working parents, especially working mothers, report a great deal more stress in their lives
than other workers. Journalists and academics argue that the very structure of the work place
contributes to that stress; few jobs allow workers the flexibility of dealing with family
responsibilities during normal business hours. Some employers have adopted policies to make
the work place more “family-friendly” including flex-time, job sharing, generous parental leave
following the birth of a child, and on-site child care. Evidence on the success of these programs
in reducing stress is mixed. A rising share of workers are choosing self-employment, consulting,
temporary work, or other forms of contingent work, which give them more flexibility in
balancing work and family responsibilities. Moreover, an increasing share of men and women are
providing assistance to elderly relatives. Women provide the majority of eldercare, and many
providing eldercare are part of the so-called “sandwich generation,” caring for children and
elderly relatives at the same time.
Most Workers Do Not Have Children
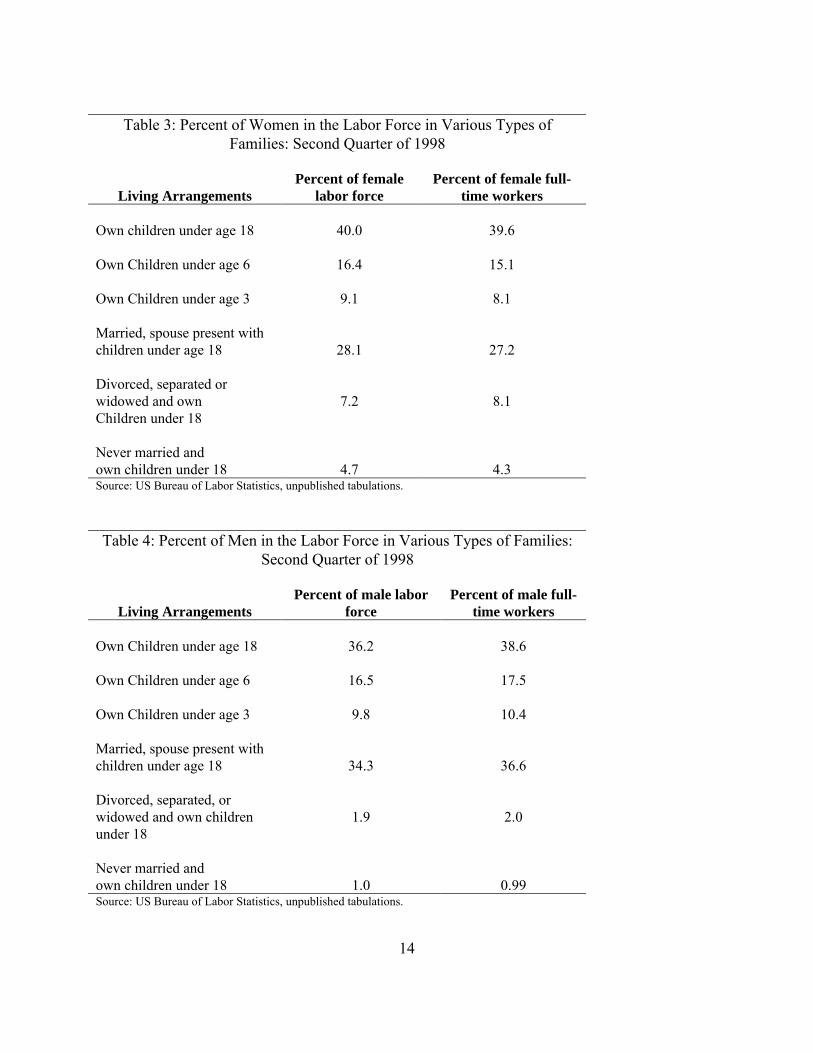
In order to put a discussion of work and family in perspective, it is important to note that
most workers presently do not live in households with their own children under 18. Although
most women do have children at some point in their lives, only 40 percent of the female labor
force and 36.2 of the male labor force live in a household with their own children under age 18
(See Tables 3 and 4). In addition, a relatively small share of workers live with their own small
children. 16.4 percent of female workers and 16.5 percent of male workers live with at least one
child under age six, and 9.1 percent of female workers and 9.8 percent of male workers live with
at least one child under age three.
14
Table 3: Percent of Women in the Labor Force in Various Types ofFamilies: Second Quarter of 1998
Living ArrangementsPercent of female
labor forcePercent of female full-
time workers
Own children under age 18 40.0 39.6
Own Children under age 6 16.4 15.1
Own Children under age 3 9.1 8.1
Married, spouse present withchildren under age 18 28.1 27.2
Divorced, separated orwidowed and ownChildren under 18
7.2 8.1
Never married andown children under 18 4.7 4.3Source: US Bureau of Labor Statistics, unpublished tabulations.
Table 4: Percent of Men in the Labor Force in Various Types of Families:Second Quarter of 1998
Living ArrangementsPercent of male labor
forcePercent of male full-
time workers
Own Children under age 18 36.2 38.6
Own Children under age 6 16.5 17.5
Own Children under age 3 9.8 10.4
Married, spouse present withchildren under age 18 34.3 36.6
Divorced, separated, orwidowed and own childrenunder 18
1.9 2.0
Never married andown children under 18 1.0 0.99Source: US Bureau of Labor Statistics, unpublished tabulations.
15
Tables 3 and 4 also show that single parents comprise a relatively small share of the labor
force; 7.2 percent of working women were ever married (divorced, widowed, or separated) and
had children under 18, and 4.7 percent of working women were never married and had children
under 18. For men, single parenthood was much less common. 1.9 percent of male workers were
ever married with children under 18, and one percent were never married with children under 18.
Growth in Married Women’s Labor Force Participation
Part of the growing concern over balancing work and families is driven by the growth of
dual-career couples with children. Women married to high wage, college educated men have
witnessed the largest increase in labor force participation since the late 1960s. The labor force
participation rate of the wives of men in the highest wage quintile increased 16.6 percent
between 1969 and 1989. The wives of men in the middle wage quintile increased their labor
force participation rates by 11.7 percent, and wives of men in the bottom wage quintile increased
their labor force participation rate by 6.9 percent.
Women’s labor force participation has grown in part because women are taking less time
out of the labor force after the birth of a child. Since the 1970s, mothers of infants have rapidly
increased their labor force participation. By 1995, 55 percent of women who had had a child in
the last year were in the labor force, almost double the 1976 participation rate of 31 percent (US
Census Bureau, 1998). Today, mothers face the tradeoff between work and family even when
their children are infants. In the 1970s and 1980s, most women did not return to the labor market
until their children were in preschool; in the 1950s and 1960s, most mothers waited until their
children reached elementary school to return to the labor force (Klerman and Leibowitz, 1994).
16
In addition, the hours of work for employed women with children under the age of six have
grown; the average employed white woman with at least one child under the age of six worked
1,487 hours in 1970 and 1,638 hours in 1988. College-educated women accounted for nearly all
of the increase in the annual hours of work for mothers of young children conditional on
employment (Coleman and Pencavel, 1994).
Working mothers with infants face difficulties that working mothers of older children do
not. First, breast feeding has become more prevalent, but few workplaces provide facilities for
breast pumping and storage of breast milk. Second, infant care is expensive and difficult to find.
Third, the sleep deprivation that comes with having a baby can make work more difficult.
Growth in Single Parent Families and Single Mothers’ Labor Force Participation
Single parents face special challenges in balancing work and family. Between 1970 and
1997, single female headed families increased from 17 percent to 27 percent of all families with
children, and single father headed families increased from one to five percent of families (US
Census Bureau, 1998).
This section will address issues related to single mothers, since they are the vast majority
of single-parent families. Women can become single mothers because of separation, divorce, or
because they were unmarried when they gave birth to a child. The divorce rate more than doubled
between 1966 and 1977 (from 10 to 21 divorces per 1,000 married women per year) and has
remained relatively stable since. Over 40 percent of all existing marriages are expected to end in
divorce (National Center for Health Statistics, 1998). Non-marital births as a percent of all births
have grown quite rapidly in since the 1960s, rising from 5.3 percent in 1960 to 30.1 percent in
17
1992. The groups that experienced the largest increases in non-marital birth rates were 15 to 24
year-old women and black women.
Since 1992, the labor force participation rate of never-married mothers has grown
enormously. Historically, never-married mothers participated in the labor force at low levels and
often relied on AFDC. But since 1996, approximately 1 million never-married mothers have left
the welfare rolls and entered the labor market. The labor force participation rate of never-married
mothers rose from 53 percent in 1992 to 60 percent in 1996 and reached 70 percent in the second
quarter of 1998. These increases in labor force participation were due to the combination of
federal welfare reform legislation, which established time limits for the receipt of benefits for the
vast majority of recipients, and a booming labor market (Bishop, 1998).
Historically, divorced and separated mothers have participated in the labor market at
much higher rates than mothers with a spouse present and never married mothers. Recently, the
gap has narrowed. As of the second quarter of 1998, 77 percent of divorced and separated
mothers were in the labor force, compared with 70 percent of mothers with spouse present and 70
percent of never-married mothers.
Unmarried mothers living in poverty often face particular difficulties managing their
work and family responsibilities. Because of the lack of affordable child care, these women often
must place their children in poor quality care. States do provide some subsidized child care for
former TANF recipients and other poor or near-poor women, but the programs in several large
states have long waiting lists and cannot provide subsidies to all who apply (Urban Institute,
1998). In addition, women who rely on public transportation often face long and logistically
difficult trips getting from home to child care and work.
18
Are Americans working longer hours than they did in the past?
One debate about work and family issues concerns whether work hours have grown in
recent decades. Juliet Schor, in her 1991 best-selling book, The Overworked American, declared
that workers were working longer hours than they had in the past, and that long work hours were
robbing workers of satisfying lives. In 1997, Robinson and Godbey argued that Americans were
actually working less than they did in the 1960s. Because individuals were also doing less
housework and childcare, Robinson and Godbey found a net increase in leisure.
The increase in leisure that Robinson and Godbey describe is due to the rise in early
retirement for workers in their 50s, and the delay of childbearing and marriage for workers in
their 20s and 30s. The vast majority of married couples with children are spending more total
time in paid work than they did in 1979 or 1989. Husbands worked an average of 2096 hours in
1979 and 2159 hours in 1994. Wives worked an average of 581 hours in 1979 and 1168 hours in
1994 (Economic Policy Institute, 1998).
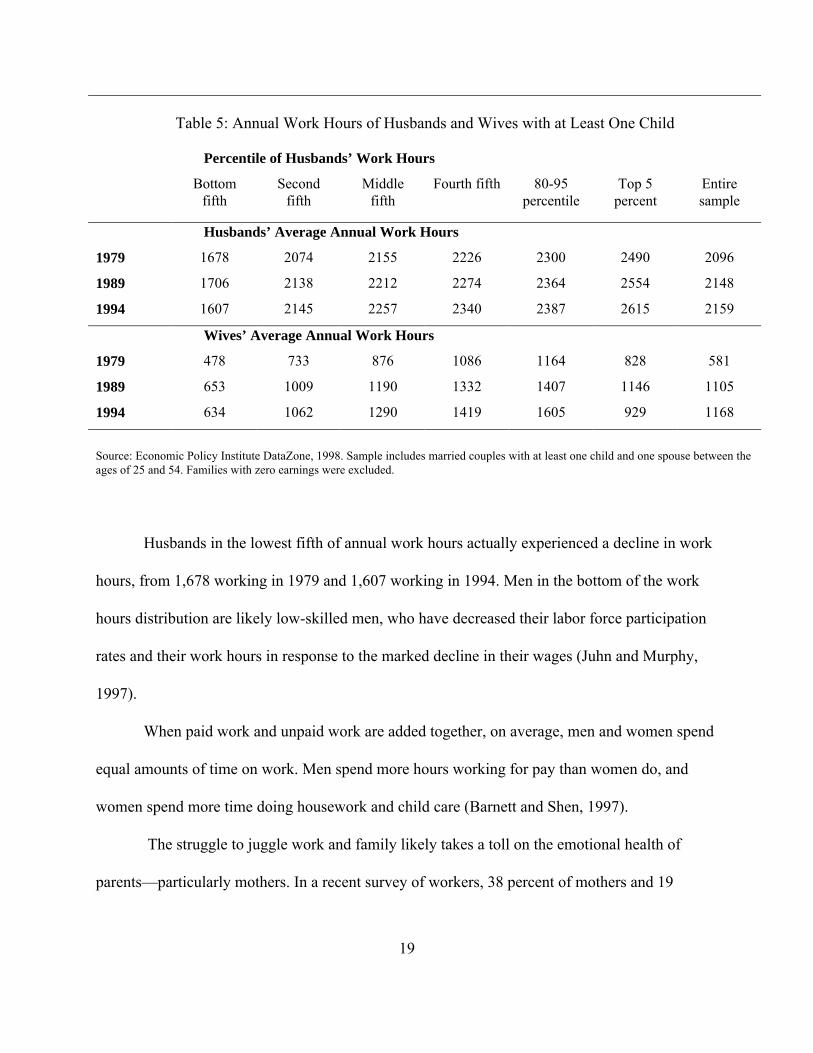
Table 5 shows the work hours of married men and women according to the percentile of
work hours of the husband. With the exception of husbands in the lowest and third fifth of work
hours, husbands worked more annual hours in 1994 than they did in 1979. Men in the top five
percent of work hours witnessed the largest increase in work hours, from 2490 in 1979 to 2615 in
1994. With the exception of the wives of men in the top five percent of work hours, wives
worked substantially more hours in 1994 than they did in 1979. The husbands in the top of the
work hours distribution are typically college-educated men married to college-educated women
(Coleman and Pencavel, 1994). Therefore, it is college-educated dual career couples who are
facing the biggest decline in nonwork hours
19
Table 5: Annual Work Hours of Husbands and Wives with at Least One Child
Percentile of Husbands’ Work Hours
Bottomfifth
Secondfifth
Middlefifth
Fourth fifth 80-95percentile
Top 5percent
Entiresample
Husbands’ Average Annual Work Hours
1979 1678 2074 2155 2226 2300 2490 2096
1989 1706 2138 2212 2274 2364 2554 2148
1994 1607 2145 2257 2340 2387 2615 2159
Wives’ Average Annual Work Hours
1979 478 733 876 1086 1164 828 581
1989 653 1009 1190 1332 1407 1146 1105
1994 634 1062 1290 1419 1605 929 1168
Source: Economic Policy Institute DataZone, 1998. Sample includes married couples with at least one child and one spouse between theages of 25 and 54. Families with zero earnings were excluded.
Husbands in the lowest fifth of annual work hours actually experienced a decline in work
hours, from 1,678 working in 1979 and 1,607 working in 1994. Men in the bottom of the work
hours distribution are likely low-skilled men, who have decreased their labor force participation
rates and their work hours in response to the marked decline in their wages (Juhn and Murphy,
1997).
When paid work and unpaid work are added together, on average, men and women spend
equal amounts of time on work. Men spend more hours working for pay than women do, and
women spend more time doing housework and child care (Barnett and Shen, 1997).
The struggle to juggle work and family likely takes a toll on the emotional health of
parents—particularly mothers. In a recent survey of workers, 38 percent of mothers and 19

20
percent of fathers said they felt nervous and stressed out often or very often. Similarly, 48 percent
of mothers and 35 percent of fathers responded that they were often or very often tired when
getting up in the morning. Thirty percent of mothers and 23 percent of fathers registered the same
responses when asked if they felt emotionally drained from their work (Galinsky et al, 1998).
Shortage of Quality Child Care
As women’s labor force participation has grown, the demand for child care has also
grown. A recent study found that 56 percent of mothers with children under age 5 said that
finding affordable child care was a serious problem for them (US Department of Labor,
Women’s Bureau, 1998). The shortage of quality is particularly acute for infants, many of whom
are placed in care that is physically dangerous to them. Many parents are forced to miss work
when a child becomes sick because they lack backup care.
There is also a severe shortage of child care available on the evenings and weekends.
Nearly one-fifth of workers worked nonstandard hours in 1991, and women comprised one-third
of those working nonstandard shifts. Service sector jobs requiring these nonstandard work hours
are among the fastest growing (US Department of Labor Women’s Bureau, 1998).
Recent research has shown that poor quality child care could ultimately take a toll on
children. Research on the brain development of children shows that the first three years of life are
key in developing a child’s full intellectual and emotional potential. Poor quality care reduces a
child’s future cognitive abilities and emotional health (Galinsky et al, 1998).
Eldercare
The projected growth in the share of the population older than age 65 means that a
growing share of adults will spend time caring for their relatives. Americans are now living
21
longer lives than ever before, but many of their later years are spent in poor health, with the need
of assistance from family, friends, or health care workers. Many working adults must also care
for elderly relatives. In 1997, one-quarter of workers had provided special assistance to someone
65 years or older within the last year, while 13 percent had done so in the last month. One-fifth of
workers had cared for both elderly relatives and children within the last year. Those who do care
for elderly relatives spend an average of 11 hours per week doing so. Women do more eldercare
than men, and studies show that women often reduce their work hours in response to taking on
the responsibility of eldercare.
Can Firms Help Their Employees Balance Work and Family Responsibilities?
Many firms offer policies that aim to help workers balance work and family
responsibilities. In a 1992 survey, 90 percent of workers said they had access to family sick
leave, 57 percent have access to job sharing, 47 percent can take extended lunch breaks, 44
percent have the ability to work more hours one day and fewer the next day, 29 percent can
choose flextime, and 24 percent have the ability to work at home on a regular basis (Galinsky et
al., 1996). While few small firms offer assistance with child care and eldercare, many Fortune
1000 firms do; 55 percent of Fortune 1000 firms offer child care resources and referral, 21
percent offer eldercare resource and referral, and 13 percent offer on-site child care.
Some family friendly policies, such as flexible time, parental leave, and dependent care
assistance, have little impact on parental stress (Galinsky et al, 1998). The take-up rates of
policies that reduce work hours, such as work sharing and flextime tend to be quite low because
workers fear that reducing their work hours will hurt their careers. Anecdotal evidence indicates
that workers who opt for flexible or reduced work hours often are promoted at much lower rates
22
than their colleagues (National Public Radio, 1998). The programs that have the highest take-up
rates are those which enable employees to increase their work hours: on-site child care, child and
elder care referral services, and emergency backup child care services (Stone, 1997).
The job attributes that were most correlated with low parental stress were not policies
explicitly targeted towards families, but attributes that improve overall job satisfaction.
Employed parents experienced the least conflict between their work and family responsibilities
when they were in jobs that had greater autonomy, that were less demanding and hectic, and that
offered greater job security (Galinsky et al, 1998).
Anecdotal evidence indicates that some employers are finding that workers that lead
balanced lives are more productive. Those firms are aiming to improve employee satisfaction by
increasing communication between workers and bosses, improving scheduling flexibility, and
recognizing workers’ needs to balance work and family (Wall Street Journal, July 1998). Such
policies are not aimed at a small subset of workers who choose flextime, but are transforming
their entire work culture. Xerox reported a 10 percent productivity increase when implementing
flexible scheduling and Johnson & Johnson reported a 50 percent decline in absenteeism among
employees who used flexible work options and family leave policies (Price Waterhouse, 1998).
Several large consulting and accounting firms are using more flexible work scheduling as
a method of recruiting and retaining workers in a tight labor market (National Public Radio,
1998; Price Waterhouse, 1998). At the same time, consulting and accounting firms are trying to
change their workaholic culture to make flexible scheduling more feasible.
Two policies, flextime and the four-day compressed work week, appear to be effective in
increasing the amount of time parents spend with children. Some researchers have also argued
23
that increasing the amount of paid paternal leave would increase fathers’ involvement with their
children. The liberality of companies’ paternity leave policies is a predictor of the length of
parental leave. Fathers’ involvement with older children is positively correlated with the amount
of time they spent with their children as infants. Researchers argue that if fathers spend more
time with their newly born children, they are more likely to bond with their children, and spend
more time with children as they grow older. Many companies do not offer paid paternity leave,
although the 1996 Federal Medical and Family Leave Act does require all firms with more than
50 employees to offer two weeks of unpaid maternity or paternity leave. The vast majority (75 to
91 percent) of fathers take time off following the birth of child, but the average length of leave
averages only five days.
Because relatively few jobs provide the autonomy and flexibility that allow workers to
balance work and family effectively, some workers, especially women, have likely turned to
contingent employment and self-employment. Contingent workers include workers who are
employed by temporary agencies and other workers whose implicit or explicit contracts with
their employers define their jobs as temporary. Women who are self-employed or contingent
workers typically do not work full-time full-year, but vary their schedule over the year and over
the week to meet family demands. The majority of women who are self-employed, on-call, or
independent contractors enter into these situations voluntarily, and many state that they work in
such arrangements for family reasons (Economic Policy Institute, 1997). The female self-
employment rate has grown from 4.1 percent in 1990 to 6.7 percent in 1994 (Devine, 1994).
Nearly three percent of the female work force is in temporary, on-call, or contract company jobs
(Economic Policy Institute, 1997).
24
III. Trends in Employer-provided Health and Pension Benefits and Families
The Decline in Employer-Provided Health Insurance
Employer-provided health insurance coverage declined sharply in the last decade. In
1988, 67 percent of the population had such coverage, in 1993, 61 percent did. The rate of
coverage declined for every income group, with the sharpest decline (7 percentage points) for
individuals with incomes between 100 and 200 percent of poverty and the smallest decline
among individuals with incomes below the poverty line (Blumberg and Liska, 1996).
Most of the decline in employer-provided health insurance coverage is due to declining
coverage for dependents, with the largest decline for children. About 18 percent of workers have
no employer-provided health coverage, and an additional five percent have health insurance
coverage for themselves, but not for their families. Moreover, 30 percent of firms now require
individuals to share the cost of family health insurance coverage, and many workers opt not to
cover dependents when the price is too high. About 20 percent of firms also require individuals
to share in the cost of their coverage, but employee costs for their own coverage are typically
modest compared to the cost of family coverage (General Accounting Office, 1997).
For poor women and children, Medicaid has made up for some of the decline in private
health insurance coverage. Since the late 1980s, the Medicaid program has been expanded to
cover poor pregnant women and children who are not recipients of AFDC. As a result, between
1988 and 1993, Medicaid coverage expanded from 8.5 percent to 12.4 percent of the nonelderly
population. Because of the Medicaid expansions, poor children are much more likely to be
insured than poor adults (Blumberg and Liska, 1996). Some analysts have argued that the

25
expansion of Medicaid eligibility actually contributed to the decline in employer-provided health
coverage (Cutler and Gruber, 1996). But Medicaid only fills the private insurance gap for about
50 percent of individuals below the poverty line.
How will the decline in employer-provided health insurance affect the health status of the
population? Individuals who are uninsured have much less access to health care than those who
do not, even adjusting for income and health status. Uninsured individuals are likely to delay or
forgo medical care, even in the case of serious medical problems. They tend not to receive
preventative care, so health problems are often much worse when they finally visit the doctor. In
addition, when persons without health insurance coverage do receive care, doctors tend to
perform fewer procedures. The uninsured receive better care in communities with public
hospitals and clinics as these institutions provide free medical care.
Does the lack of access to health care result in a decline in the health of uninsured
individuals? A lack of health insurance coverage is correlated with a poor health status and a
decline in life expectancy. However, it is difficult to identify a causal relationship because health
insurance coverage is endogenous; persons in poor health are less likely than healthy workers to
find good jobs that provide health insurance coverage.
For many workers, the absence of health insurance coverage is only temporary. The
median spell without health insurance is seven months, and 48 percent of spells of non-insurance
end within five months. A significant minority, 19 percent, last beyond two years (Blumberg and
Liska, 1996). An interesting unanswered research question is whether short lapses in health
insurance coverage affect access to health care as much as long spells.
26
The Change in the Pension System
Over the last twenty years, the fraction of workers covered by defined contribution (DC)
pension plans has increased rapidly, while the fraction covered by defined benefit (DB) plans has
declined. In 1975, 13 percent of workers with pensions had DC plans as their primary pension,
compared to 33 percent in 1988 and 42 percent in 1993 (Samwick and Skinner, 1998).
Some analysts are concerned that the switch from DB to DC plans will reduce workers’
retirement savings. Under DC plans, workers bear much of the responsibility for accumulating
adequate assets for retirement for three reasons. First, contributions to DC plans are often
voluntary. In a sample of workers from several large firms, only about 70 percent chose to
participate in voluntary DC plans. On average, workers contribute about six percent of their
salaries (Employee Benefits Research Institute, 1995).
Second, workers can control the allocation of assets in their DC portfolio. Many workers
choose far too conservative investments, which dramatically reduce their value of their assets at
retirement. About one-sixth of workers invest none of their portfolio in equities (Samwick and
Skinner, 1998) and many of these very conservative investors are relatively young. In one
dimension, workers’ investment strategies are sensible: the percent of assets in equities declines
as workers get closer to retirement (Employee Benefits Research Institute, 1995).
Third, workers can choose to consume, rather that reinvest, the DC lump sum
distributions they receive when they leave a job. Only half of those who receive lump sum
distributions reinvest all or part of it into an IRA or their new employers’ retirement plan
(Employee Benefits Research Institute, 1997).
27
The lump sum distributions of DC plans have the advantage of making the pensions
portable. If workers choose to reinvest their lump sum distribution, they suffer no penalty in
retirement income from changing jobs. When workers change jobs, they suffer a substantial
decline in the expected value of their DB plan income.
A recent paper (Samwick and Skinner, 1998) examined the retirement income yield for
average pension recipients under representative DB and DC plans. The Samwick-Skinner model
takes account of the reality that many workers will consume the lump sum distributions from DC
plans when they change jobs and that many workers will continue to be conservative in their
portfolio choice. Still, they find, somewhat surprisingly, that the average worker will have a
higher retirement income under a DC plan than under a DB plan. However, workers at the lowest
ten percent of the retirement income distribution are projected to earn higher retirement income
under DB than under DC plans. Although many DC plans do not adequately provide for
retirement, neither did many DB plans in the past.
IV. Technology and Work Organization
Business investment in computers has grown very rapidly over the last 25 years. In 1973,
business computer purchases accounted for .005 percent of GDP, and in 1996, they accounted for
3.1 percent of GDP. Computers now comprise about one-fifth of businesses’ new capital
investment. This investment in technology has meant that one-half of American workers are
likely to use a computer in their work, compared with one-fourth in 1987 (Madrick, 1998).
On average, technology has increased the demand for workers who have good math,
communication, and teamwork skills. However, the impact of technology has not been uniform;
28
it varies by occupation, industry, and among firms within the same industry. Technology
increases the skill demands of many manufacturing jobs, but may deskill some clerical work.
Industries vary in their investment in information technology. Evidence shows that industries that
invest the most in technology have the highest demand for skilled workers, and pay a higher
wage premium to workers than other industries. Manufacturing industries that invest the most in
technology have a higher demand for non-production workers (managers, secretaries, and
janitors) relative to production workers (line workers).
The impact of technology varies considerably among firms within the same industry
because firms differ widely in their organizational responses to technology. Technology is not
simply an input into the production function. It changes the production function by affecting
work organization and the expanding the types of possible outputs. In the long run, a firm’s type
of product, its work organization, and its level of investment in technology are complementary.
Although firms choose a myriad of organizational responses to technology, it is heuristically
useful to think of two types of strategies, customization and more traditional work practices
(Piore, 1998). With customization, firms produce products in which quality and/or control of the
production product are key. They invest heavily in information technology and employ a cluster
of work organization practices that both expand workers’ decision making power and flexibility
and compensate workers for their performance. Firms that follow the customization strategy
require the most skills from their workers, and also experience the largest productivity gains from
adopting computers.
Firms that choose more traditional work organization produce products that are less
customized and they invest less in technology. Such firms do not fully transform their work
29
organization in response to technology, rather their method of work organization is closer to
mass production. Firms that follow the second strategy do not demand as many skills from their
workers as firms that follow customization, and do not experience as large a boost in productivity
from adopting new technology. They may adopt some new work place organization practices, but
do not fully transform their workplace. The choice of strategies varies widely among firms within
the same industry.
The future impact of technology on the labor force will depend on whether more firms
adopt the customization strategy in response to new technologies. Competitive pressures may
push more firms to change their workplace organizations. However, many firms will find it
difficult to transform themselves because of the resistance of workers, lower to mid-level
managers, and/or labor union leaders.
Recent Changes in Work Organization
Accompanying the growth in computer investment has been a movement away from the
Ford/Taylor model of mass production, once a major form of work organization in the US Under
the mass production model, workers performed a narrow set of tasks, and had little incentive or
need to understand how their work fit into the larger picture. Monitoring quality was the
responsibility of supervisors.
No single form of work organization has emerged as dominant, but most firms have
adopted flexible forms of production. Workers often perform a broad range of tasks thereby
gaining the ability to respond quickly to changes in the production process and assuming some
responsibility for the quality of the product (Piore, 1998).
30
Information technology was not the only factor contributing to movement away from the
mass production model. During the 1970s, several changes in the macroeconomic environment
led to increased levels of uncertainty and volatility in the demand for products. The
macroeconomic changes included the opening of the economy to trade and deregulation.
Additionally, the change from fixed to fluctuating exchange rates led to wide swings in the value
of the dollar. The 1970s also witnessed more rapid shifts in consumer demand, which led to
quicker product cycles, more products, and quicker supplier responses to changes in consumer
tastes (Piore, 1998). Consumer demand also became more fragmented; the number of new food
and household products introduced each year has increased 15 or 20 fold since 1970.
Heuristically, it is again useful to think of two types of strategies that were responses to
the changing economic environment: customization and more traditional work arrangements. The
nomenclature is based on Piore’s (1998) analysis of the case study literature on manufacturing
firms; Bresnahan, Brynjolfsson, and Hitt (1998); and quantitative analysis of data from 303
Fortune 1000 firms in both manufacturing and services.
First, firms that chose the strategy of customization responded to rapid changes in
consumer demand by producing products in which service was an important component that can
be easily customized by controlling the production process. These firms have been heavy
investors in information technology and have transformed their work organization practices.
They organize work into self-directed teams, which gives workers more decision-making
authority (particularly over pace and method of work). They also rotate workers among jobs,
improving their understanding of the production process. In addition, these firms implement
incentive systems to reward and encourage performance. Such firms also require workers to
31
perform highly skilled tasks, such as reprogramming equipment for a change in the product line,
so firms typically invest heavily in worker training and screening (Piore, 1998). According to one
estimate, nearly 40 percent of firms follow the customization model (Osterman, 1994). The
positive relationship between information technology and new work organization practices
cannot be explained by industry type alone; the relationship exists both within and between
industries (Bresnahan, Brynjolfsson, and Hitt, 1998).
Second, some firms choose to produce products in which service and producer control are
not as important. These firms tend to use fairly traditional forms of work organization. Most
firms have implemented at least one but not all of the nontraditional human resource practices
that exist in the customization strategy (Osterman, 1994). Appelbaum and Batt (1994) find that
the fraction of Fortune 100 firms with at least one employee involvement practice rose from 70
percent in 1987 to 85 percent in 1992.
Firms that follow the customization strategy experience greater productivity gains from
the adoption of information technology than other firms—even firms within their own industry
(Beede and Young, 1996; Brynjolfsson, and Hitt, 1998). The customization strategy also results
in large improvements in productivity when new organization practices deeply penetrate the firm
(Cappelli et al (1998), Ichniowski et al (1997). However, firms that implement only some of the
new work organization practices experience only marginal improvements in productivity.
Will More Firms Adapt Their Work Organization to Fully Exploit Technology?
Technology’s future impact on the demand for skills and on productivity will likely
depend on how many additional firms adopt customization as a form of work organization.
David (1990) argues that a new technology can take decades to have its full impact on
32
productivity because it takes some time for firms to adopt work organization to the technology.
Such was the case with the adoption of electricity in the early twentieth century.
Although competitive pressures may push additional firms to adopt customization, many
firms may find it difficult to reform their work organization. Piecemeal changes to work
organization are easier for firms with a tradition of mass production to implement than
customization (Piore, 1998). Management and union leaders may oppose such changes because
they threaten their power and workers may have difficulty conforming to new modes of work
organizations because old work norms have become ingrained (Cappelli et al., 1998; Bresnahan,
Brynjolfsson, and Hitt, 1998). Also, decades of animosity between management and labor may
prevent the cooperation necessary to reform work. Because they lack an institutional memory,
greenfield (newly built) plants are more likely to adopt customization than other plants
(Ichniowski et al., 1995).
Does Technology Change the Demand and Returns to Skills?
The growth in information technology and changes in work organization have likely
contributed to the rising demand and returns to higher-order cognitive skills. Anecdotal evidence
shows that new technologies and workplace practices often require workers to have good writing
and verbal skills, good math skills, and good problem solving skills. In addition, given the
increased autonomy and responsibilities in many environments, there is evidence that so-called
“soft skills,” motivation, work habits, etc., have become more important. Although there has
been an economy-wide increase in the demand for skills, some jobs may have been deskilled by
the changes in work organization and growth in information technology. In particular, some
33
clerical work has become less skilled now that office technology, such as word processing
software, can perform many of the most skilled clerical tasks.
Because of other sweeping economy wide changes that were occurring at the same time
as technological change and the change in work organization (including globalization,
deregulation, the decline of unions), it is difficult to empirically identify the magnitude of
technology’s effect on the rising skill premium.
Technology has played a role in the rising demand and return to skill. Three papers
(Bound, Berman, and Griliches, 1994; Allen, 1997; Haskel and Slaughter, 1998) find that
industries that invest the most in technology have the highest demand for skilled workers, and
pay the highest relative wages to skilled workers. When the three studies are taken together, the
result is robust across the manufacturing and service sectors, across different measures of
technology, and across different proxies for unskilled and skilled workers.
The shortcoming of the industry-level studies is that they cannot say whether the adoption
of computers per se increases the demand for skilled workers, or whether the adoption of
computers is simply a proxy for other organizational changes in the firm. Recent evidence from
worker-level data suggests that it is not the use of the computer per se that raises the relative
earnings of skilled workers; the use of a computer is simply a proxy for whether individual sits
and thinks at his or her job (DiNardo and Pischke, 1997).
Mishel and Bernstein (1997) argue that technological change cannot explain the rising
demand and returns to skill. They believe that in order for the relationship to hold true,
technological change should have accelerated between the 1980s and the 1970s, because the
wage gap between skilled and unskilled workers grew more quickly during the 1980s than during
34
the 1970s. They find no evidence of an acceleration in investment in technology in the 1980s.
The discrepancy in timing between the introduction of technology and wage inequality may be
explained by the fact that the new work organization practices that exploited technology became
more widely adopted in the 1980s. Bernard and Jensen (1994) also argue that technological
change cannot account for much of wage inequality, because they show that the within-industry
changes in the employment shares and wage shares of skilled workers were larger than the
between-industry changes. They assume that all firms within the same industry would have
similar technologies, which has been shown to be empirically false.
Many papers addressing the issue of skill biased technical change have simply assumed
the change was the residual that could not be explained other factors, such as changes in
demographics, changes in the composition of industries, or trade.
Given that whether and how firms adopt technology depends on their response to changes
in the external environment (e.g. trade, deregulation), a research program that attempts to allocate
contributions to wage inequality may nevertheless fail to achieve a consensus. For policy
purposes it is more important to first determine what skills are valued in the economy, then to go
about training workers in those particular skills.
V. Adapting to Tight Labor Markets
With the US economy reaching the lowest unemployment rates in 30 years and the
employed share of the adult population at an all time high, today’s primary concerns are labor
shortages and inflationary pressures resulting from tight labor markets. According to many
predictions, the 1995-1996 unemployment rates of 5.5 percent should have already led to
35
excessive wage growth. In a recent estimate, Akerlof, Dickens, and Perry (1996) concluded that
the rate of unemployment consistent with no increases in the inflation rate was in the 5.5-6.0
percent range. The US experience of 1997 and 1998 cast doubt on these and similar projections.
Even after reaching 4.5 percent unemployment rates, the US economy has yet to experience
inflationary wage pressures.
How have these pressures been averted? Are they about to arise shortly? How are
employers coping with the tight job markets? Is rapid wage growth taking place in the lowest
unemployment rate areas? To what extent have new workers been drawn into the job market to
mitigate shortages and wage pressures? What mechanisms other than wage increases are
employers using to recruit and retain workers? Are employers turning to low turnover strategies
with job ladders and extensive training? To what extent are employers able to lower their formal
job qualifications in response to a shortage of workers?
The National Trends
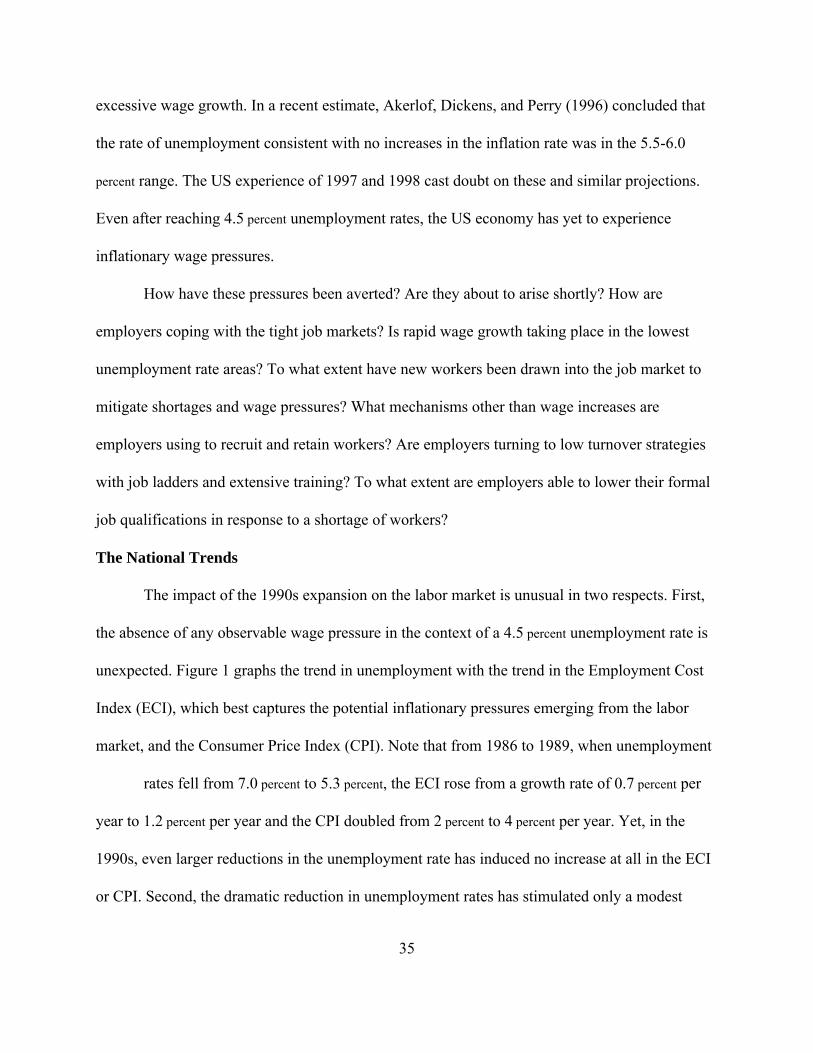
The impact of the 1990s expansion on the labor market is unusual in two respects. First,
the absence of any observable wage pressure in the context of a 4.5 percent unemployment rate is
unexpected. Figure 1 graphs the trend in unemployment with the trend in the Employment Cost
Index (ECI), which best captures the potential inflationary pressures emerging from the labor
market, and the Consumer Price Index (CPI). Note that from 1986 to 1989, when unemployment
rates fell from 7.0 percent to 5.3 percent, the ECI rose from a growth rate of 0.7 percent per
year to 1.2 percent per year and the CPI doubled from 2 percent to 4 percent per year. Yet, in the
1990s, even larger reductions in the unemployment rate has induced no increase at all in the ECI
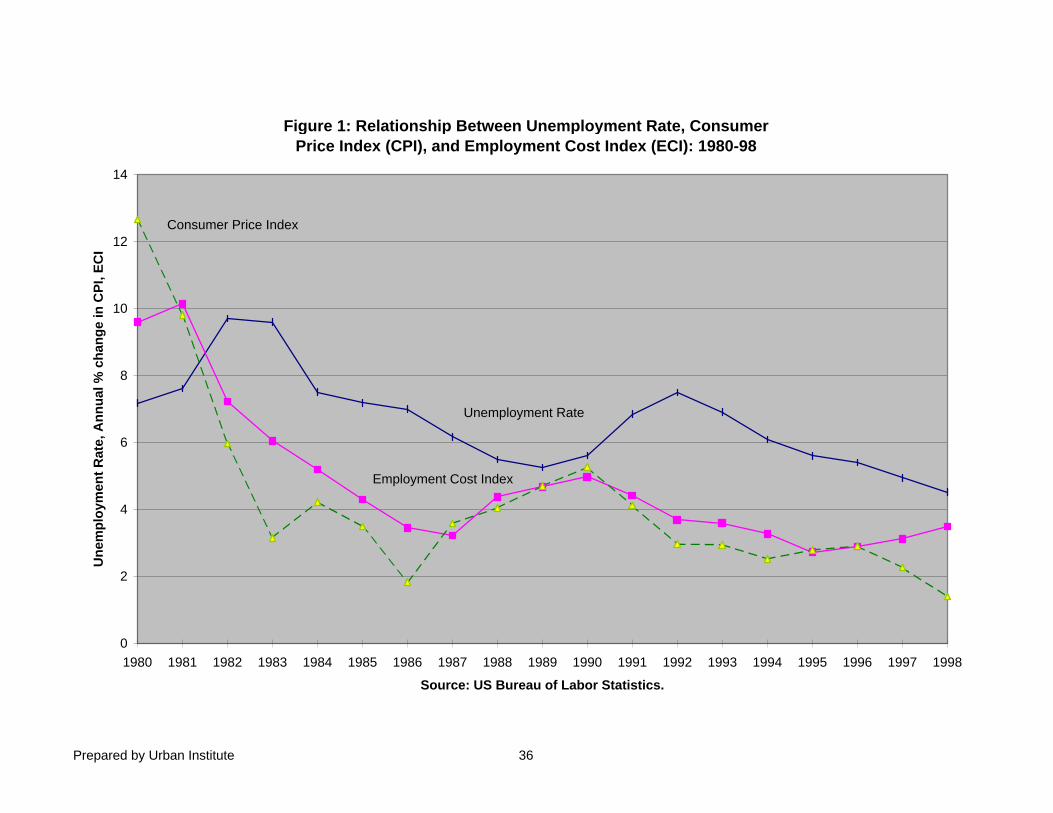
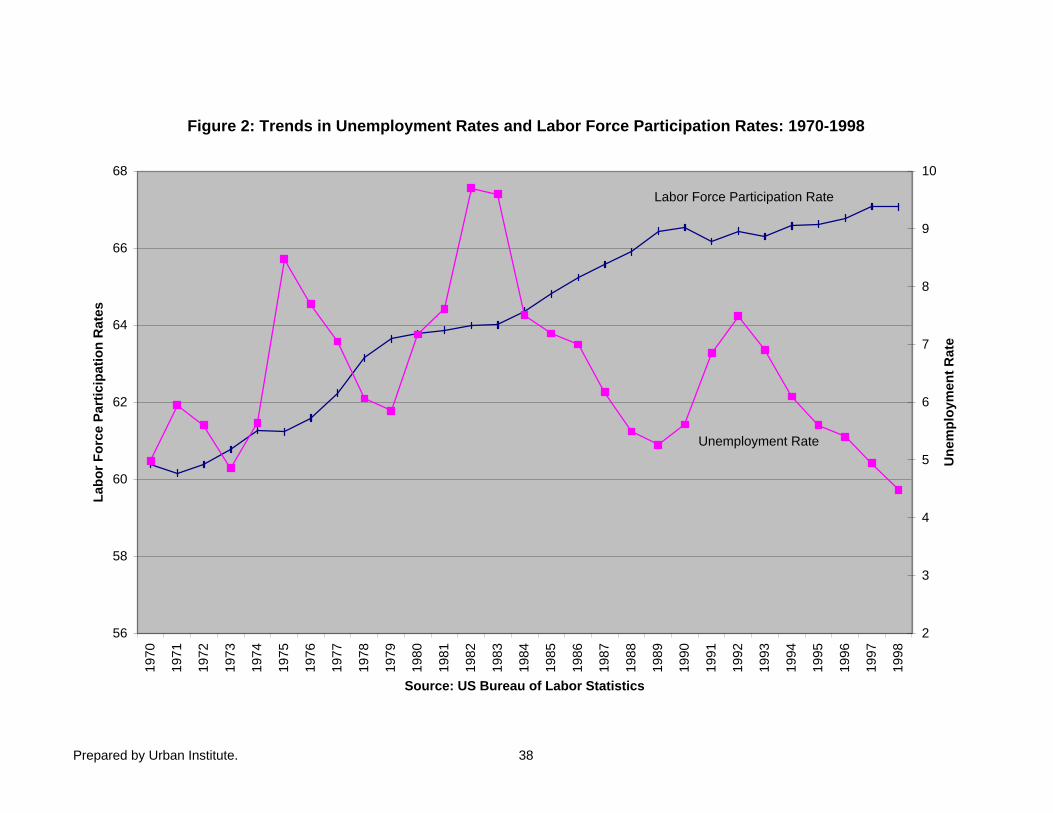
or CPI. Second, the dramatic reduction in unemployment rates has stimulated only a modest
Prepared by Urban Institute 36
Figure 1: Relationship Between Unemployment Rate, Consumer Price Index (CPI), and Employment Cost Index (ECI): 1980-98
0
2
4
6
8
10
12
14
1980 1981 1982 1983 1984 1985 1986 1987 1988 1989 1990 1991 1992 1993 1994 1995 1996 1997 1998
Source: US Bureau of Labor Statistics.
Un
emp
loym
ent
Rat
e, A
nn
ual
% c
han
ge
in C
PI,
EC
I
Unemployment Rate
Consumer Price Index
Employment Cost Index
37
impact on participation in the job market. Note in Figure 2 falling unemployment in the late
1970s and mid to late 1980s attracted many new workers into the market, raising participation
rates 1.5 to 2 percentage points. In contrast, the decline in the 1990s to 4.5 percent
unemployment rates has only led to a 0.7 point increase in participation. Thus, large increases in
labor supply cannot explain the limited impact on wages and prices.
One feature of the current expansion that follows past patterns is that the expansion has
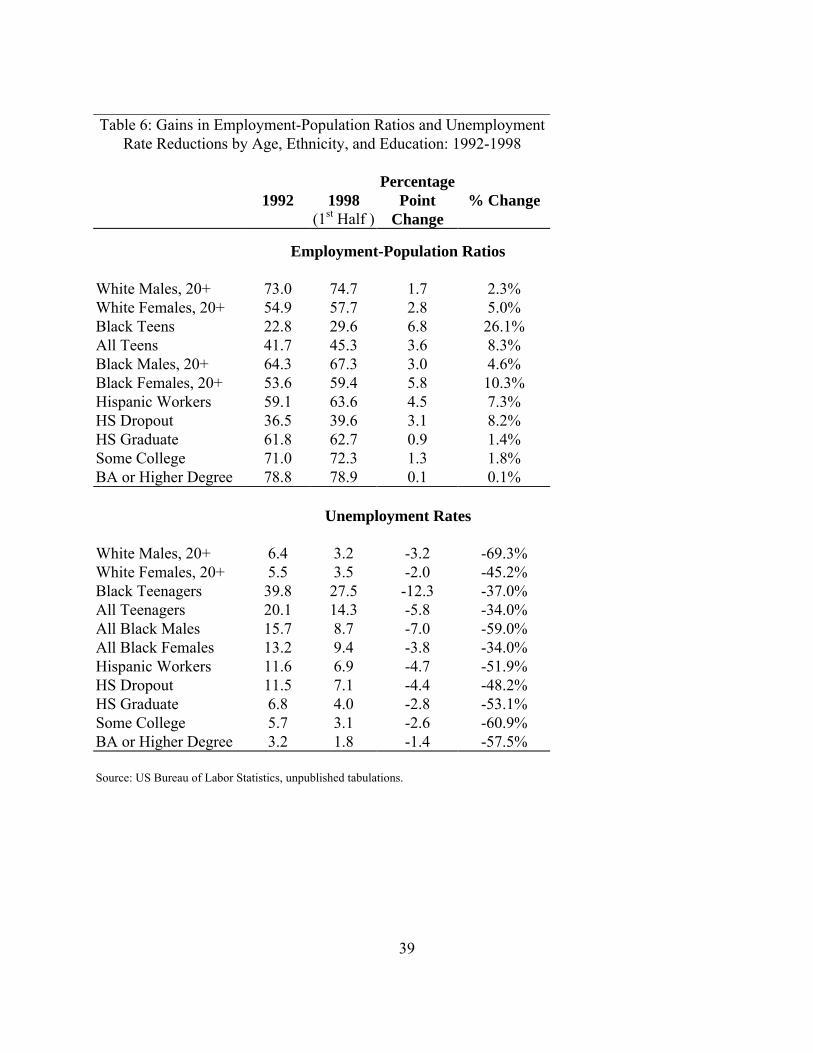
raised employment most among the more disadvantaged groups. Table 6 reveals that the
percentage point gains in employment-population ratios and declines in unemployment rates
were substantially higher among minorities, teenagers, and less educated workers than among
prime-age males. For example, the unemployment rate among black men, ages 20 and over, fell
an extraordinary seven percentage points, from almost 16 percent to about 9 percent. White men,
ages 20 and over, also experienced sizable reductions in unemployment rates, but virtually no
movement in employment. Similarly, the unemployment rate of college graduates declined from
3.2 percent in 1992 to 1.7 percent in 1998, while their employment-population ratio of college
graduates remained constant at 78 percent.
With the economy apparently running out of skilled workers since nearly all were already
employed earlier in the business cycle, employers must turn to less-qualified workers to fill the
new job. These pressures are good for the disadvantaged---firms are more willing to take a
inexperienced, less educated workers, to expand training, and to lower hiring standards. But
shortages of high-skilled workers could lead to inflationary wage increases while adding low-
skilled workers could lower productivity and raises costs.
Firms might have to alter their production approaches to the extent that the mix of skills
Prepared by Urban Institute. 38
Figure 2: Trends in Unemployment Rates and Labor Force Participation Rates: 1970-1998
56
58
60
62
64
66
68
1970
1971
1972
1973
1974
1975
1976
1977
1978
1979
1980
1981
1982
1983
1984
1985
1986
1987
1988
1989
1990
1991
1992
1993
1994
1995
1996
1997
1998
Source: US Bureau of Labor Statistics
Lab
or
Fo
rce
Par
tici
pat
ion
Rat
es
2
3
4
5
6
7
8
9
10
Un
emp
loym
ent
Rat
e
Labor Force Participation Rate
Unemployment Rate
39
Table 6: Gains in Employment-Population Ratios and UnemploymentRate Reductions by Age, Ethnicity, and Education: 1992-1998
1992 1998(1st Half )
PercentagePoint
Change% Change
Employment-Population Ratios
White Males, 20+ 73.0 74.7 1.7 2.3%White Females, 20+ 54.9 57.7 2.8 5.0%Black Teens 22.8 29.6 6.8 26.1%All Teens 41.7 45.3 3.6 8.3%Black Males, 20+ 64.3 67.3 3.0 4.6%Black Females, 20+ 53.6 59.4 5.8 10.3%Hispanic Workers 59.1 63.6 4.5 7.3%HS Dropout 36.5 39.6 3.1 8.2%HS Graduate 61.8 62.7 0.9 1.4%Some College 71.0 72.3 1.3 1.8%BA or Higher Degree 78.8 78.9 0.1 0.1%
Unemployment Rates
White Males, 20+ 6.4 3.2 -3.2 -69.3%White Females, 20+ 5.5 3.5 -2.0 -45.2%Black Teenagers 39.8 27.5 -12.3 -37.0%All Teenagers 20.1 14.3 -5.8 -34.0%All Black Males 15.7 8.7 -7.0 -59.0%All Black Females 13.2 9.4 -3.8 -34.0%Hispanic Workers 11.6 6.9 -4.7 -51.9%HS Dropout 11.5 7.1 -4.4 -48.2%HS Graduate 6.8 4.0 -2.8 -53.1%Some College 5.7 3.1 -2.6 -60.9%BA or Higher Degree 3.2 1.8 -1.4 -57.5%
Source: US Bureau of Labor Statistics, unpublished tabulations.
40
among new workers differs sharply from the mix among existing workers. Employers would
seem to face serious problems integrating large numbers of less skilled workers into their
organizations, particularly at a time when the demand for skill is increasing on a long-run basis.
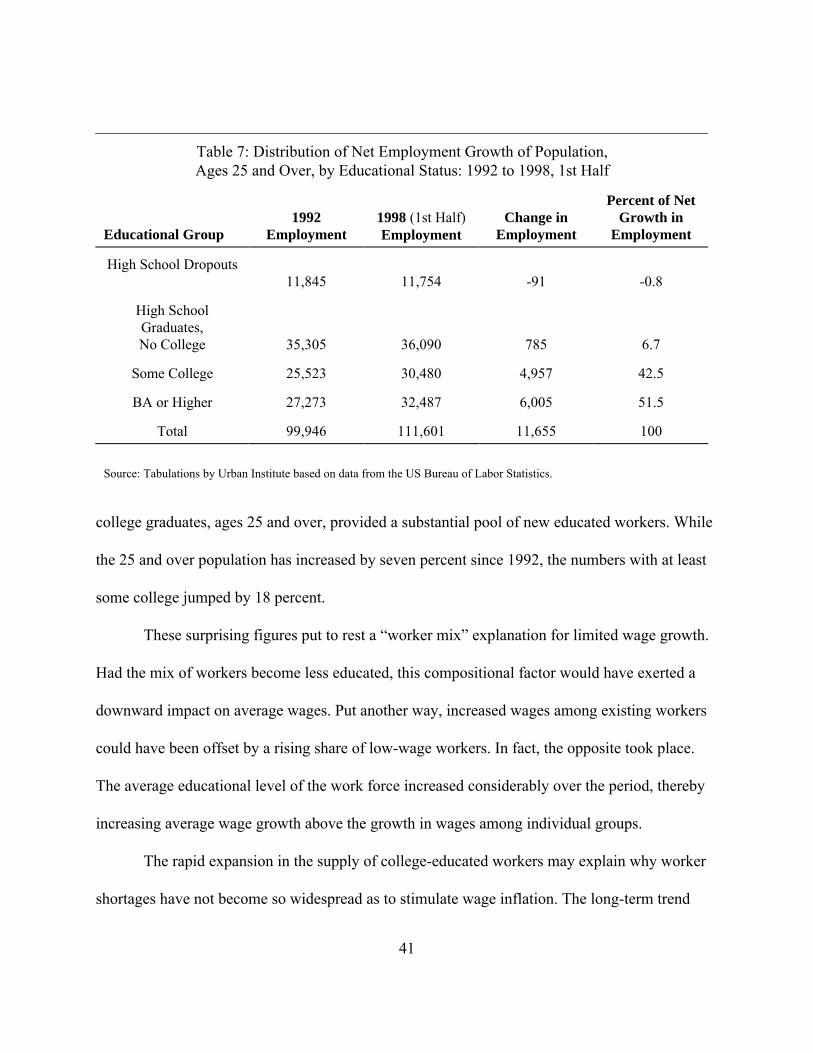
Surprisingly, a close look at the data provides an entirely different picture of recent job
market trends. As Table 7 reveals, fully 94 percent of the 11.7 million newly employed adult
workers (ages 25 and over) had at least some college or a BA degree and over half of the came
from the highest educational category. Demographics and educational distributions by age
allows us to reconcile the substantial improvement in the position of less-educated workers with
the high levels of education among the newly employed. The normal tendency at peaks in the
business cycle for employers to draw on less educated workers has been offset by the long-term
increase in the educational status of the population.
While the typical dropout had a much easier time finding a job in 1998 than in 1992,
dropouts did not account for any of the growth in employment. The reason was that the high
school dropout population declined by 2.8 million, as the number of young high school dropouts
becoming adults was smaller than the number of older dropouts dying. At the same time, while
the typical adult college graduate was no more likely to be employed in 1998, the population of
college graduates ages 25 and over increased by about 7.5 million, or 20 percent, well above the
7 percent growth in the total adult population. As a result, college graduates constituted 65
percent of the 11.5 million increase in the 25 and over population.
Thus, the striking reality is that employers have been able to draw on a growing pool of
highly educated workers, even over the 1992-98 expansion. Despite the fact that nearly all
college graduates looking for work had jobs in 1992, the 20 percent increase in the population of
41
Table 7: Distribution of Net Employment Growth of Population,Ages 25 and Over, by Educational Status: 1992 to 1998, 1st Half
Educational Group1992
Employment1998 (1st Half)Employment
Change inEmployment
Percent of NetGrowth in
Employment
High School Dropouts11,845 11,754 -91 -0.8
High SchoolGraduates,No College 35,305 36,090 785 6.7
Some College 25,523 30,480 4,957 42.5
BA or Higher 27,273 32,487 6,005 51.5
Total 99,946 111,601 11,655 100
Source: Tabulations by Urban Institute based on data from the US Bureau of Labor Statistics.
college graduates, ages 25 and over, provided a substantial pool of new educated workers. While
the 25 and over population has increased by seven percent since 1992, the numbers with at least
some college jumped by 18 percent.
These surprising figures put to rest a “worker mix” explanation for limited wage growth.
Had the mix of workers become less educated, this compositional factor would have exerted a
downward impact on average wages. Put another way, increased wages among existing workers
could have been offset by a rising share of low-wage workers. In fact, the opposite took place.
The average educational level of the work force increased considerably over the period, thereby
increasing average wage growth above the growth in wages among individual groups.
The rapid expansion in the supply of college-educated workers may explain why worker
shortages have not become so widespread as to stimulate wage inflation. The long-term trend
42
toward a rising demand for skilled and educated workers continued over the current expansion.
In recent years, the structure of occupations has shifted dramatically toward high skill positions.
Professional, managerial, and technical jobs account for nearly two-thirds of the net growth in
employment, far above the 28 percent of jobs in these occupations in 1988. Despite the shift
toward high skill occupations and the increased demand for skill within occupations, the
substantial growth in the supply of the college-educated population apparently provided enough
of an inflow to prevent the types of shortages one would expect at this stage of the business
cycle.
Area Variation in Unemployment Rates and Wage Pressures
The national picture captures the average market conditions for the nation, but does not
show the variation across labor markets in the degree of tightness and any induced pressures on
wages. In Figure 3, we can see the wide variation in unemployment rates, ranging from about
three percent in the ten states with the lowest unemployment to almost six percent for the ten
with the highest unemployment. Fully half (25) the states had unemployment rates at four percent
or below and only five states at about six percent or higher. Growth in employment is a second
indicator of labor market tightness in an area. Figure 3 displays percentage employment change
between the first quarter of 1995 and the first quarter of 1998, when employment in the nation
rose by about 5.5 percent. It is striking that high employment gains did not necessarily go with
low unemployment rates. In fact, the correlation between unemployment rates and percent
growth in employment was slightly positive at .05.
The wide variations across states might provide indications as to whether inflationary
wage pressures are finally emerging from tight labor markets. After all, fifteen states now are
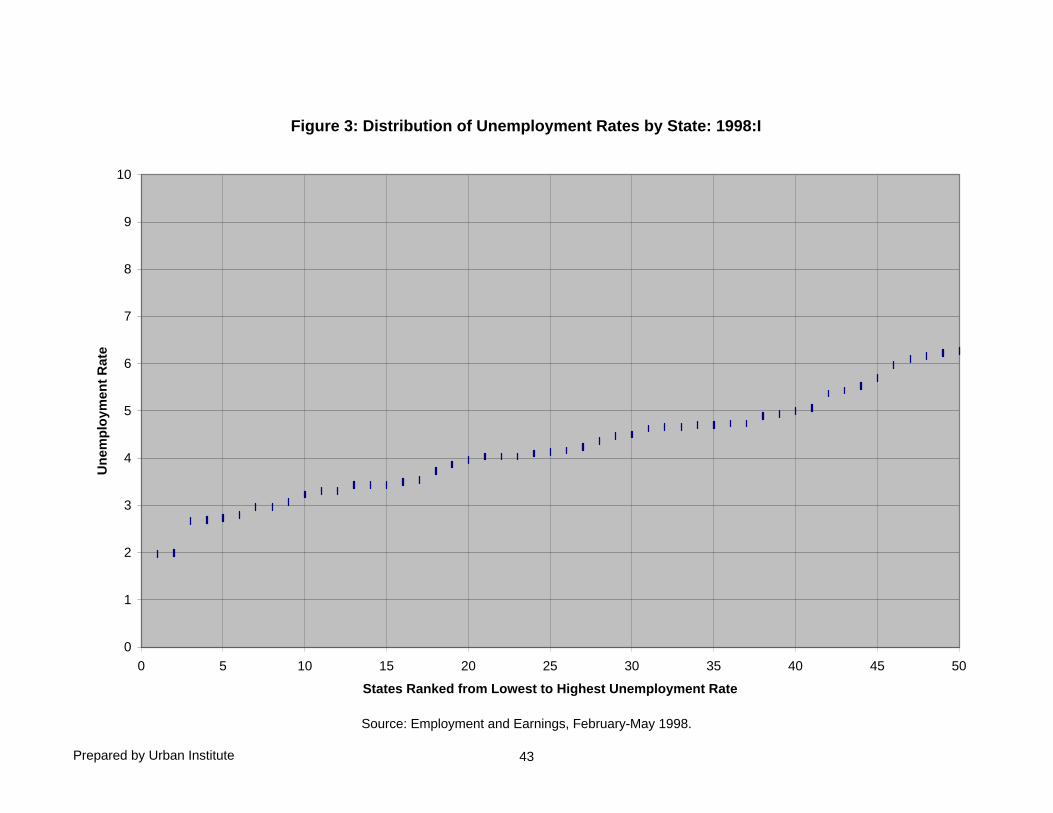
Prepared by Urban Institute
Source: Employment and Earnings, February-May 1998.
43
Figure 3: Distribution of Unemployment Rates by State: 1998:I
0
1
2
3
4
5
6
7
8
9
10
0 5 10 15 20 25 30 35 40 45 50
States Ranked from Lowest to Highest Unemployment Rate
Un
emp
loym
ent
Rat
e
44
experiencing unemployment rates at about 3.5 percent or below. If migration is limited, one
would expect to observe faster wage growth in these low unemployment rate areas than in high
unemployment areas.
To test this possibility, we compiled data on nominal wage growth between 1995:I and
1998:I by state and calculated growth in average weekly and average hourly wages and salaries
from the outgoing rotation samples of the relevant Current Population Surveys. Next we
tabulated growth in earnings by states ranked on the basis of 1998 unemployment rates, 1995-
1998 percentage change in employment, and 1995-1998 percent change in unemployment rates.
The calculations grouped areas by quartiles of each labor market indicator. The unemployment
rate groupings were those at 3.7 percent or below, 3.7-4.7 percent, 4.7-5.1 percent, and over 5.1
percent.
The well-known Phillips curve relates wage growth to levels of unemployment rates.
Looking at this relationship across areas, one finds that wage growth was no higher in the lowest
unemployment areas than in other areas. The numbers in Table 8 show no apparent relationship
between rates of wage growth and area employment conditions. For example, the mean wage
rates and mean weekly earnings were virtually identical across all four quartiles of
unemployment rates.
Employer Responses to Tight Job Markets
How have employers kept wages in check in the face of these extremely tight labor
markets? The answer is unclear. However, two sets of strategies appear to have emerged. The
first is common to expansions and involves widening recruitment, expanding training, upgrading
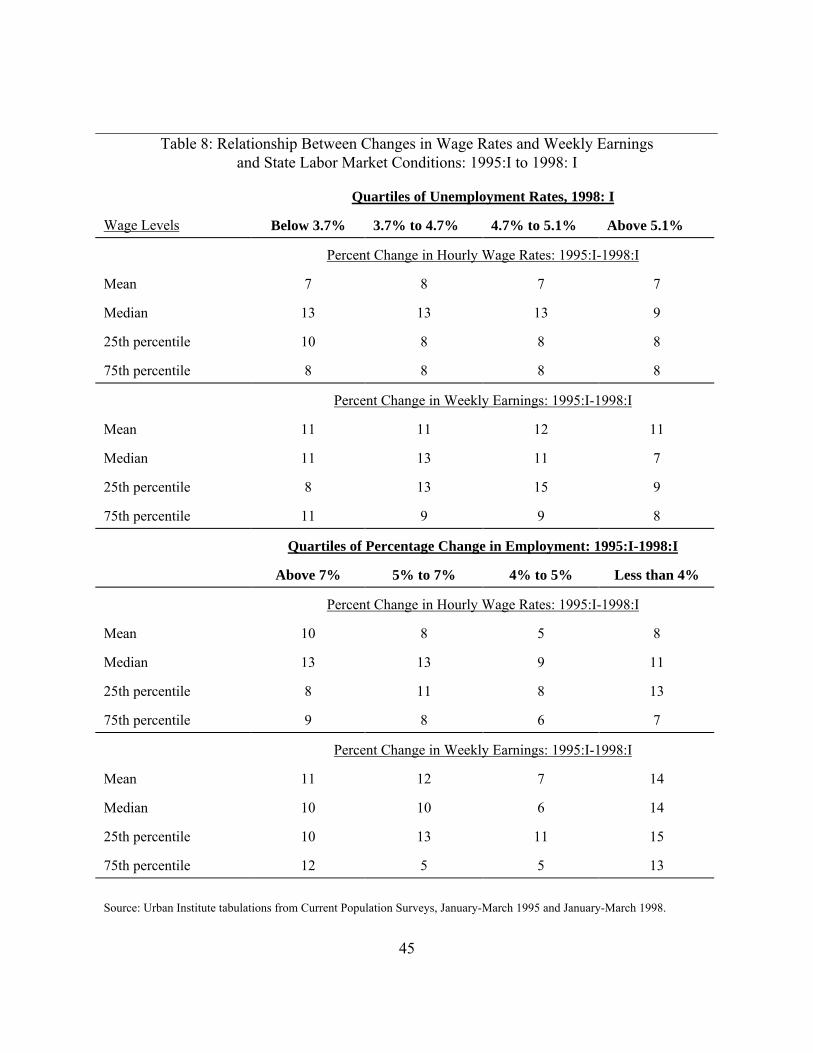
45
Table 8: Relationship Between Changes in Wage Rates and Weekly Earningsand State Labor Market Conditions: 1995:I to 1998: I
Quartiles of Unemployment Rates, 1998: I
Wage Levels Below 3.7% 3.7% to 4.7% 4.7% to 5.1% Above 5.1%
Percent Change in Hourly Wage Rates: 1995:I-1998:I
Mean 7 8 7 7
Median 13 13 13 9
25th percentile 10 8 8 8
75th percentile 8 8 8 8
Percent Change in Weekly Earnings: 1995:I-1998:I
Mean 11 11 12 11
Median 11 13 11 7
25th percentile 8 13 15 9
75th percentile 11 9 9 8
Quartiles of Percentage Change in Employment: 1995:I-1998:I
Above 7% 5% to 7% 4% to 5% Less than 4%
Percent Change in Hourly Wage Rates: 1995:I-1998:I
Mean 10 8 5 8
Median 13 13 9 11
25th percentile 8 11 8 13
75th percentile 9 8 6 7
Percent Change in Weekly Earnings: 1995:I-1998:I
Mean 11 12 7 14
Median 10 10 6 14
25th percentile 10 13 11 15
75th percentile 12 5 5 13
Source: Urban Institute tabulations from Current Population Surveys, January-March 1995 and January-March 1998.
46
existing workers, and/or lowering normal hiring standards. The second involves the use of
signing bonuses, stock options, profit-sharing, and other forms of non-wage compensation.
Types of Employer Responses
Employers engage in a number of strategies in response to a shortage of workers. Among
the most common are:
C To increase recruiting, by advertising more, turning more to employment agencies,reaching a wider geographic area, and even paying recruiting bonuses to employees;
C To increase overtime work and turn part-time positions into full-time jobs;
C To reduce education and other requirements for new hires;
C To restructure work in ways that adapt to the available work force;
C To substitute capital for labor;
C To expand the supply of qualified workers by conducting additional training;
C To improve working conditions;
C To offer bonuses, stock options, and other forms of non-wage compensation to newand/or existing employees; and
C To improve wages and fringe benefits.
Although employers generally turn to increases in wages and fringe benefits only as a last
resort, a significant impact on wages unusually emerges by this point in the business cycle. A
natural explanation is that employers are choosing to emphasize responses other than wage
increases over the current expansion. While the evidence concerning non-wage responses is
spotty, individual cases and limited data suggest employers are indeed adopting the strategy of
emphasizing non-wage approaches.
47
Training
Employers are apparently increasing their training in a number of ways. Unfortunately,
there are few consistent data sets documenting training practices over time. The 1994 National
Employer Survey (NES) of over 4,000 employers, conducted by the US Bureau of the Census on
behalf of the National Center on the Educational Quality of the Workforce, University of
Pennsylvania, gives a detailed picture of training patterns and expectations for growth over time.
One striking finding is that over two-thirds of employers reported that the skills required to
perform production or support jobs increased over the prior three years. Over three out of four
employers said they had increased training outlays over the prior three years, while only about
three percent or less had decreased their amounts of training. Employers reporting rising skill
requirements on production and support jobs were especially likely to have increased training; 85
percent of this group increased training as compared to 58 percent of employers who said skill
requirements had not increased. In addition, the majority of employers projected a further
increase in training.
Of the employers reporting an increase in training, over 80 percent cited changes in the
work process, such as changes in technology or changes in the structure of work. Over 60 percent
attributed the increases to product changes and 90 percent saw expanded training as a way of
upgrading quality. In addition, nearly two-thirds of employers indicated that increased training
was motivated by the fact that new hires did not have the necessary skills.
The 1994 NES reveals that several types of training are offered by large proportions of
employers (see Table 6). Note that over three in four employers reimburse workers for tuition at
colleges and training institute and that over 70 percent provide training in production equipment,
48
in computer literacy, cross training, and teamwork. Most of these training areas are expected to
grow over the next three years.
A Department of Labor survey (Frazis, et al., 1998) undertaken in 1995 showed that 70
percent of workers received some formal training in 1995 and virtually all (96 percent) spent
time in informal training. Formal training is training that is planned in advance and has a
structured format and a defined curriculum. Much of the formal, employer-sponsored training
involved only a modest number of hours.1 Employees reported averaging only about 13 hours of
formal training during a six month period and about 31 hours of informal training. Reports by
employers showed an even lower number of hours. Still, the costs of training, counting wages
and salaries paid to trainees, tuition reimbursements, wages of trainers, and payments to outside
trainers, amounted to over $50 billion per year. The youngest (under age 25) and oldest workers
(over age 54) experienced the least amount of training. Smaller firms provided somewhat less
training, though few differences were observed between medium size establishments (100-499
employees) and large establishments (500 and over employees). Firms implementing four or
more new workplace practices, such as pay for skills, employee involvement in technology
decisions, job redesign, quality circles, and self-directed work teams, reported almost twice as
much formal training as other firms. Formal training varies significantly among types of workers.
More training reaches the high-paid, well-educated, full-time workers, workers in establishments
with medium or low turnover, and workers with long tenure at the firm. For example, 90 percent
of workers with a BA or more received formal training but only 60 percent of those with a high
1. Relative to workers in other OECD countries, workers in the US are more likely to obtain job-related training, but average fewer hours per trainee. As a result, the average amount of traininghours per worker is similar to the average for other OECD countries.
49
school degree or less did so. At the same time, average hours of training were higher among
workers in the production, construction, and material handling occupations than among mangers.
These BLS data contrast sharply with data reported by the OECD from the International
Literacy Survey. Their report suggests only about 23 percent of workers received any job or
career-related training paid for by employers.
In any event, there is little indication that firms are providing depth in their formal
training sufficient to raise significantly the capacities of less skilled workers. Formal training
averages less than one week per year. Despite these limitations, some firms are increasingly
emphasizing training, not only to improve the productivity of existing employeers but also to
increase the supply of qualified workers in various fields.
Many companies have begun working with high schools to develop a new work force.
Charles Schwab is a good example of a company making an effort to shift from recruiting only
workers with a BA degree to developing their own work force through a combination of work-
based learning, work experience, and school-based learning. CISCO Systems is working with
high schools to help young people qualify for jobs as computer network administrators. The auto
industry has promoted a variety of programs to upgrade the quality of training for future auto
mechanics. Other industries are working closely with career academies, which focus on industry
or occupational fields in such areas as finance, travel, health, and computers.
Apparently, the involvement of employers goes beyond a few individual cases. According to the
1997 follow-up of the National Employer Survey of about 7,000 employers, an extraordinary 74
percent said they were participating in school-to-work partnerships and nearly 24 percent
reported providing internships.
50
It will take time before many of these initiatives generate a substantial increase in the
labor supply of skilled workers. However, in the interim, hiring and training young people as
low-wage interns may allow many firms to limit the costs of expanding their work force.
Several important questions arise about training responses. First, to what extent do firms
perceive special barriers that limit the amounts of training they sponsor? Some firms may hold
back on extensive training efforts because of their concern that workers will leave the firm once
they undergo training. Second, can we learn anything about the nature of worker shortages from
the training undertaken by firms?
Non-wage Forms of Compensation
Employers are apparently expanding their use of special forms of compensation that do
not involve direct salary increases. Despite the thriving economy, firms see themselves in a
highly competitive environment, one in which raising prices can mean large losses of sales.
Anecdotal evidence suggest firms are turning to bonuses and variable compensation as a
way of attracting workers in today’s tight labor market. According to Louis Uchitelle (1998),
signing bonuses are proliferating and reaching well beyond upper level managers and skilled
technicians. He cites examples such as the Labor Department’s offer of a $4,000 bonus to attract
young economists and Price Waterhouse hiring bonus of $10,000 provided to newly hired
management. Reportedly, the 1998 class of Cornell MBAs received an average bonus of
$17,500, nearly double the 1996 average of $9,400. Increasingly, employers are willing to extend
signing bonuses to other college graduates, including public school teachers.
A second expanding source of compensation is employee stock ownership and stock
options. According the 1994 National Employer Survey, 35 percent of employers were offering
51
stock options to their workers. By 1999, the figure is no doubt considerably higher. The National
Center for Employee Ownership estimates that nearly 8 million workers participate in Employee
Stock Ownership Plans or stock bonus plans and at least 6 million are in broad stock option
plans. Changes over time in the compensation provided through these and other stock option or
stock purchase plans are unknown. The Bureau of Labor Statistics does not try to measure the
implicit income provided to workers who receive stock options.
One related trend in compensation is the area of nonproduction bonuses. According to
Schwenk (1997), the proportion of compensation going to nonproduction bonuses nearly
doubled, rising from about 0.7 percent in 1986 to 1.3 percent in 1996. As expected, year-to-year
percentage changes in nonproduction bonuses are highly variable and presumably highly
sensitive to the profits of firms paying such bonuses (Walker and Bergman, 1998). For example,
since the 1991-92 period, percent changes in bonuses were 16 percent, 21 percent, 7 percent, 14
percent, and 5 percent.
The share of wages and salaries in total compensation seems to have declined only
slightly from 73 percent in 1986 to 71.9 percent in 1996, if we take account of bonuses and
benefit costs, including paid vacations, sick leave, health insurance, retirement plans, and social
security and workers’ compensation. However, these data ignore the value of stock options and
possibly other types of special payments.
Whatever the facts, should policymakers should promote compensation schemes linked to
a firm’s performance? Might the apparent increases in bonuses and stock options help firms
remain cost-conscious in today’s highly competitive environment? In the early 1980s, Martin
Weitzman (1984) proposed “the share economy,” one in which compensation would be based
52
less on fixed wage contracts and based more on arrangements in which what workers received
depended on the firm’s revenues or profits. Through the 1990s, Weitzman has continued to make
the case for moving away from fixed wages and his work has stimulated a lively debate in the
economics profession. The debate deals with issues involving microeconomics (relating to the
impact on individual firm hiring and performance) and macroeconomics (relating to aggregate
unemployment and inflation).
Research on the role of pay incentives to firm performance certainly predates the work by
Weitzman. A substantial literature has developed around these issues and many of the findings
suggest positive impacts on productivity and profitability from shifting compensation away from
fixed wage contracts.
The focus here is on whether variable pay helps firms respond to booming
macroeconomic conditions. Although Weitzman’s primary argument was that variable pay could
induce hiring and reduce the 1980s problem of stagflation, he (1988) subsequently argued that
the shift to variable pay could lower NAIRU, the unemployment rate consistent with non-
increasing inflation. Two key elements of the argument are 1) that incentive pay arrangements
encourage firms to increase hiring, and 2) that increased flexibility in pay will permit reduced
variability in employment. In the case of pure wage contracts, firms hire to the point where the
marginal cost (the wage) of the extra worker is equal to the marginal revenue obtained from the
extra worker’s contribution to sales. In this case, if sales or prices fall and thus reduce marginal
revenue below the wage costs, then the profit-making firm is likely to lay off workers until it
reaches a new equilibrium. On the other hand, if workers were to receive a percentage of sales,
then the firm would have no incentive to lay off marginal workers so long as they contributed
53
some amount to revenues (even if it were less than the wage or the average revenue per worker).
Overall revenue to the firm would have declined but the firm would continue to offer
employment to existing workers, since the revenues generated by the marginal workers would
benefit the firm. However, average pay to the remaining workers would be lower with a no layoff
policy than with the types of layoffs arising in firms with wage contracts.
One obvious implication is that workers might be able to gain increased employment
stability but at the cost of increased variability of compensation. Workers confident in their
ability to keep a job might well choose to avoid the risks of variable pay. On the other hand,
workers vulnerable to layoff and workers optimistic about their firm’s future are likely to prefer
compensation linked to their firm’s performance.
Notwithstanding the logic of the share economy, the advantages of an increased emphasis
on profit-sharing or revenue-sharing might be illusory (John, 1991). In a profit-sharing firm,
adverse shocks reduce profits and thus lower compensation per worker. Although firms have no
direct incentive to lay off workers in this situation, they may be reluctant to allow average worker
compensation to fall significantly. They may lose their best workers to competitors or may find
that their jobs do not pay enough to deter workers from shirking. To avoid this scenario, firms
may lay off workers even though the marginal workers do not generate any direct costs. Another
possibility is that reduced compensation will lower the supply of labor and again induce
reductions in employment in response to the shock to profits. Thus, while some labor market
conditions suggest little gain from the shift away from fixed wage contracts, other scenarios
indicate more employment stability.
In today’s context, the more important question may well be the impact of profit-sharing
54
schemes on NAIRU. Here, Weitzman (1988) sees some potential gains for the share economy but
concedes that some causes of a high natural rate of unemployment would apply as much in a
profit-sharing context and as in a fixed wage context. Neither would have any advantage if high
NAIRUs resulted from high social benefits, excessive bargaining power by unions, or efficiency
wages. However, if the problem was that firm insiders were so powerful that external
unemployment did little to affect wages, then bias toward expanding employment in profit-
sharing firms would help speed up reductions in unemployment when the economy expanded. A
world emphasizing profit-sharing might also reduce frictional and structural unemployment.
Surprisingly, Weitzman says little about the potential impact on inflation or on how
uncertainty on the part of the firm will affect employment and prices in a low unemployment
economy. Firms concerned about raising prices and uncertain about future sales may wish to
avoid building high wages into their permanent cost structure. At the same time, they must
recruit workers in the context of a tight labor market. The response by many firms is to try to
make one-time payments, especially to newly hired workers, and to offer stock options and
bonuses which will ultimately be linked to profits. To the extent firms can attract and retain the
same quality of workers using these compensation schemes---perhaps because good workers are
willing to take risks in return for high potential rewards---the package may make financial sense
as a hedge for firms. Since payments to workers will be directly correlated with the firm’s
performance, the losses due to weak firm performance will be mitigated by the lower
compensation to workers while gains due to strong firm performance will be moderated by the
higher compensation going to workers.
Already, the government encourages profit-sharing in a number of ways. There are

55
special rules that provide tax advantages to workers and firms who create Employee Stock
Ownership Plans (ESOPs). The tax treatment of stock options is also favorable. A worker
receiving an option to buy his company’s stock at the current market price obtains something of
value even when the option price is the current market price. Modern financial economics can
place a value on these options. Yet, workers will not pay any tax on the options until and unless
they exercise the options and sell the stock at a price higher than the option price.
A key question is whether the government should do more to encourage these and other profit-
sharing arrangements.
VI. Globalization
The expansion of world trade, communication, immigration, capital flows, and
multinational business activity has generated a great deal of political controversy in recent years.
The campaigns of Ross Perot and of Patrick Buchanan provided the most publicized outcries
against globalization of trade and investment flows, and opposition to trade agreements. But
similar concerns are voiced in writings by political commentators (Kuttner, 1997; Wolman and
Colamosca, 1997; Greider, 1997) and by some economists (e.g. Freeman, 1995; Wood, 1995).
The title of a 1995 article by Richard Freeman put the matter bluntly, “Are your wages set in
Beijing?”
During the early postwar period, at least through the late 1960s, a broad consensus in the
US favored liberal international trade policies. The US took a leading role in promoting the
opening of world markets, in sharp contrast to its protectionist periods in the 19th century and the
1930s (DeLong, 1998). In the financial arena, the US decision to allow the value of the dollar to

56
be determined in the free market played a role in the globalization of currency markets and
ultimately other financial markets. By the 1990s, however, in the aftermath of post-1973 weak
productivity growth, slow wage growth and increasing inequality, the optimistic picture of
globalization has been challenged. While economic theory continues to predict aggregate gains
from trade, some see the net gains as too limited to offset large losses experienced by less
advantaged citizens, many of whom are said to lose from globalization.
The globalization debate raises several important questions about future workforce trends
and public policy responses:
1) What is the impact of globalization on productivity and on the real wages and real incomes of
workers as a whole?
2) How does globalization affect the demand for various groups of workers as well as the
distribution of real wages and incomes?
3) To what extent does globalization limit the ability of governments to take constructive
actions on behalf of the work force and disadvantaged groups?
4) What policies can permit the country to take advantage of the gains from globalization while
minimizing its costs?
The literature on each of these questions is far too extensive to review in this paper.
However, we provide some basic facts and draw on a range of analyses to clarify the various
positions on these questions. The first step is to clarify the meaning of globalization. In addition
to international trade, globalization embodies foreign direct investment, international financial
flows, international migration, and cultural interactions.
57
Globalization: Trends and Patterns
Trade is clearly expanding throughout the world and strikingly so in the US. World
merchandise exports increased over the postwar period, from seven percent of world GDP in
1950 to 17.1 percent in 1993 (Krugman, 1995). Dramatic reductions in transportation and
communication costs have certainly played a major role (Cooper, 1995; Council of Economic
Advisers, 1997). Ocean freight per ton declined from $95 in 1920 to $29 in 1990 (1990 dollars);
air transport per passenger mile fell from 68 cents in 1930 to 11 cents in 1990. By 1993, 29
percent of the value added of US exports traveled by air. Policy developments leading to the
opening of formerly closed markets have also played a major role in the expansion of postwar
trade (Krugman, 1995).
For the US, we can see in Figure 4 the trend in the average of exports and imports as a
proportion of the Gross Domestic Product. Note the two large jumps in the trade shares. Between
the first oil shock in the early 1970s and the oil shock in 1979-1980, the trade share rose from
under 6 percent in 1973 to over 10 percent in 1980. When oil prices fell in the mid-1980s, the
trade share fell back somewhat to about 8.5 percent before returning to the 10 percent level in the
early 1990s and reaching 12 percent by the late 1990s.
Trade takes place mostly between industrial countries, but the US share of imports from
less developed countries has increased. In 1972, US exports manufactured goods to less
developed, non-OPEC countries were 1.2 percent of GDP, while imports to the US of
manufactured goods from these countries stood at about 0.9 percent of GDP. By 1993, imports
from these less developed countries tripled to 2.7 percent of GDP while US exports to these
countries doubled to 2.4 percent
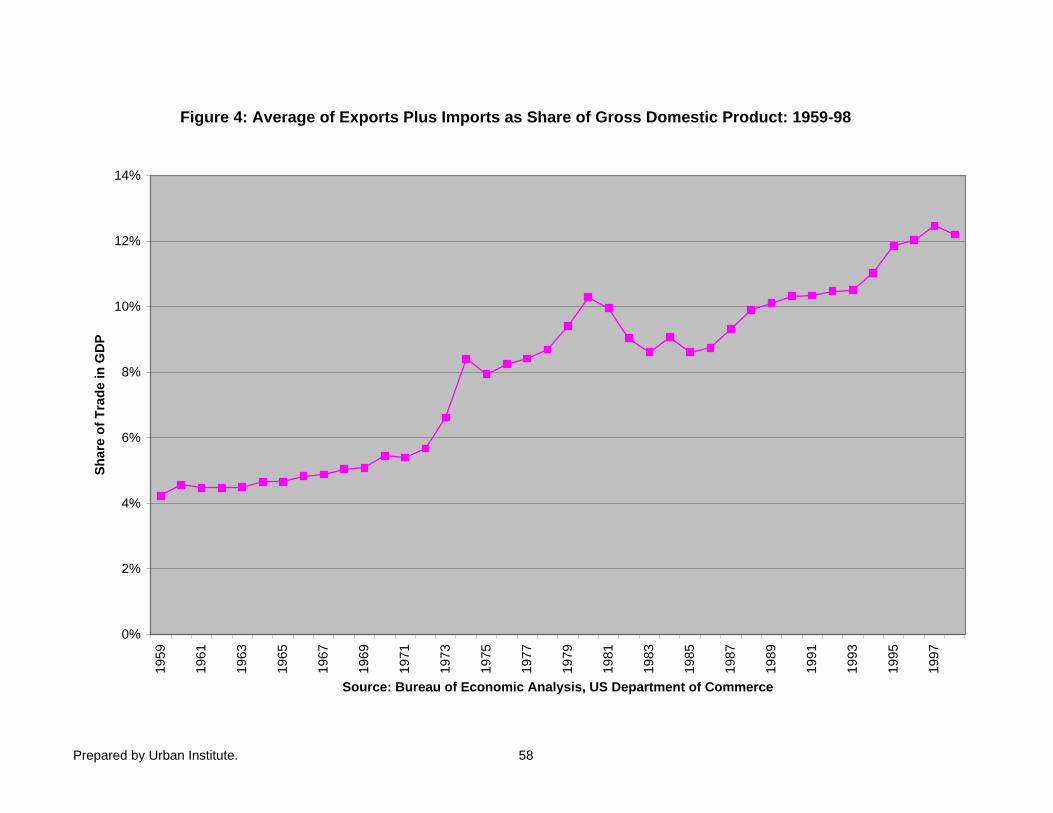
Prepared by Urban Institute. 58
Figure 4: Average of Exports Plus Imports as Share of Gross Domestic Product: 1959-98
0%
2%
4%
6%
8%
10%
12%
14%19
59
1961
1963
1965
1967
1969
1971
1973
1975
1977
1979
1981
1983
1985
1987
1989
1991
1993
1995
1997
Source: Bureau of Economic Analysis, US Department of Commerce
Sh
are
of
Tra
de
in G
DP
59
of GDP (Lawrence, 1996). By 1995, the percent of manufacturing imports coming from
developing countries had risen to 33.6 percent, up from 18 percent in 1973 (Collins, 1998).
These imports were about 16 percent of value added in all of US manufacturing. Exports to less
developed countries also increased substantially. The non-oil developing countries took 39
percent of US exports in 1995, well above the 24 percent figure for 1970. Often left out of these
calculations is the fact that wages have been rising, even in countries considered less-developed.
As Collins (1998) points out, the average wage paid to manufacturing workers in countries
trading with the US increased from 38 percent of US wages in 1960 to 85 percent in 1992. This
striking evidence demonstrates that the US is not trading more with countries paying relatively
low wages.
Expanding trade is only one dimension of globalization. Another major indicator is
foreign investment, including direct investment by US companies abroad and by foreign
companies in the US as well as financial investments by foreign citizens or companies in
domestic stock, bond, or money markets. When foreign companies invest in the US and US
companies invest abroad, economies generally become more integrated with the rest of the
world.
The overwhelming amount of business investment and financial investment takes place
between industrial countries. Nearly $80 billion of the $90 billion invested in the US from abroad
in 1997 came from Europe, Canada, and Japan. About $72 billion of the $114 billion of the 1997
foreign investment by US companies went to Europe, Canada, and Japan. In recent years, direct
investment in less developed countries has expanded significantly, doubling between 1990 and
60
1995 while total US direct investment abroad rose by 65 percent. The trend continued through
1997, as foreign direct investment in Latin America rose significantly.
Note that the difference in direct foreign investment amounted to about $24 billion, or
less than two percent of gross investment in the US. Further, the payments from abroad to US
investors virtually match the payments to foreigners for their assets. In 1997, the US paid about
$257 billion to all foreign factors of production (mostly returns on capital) while US residents
and companies received almost the same amount, about $245 billion. On this measure, the rise of
globalization has largely yielded outflows and inflows of similar magnitudes.
The similarity in returns masks much larger differences in market value of assets. As of
1996, foreigners held about $5.1 trillion in assets, while the public and private sectors of the US
owned about $4.3 trillion. Since foreign-held assets in the US rose more rapidly than US-owned
assets in other countries, foreigners were actually investing more in the US than US individuals
and companies were investing abroad.
Another dimension of globalization is the growth of the international capital market.
Financial flows across countries now dwarf the levels of only ten years ago. Specialized markets,
companies, and individuals have created the means by which organizations can manage risks
(particularly foreign currency and interest rate risks) and make speculative investments. The
international financial markets expanded in part with the growth in foreign trade and investment.
But some are concerned that international financial markets take too much power away from
national policymakers by constraining their ability to take various kinds of macroeconomic
decisions and also to tax, to raise government spending, and to set labor standards.
61
Immigration to the US has been expanding along with the growth of trade and financial
flows. The share of net annual US population growth accounted for by immigrants has reached
about one-third, which equals its previous historical peak. About 1.1 million legal and illegal
immigrants enter the US each year and are concentrated in specific regions of the country.
Moreover, immigrants are increasingly likely to come from less-developed countries. Between
the 1950s and the early 1990s, the share of immigrants coming from Europe and Canada fell
from about 67 percent to 21 percent, while the proportion from Asian and Latin American less
developed countries rose from 30 percent to 75 percent. Since today’s immigrants are somewhat
less educated than native-born Americans, many worry about competition between immigrant
workers and less-skilled, native-born workers.
Selected Evidence About Globalization’s Impact on the US Labor Market Effects onOverall Incomes and Wages
Economists generally favor free trade as a method for raising real incomes. When
individuals, firms, and/or countries specialize in production for which they have a comparative
advantage, the benefits accrue to all of the trading partners. In one sense, free trade and
investment flows at the international level are a broadening of competition at the individual
country level. Extending competition to the international sphere broadens the scope for
increasing allocative efficiency. It could even raise efficiency in a dynamic setting, since broader
competition may stimulate innovation. Reduced barriers to trade can broaden export markets and
thereby allow US companies to reap larger returns on their innovations (Lawrence and Litan,
1998), can raise productivity by increasing competitive pressure on firms and by allowing US
firms to draw on the capital equipment and knowledge produced in other countries, can widen
62
the variety of goods and services available to consumers, and can lower world prices. Lawrence
and Litan cite World Bank estimates that consumers will gain between $100-200 billion per year
simply as a result of one international trade agreement. Further substantial gains are expected to
flow from the expanded international competition in telecommunications.
Nevertheless, some groups may lose from trade and may receive little or no compensation
from the winners. The losses occur as some firms face lower prices and some workers must
accept lower wages in the face of added competition. Were factors of production entirely mobile,
firms and workers experiencing losses could shift away from their existing sectors toward more
financially rewarding ones. But, given immobile capital and specific skills, changes in trade
flows can impose capital losses. (Of course, other external forces—including changes in weather,
technology, or government regulations—can create similar losses.) In addition, trade may add
more competitive pressure to one factor of production (say, unskilled labor) than to another
factor (say, skilled labor).
The theoretical impact of immigration is less clear. If immigrants simply expanded all
segments of the nation’s labor force and capital stock in the same proportions, rising immigration
need not lower the incomes of non-immigrants (Card, 1996). In fact, given economies of scale,
immigration could actually raise incomes of non-immigrants. On the other hand, if the immigrant
inflow was concentrated among low-skill workers and was not matched by added capital, then
immigrants could gain at the expense of native-born workers. Immigration directly increases the
supply of labor and thus could lower average wages as well as affect the distribution of wages.
Given that immigration is concentrated in a small number of places within the US, any negative
effects of immigration on wages should take place primarily in these locations. Yet, according to
63
David Card (1996), effects on wages are difficult to observe. Most studies of the impact of
immigration focus on its role in increasing earnings inequality, not on its effect on average
incomes. We take up these issues in the next section.
The impact of foreign investment flows on workers is uncertain as well. In principle, the
free flow of capital should raise the productivity of investments and certainly benefit owners of
capital. One might think workers would lose if fellow citizens who own capital can invest their
funds outside the country. If investments abroad substitute for investments in the home country,
workers will work with less capital and find themselves producing less and earning less. But,
foreign investments might not substitute for local investments for two reasons: first, because a
low expected return locally might cause capital owners not to make direct investments at all and
second, because foreign investments may complement local investments, as when a company
becomes more efficient by building low value-added parts in a less developed country and high
value-added components in their home country. Moreover, capital flows into as well as out of the
country. If outflows ultimately lower the wages of workers, inflows may raise wages.
Several questions immediately arise from this textbook formulation. First, how large are
the gains from globalization? Second, how are the benefits from globalization distributed? In
particular, do some workers lose in absolute terms as well as relative to others in their societies?
Perhaps because of the complexity of the problem, few have attempted to estimate the
overall income gains (or losses) from globalization. Even the effects of trade alone on national
income are unclear. DeLong (1998) presents a figure of .3 to .7 percent of national income as the
short-run costs to national income from protectionism over the 1800-1940 period in the US.
However, he also points out that the long-run costs may have been much greater, since tariffs
64
raised the prices of imported capital goods and led to a lower investment, lower wage economy.
One respondent to the DeLong paper (Eichengreen, 1998) agreed that protectionism did not assist
US growth while another (Temin, 1998) argued that early tariffs helped stimulate US
manufacturing and ultimately increased economic growth. Another ongoing debate is over the
value of trade barriers in stimulating growth in Asian economies, particularly Japan and South
Korea. While economists cannot agree on the impact of trade barriers on national incomes in the
past, most favor open trade regimes, even those who strongly favor policies to compensate those
negatively affected by trade.
If effects on overall incomes are difficult to estimate, what about the impact on average
real wages? Lawrence (1996) is content to argue that the expansion of trade could not have done
much to reduce average wages in the US. His focus is on manufacturing, since it is this sector
where the growth in imports from less-developed countries has taken place. After accounting for
the wage premium paid in manufacturing, for the increase in manufacturing imports, and for the
possibility that the threat of imports forced unionized manufacturing workers to accept lower
rates of wage growth, Lawrence concludes that expanded trade could have only lowered wages
by far less than one percent (0.1 to 0.3 percent) between 1978 and 1989.
A recent report by Scott, Lee, and Schmitt (1997) projects larger negative impacts on
wages of US workers. They attribute US job losses of about 2.4 million in 1994 to the nearly
$100 billion increase in the trade deficit in goods and services that took place between 1979 and
1994. As the authors themselves state, it may be inappropriate to attribute the job loss figure to
trade instead of to broader macroeconomic factors. They still contend that trade has a negative
impact on US workers because of the induced shift in the composition of jobs. Their empirical
65
results are far from conclusive in indicating a negative trade effect on average wages, since they
suggest that imports tend to reduce jobs requiring less education than the economy-wide average
while exports tend to increase jobs among highly educated workers.
An alternative perspective emphasizes the potential positive impact of openness on
productivity and, ultimately, wage growth. A set of case studies conducted by McKinsey Global
Institute (Lewis, et al., 1992; Bailey and Gersbach, 1995) estimates how productivity differs
between the US, Germany, and Japan in a range of specific manufacturing and service industries
and explores the reasons for cross country differences. The findings for manufacturing suggest
that the more exposed a country’s industry is to global competition, the higher the productivity.
Companies forced to compete with the best internal and external producers must achieve high
productivity and quality or risk losing sales, profits, and even staying in business. The McKinsey
studies of selected service industries yielded similarly positive effects on productivity from the
competitiveness of the environment. The authors concluded that managers in industries facing an
intensely competitive environment are forced to concentrate on their company’s economic well-
being, an emphasis that ultimately leads to higher productivity. The McKinsey case studies cast
doubt on the idea (Piore, 1998) that companies succeed internationally by pursuing a low road of
low wages, while accepting low productivity. However, since the McKinsey analyses deal only
with selected industries, they may miss the experience of industries following the low road
model.
One topic that has attracted little or no attention in the literature is the impact of trade on
the economy’s ability to reach low unemployment rates with minimal inflation. Certainly,
pushing unemployment rates to 4.5 percent and sustaining the current expansion are important
66
for US workers, especially the less advantaged groups. Trade flows and the threat of foreign
competition may well serve as a break on price increases that otherwise might emerge in a more
closed economy. On the other hand, open economies may be more unstable, both because of the
larger potential impact of exchange rate shocks, supply shocks, and demand shocks. At this
point, macroeconomists are still trying to understand why the US economy has managed to
maintain low unemployment rates without generating inflation. If a more open economy is one of
the reasons, then policymakers will rightly be wary of actions that restrict trade.
Foreign investment is another element of globalization that could affect average US
wages. Some writers cite foreign investments or the threat of foreign investments by US
companies as weakening the power of workers and ultimately lowering their wages. The problem
extends to the well-educated, according to Wolman and Colamosca (1997), who point to foreign
investments by Citibank and Hewlett-Packard in Asia as “only the beginning of the trend toward
corporate ‘outsourcing’…of highly skilled labor.” In 1995-1996, affiliates of non-bank US
companies operating abroad (BEA, 1998) employed about seven million workers, or about five
percent of the US work force. However, foreign affiliates operating in the US employed about 5
million workers in the US. Thus, taking account of all direct foreign investment, there are about
2 million jobs fleeing abroad not offset by jobs coming into the country. This figure constitutes
about 1.5 percent of the US work force. Moreover, these data do not take account of the higher
investment in the US resulting from the fact that the US attracts more inflows of capital than US
companies and individuals spend on foreign investments. One study (Wade, 1996) suggests that
even multinational enterprises generally move only their most routinized operations abroad and
67
that such changes as “just-in-time” inventory management and increased specialization weaken
the incentives to disperse production globally and encourage locations near final markets.
Effects on the Distribution of Wages and Incomes
The primary concern about globalization is its impact on the distribution of wages and
incomes in developed countries, including the US. One indicator of this concern is the vast
literature on trade’s distributional effects that emerged in the 1990s. Moreover, political
movements opposing expanded trade emphasize trade’s supposedly devastating effects on less-
skilled or middle-skilled workers.
The underlying reason globalization is said to harm low-skilled US workers is that the
rest of the world has abundant low-skilled workers who are paid a small fraction of the wages
paid to comparable US workers. Once foreign less-skilled workers are allowed to compete with
less-skilled US workers, the wages of the two groups will converge, lowering US wages toward
those paid in other countries. The added competition could come via trade (where less-skilled
work becomes embodied in goods) or immigration (where less-skilled workers directly raise US
labor supplies).
Other explanations based on economic theory account for all changes in price,
production, and consumption, but use a variety of simplifying assumptions about technologies
and mobility (Cline, 1997). According to a commonly cited theory (Stolper-Samuelson),
increased trade in goods produced with relatively high proportions of a particular factor (say,
unskilled labor) will cause a reduction in the price of that factor and an increase in its use.
Applied to the debate over trade to the US, this theory offers a mechanism by which the
68
expanded trade from less-developed countries could lower the wages of the less-skilled and
increase wage inequality.
Before discussing some of the empirical work aimed at isolating the impact of
globalization on wage inequality, it is useful to distinguish among measures of wage inequality.
Trade could affect the price (wage rate) and/or quantity (number of workers) of each category of
labor. Wage rates alone may not capture a reduced demand for less-skilled US workers, since
minimum wages or other wage rigidities could prevent wages from falling and lead to large
employment reductions. Thus, for example, European trade with less-developed countries could
be affecting European labor markets via increased unemployment of the less-skilled but still not
generate increased wage rate differences between skilled and less-skilled workers.
Most studies examine the effect of trade on the wage rate differentials between two
categories of workers. Some authors use the wage differential by education, such as the
percentage wage gap between workers with a BA degree and workers with only a high school
degree or between the college-educated and non-college workers (Baldwin and Cain, 1994).
Others focus on the wage differential between production and non-production workers (Bernard
and Jensen, 1994; Leamer, 1998; and Sachs and Shatz, 1998). The choice matters because the
wage gap by educational category rose much more dramatically than the wage gap between
production and nonproduction workers. More importantly, analyses of fixed categories of labor
may yield misleading results even about group wage differentials because they ignore changes in
the composition of the categories.
A good example is the wage gap by education. The median earnings of college graduates
grew from 1.3 to 1.7 times the earnings of high school graduates between 1979 and 1995. But,
69
because of substantial increases in educational attainment, the groups did not represent the same
proportions of the labor force. In 1979, the average high school graduate with no college ranked
at the 40th percentile of the educational distribution of the US labor force; by 1993, the ranking of
the average high school graduate had dropped to the 28th percentile. The decline in average
ranking of college graduates was much smaller, declining from the 90th percentile in 1979 to the
87th in 1995. If the quality of the worker depends partly on native ability that is correlated with
educational attainment, then some of the widening gap in wage differentials by educational
category may simply be due to the changing average abilities of the two groups. A higher wage
gap between 87th and 28th percentiles in the ability distribution than between the 90th and 40th
percentiles is hardly surprising nor an indicator of rising inequality. Similar compositional
changes may well explain some, if not all, of the increased differentials between non-production
and production worker wages.
The compositional problem takes on added force since studies of trade impacts on age
differentials between categories generally ignore distributional changes within categories.
Another problem is that, when examining the effects of trade on the prices of particular
industries, analysts measure the skill intensity of industries by fixed categories, by education or
production-nonproduction workers.
While measuring impacts on wage differentials between groups simplifies the analysis,
the approach does not directly address trends in wage inequality, a broad concept that
incorporates all workers. Nevertheless, authors of some trade studies label their findings as
examining impacts on wage inequality when they are actually measuring trends in wage
differentials between fixed categories of workers. The distinction is important because it is
70
clearly possible for wage differentials by education to widen at the same time that overall wage
inequality does not change at all (Lerman, 1997). Further, one recent analysis (Lerman, 1997a)
found that the inequality of wage rates across all hours worked in the US economy was
essentially constant between the mid-1980s and the mid-1990s, the period when expanded trade
flows was said to have increased inequality significantly.
Despite these and other limitations, a large number of studies have yielded estimates of
trade’s impact on wage differentials. The studies are far too numerous to review in this paper.
Yet, even a cursory review of the findings reveals a wide divergence across studies in the
proportion of the increased differential attributed to the growth in trade. Examples of studies
concluding that trade exerted at most a minor (zero to 10-20 percent) impact on wage
differentials include Lawrence (1996), Baldwin and Cain (1997), and Krugman (1995), while
Wood (1994, 1995), Leamer (1998), and Sachs and Shatz (1998) argue for substantial (over 20
percent) impacts from trade alone. This strikingly wide variation comes from differences in
methodology, in time periods, and in measures of wage differentials. One methodology involves
measuring the factor content of imports and exports to determine the impact of trade on the
implicit supply of less-skilled workers. An alternative is to examine the impact of trade on prices
in trade-sensitive industries, especially those trade-sensitive industries that employ large numbers
of less-skilled workers. Price reductions in these sectors would be indicative of trade’s impact on
wage differentials.
The work by Cline (1997) takes a distinctive tack by examining trade’s impact on both
the net changes in wage differentials and on the gross changes in wage differentials. He points
out that the net impact on wage differentials was the sum of several gross disequalizing
71
components minus such equalizing components as the rising supply of skilled workers
throughout the world. Thus, the factors contributing to rising differentials together add up to
more than 100 percent of the net changes. On the basis of Cline’s (1997) elaborate simulation
analysis, trade effects represent a high share (33 percent) of the net changes in wage differentials,
but less than 10 percent of the gross changes. He clearly regards the smaller figure as the most
appropriate.
Cline’s simulation yields projections of the impact of trade expansions on the absolute as
well as the relative position of the unskilled. Freezing existing trade protection levels at their
1993 levels and ruling out additional free trade agreements would do little to boost wages of the
unskilled. Relative wages of the unskilled would fall substantially if trade encompassed the entire
US economy, including the sectors now producing nontraded goods and services. However,
unskilled workers would still gain in absolute terms because of the efficiency gains linked to
trade.
Only a few studies provide a combined estimate of the effects of trade and migration on
wage differentials. The effects of migration have proved surprisingly difficult to identify. As
Card (1996) notes, while one would expect migration to exert its largest impact on areas in which
migrants concentrate, studies of even sudden inflows of foreign immigrants reveal little or no
impact. Nevertheless, in a recent study, Borjas, Freeman, and Katz (1997) find that the high
inflow of immigrants with no high school education accounted for up to half of the increase in
wage differentials between high school graduates and dropouts. At the same time, these authors
find that the combined impact of immigration and trade from less developed countries explains
72
no more than 10% of the widening wage gap between college graduates and high school
graduates.
Overall, the evidence for large impacts of globalization on wage differentials and wage
inequality is limited. Susan Collins, editor of the most recent collection of articles on the subject,
concludes that the “…available evidence suggests that globalization (including trade and
immigration) may explain 1 to 2 percentage points of the 18 percentage point overall change in
the wages for high school-educated workers relative to those who are college educated.”
However, Collins points out that analyses to date have not taken account of several indirect
effects of globalization and that future work may reveal a considerably larger role for the
integration of the world economy.
Whatever the effect of trade and immigration on skilled-unskilled wage differentials,
these two forces exerted a smaller impact on family income inequality. One reason is that since
the mid-1980s overall inequality increased much less than wage differentials by education and
skill. In fact, according to some comprehensive measures of inequality of wage rates across all
hours worked, wage rate inequality has not risen since the mid-1980s (Lerman, 1997). Although
the role of changes within the top three to five percent of the wage distribution are in dispute
(Lerman, 1997; Bernstein and Mishel, 1997), wage inequality across the bottom 95 percent of
hours worked was flat. Moreover, inequality of annual earned income among 25-54 year-olds
actually declined between 1986 and 1995.
A second reason is that family income inequality depends not only on wage inequality but
also on the number of earners per family, the composition of families, and the correlation
between earnings of various family members (Burtless, 1997). According to Burtless’
73
calculations, only about one-third of the rise in family income inequality arises from increases in
wage inequality. Thus, even if trade and immigration accounted for as much as one-third of the
growth in wage inequality (a high estimate in the literature), trade would have contributed less
than 10 percent of the rise in family income inequality.
One apparent omission from this literature is the effect of trade on the relative prices paid
by skilled and unskilled workers and by low and high income households. Much of the concern
about wage inequality effects arises from surging imports from less developed countries. Since
the goods produced by these countries are generally at the low end of the quality spectrum and
include essentials (especially clothing), it may well be that the benefit of lower prices for these
commodities due to trade are disproportionately large among low-income individuals. If so,
analyses of trade would have to take account of this relative consumption price effect as well as
the relative wage effect. Of course, a full analysis of this issue might not yield any differences
across groups in the direct gains from price changes.
Globalization’s Impact on Progressive Government Policies
By limiting the autonomy of national governments to conduct economic policy,
globalization could either harm or help workers. According to Robert Kuttner (1997), worries
about the reaction by global capital markets force governments to adopt contractionary economic
policies. Competition to retain and expand business investment might discourage governments
from imposing corporate taxes. Spending and tax limitations might force a cutback in social
welfare spending. And, global market pressures could pressure governments to deregulate labor
and product markets.
74
Judging the impact of globalization on macroeconomic policy and macroeconomic
outcomes is difficult. Integration into the world economy or closer integration into regional
alliances (as the in European Union) appears to discourage countries from running large fiscal
deficits and permitting high rates of inflation. But in some cases, as in Japan today, it is pressures
from abroad that are encouraging policymakers to pursue expansionary policies. Even when the
short-run effect of globalization causes governments to emphasize contractionary
macroeconomic policies, the long-run impacts are certainly as likely to yield positive as negative
outcomes. Tight fiscal policies, by drawing investments, can lower interest rates, thereby
promoting economic activity.
In the case of the US, the key question is whether price competition resulting from open
trade improves the economy’s ability to sustain very low unemployment rates without inducing
additional inflation. To the extent trade exerts this impact, the gains are likely to be largest
among the less-skilled, since their employment is most responsive to reductions in the aggregate
unemployment rate. In the recent expansion, from 1992 to the first half of 1998, for example, the
employment-population ratio of high school dropouts rose by over ten percent while the
employment-population ratio of college graduates remained constant.
Economic integration need not weaken national authorities’ ability to set high labor
standards for two important reasons. First, such policies as mandated benefits may not raise the
costs of production to the extent that the payroll taxes are borne by the workers in the form of
lower pay. Second, the gains in higher productivity from labor standards may outweigh any
impact on costs.
75
So far, evidence is scanty that globalization is generating irresistible pressures toward the
convergence of policy regimes, according to Eddy Lee (1997) of the International Labor
Organization. Lee cites the wide and continuing differences in labor market institutions in Japan,
Germany and the US as indicative of the ability of countries to pursue different national
approaches while remaining integrated in the world economy.
Financial destabilization resulting from globalization is another worry. There is little
doubt that some financial crises have been exacerbated by the scale of foreign liquid investments.
Certainly, the current run from Asian currencies has complicated Asia’s ability to recover from
the recent shocks. However, when countries experience a financial crisis, a non-market
dimension of globalization—institutions such as the International Monetary Fund and the World
Bank—can provide liquidity and credibility that prevent even greater outflows of currency. On
the other hand, the measures proposed by the IMF for some of the Asian countries may be overly
restrictive and contractionary.
Ironically, globalization effects on financial stability might well lead to even larger
inflows of foreign capital into the US. Thus, while the US might lose sales because of the
weaknesses of foreign economies, the capital inflow might raise investment in the US.
Overall, globalization’s effects on economic policy have been more a matter for
speculation than for rigorous research. Only a modest amount of research is available on the
questions of 1) the impact of globalization on policy; and 2) the effects of any globalization-
induced policies on country outcomes.
76
Policy Implications of Globalization Trends
Surprisingly, disagreements over the impact of globalization are more common among
economists than are differences over policy. Even those who estimate negative effects of trade
on unskilled US workers continue to favor free trade and open markets. Economists who believe
trade’s negative impact is minimal nevertheless favor training and other policies to help low skill
workers.
Policy responses generally fall into three main categories: 1) support for additional
training; 2) wage subsidies for low-wage workers; and 3) special assistance for workers displaced
because of increased imports. Other proposals include raising the minimum wage, encouraging
unionization, and requiring labor standards in other countries.
If the impact of trade is to reduce the demand for less-skilled workers relative to high-
skilled workers, the natural response is to train less-skilled workers to attain higher skills. By
reducing the supply of less-skilled workers and increasing the supply of skilled workers,
improved education and training increases average wages while narrowing the gap between low-
skilled and skilled workers. Trade-induced declines in the relative demand for the less-skilled
could be fully offset by training-induced reductions in the relative supply of less-skilled. If so, we
would not expect any change in relative wages.
The nation’s capacity for training and retraining in response to trade would be enhanced
with improved systems for identifying sectoral skill demands, successful training models, and
certification for occupational skills. In many fields, limited information about training and
certification may slow the adjustment to changing demands. Incentives for continuing and even
77
lifelong learning could also smooth the adjustments to trade-induced shifts in demand. Were US
workers engaging in training on an ongoing basis, they could react more easily to all sources of
restructuring, including not only trade but also technological change. Finally, improving the
nation’s school-to-career systems, especially with youth apprenticeship, would provide another
vehicle for matching skills demanded by employers with the mix of training obtained by students
and workers. Employers are likely to offer places only in apprenticeship fields for which they
anticipate strong demand. Instead of having the mix of training places determined by external
programs, apprenticeship and similar approaches directly transmit employer demands to potential
trainees.
Since expanded education and training may not spur enough of a shift out of the unskilled
categories, many favor helping low-wage workers by providing wage subsidies. One such policy
is the 1993 expansion of the Earned Income Tax Credit which, when implemented in 1996,
provides a 40 percent subsidy to earnings to families with two or more children on earnings up to
about $9,000.
Some policies to compensate the workers displaced by trade have been enacted, but their
effect has been small. Trade Adjustment Assistance was criticized for serving primarily to extend
unemployment benefits and not retraining workers. The special NAFTA program requires
recipients to take up training, but some are wary of accepting benefits because workers obtaining
benefits cannot take an alternative job.
One approach, suggested by Lawrence and Litan (1997), is to complement training
programs with some explicit compensation for the loss of a trade-related job. To compensate
workers for their actual losses—as indicated by the difference between what workers earn in their
78
new jobs and what they earned previously—they propose wage insurance. Under their scheme,
dislocated workers who were in their job for some minimum period (say, two years) would
qualify for half the loss of earnings they may experience after gaining a new job. Compensation
would last for a limited period of two to three years.
This plan raises a number of questions. Would the subsidy extend to workers with high
levels of earnings, say $60,000 before displacement and $40,000 after displacement? If so and if
the percentage earnings reductions in post-displacement jobs does not vary with the initial wage
level, then the size of the subsidy would increase, the higher was the worker’s former earnings.
Perhaps more troubling is the recognition that low-wage workers indirectly affected by trade
might obtain little or no benefits while middle and upper wage workers gain substantial amounts.
Immigration policy is another tool for affecting the relative scarcity of unskilled workers.
Currently, migrants average only slightly less education than native-born workers. However, they
are concentrated at the bottom and the top of the educational distribution. Estimates of their
impact on wage differentials suggest that immigrant inflows are much more important than trade
in lowering the relative wages of high school dropouts. If these estimates are accurate, then
lowering inflows of low-skilled immigrants might improve the relative market position of
residents who did not complete high school.
Globalization is only one factor influencing the low-skilled labor market. In order to
examine policies for assisting low-skill workers, we must take a close look at the market for their
services.
79
VII. The Low-Skilled Labor Market
The low-skilled labor market has changed markedly in the last decades. The returns to
education and other measures of skill grew rapidly between the early 1970s and the early 1990s;
the returns to skill have stabilized since then. The rising return to education has induced two
important supply responses. First, young people have enrolled in college and completed college
degrees at much higher rates. Second, young unskilled men, particularly black men, have
decreased their labor force participation and their hours of work.
While inequality has increased among education groups, it has declined between men and
women and blacks and whites. While evidence of labor market discrimination still exists, much
of the remaining gap in black and white men’s wages can be attributed to their level of skills
before they enter the labor market.
Welfare reform and an expanding economy have pushed 1 million women on TANF into
the labor market; the vast majority of former TANF recipients are low-skilled and have entered
low-wage jobs. In addition, many unskilled immigrants have joined the labor force in several
large American cities.
Despite rising levels of formal education, many adults lack the basic math and reading
skills, work habits, and interpersonal skills that most employers require. Increasingly, those
individuals have become disenfranchised from the market economy.
The future prospects of unskilled workers will depend largely on the education system
and on the willingness of federal and state governments to provide income supplementation in
sensible ways to low-skill workers and their families. Policy makers should focus on preparing
young adults to enter the labor market. Reducing the flow into the low-skilled market both
80
improves the job opportunities of young, better-trained workers and lowers the overall supply of
low-skilled workers, which makes low-skilled adults more scarce. Clearly, the K-12 education
system needs reform if more high school graduates are to obtain the basic math, reading, and
communication skills required by most employers. Given that government training programs
have limited success in increasing basic skills, public policy for adults older than age 25 should
focus on making work pay through wage subsidies or decreases in employment taxes.
The Supply of Low-Skilled Workers: Educational Attainment
One measure of skill is educational attainment. By that measure, the supply of low-skilled
workers has declined since the early 1970s. Typically, analysts categorize high school dropouts
and individuals with a high school degree and no college as low-skilled or medium-skilled
workers.
The most rapid increase in educational attainment in the past twenty-five years has come
from individuals who attended college, but did not complete a degree. In 1971, 44 percent of 25-
to 29 year olds had completed some college; in 1995, 62 percent did. College graduation rates
also rose over the same period, from 22 percent to 28 percent. High school graduation rates,
which were already quite high, increased modestly from 83 to 85 percent of 18 to 24 year olds.
Levels of formal schooling differ widely among ethnic groups. Blacks and Hispanics lag
well behind whites in their levels of college attendance and graduation. In 1995, 65 percent of
whites, 52 percent of blacks, and 50 percent of Hispanics had completed some college. In the
same year, 28 percent of whites, 18 percent of blacks, and 16 percent of Hispanics had completed
a four-year college degree.
81
The black high school graduation rate is only slightly lower than the white rate; in 1995,
85 percent of black youths and 90 percent of white youths had graduated from high school. The
Hispanic high school graduation rate, 63 percent, was much lower than the black or white rates.
Trends in Other Measures of Skill
Formal education is an imperfect measure of skill because individuals with the same level
of formal schooling show vastly different levels of skill on standardized tests (Kilburn and
Lillard, 1997).
Only one time series measure of the skill level of the adult population exists. The General
Social Survey has administered a ten-question vocabulary quiz to its respondents since the early
1970s. Judged on the basis of GSS scores, the vocabulary capabilities of the adult population
have declined over time. While this trend portrays a pessimistic view, the short vocabulary test
provides only limited information on one dimension of skill.
Time series data have been collected on high school students’ performance on two
standardized tests, the SAT and National Assessment of Education Progress (NAEP). Average
student performance on both tests has changed little over the last twenty years. The average SAT
math score dipped slightly in the mid-1970s, but has returned to its early 1970s levels. The
average math score was 509 in 1972 and 511 in 1997. Average SAT verbal scores declined from
530 in 1972 to 509 in 1976, but have remained roughly constant since. In 1997, the average SAT
verbal score was 505 (College Board, 1997).
The National Assessment of Educational Progress (NAEP) has been administered to a
random sample of 17 year-olds enrolled in high school since 1970. Average NAEP science and
math scores declined slightly in the late 1970s and early 1980s, but have since returned to their

82
early 1970s levels. Reading scores have remained roughly constant since 1971, but writing scores
have declined slightly, but not significantly, since 1984 (National Center for Education Statistics,
1997).
Because the population of students taking the SAT and NAEP tests has become more
ethnically and economically diverse, the lack of a trend in test scores can be interpreted as a sign
of modest progress. High schools have succeeded in holding achievement constant while
educating a more diverse group of students. When they complete high school, youths have
roughly the same skills they did 20 years ago. But because college attendance is rising, the
average youth today likely enters the labor market with more skills than youths did in the 1970s.
The 1992 National Adult Literacy Survey provides a snapshot of the math and reading
skills of the US adult population in 1992. The survey found that a substantial minority of adults
have limited basic skills. The survey found that 21 percent of the adult population had only
rudimentary reading, writing, and math skills. Such individuals could not locate an intersection
on a street map or total the costs of a purchase from an order form. Another 25 percent of the
population had the second lowest level of reading, writing, and math skills; they could not
calculate a ten percent discount from a bill using a calculator or use a bus schedule (National
Center for Education Statistics, 1998). Individuals at the lowest two levels of literacy do not have
the skills required by most employers; 66 percent of all jobs require more than the highest two
levels of literacy (Levenson, Reardon, and Schmidt, 1998).
The Demand for Skills
Most analysts agree that today’s employers demand more skills than they did in the past.
Several factors have contributed to the rising demand for skills in the labor market: technological
83
and organizational change, trade, deregulation of key industries, and the decline of unions. Three
types of empirical evidence support the hypothesis that the demand for skills has risen: estimates
of the returns to skill, time series data on the content of a representative samples of jobs, and
evidence from case studies of individual firms or industries.
A large literature has documented that the returns to education have increased at the same
time that the supply of college-educated workers has increased. The data are consistent with an
upward shift in the demand for skill. Since 1973, the average hourly earnings for workers with a
high school degree or less have declined in real terms; male high school dropouts’ wages
declined by 2 percent, and male high school graduates’ wages declined by 1.2 percent. At the
same time, male college graduates’ wages have remained roughly constant in real terms, and men
with graduate degrees experienced a 0.7 percentage point increase in hourly earnings (Burtless,
1998).
There is also evidence consistent with an increase in the returns to cognitive skills.
Murnane, Willett, and Levy (1995) compare the returns to mathematics, reading, and vocabulary
skills across two cohorts of young workers. The first cohort graduated from high school in 1972
and the second cohort graduated in 1980. They find that the returns to cognitive skills were
higher when the 1980 cohort entered the labor market than when the 1972 cohort did.
Individual-level data on workers and their jobs provide direct evidence that workers use
more skills than they did in the past. Using representative samples of workers, Howell and Wolff
(1991) show that between 1960 and 1985 the changing occupational and industrial structure of
the economy has lead to a rising demand for cognitive and interpersonal skills and a decline in
the demand for motor skills. Using data from 94 job titles in 93 manufacturing establishments,
84
Cappelli (1993) finds that manufacturing occupations substantially upgraded their skill
requirements between 1978 and 1986. Clerical jobs showed an even split between jobs that were
upskilled and those that were deskilled; the jobs that were deskilled appear to be associated with
the development of new office equipment. As noted above, in the 1994 National Employer
Survey of establishments, three-fourths of employers reported the skills required to perform
production and support jobs had increased over the prior three years.
Most case studies of particular firms or industries have shown an increase in the skills
used by most workers. However, the differences between industries, occupations, or firms within
a particular industry are substantial.
Evidence from a cross-sectional survey of firms in four large metropolitan areas suggest
there is a substantial gap between the skills than employers require and those that disadvantaged
workers possess. Among jobs that did not require a college education, 70 percent required that
workers deal with customers, 61 percent required that workers read or write paragraphs, 65
percent required arithmetic, and 51 percent required the use of computers. In addition, 71 percent
required a high school diploma and 61 percent required specific vocational experience. Holzer
(1998) finds that 42 percent of black and Hispanic high school dropouts, 24 percent of white high
school dropouts, and 21 percent of female welfare recipients would face very limited job
availability in their cities
Declining Male-Female and Black-White Wage Gap
While wage inequality has grown among education groups, wage differentials have
narrowed between men and women as well as between whites and blacks. Overall, the male-
female wage gap declined from 37.1 percent in 1984 to 23.8 percent in 1995. Over the same
85
period, the wage differential between white and black men declined from 26.7 percent to 18.0
percent, and the wage differential between white and black women declined from 8.7 percent to
6.0 percent (Lerman, 1998).
Much of the remaining difference in hourly earnings for white and black men can be
explained by differences in their level of skills before they enter the labor market (Neal and
Johnson, 1997). US schools tend to be segregated by race, and the schools that black students
attend are worse quality than those that white students attend. In addition, black and other
minority students face discrimination by their teachers in terms of placement into academic
courses. Black and other minority students who do well on standardized tests are much less likely
to be placed in academic high school courses than white students with comparable test scores.
Students placed in non-academic track have less access to college prep math, science, and
English courses that teach the skills demanded by most employers and most colleges.
Changes in Labor Force Participation of Unskilled Men and Women
In response to the declining real wages, unskilled men have witnessed a marked decline
in labor force participation in the last twenty years. Between 1982-1983 and 1987-1989, the labor
force participation rate of men in the first quintile of the wage distribution declined 4 percentage
points, while the labor force participation rate declined 1 percentage point for men in the second
quintile of the wage distribution (Juhn, Murphy, and Topel, 1991). The remainder of the male
wage distribution had virtually no change in their labor force participation rates. Conditional on
working, high school dropouts and high school graduate men are working fewer hours than they
did in the past (Coleman and Pencavel, 1994).
86
The fact that many unskilled men have withdrawn from the labor force may have affected
the composition of families, although causation may run from weak family structure to reduced
labor force activity. In any event, marriage rates are much lower among labor force non-
participants than among other men. Only 46.7 percent of men who are long-term nonparticipants
in the labor force live with their wives. In contrast, 86.1 percent of men who work full-year live
with their wives.
While unskilled men have decreased their labor force participation, unskilled women
have gradually increased their labor force participation since the early 1970s. Within the last four
years, one group of low-skilled women, unmarried mothers, has raised dramatically their
participation in the labor market participation and the trend is likely to continue. As noted above
in the work and family section, the increase in single mothers’ labor market participation was due
in part to a 1996 federal law that placed a lifetime limit on the number of years a family could
receive AFDC benefits.
Welfare reform will play an important role in the future of the unskilled labor market.
Many analysts think that the influx of welfare mothers into the labor market will crowd out men
and immigrants. Others argue that the labor market will be able to absorb welfare mothers by
creating new jobs; studies show that large groups of unskilled immigrants have been fully
absorbed by the labor market with minimal displacement of native born workers.
Within the last four to six years, low-skilled workers, including high school dropouts,
have raised their employment levels substantially. In part, the gains for low-skilled workers are
the result of an economic expansion that has brought unemployment rates to 4.5 percent, a 30
year low. Another likely reason is that the number of dropouts entering the labor force has been

87
entirely offset by high school dropouts leaving the market as older, less-educated workers retire.
As noted above, of the 11.7 million net increase in employment of workers 25 and over, over 90
percent have attended college and over 50 percent have BA degrees. With fewer competitors,
more low-skilled workers have managed to find jobs. In the coming decade, the demographic
shifts will be less favorable for low-skilled workers.
88
References
Allen, Steven G. Technology and The Wage Structure, North Carolina State University andNational Bureau of Economic Research, North Carolina, 1997.
Applebaum, Eileen and Rosemary Batt. The New American Workplace: Transforming WorkSystems in the United States. Ithaca, New York: Cornell University Press, 1994.
Baldwin, Robert E. and Glen G. Cain. "Shifts in US Relative Wages: The Role of Trade,Technology, and Factor Endowments." Discussion Paper 1132-97, Institute for Researchon Poverty, 1997.
Beede, David N. and Kan H. Young. Patterns of Advanced Technology Adoption andManufacturing Performance: Employment Growth, Labor Productivity, and EmployeeEarnings, US Department of Commerce, Washington, DC, 1996.
Bernstein, Jared, and Lawrence Mishel. "Has Wage Inequality Stopped Growing?" MonthlyLabor Review (1997): 3-16.
Bishop, John H. "Is Welfare Reform Succeeding?"1998.
Blau, Francine D. and Ronald Ehrenberg. Gender and Family Issues in the Workplace. NewYork: Russell Sage Foundation, 1997.
Blumberg, Linda J. and David W. Liska. The Uninsured in the United States: A Status Report,The Urban Institute, Washington, DC, 1996.
Bond, James T., Ellen Galinsky, and Jennifer E. Swanberg. "The 1997 National Study of theChanging Workforce." Executive Summary (1998): 1-16.
Borjas, George J., Richard B. Freeman, and Lawrence F. Katz. "How Much Do Immigration andTrade Affect Labor Market Outcomes." Brookings Papers on Economic Activity 1 (1997):1-90.
Bresnaham, Timothy F., Erik Brynjolfsson, and Lorin M. Hitt. How Do Information Technologyand Work Place Organization Affect Labor Demand? Firm-Level Evidence, 1998.
Bresnahan, Timothy F. Computerization and Wage Dispersion: An Analytical Reinterpretation,1997.
Brynjolfsson, Erik and Lorin M. Hitt. Beyond the Productivity Paradox: Computers Are theCatalyst for Bigger Changes, 1998.
———. Information Technology and Organizaational Design: Evidence From Micro Data,1998.
89
Bureau of Economic Analysis. Selected Financial and Operating Data of Nonbank US Affiliatesof Foreign Companies. Country of Ultimate Beneficial Owners and by Industry ofAffiliate, 1996.
Burtless, Gary. Low-Wage Workers in a Globalizing Economy, The Brookings Institute,Washington, DC, 1998.
———. "Technological Change and International Trade: How Well Do They Explain the Rise inUS Income Inequality." The Inequality Paradox: Growth of Income Disparity. James A.Auerbach, and Richard S. Belous (eds.), 60-91. Washington, DC: National PolicyAssociation, 1998.
Campbell, Jay R., Kristin Voelkl, and Patricia Donahue. Report in Brief, NAEP 1996 Trends inAcademic Progress, NCES 97-986. US Department of Education , 1997.
Cappelli, Peter. "Are Skill Requirements Rising? Evidence From Production and Clerical Jobs."Industrial and Labor Relations Review 46, no. 3 (1993): 515-30.
Card, David. Economic Effects on Immigration: Past and Present. New York: The Jerome LevyEconomic Institute of Bard College, 1996.
Cline, William R. Trade and Income Distribution . Washington, DC: Institute of InternationalEconomics, 1997.
Coleman, Mary T. and John Pencavel. "Changes in Work Hours of Male Employees: 1940-1988." Industrial and Labor Relations Review 46, no. 2 (1993): 262-83.
———. "Trends in Market Work Behavior of Women Since 1940." Industrial and LaborRelations Review 46, no. 4 (1993): 653-76.
Collins, Susan M. "Economic Integration and the American Worker: An Overview." ImportsExports, and the American Worker. (ed.) Susan M. Collins, 3-48. Washington, DC: TheBrookings Institution Press, 1998.
Council of Economic Advisers. Economic Report of the President. Washington, DC: USGovernment Printing Office, 1997.
Crowell, Nancy A. and Ethel M. Leeper. America's Fathers and Public Policy, NationalAcademy Press, Washington, DC, 1994.
David, Paul A. "The Dynamo and the Computer: A Historical Perspective on the ModernProductivity Paradox." AEA Papers and Proceedings (1990): 355-61.
DeLong, J. Bradford. "Trade Policy and America's Standard of Living: A Historical Perspective."Imports, Exports, and the American Worker. (ed.) Susan B. Collins , 349-88. Washington,
90
DC: Brookings Institution Press, 1998.
Devine, Theresa J. "Characteristics of Self-Employed Women in the United States." MonthlyLabor Review (1994): 20-34.
DiNardo, John E. and John Steffen Pischke. "The Returns to Computer Use Revisited: HavePencils Changed The Wage Structure Too?" The Quarterly Journal of Economics (1997):291-303.
Employee Benefit Research Institute. "Worker Investment Decisions: An Analysis of Large401(k) Plan Data." EBRI Issue Brief , no. 176 (1996): 1-16.
———. "Can We Save Enough to Retire? Participant Education in Defined Contribution Plans."EBRI Issue Brief, no. 160 (1995): 1-24.
———. "Participant Education: Actions and Outcomes." EBRI Issue Brief, no. 169 (1996): 1-28.
Ettner, Susan L. "The Opportunity Costs of Elder Care." The Journal of Human Resources 31,no. 1 (1995): 189-205.
Families and Work Institute. "Ahead of the Curve: Why America's Leading Employers AreAddressing the Need of New and Expectant Parents." Executive Summary (1998): 9-20.
Family and Work Institute. "Business Work - Lite Study." Executive Summary (1998): 1-16.
Frazis, Harley, Maury Gittleman, Michael Horrigan, and Mary Joyce. "Results From the 1995Survey of Employer-Provided Training." Monthly Labor Review (1998): 3-13.
Freeman, Richard B. "Are Your Wages Set in Beijing?" The Journal of Economic Perspectives 9,no. 3 (1993): 15-23.
———. "Will Globalization Dominate US Labor Market Outcomes?" Imports, Exports, and theAmerican Worker. (ed.) Susan M. Collins, 101-30. Washington, DC: BrookingsInstitution Press, 1998.
Galinsky, Ellen, James T. Bond, and Dana Friedman. "The Role of Employers in Addressing theNeeds of Employed Parents." Journal of Social Issues 52, no. 3 (1996): 111-36.
General Accounting Office. "Employment-Based Health Insurance.", no. GAO/HEHS-97-35(1997).
———. "Health Insurance: Coverage Leads to Increased Health Care Access for Children.", no.GAO/HEHS-98-14 (1997).
———. "Health Insurance for Children.", no. GAO/HEHS-97-105 (1987).
91
Gerson, Kathleen. "A Few Good Men." The American Prospect (1994): 78-90.
Glied, Sherry and Mark Stabile. Graduation to Health Insurance Coverage: 1981-1996,Columbia University, New York, New York, 1998.
Greider, William. One World, Ready or Not: The Manic Logic of Global Capitalism. New York:Simon & Schuster, 1997.
Holzer, Harry J. "Employer Skill Needs and Labor Market Outcomes by Race and Gender."Discussion Paper No. 1087-96, Institute for Research on Poverty, 1996.
Holzer, Harry J., and Sheldon Danziger. "Are Jobs Available for Disadvantaged Workers inUrban Areas?" Discussion Paper No. 1157-98, Institute for Research on Poverty, 1998.
Howell, David R. and Edward Wolff. "Trends in the Growth and Distribution of Skills in the USWorkplace, 1960-1985." Industrial and Labor Relations Review 44, no. 3 (1991): 486-502.
Ichniowski, Casey, Kathryn Shaw, and Giovanna Prennushi. The Effects of Human ResourceManagement Practices on Productivity, National Bureau of Economic Research,Cambridge, MA, 1995.
John, Andrew. "Employment Fluctuations in a Share Economy." Oxford University Press 43(1991): 75-84.
Juhn, Chinhui and Kevin M. Murphy. Wage Inequality and Family Labor Supply, NationalBureau of Economic Research, Cambridge, MA, 1996.
Juhn, Chinhui, Kevin M. Murphy, and Robert H. Topel. "Why Has the Natural Rate ofUnemployment Increased Over Time?" Brookings Papers on Economic Activity (1991:2):75-142.
Kalleberg, Arne L., Edith Rasell, Ken Hudson, David Webster, Barbara Reskin, Naomi Cassirer,and Eileen Applebaum. Nonstandard Work, Substandard Jobs. Washington, DC:Economic Policy Institute, 1997.
Klerman, Jacob A. and Arleen Leibowitz. "The Work-Employment Distinction Among NewMothers." The Journal of Human Resources 29, no. 2: 277-303.
Kniesner, Thomas J. "The Overworked American?" Book Review (1992): 681-88.
Krugman, Paul. "Growing World Trade: Causes and Consequences." Brookings Papers onEconomic Activity , no. 1 (1995): 327-77.
Kuttner, Robert. Everything for Sale: The Virtues and Limits of Markets. New York: Alfred A.Knopf, 1997.
92
Lawrence, Robert Z. Single World, Divided Nations? Washington, DC: Brookings InstitutionPress, 1996.
Lawrence, Robert Z., and Robert E. Litan. “Globaphobia: The Wrong Debate Over TradePolicy.” Brookings Policy Brief, no. 24 (1997).
Lee, Eddy. "Globalization and Employment: Is Anxiety Justified?" Internatioal Labour Review135, no. 5 (1996): 485-97.
Lerman, Robert I. Meritocracy Without Rising Inequality, Urban Institute, 1997.
———. "Reassessing Trends in US Earnings Inequality." Monthly Labor Review (1997): 17-25.
Levenson, Alec R., Elaine Reardon, and Stefanie Schmidt. The Employment Prospect of WelfareRecipients in the Most Populous US Counties: Limited Skills Mean Limited EmploymentOpportunities, 1998.
Lewis, WilliamW., Andreas Siemen, Michael Balay, and Koji Sakate. "Service SectorProductivity and International Competitiveness." The McKinsey Quarterly 2 (1992): 69-91.
National Center for Health Statistics. Divorces and Annulments and Rates: United States, 1940-90. Monthly Vital Statistics Report, 1995.
Olsen, Kelly and Jack VanDerheri. "Defined Contribution Plan Dominance Grows AcrossSectors and Employers Size, While Mega Defined Benefit Plans Remain Strong: WhereWe Are and Where We Are Going." Employee Benefit Research Institute, no. 190 (1997).
Organization for Economic Co-operation and Development. "Employment Outlook." (1998).
Pension Research Council. Forecasting Retirement Needs and Retirement Wealth, The WhartonSchool of the University of Pennsylvania, April 1998, 1998.
Piore, Michael J. "Trade and the Social Structure of Economic Activity." Imports, Exports, andthe American Worker. (ed.) Susan B. Collins, 257-86. Washington, DC: BrookingsInstitution Press, 1998.
Reich, Robert B. and Karen Nussebaum. Care Around the Clock: Developing Child CareResources Before Nine and After Five, US Department of Labor, 1995.
Richardson, J. David. "Income Inequality and Trade: How to Think, What to Conclude." TheJournal of Economic Perspectives 9, no. 3 (1995): 33-56.
Robinson, John P. "How Americans Use Time." The Futurist (1991): 23-27.
Robinson, John P. and Geoffrey Godbey. In Time For Life: The Surprising Ways Americans Use
93
Their Time, Penn State University Press, 1995.
———. "Time for Life: The Surprising Ways Americans Use Their Time." Social Forces 76, no.3 (1997): 1166-68.
Sachs, Jeffrey, and Howard J. Shatz. "International Trade and Wage Inequality in the UnitedStates: Some New Results." Imports, Exports, and the American Worker. (ed.) Susan B.Collins , 215-56. Washington, DC: Brookings Institution Press, 1998.
Samwick, Andrew A., and Jonathan Skinner. "How Will Defined Contribution Pension PlansAffect Retirement Income."1998.
Schor, Juliet B. The Overworked American: The Unexpected Decline of Leisure. New York:Basic Books, 1991.
Schwenk, Albert E. "Difference Among Private Industry Occupational Groups in Pay Levels andTrends." Compensation and Working Conditions (1997): 12-18.
———. "Measuring Trends in the Structure and Level of Employee Compensation."Compensation and Working Conditions (1997): 3-14.
Scott, Robert E., Thea Lee, and John Schmitt. Trading Away Good Jobs: An Examination ofEmployment and Wages in the US 1979-94 , Economic Policy Institute, 1997.
Shellenbarger, Sue. "Companies Are Finding It Really Pays to Be Nice to Employees." The WallStreet Journal, 22 July 1998, sec. Marketplace.
Spalter-Roth, Roberta M., Arne Kalleberg, Edith Rasell, Naomi Cassirer, Barbara Reskin, KenHudson, David Webster, Eileen Applebaum, and Betty Dooley. Managing Work andFamily. Washington, DC: Economic Policy Institute, 1997.
Stone, Deborah. "Work and the Moral Woman." The American Prospect (1997): 78-86.
Summers, Lawrence. "One the Share Economy: Prospects and Problems." Challenges (1986):47-50.
Technical Panel on Trends and Issues in Retirement Savings. Report of the 1994-1996 AdvisoryCouncil on Social Security, Volume II: Reports of the Technical Panel on Trends andIssues in Retirement Savings, Washington, DC, 1997.
US Bureau of the Census. US Government Printing Office, 1998.
US Department of Education. 1992 National Adult Literacy Survey, National Center forEducation Statistics, 1992.
———. Missing Responses to Literacy Tasks, National Center for Education Statistics, 1992.
94
US Department of Labor Women's Bureau. Work and Elder Care: Facts for Caregivers andTheir Employers, No. 98-1. 1998.
Walker, Martha A. C. and Bruce Bergman. "Analyzing Year-to-Year Changes in Empoyer Costsfor Employee Compensation." Compensation and Working Conditions (1998): 17-27.
Weitzman, Martin L. "Comment on Can the Share Economy Conquer Stagflation?" TheQuarterly Journal of Economics 103, no. 1 (1988): 219-23.
Weitzman, Martin L. The Share Economy: Conquering Stagflation. Cambridge, Massachusetts:Harvard University Press, 1984.
Wolman, William, and Anne Colamosca. The Judas Economy: The Triumph of Capital and theBetrayal of Work. Addison-Wesley Publishing Company, 1997.
Wood, Adrian. "How Trade Hurt Unskilled Workers." The Journal of Economic Perspectives 9,no. 3 (1995): 57-80.