Embed Size (px)
Citation preview

Energy &Environmental Sciencewww.rsc.org/ees
ISSN 1754-5692
REVIEW ARTICLEMing Zhao, Paul S. Fennell et al. An overview of advances in biomass gasification
Volume 9 Number 10 October 2016 Pages 2927–3304

This journal is©The Royal Society of Chemistry 2016 Energy Environ. Sci., 2016, 9, 2939--2977 | 2939
Cite this: Energy Environ. Sci.,
2016, 9, 2939
An overview of advances in biomass gasification
Vineet Singh Sikarwar,a Ming Zhao,*abc Peter Clough,d Joseph Yao,d Xia Zhong,e
Mohammad Zaki Memon,a Nilay Shah,d Edward J. Anthonyf and Paul S. Fennell*d
Biomass gasification is a widely used thermochemical process for obtaining products with more value and
potential applications than the raw material itself. Cutting-edge, innovative and economical gasification
techniques with high efficiencies are a prerequisite for the development of this technology. This paper
delivers an assessment on the fundamentals such as feedstock types, the impact of different operating
parameters, tar formation and cracking, and modelling approaches for biomass gasification. Furthermore,
the authors comparatively discuss various conventional mechanisms for gasification as well as recent
advances in biomass gasification. Unique gasifiers along with multi-generation strategies are discussed as a
means to promote this technology into alternative applications, which require higher flexibility and greater
efficiency. A strategy to improve the feasibility and sustainability of biomass gasification is via technological
advancement and the minimization of socio-environmental effects. This paper sheds light on diverse areas
of biomass gasification as a potentially sustainable and environmentally friendly technology.
Broader contextBiomass energy is one of the most widely explored research fields in energy and environmental science. The major driver for biomass gasification research is toexploit low-cost feedstocks, to increase process efficiency, decrease installation and operational costs and socio-environmental effects. This work gives a holisticview of current research, development and deployment, and how we could move forward towards economically and socially acceptable biomass gasificationtechnologies. We elucidate various areas and compare various conventional gasification technologies, current developments, and challenges to advancegasification as a viable and environmentally sustainable technology for using renewable fuel resources.
1. Introduction
Alterations to the climate due to temperature rise caused by thegreenhouse effect pose a risk to humanity, and other species.Greenhouse gas (GHG) emissions from anthropogenic activitiessuch as the burning of fossil fuels for power generation are majorcontributors to climate change. This necessitates a switch fromconventional to renewable power sources, for example, solarphotovoltaic (PV), wind, biomass and hydroelectric generation.
Biomass utilization has an advantage over other renewablesources as it is less dependent on location and climate andbiomass is easily storable and transportable. In addition, it isabundantly available, currently provides more than 10% of theglobal energy supply, and ranks among the top four energysources in terms of world final energy consumption in 2011.1–3
Rural areas in underdeveloped nations are dependent uponbiomass for essential activities such as cooking and heating.India has substantial coal reserves of around 223 billion tonnes,but these are concentrated in specific locations (central andeastern India) unlike biomass, which is evenly and extensivelyspread over the whole nation.4,5 Furthermore, waste biomass isoften more readily available and can be equally as useful as alow-cost fuel. This makes it viable and promising as an energysource. Developed countries are also focusing on biomass as asustainable energy option since it is abundant and has a lowerenvironmental impact compared to fossil fuels.
An interesting account of global gasification history can befound in the National Energy Technology Laboratory, USA data-base and investigation performed by Rajvanshi.6,7 The earliestresearch on gasification was done by Thomas Shirley in 1659.
a School of Environment, Tsinghua University, Beijing 100084, China.
E-mail: [email protected]; Tel: +86 10 62784701b Key Laboratory for Solid Waste Management and Environment Safety,
Ministry of Education, Beijing 100084, Chinac Collaborative Innovation Center for Regional Environmental Quality,
Tsinghua University, Beijing 100084, Chinad Department of Chemical Engineering, Imperial College London, South Kensington,
London, SW7 2AZ, UK. E-mail: [email protected];
Tel: +44 (0)20 7594 6637e School of Chemical & Biomolecular Engineering, The University of Sydney,
Sydney NSW 2006, Australiaf Cranfield University, Cranfield, Bedfordshire MK43 0AL, UK
Received 30th March 2016,Accepted 2nd June 2016
DOI: 10.1039/c6ee00935b
www.rsc.org/ees
Energy &EnvironmentalScience
REVIEW
Ope
n A
cces
s A
rtic
le. P
ublis
hed
on 0
2 Ju
ne 2
016.
Dow
nloa
ded
on 1
4/12
/201
7 15
:54:
47.
Thi
s ar
ticle
is li
cens
ed u
nder
a C
reat
ive
Com
mon
s A
ttrib
utio
n-N
onC
omm
erci
al 3
.0 U
npor
ted
Lic
ence
.
View Article OnlineView Journal | View Issue

2940 | Energy Environ. Sci., 2016, 9, 2939--2977 This journal is©The Royal Society of Chemistry 2016
His investigation led to the production of carbureted hydrogen,presently known as methane. In 1739, Dean Clayton moved astep forward and distilled coal in a closed vessel. The earliestpatents in gasification were acquired by Robert Gardner and
John Barber in the years 1788 and 1791 respectively. RobertGardner investigated the usage of waste thermal energy offurnaces to generate steam by burning the products in a boiler.John Barber’s patent was about the usage of producer gas to
Vineet Singh Sikarwar
Vineet Singh Sikarwar is a PhDresearcher working in the Labora-tory for Biomass Energy & CCSTechnologies, School of Environ-ment, Tsinghua University for thepast 2 years. He is workingon experimental and theoreticalinvestigations of biomass gasifica-tion with CO2 capture under thesupervision of Dr Ming Zhao. Hehas pursued his Bachelor’s andMaster’s degrees in MechanicalEngineering from Rajiv GandhiTechnical University India withfocus on Renewable Energy Systems.
Ming Zhao
Ming Zhao is an associate professorin the School of Environment atTsinghua University. He obtainedhis PhD in Chemical Engineeringfrom the University of Sydney in2010. He was elected into China’sRecruitment Program of GlobalYouth Experts (The NationalYouth 1000–Talent Program) afterhe completed his work at ImperialCollege London in 2014. He is nowthe director of the Laboratory forBiomass Energy & CCS Technolo-gies. The research interests of his
group include thermo-chemical conversion of solid fuels (e.g. coal andbiomass) into clean energy and value-added chemicals, advancedmaterials and processes for CO2 capture, modelling study for fuelprocessing, waste-to-energy and CCS processes, and LCA-based techno-economic assessment towards commercialization.
Nilay Shah
Nilay Shah is the Director of theCentre for Process SystemsEngineering (CPSE) and co-directorof the Urban Energy Systems projectat Imperial College London. Hisresearch interests include theapplication of process modellingand mathematical/systems engineer-ing techniques to analyze andoptimize complex, spatially- andtemporally-explicit low-carbonenergy systems, including hydrogeninfrastructures, carbon capture andstorage systems, urban energy
systems and bioenergy systems. He is also interested in devisingprocess systems engineering methods for complex systems such aslarge scale supply chains and bio-renewable processes, and in theapplication of model-based methods for plant safety assessment andrisk analysis. He has published widely in these areas and is particularlyinterested in the transfer of technology from academia to industry.
Edward J. Anthony
Dr Anthony is the head of theCombustion and Carbon Captureand Storage Centre at CranfieldUniversity and a Professor inEnergy Process Systems. Previouslyhe was a senior research scientistwith Natural Resources Canada,where he headed the Gasificationand Fluidized Bed CombustionGroup. His interests includethermal energy processes that canoffer pure CO2 streams forsequestration, and gasificationtechnology, both in its high-
pressure and atmospheric forms. Dr Anthony is the author of 215+journal papers on various aspects of combustion and gasification,along with a similar number of conference papers, 13 book chapters,and he is the co-editor of the first book on Pressurized Fluidized Bedsand a new book with Dr Paul Fennel on Ca and Chemical Looping. DrAnthony’s current R&D pursuits are strongly focused on calciumlooping cycles, oxy-fired CFBC technology and pressurized,entrained-flow gasification and lime-based chemistry. Dr Anthonywas an adjunct Professor with the Chemical Engineering Departmentat the University of Ottawa from 2005 to 2013, and is a guest Professorwith Southeast University in Nanjing, China and a visiting Professor atImperial College. He is also a Fellow of the Institution of ChemicalEngineers, the Royal Society of Chemistry and the Institute of Energyand he is a Chartered Scientist, and a Chartered Engineer.
Review Energy & Environmental Science
Ope
n A
cces
s A
rtic
le. P
ublis
hed
on 0
2 Ju
ne 2
016.
Dow
nloa
ded
on 1
4/12
/201
7 15
:54:
47.
Thi
s ar
ticle
is li
cens
ed u
nder
a C
reat
ive
Com
mon
s A
ttrib
utio
n-N
onC
omm
erci
al 3
.0 U
npor
ted
Lic
ence
.View Article Online

This journal is©The Royal Society of Chemistry 2016 Energy Environ. Sci., 2016, 9, 2939--2977 | 2941
run an internal combustion (IC) engine. However, the firstconfirmed application of producer gas from coal was reportedin 1792 when William Murdoch produced gas from coal to lighthis residence. The 19th century saw the exploitation of thewater–gas shift reaction in 1801 by Fourcroy, and installationof the first successful gasifier unit, the Siemens gasifier, in1861. The 20th century witnessed groundbreaking develop-ment. Fully continuous gasification using cryogenic separationof air was contrived by Carl Linde in 1920. This was followedby the development of the fluidized bed gasifier (FBG) in 1926and the pressurized moving bed process in 1931. These werestepping stones in the biomass gasification (BG) arena, whichled to the establishment of the first commercial gasificationplant in the US in December 1999. This was a coal gasificationplant known as the Wabash River Coal Gasification Project.8
Post 2001, biomass gasification has increasingly come underthe spotlight, on account of rising oil prices and concerns overclimate change. This led to the expansion of more advancedbiomass gasification projects around the world.9–12
Biomass gasification has a high potential for applicationin waste processing compared to other existing techniquessuch as land-fill, incineration, etc., because it can accept a widevariety of inputs and multiple useful products can be produced.Biomass gasification is an intricate process involving drying thefeedstock followed by pyrolysis, partial combustion of inter-mediates, and finally gasification of the resulting products. It isperformed in the presence of a gasifying media which can beair, oxygen (O2), steam (H2O) or carbon dioxide (CO2), inside areactor called a gasifier. The calorific value of the product gas isdependent on the gasifying agent. The product gas from airgasification gives a heating value of around 4–7 MJ Nm�3
whereas when gasifying utilizing pure O2, the heating value canbe as much as 12–28 MJ Nm�1.13 Biomass gasification reducesthe carbon-to-hydrogen (C/H) mass ratio resulting in increasedcalorific content of the product on account of enhancedH2 fraction.14 The gasifying medium also plays a vital role of
converting solid char and heavy hydrocarbons (HC) to low-molecular-weight gases such as carbon monoxide (CO) and H2.The quality and properties of the product are dependent on thefeedstock material, gasifying agent, feedstock dimensions,temperature and pressure inside the reactor, design of reactorand the presence of catalyst and sorbent.15
There are many useful products from the gasification ofbiomass, which include: syngas, heat, power, bio-fuels, fertilizerand bio-char. Syngas can be further processed by means of theFischer–Tropsch process into methanol, dimethyl ether andother chemical feedstocks. Generally, biomass feedstocks areclassified into four main groups: woody biomass, herbaceousbiomass, marine biomass and manures.16 The gasifier is usuallydesigned to generate a given product; however, the feedstockmaterial is an important parameter to specify and optimizewhere possible.
Tar formation during biomass gasification is a serious problem.Tar is a thick and viscous liquid containing heavy aromatichydrocarbons and often a high content of heavy metals.17 It hasthe potential to cause operational issues through downstreamblockage and quality degradation of product gas. Furthermore, tarsare never the desired product and thus the efficiency of productionis reduced. Tar can be reduced by thermal cracking, steamreforming, dry reforming, carbon formation and partial oxidationas presented in reactions (1), (2), (3), (4) and (5), respectively.
pCnHx # qCmHy + rH2 (1)
CnHx + mH2O # nCO + (m + x/2)H2 (2)
CnHx + nCO2 # 2nCO + (x/2)H2 (3)
CnHx # nC + (x/2)H2 (4)
CnHx + (n/2)O2 # nCO + (x/2)H2 (5)
In the above series of reactions, CnHx represents tar, which isthe combination of numerous organic compounds, and CmHy
represents a lighter HC compared to CnHx.18 The work presentedhere also reviews various research related to the formation,quantification, growth and minimization of tar production.
The goal of this review is to assess conventional and advancedbiomass gasification technologies. In the next section we compareconventional and emerging designs to characterize the current stateof the art and classify encouraging novel technologies. In Section 3,we discuss feedstocks and the effects of feedstock properties onsystem performance. Section 4 explains the influence of variousoperating parameters on the gasification process and Section 5discusses various dimensions of tar formation, measurement andminimization. It is followed, in Section 6, by discussion of variousmulti-generation approaches, including potential barriers. Thispaper also sheds light on the various mathematical modellingtechniques such as thermodynamic modelling, kinetic modelling,computational fluid dynamics (CFD), artificial neural networkmodelling (ANN), and their associated limitations, along with tarmodels. The social and environmental impact of biomass gasifica-tion (hereafter BG) is also discussed in the last section.
Paul S. Fennell
Paul Fennell is a Reader in CleanEnergy at Imperial CollegeLondon. He obtained his degreein Chemical Engineering andPhD from the University ofCambridge. He chaired theInstitution of Chemical EngineersEnergy Conversion subject panel(2014–2016), and has acted as anadvisor for numerous UK govern-ment departments. He is the jointdirector of IC’s Centre for CarbonCapture and Storage and is theResearch Area Champion for
Industrial CO2 Capture and Storage for the UK CO2 Capture andStorage Research Centre. He has published 50+ papers since 2005and is the 2015 winner of the IChemE Ambassador prize.
Energy & Environmental Science Review
Ope
n A
cces
s A
rtic
le. P
ublis
hed
on 0
2 Ju
ne 2
016.
Dow
nloa
ded
on 1
4/12
/201
7 15
:54:
47.
Thi
s ar
ticle
is li
cens
ed u
nder
a C
reat
ive
Com
mon
s A
ttrib
utio
n-N
onC
omm
erci
al 3
.0 U
npor
ted
Lic
ence
.View Article Online

2942 | Energy Environ. Sci., 2016, 9, 2939--2977 This journal is©The Royal Society of Chemistry 2016
2. Biomass gasification – conventionalvs. emerging
Over the past decade, biomass gasification has been developedto utilize wastes and to obtain useful products such as syngas,H2, methane (CH4) and chemical feedstocks. These gases canadditionally be produced from biomass through biochemicalroutes. Thermochemical pathways have an edge over the otherroutes, as commercialized biochemical processes currently haveissues treating biomass rich in lignocellulose9 (importantly, newmethods to valorize lignocellulosic biofuels are under develop-ment, but currently are not commercialized at full scale, e.g. theionosolv19 and organosolv20 treatment methods). In addition,they operate in batch mode, are relatively slow and produce adilute product stream, with large amounts of water recirculatingin the processes. The thermochemical route also has the advan-tage of being able to accommodate a more diverse range ofbiomass.21 Moreover, it has a higher efficiency and a lowercost.22 One of the main limitations with this process is the smallrange of products.21,22
The most commonly used gasifiers are fixed bed gasifiers(FXBG), fluidized bed gasifiers (FBG) and entrained flow gasifiers(EFG). These are shown in Fig. 1(a), (b), 2 and 3, respectively. Thedifference between updraft and downdraft is shown in Fig. 1(c).Briefly, a fixed-bed gasifier can be either updraft (fuel entersfrom the top, gasifying agent from the bottom) or downdraft(both fuel and gasification agent enter from the top), with thefuel coming in from a lock-hopper. In updraft gasification, thechar at the bottom of the bed meets the gasifying agent first, andcomplete combustion occurs, producing H2O and CO2 andraising the temperature to B1000 1C. The hot gases percolateupwards through the bed, driving endothermic reactions withunreacted char to form H2 and CO, with consequent coolingto B750 1C. The gases pyrolyze the dry biomass which isdescending, and also (near the top of the reactor) dry theincoming biomass. Updraft gasifiers typically produce between10 and 20 wt% tar in the produced gas, which is far too high formany advanced applications.10
The allowable tar levels depend on the downstream application.These are around 0.05 g Nm�3, 0.005 g Nm�3 and 0.001 g Nm�3
for gas engines, gas turbines and fuel cells, respectively.23 Incontrast to an updraft gasifier, in a downdraft gasifier (closedtop) the gas flows co-currently with the fuel. A ‘‘throated’’ gasiferhas a restriction part-way down the gasifier where air or O2 isadded, and where the temperature rises to 1200–1400 1C, and thefuel feedstock is either burned or pyrolyzes. The combustion gasesthen pass down over the hot char at the bottom of the bed,where they are reduced to H2 and CO. The high temperaturewithin the throat ensures that the tars formed during pyrolysisare significantly cracked (homogeneous cracking), with furthercracking occurring as the gas meets the hot char on the wayout of the bed (heterogeneous cracking), leading to a less tarryoff-gas. Some disadvantages of a throated gasifier are:9
� The constriction at the throat affects the types of biomassthat can be successfully gasified.� A low moisture content is required (o25 wt%).
� Ash and dust are significantly present in the exhaust.� Tar can still be up to 5 g Nm�3, needing further clean-up.Another interesting and efficient design for fixed bed was
devised by the scientists of the Indian Institute of Science.24–27
This open top fixed bed reactor has been found to be moreefficient and reliable especially with high moisture contentfeedstock and produces a high quality gas with low tar content.
Fig. 1 (a) Schematic diagram of conventional fixed bed gasifier (down-draft).28 (b) Open-top gasifier (downdraft).27 (c) Difference betweenupdraft and downdraft fixed bed gasifiers.
Review Energy & Environmental Science
Ope
n A
cces
s A
rtic
le. P
ublis
hed
on 0
2 Ju
ne 2
016.
Dow
nloa
ded
on 1
4/12
/201
7 15
:54:
47.
Thi
s ar
ticle
is li
cens
ed u
nder
a C
reat
ive
Com
mon
s A
ttrib
utio
n-N
onC
omm
erci
al 3
.0 U
npor
ted
Lic
ence
.View Article Online

This journal is©The Royal Society of Chemistry 2016 Energy Environ. Sci., 2016, 9, 2939--2977 | 2943
The gasifier consists of a vertical tube with an open top andwater seal at the bottom, as depicted in Fig. 1(b). The top thirdof the reactor is made of stainless steel, with an annular jacketaround it. The remaining lower part is made of ceramicmaterial to avoid high-temperature corrosion (4600 1C) causedby the different gases prevailing at that point in the gasifier.The hot combustible gases produced are taken to the upperannulus of the gasifier via a grate and an insulated pipe. Thesegases transfer the heat to the feedstock, aid in drying andenhance the thermal efficiency of the process. A re-circulatingduct connects the upper annular part of the gasifier to the lowerpart and is insulated with alumino-silicate blankets. Constanthomogeneous air flow through the bed resulting in a final fuel-
rich state enhances the gasifier performance. Furthermore, asuperior quality syngas with lower tar content is obtained onaccount of gas movement through a deep hot bed of charcoal.27
Currently, there are more than 40 combined heat and power(CHP) plants based on this design operating worldwide.24
Fluidized bed gasifiers come in three basic types:’ Bubbling fluidized bed (BFB): here, the biomass is fed
from the side, and/or below the bottom of the bed, and thegasifying agent’s velocity is controlled so that it is just greaterthan the minimum fluidization velocity of the bed material.The product gas exits from the top of the gasifier and ashis either removed from the bottom or from the product gasusing a cyclone.
Fig. 2 Schematic diagram of a conventional fluidized bed gasifier (circulating).28
Fig. 3 Schematic diagram of an entrained flow gasifier (side-fed).28
Energy & Environmental Science Review
Ope
n A
cces
s A
rtic
le. P
ublis
hed
on 0
2 Ju
ne 2
016.
Dow
nloa
ded
on 1
4/12
/201
7 15
:54:
47.
Thi
s ar
ticle
is li
cens
ed u
nder
a C
reat
ive
Com
mon
s A
ttrib
utio
n-N
onC
omm
erci
al 3
.0 U
npor
ted
Lic
ence
.View Article Online

2944 | Energy Environ. Sci., 2016, 9, 2939--2977 This journal is©The Royal Society of Chemistry 2016
’ Circulating fluidized bed (CFB) systems use two inte-grated units. In the first unit (the riser) the bed material is keptfluidized by the gasifying agent, with a higher velocity than thatfound in a BFB. This allows the bed material to be fluidized to agreater extent than in the BFB and the overall residence time ishigher, due to the circulation, which is effected by passing theproduct gas and entrained bed material through a cyclonewhich separates the product gas from the bed material whichis recirculated back to the riser.
’ Dual fluidized bed (DFB) gasifiers separate the gasifica-tion and the combustion parts of the process using twoseparate fluidized beds. The biomass is fed into the base ofthe gasifier bed, usually fluidized by steam. The second bedacts as a char combustor using air in a fast fluidized bed whichheats the bed material. The bed material acts as the heattransfer medium between beds and this avoids gas transfer,allowing a nitrogen-free syngas to be produced; the bed materialis separated from the combustion flue gases in a cyclone andrecirculated to the gasifier.
Entrained flow gasifiers are highly efficient and useful forlarge-scale gasification, and are commonly employed for coal,biomass and refinery residues. Their requirement for highlypulverized fuel particles presents problems when gasifyingbiomass. On the other hand, gasification in these gasifiers isabove 1000 1C which aids in cracking tar; they are thereforeadvantageous for biomass gasification where tar is a seriousissue. They are basically classified in two families:
’ Top-fed gasifier: these are vertical reactors of cylindricalshape where finely refined particles of fuel and gasifying agentare fed from the top end in the form of a jet. An inverted burnerresults in their combustion followed by gasification. Productgas is taken out from the side of the lower section whereas slagis deposited at the bottom of the reactor.
’ Side-fed gasifier: here, pulverized fuel and the gasifyingagent are fed through nozzles present in the lower part of thereactor. This design results in appropriate mixing of fuel andoxygen. The product gas is collected from the top and the slagfrom the bottom of the vessel.
Other important issues that process designs need to dealwith are slagging, fouling and corrosion. These issues arise outof the inorganic species present in the biomass and are, there-fore, dependent to a large part on the biomass composition.Corrosion can occur from the generation of acid gases in thegasification process, which in turn have their origin in speciessuch as sulphur and chlorine. Corrosion concerns may requiretemperature management (e.g., rapid cooling of the syngaswhile maintaining it above the acid dew points), active main-tenance strategies or attention to materials of construction orcoatings. Slagging and fouling are dependent on the ashcontent of the biomass, and the propensity for these problemsis also related to the alkali metal content of the biomass, asexplained in Section 3.1.
Among advanced approaches is the concept of unique gasifierswhich integrate biomass gasification, a pollutant removal process,and gas conditioning within a single reactor. This reducesspace requirements resulting in lower investment costs.29
An analysis of other strategies such as multistage gasification,pyrolysis and gasification at different locations, supercriticalwater gasification (SCWG) and plasma gasification30 are alsopresented in this section of the review.
2.1 Conventional approaches
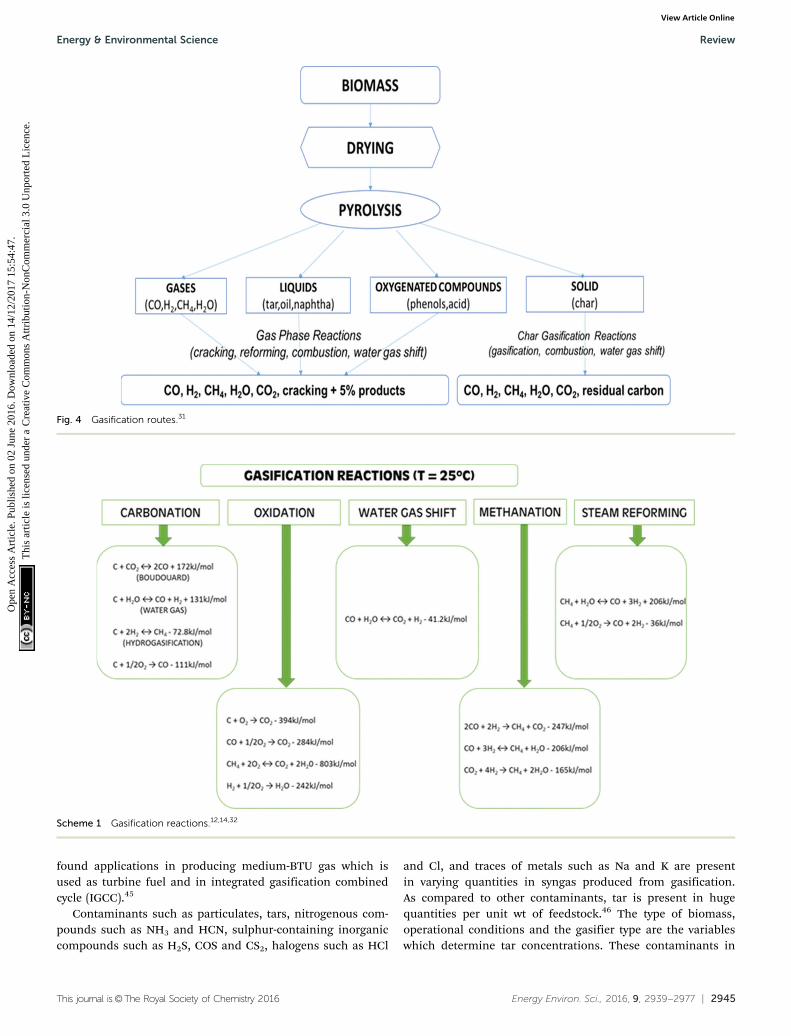
Biomass gasification consists of many overlapping processes:drying, pyrolysis and partial oxidation. The feasible gasificationroutes are shown in Fig. 4. Pyrolysis is the process of producingsolid, liquid or gaseous fuels or valuable chemicals by trans-forming biomass in an O2-deficient environment. The processcan be categorized as mild pyrolysis, slow pyrolysis or as fastpyrolysis. A very simple way of representing the gasificationreaction is shown below (6):
Biomass - H2 + CO + CO2(g) + HC(g) + Tar(l) + Char(s)
(6)
Fast pyrolysis is considered to be an efficient thermochemicalroute to transform biomass into liquid fuel, followed by partialoxidation and subsequent gasification to yield the desiredproducts. Elevated temperatures, high heating rates and longvolatile stage residence times are vital for syngas or H2 produc-tion.35 Since the liquid yield through fast pyrolysis is high, thegaseous yield is reduced. This approach does not allow theproduction directly of usable fuels (or feedstock for blending),but produces pyrolytic oils requiring further upgrading owing totheir high acidity. Gasification is an alternative thermo-chemicalroute to treat biomass, which reduces these limitations. Thedifferent stages of gasification are depicted in Scheme 1.
Steam gasification is an efficient and established method forH2 production.36,37 The char and tar production is small sincethe steam transforms them to CO and H2 through gasification,water–gas shift and reforming reactions. Several researchers38–41
have established that the H2 yield through steam BG is threetimes higher than the yield from air BG. They have alsoreported an improvement in cost-effectiveness with higher H2
production while using steam as the medium in gasification.Aravind et al.42,43 state that gas cleaning is a vital step betweengas production in the gasifier and gas utilization. The outlet gasexiting the biomass gasification system is contaminated withtar, alkali metals, particulate matter, nitrogen (N2), sulphur (S),and chlorine (Cl). Table 1 shows the issues caused by thesecontaminants and methods to eliminate them.
2.1.1 Applications of syngas. Syngas is one of the keyproducts of biomass gasification and is a blend of CO andH2. Syngas is a vital source of environmentally benign fuels andchemicals. Moreover, it is a suitable fuel for the productionof electricity. Employing the Fischer Tropsch (FT) process,gasoline, diesel and other chemicals can be manufactured.44
Syngas can be readily converted to methanol or DME, which inturn can be transformed to gasoline in the presence of zeolites,or methyl tertiary butyl ethylene (MTBE) in the presence ofisobutylene. Hydrogen is produced from syngas, employing thewater gas shift reaction, which has numerous applicationsincluding in fuel cells. SNG (synthetic natural gas, CH4) is alsoone of the significant uses of syngas. Synthesis gas has also
Review Energy & Environmental Science
Ope
n A
cces
s A
rtic
le. P
ublis
hed
on 0
2 Ju
ne 2
016.
Dow
nloa
ded
on 1
4/12
/201
7 15
:54:
47.
Thi
s ar
ticle
is li
cens
ed u
nder
a C
reat
ive
Com
mon
s A
ttrib
utio
n-N
onC
omm
erci
al 3
.0 U
npor
ted
Lic
ence
.View Article Online
This journal is©The Royal Society of Chemistry 2016 Energy Environ. Sci., 2016, 9, 2939--2977 | 2945
found applications in producing medium-BTU gas which isused as turbine fuel and in integrated gasification combinedcycle (IGCC).45
Contaminants such as particulates, tars, nitrogenous com-pounds such as NH3 and HCN, sulphur-containing inorganiccompounds such as H2S, COS and CS2, halogens such as HCl
and Cl, and traces of metals such as Na and K are presentin varying quantities in syngas produced from gasification.As compared to other contaminants, tar is present in hugequantities per unit wt of feedstock.46 The type of biomass,operational conditions and the gasifier type are the variableswhich determine tar concentrations. These contaminants in
Scheme 1 Gasification reactions.12,14,32
Fig. 4 Gasification routes.31
Energy & Environmental Science Review
Ope
n A
cces
s A
rtic
le. P
ublis
hed
on 0
2 Ju
ne 2
016.
Dow
nloa
ded
on 1
4/12
/201
7 15
:54:
47.
Thi
s ar
ticle
is li
cens
ed u
nder
a C
reat
ive
Com
mon
s A
ttrib
utio
n-N
onC
omm
erci
al 3
.0 U
npor
ted
Lic
ence
.View Article Online
2946 | Energy Environ. Sci., 2016, 9, 2939--2977 This journal is©The Royal Society of Chemistry 2016
syngas pose numerous technical and working problems. Forexample, H2S is responsible for equipment corrosion, tar causesfouling and catalyst deactivation occurs due to tar, H2S, NH3,HCl and trace metals.47–49 The maximum permissible limits ofcontaminants, for various applications, present in syngas frombiomass gasification are depicted in Table 2.
2.2 Emerging approaches
Currently, in biomass gasification plants, clean gas is producedat ambient temperature after filtration and scrubbing, limitingits applications. The reduction in gas temperature owing tocleaning followed by conditioning reduces the overall profit-ability of the plant (although the syngas cooling step generateshigh-quality steam which can be of use elsewhere in the processor exported depending on the setup). Moreover, if the tarseparation is not very effective, the gas quality and yield willsuffer, making it unfit for applications where high levels ofpurity are essential. Therefore, gas conditioning preceded byclean-up at elevated temperatures (i.e., ‘‘hot gas cleanup’’,HGCU) is necessary, to ensure high efficiency in industrialapplications, especially in the case of steam gasification. Anexample is NETL’s sorbent-based cleanup process.50 Progressin catalysts, sorbents and filtration techniques operating athigh temperatures have paved a way to integrate gasificationand gas clean-up in one reactor. Unique gasification technologyinvestigated by research and development (R&D) establishmentsand industries in Europe and the US has made it possible to haveimmediate and efficient conversion of the outlet gas. They areused in fuel cells and micro gas turbines along with powerplants.3 An example of a novel HGCU process is the use ofplasma torches to crack tars; this differs from plasma gasifica-tion where the plasma is used for energy generation by gasifyingbiomass, MSW and refuse derived fuel (RDF).51,52 Relevantfeatures, advantages and limitations of these technologies arepresented in Table 3.
2.2.1 Combination of gasification and gas clean-up in onereactor. The unique strategy to unite biomass gasificationwith product gas clean-up followed by conditioning has beenthoroughly examined by joint R&D projects and also throughindustrial testing campaigns and a more detailed analysisof this technology and its early history can be found in thetwo volume series on Plasma assisted combustion edited byMatveev.53,54 In chapter 7, of volume 2 of the two books,Hrabovsky, explores the use of plasma gasification for organicwaste and biomass. In particular, the technology is recom-mended if high quality and high syngas heating values arerequired. Particle and tar removal is done by employing catalyticfilter elements in the freeboard of the FBG as shown in Fig. 5. Theentire arrangement for gas conditioning is incorporated insidethe gasifier to simplify the design, making it more compact,along with reduction in thermal losses and plant space. As thereis no cooling step, thermal efficiency is retained, with no particlecapture in the outlet gas, along with enhanced catalyst andsorbent activities. Consequently, conventional primary fuel gastreatment followed by secondary curing are integrated. Thisminimizes catalyst clogging and loss of thermal energy.
The presence of tars is considered the most inconvenientproblem to deal with, especially while operating large-scale BGsystems. Traditionally, steam reforming at elevated tempera-tures is employed as the solution.55,56 A FBG with low-cost bedmaterial which can also act as catalyst to reduce the requisitetemperature for tar cracking in the presence of steam is a viablealternative.55,56 The catalyst not only has a strong selectivity forthe desired gas product, but it also has a high resistance toattrition and carbon deposition. A detailed discussion on tarabatement is given in Section 5.3 in this paper.
A very large volume of research has been conducted usingdolomite and/or olivine as the catalyst bed material for thecatalytic tar cracking. Calcined dolomite (CaMg(CO3)2), lime-stone (CaCO3) and magnesite (MgCO3) are reported to enhanceH2 yield.57–61 Rapagna et al.,13 Corella et al.62 and Devi et al.63
demonstrated that dolomite shows a higher reactivity forBG towards tar reforming compared to olivine, but it is moresusceptible to attrition. Nickel-based (Ni) catalysts suffer frommechanical instability, rapid deactivation in the presence of S,alkali metals and Cl, and sintering. On the other hand theyallow the system to achieve higher H2 yields.64 Interestingly,it has been reported that when olivine was impregnated withNi, the aforementioned issues with Ni-based catalysts werealleviated substantially.56,65,66 Olivine impregnated with iron(Fe) has also been tested. The results showed different catalyticmechanisms which were dependent on the extent of integration
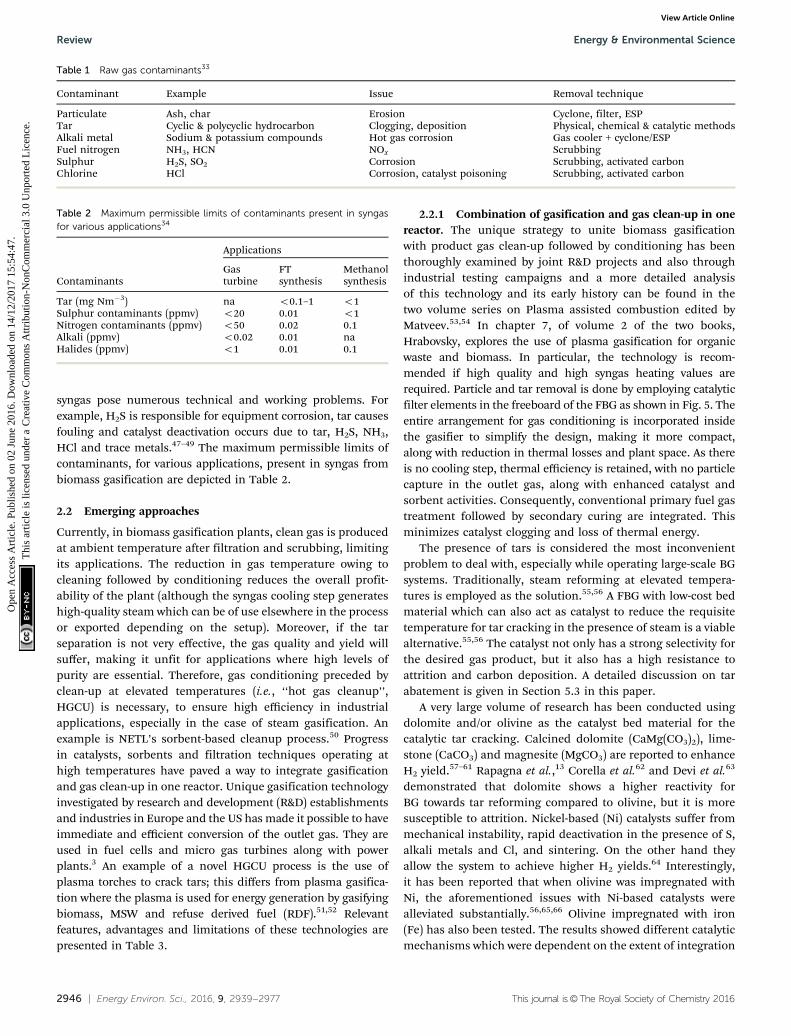
Table 1 Raw gas contaminants33
Contaminant Example Issue Removal technique
Particulate Ash, char Erosion Cyclone, filter, ESPTar Cyclic & polycyclic hydrocarbon Clogging, deposition Physical, chemical & catalytic methodsAlkali metal Sodium & potassium compounds Hot gas corrosion Gas cooler + cyclone/ESPFuel nitrogen NH3, HCN NOx ScrubbingSulphur H2S, SO2 Corrosion Scrubbing, activated carbonChlorine HCl Corrosion, catalyst poisoning Scrubbing, activated carbon
Table 2 Maximum permissible limits of contaminants present in syngasfor various applications34
Contaminants
Applications
Gasturbine
FTsynthesis
Methanolsynthesis
Tar (mg Nm�3) na o0.1–1 o1Sulphur contaminants (ppmv) o20 0.01 o1Nitrogen contaminants (ppmv) o50 0.02 0.1Alkali (ppmv) o0.02 0.01 naHalides (ppmv) o1 0.01 0.1
Review Energy & Environmental Science
Ope
n A
cces
s A
rtic
le. P
ublis
hed
on 0
2 Ju
ne 2
016.
Dow
nloa
ded
on 1
4/12
/201
7 15
:54:
47.
Thi
s ar
ticle
is li
cens
ed u
nder
a C
reat
ive
Com
mon
s A
ttrib
utio
n-N
onC
omm
erci
al 3
.0 U
npor
ted
Lic
ence
.View Article Online

This journal is©The Royal Society of Chemistry 2016 Energy Environ. Sci., 2016, 9, 2939--2977 | 2947
Tab
le3
Feat
ure
s,ad
van
tag
es
and
limit
atio
ns
of
em
erg
ing
tech
no
log
ies
inb
iom
ass
gas
ifica
tio
n
Stra
tegy
empl
oyed
Feat
ure
sA
dva
nta
ges
Lim
itat
ion
s
Com
bin
atio
nof
gasi
fica
tion
and
gas
clea
n-u
pin
one
reac
tor
Inte
grat
ion
ofga
sifi
cati
onof
biom
ass
feed
stoc
kan
dsy
nga
scl
ean
ing
insi
ngl
ere
acto
r�
Rob
ust
proc
ess
des
ign
�C
ost-
effec
tive
Mor
ere
sear
chis
nee
ded
for
larg
e-sc
ale
com
mer
cial
appl
icat
ion
sM
ult
i-st
aged
gasi
fica
tion
con
cept
Exe
cuti
onof
pyro
lysi
san
dga
sifi
cati
onw
ith
ind
ivid
edzo
nes
ina
gasi
fier
,in
sin
gle-
con
trol
led
stag
es�
Hig
hqu
alit
ycl
ean
syn
gas
gen
erat
ion
�Im
prov
edpr
oces
seffi
cien
cyE
nh
ance
dco
mpl
exit
y
Inte
grat
ion
ofd
istr
ibu
ted
pyr-
olys
ispl
ants
wit
hce
ntr
alga
sifi
-ca
tion
plan
t
Prod
uct
ion
ofch
ar-o
ilsl
urr
yin
dis
trib
ute
dpy
roly
sis
plan
tsan
dga
sifi
cati
onin
cen
tral
plan
tfo
rsy
nga
sge
ner
atio
nan
dbi
ofu
elsy
nth
esis
�U
sage
ofd
istr
ibu
ted
,lo
w-g
rad
ebi
o-m
ass
�C
ost-
effec
tive
tran
spor
tati
onof
char
-oi
lsl
urr
y
Gas
olin
ean
dol
efin
spr
odu
ctio
nvi
ath
ispr
oces
sis
not
econ
omic
al
Plas
ma
gasi
fica
tion
Usa
geof
plas
ma
asa
hea
tsou
rce
du
rin
gga
sifi
cati
onor
asa
tar-
crac
kin
gag
ent
dow
nst
ream
�D
ecom
posi
tion
ofan
yor
gan
icm
atte
r�
Tre
atm
ent
ofh
azar
dou
sw
aste
�H
igh
inve
stm
ent
cost
�H
igh
pow
erre
quir
emen
t�
Low
effici
ency
Supe
rcr
itic
alw
ater
gasi
fica
tion
Gas
ific
atio
nis
carr
ied
out
insu
per-
crit
ical
wat
er�
Liqu
idan
dbi
omas
sw
ith
hig
hm
oist
ure
con
ten
tar
etr
eate
d�
No
pre-
trea
tmen
tis
requ
ired
�H
igh
ener
gyre
quir
emen
t�
Hig
hin
vest
men
tco
st
Sorp
tion
enh
ance
dre
form
ing
and
biom
ass
gasi
fica
tion
wit
hC
O2
capt
ure
Gas
ific
atio
nof
feed
stoc
kis
perf
orm
edin
the
pres
ence
ofca
taly
stan
dso
rben
t�
Insi
tuC
O2
capt
ure
�E
nh
ance
dH
2pr
oduc
tion
�R
edu
ced
tar
con
ten
t
Dev
elop
men
tof
adva
nce
dca
taly
sts
cum
sorb
ents
isn
eed
ed
Co-
gen
erat
ion
ofth
erm
alen
ergy
wit
hpo
wer
Com
bin
edge
ner
atio
nof
hea
tan
dpo
wer
En
han
ced
proc
ess
effici
ency
On
lyd
ecen
tral
ized
hea
tan
dpo
wer
prod
uct
ion
isfe
asib
leas
hea
tn
eed
sto
bepr
odu
ced
nea
rth
eco
nsu
mer
Poly
-gen
erat
ion
ofh
eat,
pow
eran
dH
2
Com
bin
edge
ner
atio
nof
hea
t,po
wer
and
H2
�E
nh
ance
dpr
oces
seffi
cien
cy�
Gen
erat
ion
ofre
new
able
H2
En
han
ced
com
plex
ity
inpr
oces
sd
esig
n
Poly
-gen
erat
ion
ofSN
Gw
ith
hea
tan
dpo
wer
Com
bin
edge
ner
atio
nof
hea
t,po
wer
and
SNG
�G
ener
atio
nof
ren
ewab
lefu
elfo
rtr
ansp
orta
tion
�E
nh
ance
dpr
oces
seffi
cien
cy
Not
econ
omic
alin
the
abse
nce
ofa
nat
ura
lga
sd
istr
ibu
tion
syst
em
FTpr
oces
sco
upl
edw
ith
gasi
fier
Syn
gas
gen
erat
edvi
aga
sifi
cati
onis
uti
lize
dfo
rFT
-fu
els
syn
thes
isPr
oduc
tion
ofcl
ean
,ca
rbon
-neu
tral
liqu
idbi
ofu
els
En
han
ced
com
plex
ity
inpr
oces
sd
esig
n
Energy & Environmental Science Review
Ope
n A
cces
s A
rtic
le. P
ublis
hed
on 0
2 Ju
ne 2
016.
Dow
nloa
ded
on 1
4/12
/201
7 15
:54:
47.
Thi
s ar
ticle
is li
cens
ed u
nder
a C
reat
ive
Com
mon
s A
ttrib
utio
n-N
onC
omm
erci
al 3
.0 U
npor
ted
Lic
ence
.View Article Online

2948 | Energy Environ. Sci., 2016, 9, 2939--2977 This journal is©The Royal Society of Chemistry 2016
with Fe into their corresponding crystalline structure.67
Calcination of Fe-bearing olivines has been reported to formoxides whose amount is dependent upon calcination time andtemperature.67,68 Rapagna et al.41 and Virginie et al.69,70 foundthat when 10 wt% Fe-olivine was utilized in a pilot gasifierinstead of olivine alone, total gas yield was increased by 40%,H2 yield by 88%, CH4 was curtailed by 16% and tar generationby 46%, encouraging the accretion of Fe in olivine.
The research above has shown that Ni-catalysts are suitable toconvert tarry fuel gas into clean syngas even if hydrogen sulphide(H2S) is present.71 In most of the cases, catalytic activity is slightlyreduced; however, the residual activity remained constant evenafter considerable operation time and complete transformation ofnaphthalene, which is a key component of tar, was achieved.72,73
Ni-based catalysts have also been examined using a model gas(a mixture of benzene, naphthalene and CH4) treatment,employing a catalytic filter.71–73 High H2S concentrations area serious risk for downstream chemical synthesis and fuel cellapplications below 1000 1C.42 Ca-based sorbents have a highaffinity for H2S at elevated temperatures. The sulphidation ofcalcined and non-calcined CaCO3 was examined extensively byHu et al.74,75 Elseviers et al.76 carried out extensive experimentalwork in real life settings for H2S removal, and with simulatedcoal gas.76–78 They concluded that fuel gas composition does notinfluence the desulphurization performance of the sorbents.
Various studies have been conducted to assess the influenceof sorbents on H2S, hydrochloric acid (HCl) and other elementssuch as alkali and heavy metals, in a new concept called theUnique gasifier as shown in Fig. 5.3 Stemmler et al.79 investi-gated the effects of varying the inlet feedstock and gasifiertemperatures using thermodynamic models applying Gibbsfree energy minimization on the elimination of alkali metalsand toxic gases. Some experimental work was also carried outto back the theoretical findings. It was established that the
contaminants are removed in downstream equipment, giving asupplementary advantage of enhanced tar reforming.3 Alumino-silicates are reported to degrade alkali species’ concentrations toppb levels, along with the elimination of Cl and zinc (Zn).80,81
The major problem with alkali and other heavy metals is theircondensation and consequent induction of fouling and corro-sion. Barisano et al.82 reported the utility of aluminosilicatesorbents to eliminate alkali halides during gasification. Theyused a FBG operating at ambient pressure with bauxite todegrade potassium chloride and sodium chloride. Bauxite wasthe preferable choice as it, along with bentonite, kaolinite andnaturally occurring zeolites, is abundantly available, cheap anddoes not have a negative environmental impact on disposal.
2.2.2 Integration of pyrolysis and gasification. Biomassgasification is an integration of numerous overlapping steps,which makes it impossible to control and optimize thesedifferent steps distinctly in a single-stage gasifier. The contactbetween volatiles and char produced during pyrolysis hasan adverse effect on the gasification of char.83 Hence, chargasification in volatile-deficient environments improves theefficacy of biomass gasifiers.
An atypical gasification strategy separates pyrolysis andbiomass gasification into separate stages with individual con-trol, which are then subsequently integrated, i.e., a multistagegasification. It avoids mixing of produced volatiles and char,consequently adverse impacts on the reactivity and gasificationof char are eradicated. Enhanced exit gas purity, char trans-formation rate and efficiency, coupled with low levels oftar formation, can be achieved when employing this strategy.Two distinct modes of operation have been applied by theDanish Technical University, Denmark, and Karlsruhe Instituteof Technology, Germany.84,85 In the first method, pyrolysis andbiomass gasification are integrated in either a 2- or 3-stageprocess with different stages combined in a single overall unitwith separated pyrolysis or biomass gasification zones ordifferent reactors utilized in succession. In the other method,pyrolysis plants are positioned at diverse locations near sourcesof biomass pyrolysis. The pyrolysis products are transported toa central biomass gasification unit, thus improving the energydensity of the energy vector transported, and hence the supplychain economics. Energy density is markedly enhanced whenbiomass is transformed to pyrolytic oils or oil – char slurry.For example, the energy densities of straw and woodchips is2 GJ m�3 and 8 GJ m�3, respectively while in pyro-oil and char-oil slurry, the density increases to 30 GJ m�3 and 26 GJ m�3.86
This concept is described in the following section – Integrationof distributed pyrolysis plants with central gasification plant.
Multi-staged gasification concept. Pyrolysis and gasificationare executed within divided zones inside a gasifier. Thisenables biomass conversion into usable products to take placeunder optimized operational settings for each individual step.The main motive behind this concept is to obtain a high-qualityclean syngas with a low tar content. Moreover, improvedefficiency and larger throughput have resulted utilizing thismulti-zoned reactor setup.3
Fig. 5 Schematic of unique combination of gasification with in situ gascleaning and conditioning.3
Review Energy & Environmental Science
Ope
n A
cces
s A
rtic
le. P
ublis
hed
on 0
2 Ju
ne 2
016.
Dow
nloa
ded
on 1
4/12
/201
7 15
:54:
47.
Thi
s ar
ticle
is li
cens
ed u
nder
a C
reat
ive
Com
mon
s A
ttrib
utio
n-N
onC
omm
erci
al 3
.0 U
npor
ted
Lic
ence
.View Article Online

This journal is©The Royal Society of Chemistry 2016 Energy Environ. Sci., 2016, 9, 2939--2977 | 2949
Some examples of this split reactor operation include the75 kWth Viking gasifier installed at the Danish TechnicalUniversity; the FLETGAS process developed at the Universityof Sevilla, Spain; and a low-temperature circulating fluidizedbed (LT-CFB) by DONG Energy Company in Denmark.83,84,87 Asshown in the Fig. 6, the Viking gasifier is a 2-stage unit with ascrew pyrolysis reactor followed by a downdraft gasifier. Materialexiting the pyrolysis reactor is mixed with air to partly oxidize itbefore it enters the biomass gasification reactor. This degradesthe tar content in the product gas to less than 15 mg m�3 (s.t.p.).Exit gases from the gasifier contain around 32% H2 and 16% COwith traces (2%) of CH4 with an upper calorific content of gas of6.6 MJ Nm�3.84,88 This gasifier is presently working at 200 kWe
and will soon be up-scaled to 500 kWe.89
The FLETGAS process is a 3-stage gasification system.Devolatization in a FBG takes place with low transformationof tar and char between 700 1C and 750 1C, in the first stage,with high production of reactive tar. The reactive tar is thenreformed with steam in the second stage at 1200 1C. Chargenerated in the first step undergoes gasification in a down-draft gasifier, which in turn forms the third stage. Char formedin the primary step is directly conveyed to the third stage viasolid transport in a sealed system and gas coming from thesecond step passes into the bed of char, which also serves ascatalyst for further tar reduction.83,90
Researchers have performed modelling work to investigatethe advantages and disadvantages of multi-staged reactors oversingle-stage reactors. A noteworthy decline in the tar concen-tration to 10 mg Nm�3, coupled with char conversion of 98%and an overall excellent gasification efficiency of 81% has beensimulated, prompting further investment and investigation.The higher heating value of the product was found to be6.4 MJ Nm�3.87 This procedure is under development at pilotscale87 with continued experimental work to improve theprocess.91,92 The main limitation is the intricate reactor set-up which may limit its scale-up possibilities.
The LT-CFB gasifier has two inter-connected stages with acirculating fluidized bed pyrolysis reactor operating at around650 1C in the first stage and a bubbling FBG operating at 730 1C inthe second stage for the gasification of char. This is shown inFig. 7. A high residence time in this gasification strategy reducesthe temperature required for char gasification. Sand and ash areused as the heat transfer medium, which takes the thermal energyfrom the lowest part of the gasifier to the pyrolysis reactor.Moreover, vaporized char in the form of gas is also redirected tothe pyrolysis reactor. Char and sand are separated from the gaswith the aid of the cyclone installed between the two reactors.
The process has already been tested in 100 kWth and500 kWth units and a demonstration plant has been installedby DONG Company at 6 MWth capacity, where the produced gasis co-fired with coal. This process was developed for challengingfeedstocks such as pig manure, straw, sewage sludge, organicwastes, etc.3 The maximum calorific content of the exit gasemploying pig manure as fuel, was reported as 7 MJ Nm�3 witha composition of 3.5% H2, 16.3% CO, 4.3% CH4 and 59% N2.Thomsen et al.93 found that low process temperatures areresponsible for retention of alkalines in ash; however, the outputgas contains high tar concentrations (44.8 g m�3), making itless likely to be usable in most applications, without a cleaningstep. This process has been found to be robust, cost effective andhas low maintenance. It can be seen from the aforementionedmulti-stage processes that higher char transformation and gasi-fication efficiencies are achieved vis-a-vis single-stage biomassgasification, with an exception of the entrained flow gasifier,which is single-staged but has high oxygen requirements andlimited biomass feedstock fraction allowed, as major limitations.However, the multi-stage process is significantly more complexand requires high capital investment.
Integration of distributed pyrolysis plants with central gasifica-tion plant. The strategy to employ pyrolysis and gasification atdifferent locations was developed in Germany as the Bioliq
Fig. 6 Schematic diagram of Viking gasifier.84
Energy & Environmental Science Review
Ope
n A
cces
s A
rtic
le. P
ublis
hed
on 0
2 Ju
ne 2
016.
Dow
nloa
ded
on 1
4/12
/201
7 15
:54:
47.
Thi
s ar
ticle
is li
cens
ed u
nder
a C
reat
ive
Com
mon
s A
ttrib
utio
n-N
onC
omm
erci
al 3
.0 U
npor
ted
Lic
ence
.View Article Online

2950 | Energy Environ. Sci., 2016, 9, 2939--2977 This journal is©The Royal Society of Chemistry 2016
concept.85 Here, biomass is treated in several pyrolysis plants indifferent locations and then the char-oil slurry producedis transported to the centralized BG unit, for gasification andbio-fuel synthesis. The main advantage of this strategy is itsability to use distributed, low-grade ligno-cellulosic biomasscoupled with the cost-effective transportation of char-oil slurryinstead of the biomass itself. Biomass with an energy density ofabout 2 GJ m�3 is upgraded to an oil-char slurry which has anenergy density of about 25 GJ m�3, which is equivalent to coaland easier to transport in tankers, for example. This enhance-ment in energy density is stated to make this process highlyeconomical.94 A flow diagram depicting the Bioliq concept ispresented in Fig. 8.
A demonstration plant has been constructed in Germanyemploying 4 process steps: production of an oil-char slurrythrough pyrolysis at different locations, gasification of theslurry, clean-up of product gas and production of biofuel. Fastpyrolysis at 500 1C was selected for feedstock preparationfor BG owing to its short reaction time and high yield.95 Theslurry is then gasified with oxygen as the gasifying mediumto produce 5 MWth in an EFG operating at 1200 1C with twopressure stages of 40 and 80 bar.96 This type of slurry gasifica-tion is quite novel and has been associated with the experi-mental investigations of the char-oil slurry coupled with themodeling of the slurry.97
Ceramic hot gas filters are installed to clean up impurities ofthe syngas such as alkalis, chloride, furfurals, phenols andsulphur at 800 1C.98 This is different from the conventionalvertical hanging filters in a tube sheet in terms of design andposition.99 The horizontal design imparts compactness alongwith a reduced vessel size. Chlorides and sulphurous gascomponents are removed by sorbents such as CaO and ZnO.Tar is subsequently cracked in the presence of catalysts. Areasfor research include the changes in the properties of char-oilslurry due to stand-time, and its effect on gasification.100 Bio-oilderived from pyrolysis of biomass is a mix of furfurals, phenolswith fractions of aldehydes, ketones, esters and ethers, andvarying percentages of O2 and H2O, where O2 makes up 35% to40% and H2O is 15% to 30%.101 Moreover, char-oil slurry fromnumerous locations is most likely to have varying composition,thus the need to test for stable atomization and uniformgasification for these slurries arises.
2.3 Special gasification techniques
Several special processes have been developed to convert differenttypes of biomass into usable gas and/or heat and electricity.
2.3.1 Plasma gasification for toxic organic waste. Plasmais one of the fundamental states of matter and can be gene-rated either by heating a gas or by exposing it to a strongFig. 8 Simplified scheme of the Bioliq concept.
Fig. 7 Simple schematic diagram of LT-CFB gasifier.3
Review Energy & Environmental Science
Ope
n A
cces
s A
rtic
le. P
ublis
hed
on 0
2 Ju
ne 2
016.
Dow
nloa
ded
on 1
4/12
/201
7 15
:54:
47.
Thi
s ar
ticle
is li
cens
ed u
nder
a C
reat
ive
Com
mon
s A
ttrib
utio
n-N
onC
omm
erci
al 3
.0 U
npor
ted
Lic
ence
.View Article Online
This journal is©The Royal Society of Chemistry 2016 Energy Environ. Sci., 2016, 9, 2939--2977 | 2951
electromagnetic (EM) field. There are two types of plasma –thermal plasma and cold plasma. Thermal plasma is created atambient pressure while cold plasma is produced in a vacuum.Thermal plasma is generally produced with gases such as argon(Ar), N2, H2, H2O vapor or a gas mixture at a temperature ofaround 4700 1C or higher. In plasma gasification, AC or DC arcplasma torch generators are used.102
Plasma is used in two different ways in the gasificationprocess: (1) plasma is used as a heat source during gasification;(2) plasma is used for tar cracking after standard gasification.Primarily, plasma gasification is employed for the decomposi-tion of toxic organic wastes, along with rubber and plastics,although the first reason and currently the main application forplasma gasification is the treatment of hazardous biomasswaste. However, the technology has also gained interest forsyngas production and electricity generation in recent years asthe costs have entered into a commercially competitive range.A plasma gasification plant at Utashinai, Japan has been operatingsince 2002 and as of 2014, gasifies 268 tonnes of municipal solidwaste per day and thus produces 7.9 MW h electricity.102
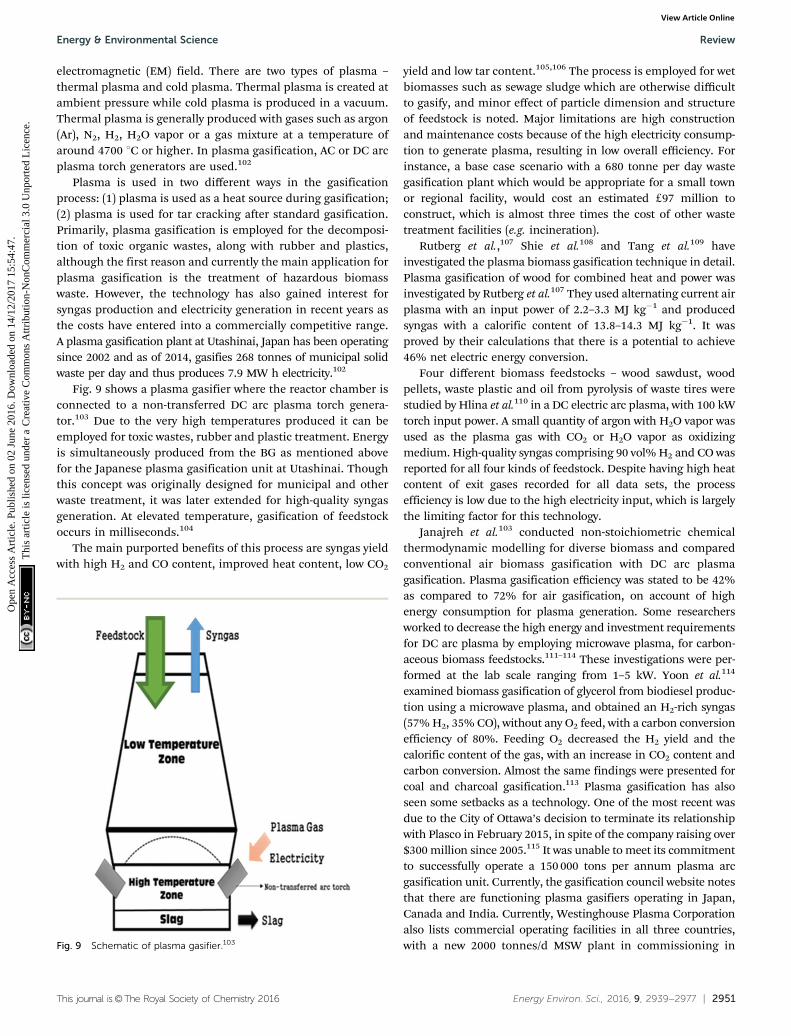
Fig. 9 shows a plasma gasifier where the reactor chamber isconnected to a non-transferred DC arc plasma torch genera-tor.103 Due to the very high temperatures produced it can beemployed for toxic wastes, rubber and plastic treatment. Energyis simultaneously produced from the BG as mentioned abovefor the Japanese plasma gasification unit at Utashinai. Thoughthis concept was originally designed for municipal and otherwaste treatment, it was later extended for high-quality syngasgeneration. At elevated temperature, gasification of feedstockoccurs in milliseconds.104
The main purported benefits of this process are syngas yieldwith high H2 and CO content, improved heat content, low CO2
yield and low tar content.105,106 The process is employed for wetbiomasses such as sewage sludge which are otherwise difficultto gasify, and minor effect of particle dimension and structureof feedstock is noted. Major limitations are high constructionand maintenance costs because of the high electricity consump-tion to generate plasma, resulting in low overall efficiency. Forinstance, a base case scenario with a 680 tonne per day wastegasification plant which would be appropriate for a small townor regional facility, would cost an estimated d97 million toconstruct, which is almost three times the cost of other wastetreatment facilities (e.g. incineration).
Rutberg et al.,107 Shie et al.108 and Tang et al.109 haveinvestigated the plasma biomass gasification technique in detail.Plasma gasification of wood for combined heat and power wasinvestigated by Rutberg et al.107 They used alternating current airplasma with an input power of 2.2–3.3 MJ kg�1 and producedsyngas with a calorific content of 13.8–14.3 MJ kg�1. It wasproved by their calculations that there is a potential to achieve46% net electric energy conversion.
Four different biomass feedstocks – wood sawdust, woodpellets, waste plastic and oil from pyrolysis of waste tires werestudied by Hlina et al.110 in a DC electric arc plasma, with 100 kWtorch input power. A small quantity of argon with H2O vapor wasused as the plasma gas with CO2 or H2O vapor as oxidizingmedium. High-quality syngas comprising 90 vol% H2 and CO wasreported for all four kinds of feedstock. Despite having high heatcontent of exit gases recorded for all data sets, the processefficiency is low due to the high electricity input, which is largelythe limiting factor for this technology.
Janajreh et al.103 conducted non-stoichiometric chemicalthermodynamic modelling for diverse biomass and comparedconventional air biomass gasification with DC arc plasmagasification. Plasma gasification efficiency was stated to be 42%as compared to 72% for air gasification, on account of highenergy consumption for plasma generation. Some researchersworked to decrease the high energy and investment requirementsfor DC arc plasma by employing microwave plasma, for carbon-aceous biomass feedstocks.111–114 These investigations were per-formed at the lab scale ranging from 1–5 kW. Yoon et al.114
examined biomass gasification of glycerol from biodiesel produc-tion using a microwave plasma, and obtained an H2-rich syngas(57% H2, 35% CO), without any O2 feed, with a carbon conversionefficiency of 80%. Feeding O2 decreased the H2 yield and thecalorific content of the gas, with an increase in CO2 content andcarbon conversion. Almost the same findings were presented forcoal and charcoal gasification.113 Plasma gasification has alsoseen some setbacks as a technology. One of the most recent wasdue to the City of Ottawa’s decision to terminate its relationshipwith Plasco in February 2015, in spite of the company raising over$300 million since 2005.115 It was unable to meet its commitmentto successfully operate a 150 000 tons per annum plasma arcgasification unit. Currently, the gasification council website notesthat there are functioning plasma gasifiers operating in Japan,Canada and India. Currently, Westinghouse Plasma Corporationalso lists commercial operating facilities in all three countries,with a new 2000 tonnes/d MSW plant in commissioning inFig. 9 Schematic of plasma gasifier.103
Energy & Environmental Science Review
Ope
n A
cces
s A
rtic
le. P
ublis
hed
on 0
2 Ju
ne 2
016.
Dow
nloa
ded
on 1
4/12
/201
7 15
:54:
47.
Thi
s ar
ticle
is li
cens
ed u
nder
a C
reat
ive
Com
mon
s A
ttrib
utio
n-N
onC
omm
erci
al 3
.0 U
npor
ted
Lic
ence
.View Article Online

2952 | Energy Environ. Sci., 2016, 9, 2939--2977 This journal is©The Royal Society of Chemistry 2016
Tee Valley, UK and when built this will be the largest plasmagasifier unit in the world.116
Currently, no commercial-scale H2 production plant hasbeen reported employing plasma biomass gasification. Signifi-cant research is required to decrease energy input and therebyenhance efficiency.
2.3.2 Supercritical water gasification (SCWG) for wet bio-mass. Water above its critical point (T = 374.12 1C and P = 221.2bar) is termed as supercritical. Under these settings, the liquidand gas phases do not exist and supercritical water showsdistinctive reactivity and solvency characteristics. Solubilitiesof organic materials and gases which are normally insoluble,are enhanced, with a decrease in solubility for inorganics. Theproperties of supercritical water lie between those of the liquidand gaseous phases. This unique property was found by MITscientists in the mid-1970s and research on SCWG was initiatedthen. In the last decade, several developments were madeand papers which examined both fundamentals and potentialreactions along with the potential technical issues werepublished.117–119
SCWG has been applied to wet biomass without the needfor pre-drying, which is a major advantage over other moreconventional gasification techniques. Numerous investigationson diverse feedstocks such as agricultural wastes, leatherwastes, switch grass, sewage sludge, algae, manure and blackliquor have been performed.122–127 Employing SCWG, evenliquid biomass such as olive mill water can be utilized withthe production of low-tar H2 gas.124 A simplified schematic of aSCWG setup is shown in Fig. 10.
Product gas from SCWG mainly comprises H2, CO2, CH4 andCO. The CO yield is comparatively low as CO transforms intoCO2 through the water–gas-shift reaction.127 Tar and cokeformation are curtailed by rapid dissolution of product gascomponents in supercritical H2O.121 Guo et al.121 and Fenget al.128 found that above 600 1C, H2 is the dominant compo-nent of the produced gas, since H2O is a strong oxidant whichreacts with carbon to release H2 and CO, whereas CH4 isthe main component below 450 1C. Heating of H2O to thereaction temperature necessitates a great amount of energyinput. However, employing appropriate catalysts can lower the
reaction temperature. This reduces the operational and equip-ment cost and increases conversion efficiency and H2 produc-tion. This is depicted in Fig. 11. This graph shows different gasyields vs. temperature. It reflects that H2 production enhancesexponentially after 600 1C while CO increases from 500 to660 1C and then decreases. CH4 decreases to 540 1C and thenremains almost constant even when temperature is increased.
A number of catalysts, such as Ni and Ru, activated carbon,Pt-based catalysts, and alkali metal-based materials such asNa3(CO3)(HCO3)�2H2O (trona), KOH, NaOH, K2CO have beentested.121,129,130 Other investigators have also studied the energyefficiency of SCWG. Biomass gasification of vinasse (a byproductof the sugar industry) in supercritical H2O was modelled byMarias et al.131 They found a maximum efficiency of 87% at600 1C. Lu et al.132 explained thermal losses during heat transferat the heat exchanger, cooler, pre-heater and reactor, anddemonstrated that these were responsible for the decrease inefficiency. Efficient heat exchangers may not be necessary iftraces of O2 are allowed, which have been stated would makethe process self-sustainable energetically at the expense of a verysmall loss of exit gas heating value.133
Wet biomass treatment without pre-drying, liquid biomass treat-ment such as olive mill waste water, high H2 yield, high gasificationefficiency and low tar formation are the main benefits of SCWG.124
Major limitations include requirements of high-pressure- andhigh-temperature-resistant and rust-resistant materials, conse-quently increasing the investment costs, and high energyrequirements. SCWG has been significantly improved sinceits initial conception and presents an interesting and possiblyfeasible technology especially for wet biomass but large-scale orcommercial gasification requires further research.
2.3.3 Sorption-enhanced reforming (SER) and biomassgasification with CO2 capture. In steam reforming of biomass,separation of H2 from a product gas containing CO2 and tarincurs large cost penalties. Therefore, a solution where the CO2
and tar produced during steam reforming are simultaneouslycaptured has significant potential to make the process morecost-effective.134,135 The primary method employs catalystsFig. 10 Simplified schematic of SCWG.120
Fig. 11 Diagram showing the variation in product distribution vs. reactortemperature in SCWG.121
Review Energy & Environmental Science
Ope
n A
cces
s A
rtic
le. P
ublis
hed
on 0
2 Ju
ne 2
016.
Dow
nloa
ded
on 1
4/12
/201
7 15
:54:
47.
Thi
s ar
ticle
is li
cens
ed u
nder
a C
reat
ive
Com
mon
s A
ttrib
utio
n-N
onC
omm
erci
al 3
.0 U
npor
ted
Lic
ence
.View Article Online

This journal is©The Royal Society of Chemistry 2016 Energy Environ. Sci., 2016, 9, 2939--2977 | 2953
inside the gasifier while the secondary method uses themdownstream.136,137 Although the secondary method is moreeffective, the primary method has gained more attention onaccount of avoiding intricate downstream clean-up.138
Calcium oxide (CaO) is now an almost established catalyst toyield H2-rich product gas;39,139–142 because of its cost effective-ness and abundance,134,136,143 it has gained much attention.It acts not only as a sorbent but also as a tar cracker andheat carrier in FBG.136 Removal of CO2 during the BG processshifts the equilibrium of the product gas. This enhancesthe H2 yield.143 In the same manner, tar cracking increasesthe exit gas quantity, leading to high H2 yield and conversionefficiency.144,145 Therefore, in situ CO2 capture with CaO duringthe steam reforming of biomass for H2-rich gas production ishighly attractive and promising.146–151
Since CaO captures CO2 according to the carbonationreaction (7), it will lead to a reduction in the partial pressureof CO2 under gasification conditions. This reduction in CO2
partial pressure drives the water–gas-shift reaction (8) forwardin accordance with Le Chatelier’s principle. This leads to anincreased yield of H2.147 Later CaO is recovered by calcination (9).The efficacy of the reaction is a subset of other parameters also,such as steam-to-biomass ratio (S/B), temperature, pressure, andthe amount of CaO.
CaO + CO2 - CaCO3 (7)
CO + H2O - CO2 + H2 (8)
CaCO3 - CaO + CO2 (9)
In situ CO2 adsorption was studied by Pfeifer et al.152 in adual FBG for H2-rich syngas production. They comparedadsorption-enhanced reforming (AER) using CaO as bedmaterial with traditional BG without CaO. In AER, 75 vol% H2
yield was reported with 0.5 g Nm�3 of tar at 600–700 1C whereasin the latter process, at 850 1C, 40 vol% of H2 in the product gaswith 2–5 g Nm�3 was found. Hence, high H2 vol% with low tarcontent can be produced even at lower temperatures in thepresence of CaO, thus making it a desirable choice for a sorbentin the steam reforming of biomass. AER has been studied byonly a few researchers.152,153 Further research is required toexplore different options to optimize energy efficiency.
A major limitation of using a CaO sorbent in steam-assistedBG is irregular H2 production due to deactivation of CaO duringthe regeneration. Although CaO is potentially promising intar reforming and CO2 capture, the process would not beeconomically viable if the CaO could not be regenerated afterthe carbonation reaction. Consequently, the supply of CaOmust be replenished.154 In order to overcome this problem tosome extent, calcium looping gasification (CLG) was introduced.CaO-assisted CLG was first employed in the CO2 acceptorprocess, which was developed in the 1970s and terminated in1977 after positive tests in a pilot plant.155 CaO-assisted CLG consistsof two reactors as shown in Fig. 12. Steam reforming of biomasstakes place in the gasifier in the presence of CaO, which capturesCO2 and is converted to CaCO3 via the carbonation reaction (7).
This enhances the H2 yield. CaCO3 particles are circulated tothe regenerator or combustor, where they are calcined back toCaO, with the production of a pure CO2 stream (9), whichcan be sent for storage. CaO is recycled back to the gasifieralong with the heat of calcination which it carries and aids incompensating endothermic reactions in the gasifier.146 There-fore, this is a low-energy demanding and eco-friendly process ofH2 production with enhanced efficiency of H2 production.
Several researchers employed this concept of CaO-basedCLG.146,152,153,156 They used a bubbling FBG, circulatingfluidized bed regenerator and a cyclone. The theoretical systemefficiency was reported to be 87.49% with a 71 vol% H2 yield.Moghtaderi et al.156 found, using CaO from calcined feedstockssuch as dolomite that CaCO3 suffers from particle attrition anddeactivation. They used construction and demolition waste(CDW) as sorbent and found high H2 yields with low CO2 inthe product gas, with very limited attrition or erosion afterrepeated cycles.
3. Inputs and outputs3.1 Raw material
Researchers and industry characterize feedstocks for thermo-chemical conversion in numerous ways. One of the simplestways to classify them is as suggested by McKendry:16 timberedbiomass, herbaceous biomass, marine plants and manures. Wecan further sub-categorize herbaceous plants into 2 classes –high-moisture-content plants and low-moisture-content plants.Generally, BG employs low-moisture waste to avoid the energypenalty in drying; woody biomass and herbaceous plants withlow moisture contents are the primary choices because of theircontrollable moisture content. Biomass can also be classified asterrestrial biomass, marine biomass and waste. This classifica-tion along with sub-classification and significance is depictedin Table 4.
Biomass feedstocks in loose or powdery form with densityless than 200 kg m�3 are also promising options as raw materialfor BG.27 They include agricultural wastes such as bagasse, sugarcane trash, rice husk, rice straw, coir pith, groundnut shell, etc.Their calorific content varies from 12 to 16 MJ kg�1 (dry basis)with bagasse on the higher end and rice husk on the lower end,with ash content up to 20%. However, pulverization is neededprior to their usage as feedstock to enhance their bulk densityand to reduce transportation cost.
Fig. 12 CaO looping in SER.
Energy & Environmental Science Review
Ope
n A
cces
s A
rtic
le. P
ublis
hed
on 0
2 Ju
ne 2
016.
Dow
nloa
ded
on 1
4/12
/201
7 15
:54:
47.
Thi
s ar
ticle
is li
cens
ed u
nder
a C
reat
ive
Com
mon
s A
ttrib
utio
n-N
onC
omm
erci
al 3
.0 U
npor
ted
Lic
ence
.View Article Online

2954 | Energy Environ. Sci., 2016, 9, 2939--2977 This journal is©The Royal Society of Chemistry 2016
Currently, sea and farmed algae have gained much attentionfor the generation of renewable biofuels on account of theircarbon fixation potential and very high growth rate.157 Further-more, they can easily be cultivated in seawater or fresh water.Extensive investigations performed by Shirvani et al.158 demon-strated that algae-based biofuels are more promising providedthat mass production is employed. Several researchers haveemployed numerous varieties of micro algae such as Spirulina,Chlorella, C. vulgaris, Tetraselmis Chuii, etc. in gasification,pyrolysis, liquefaction and direct combustion. A significantvolume of research related to thermochemical conversion(gasification,159–164 pyrolysis,164–167 liquefaction168–172 and directcombustion173) of algal biomass has been published.
All biomass contains cellulose, hemicellulose and lignin invarying percentages, along with an inorganic component whichis the source of ash. Cellulose is a straight-chain polymercomprising anhydroglucopyranose joined with ether bonds.Hemicellulose is an amorphous polysaccharide containingsugar units which are branched and have varied sugar types.Lignin is the most complex constituent with crosslinked 3-Dpolymer structure of phenylpropane units.174
Proteins, starch and sugar may be extracted from biomassand separated by treatment with solvents followed by recoverythrough evaporation. Proteins perform diversified functionswithin living organisms, which include catalyzing metabolicreactions, replication and transporting molecules from onelocation to another.175 Granulated sugars have multiple usesin the home. Starch is a vital component in food additives, papermaking, clothing starch and corrugated board adhesives.176
Table 5 shows the respective compositions of some commonlygasified biomass. Their relative lignocellulose composition playsan important role in the decomposition and energy conversionwhile undergoing gasification.177
The cellulose, hemicellulose and lignin fractions present inbiomass feedstocks degrade at different temperature ranges of305 to 375 1C, 225 to 325 1C and 250 to 500 1C respectivelyduring gasification.185 The variation in these constituents in
biomass raw materials yields products with different calorificvalues. Gasification of pure cellulose yields water-soluble tars inthe early stages. Interestingly, this is in contrast to full biomassgasification where lower amounts of water-soluble tars areformed.36 It seems that thermal polymerization of levoglucosanis inhibited along with the enhancement in light molecularweight species’ formation from cellulose, by lignin during lignin-cellulose interactions in pyrolysis. Consequently, char yields andsecondary char formation from lignin are decreased considerablyas well as production of lignin-derived compounds (guaiacol,4-vinylguaiacol and 4-methylguaiacol) are improved.186
Lv and co-authors187 studied the influence of cellulose-ligninduring pyrolysis and gasification of biomass. They reported aswift reduction in mass on account of cellulose volatizationduring pyrolysis followed by slow mass decrease because oflignin degradation. The rate of pyrolysis is directly related tocellulose fractions and inversely dependent upon lignin con-tent in the feedstock. Tar yields and amount of gas producedwere enhanced with a decrease in char, when the cellulose
Table 4 Biomass classification, sub-classification and significance
Classification Sub-classification Examples Significance
Terrestrial16,178 — Forest biomass Ideal for gasification due to high cellulose andhemicellulose percentages
Grasses Non-suitable for gasification due to high moisture.Suitable for fermentation
Energy crops Suitable for power generation through biologicaltreatment
Cultivated crops Some crops are ideal for gasification while othersare consumed directly by humans and animals
Marine16,179,180 — Algae Suitable for biological treatment because of highmoisture content
Water plant Ideal for biological treatment
Waste178,181,182 Municipal waste MSW, biosolids, sewage, landfill gas Suitable for plasma or SCW gasificationAgricultural solid waste Livestock and manures, agriculture crop
residue bark, leaves, floor residuesMost suitable for composting and otherbiological treatments
Forestry residues Ideal for gasification albeit pre-treatment is requiredIndustrial waste Demolition wood, sawdust, waste oil Wastes like wood, sawdust are commonly employed for
gasification. Others are used in biological treatments
Table 5 Composition of some biomass varieties183,184
Type of biomassCellulose(%)
Hemicellulose(%)
Lignin(%)
Other(%)
Softwood 41 24 28 7Hardwood 39 35 20 7Wheat straw 40 28 17 15Rice straw 30 25 12 33Bagasse 38 39 20 3Oak wood 34.5 18.6 28 —Pine wood 42.1 17.7 25 —Birch wood 35.7 25.1 19.3 —Spruce wood 41.1 20.9 28 —Sunflower seed hull 26.7 18.4 27 —Coconut shell 24.2 24.7 34.9 —Almond shell 24.7 27 27.2 —Poultry litter 27 17.8 11.3 20Deciduous plant 42 25 21.5 11.5Coniferous plant 42 26 30 2Willow plant 50 19 25 6Larch plant 26 27 35 12
Review Energy & Environmental Science
Ope
n A
cces
s A
rtic
le. P
ublis
hed
on 0
2 Ju
ne 2
016.
Dow
nloa
ded
on 1
4/12
/201
7 15
:54:
47.
Thi
s ar
ticle
is li
cens
ed u
nder
a C
reat
ive
Com
mon
s A
ttrib
utio
n-N
onC
omm
erci
al 3
.0 U
npor
ted
Lic
ence
.View Article Online

This journal is©The Royal Society of Chemistry 2016 Energy Environ. Sci., 2016, 9, 2939--2977 | 2955
fraction was increased during fast pyrolysis in FBG. Further-more, a rise in gasification temperature and time was observedwith increasing cellulose content, reflecting the significance ofcellulose-lignin interactions during BG.
Extensive investigations performed by Azadi et al.188 regard-ing lignin gasification proved that the ultimate products(CO + H2 + CO2 + CH4) are similar to those formed duringgasification of other biomass feedstocks. Ash and H2S are alsoincluded in the products via lignin gasification on account ofthe presence of sulphur and inorganics induced during fraction-ation from biomass, depending on the treatment method.
In general, the higher the cellulose and hemicellulose con-tent, the greater the volume of gaseous products formed.Therefore, softwood, hardwood, wheat straw and bagasse withmuch higher cumulative percentages of cellulose and hemi-cellulose are preferred over sunflower seed hull, coconut shell,almond shell, larch plant or poultry litter, when attempting toobtain gas as the final product. This makes the selection ofan appropriate feedstock for the desired products a vital con-sideration (as shown in Table 5).
Other important constituents are silica (fouling and slagging andash disposal issues), chlorine and sulphur (acid gas mitigation) andalkali metals (slagging, fouling and high-temperature corrosionconcerns).
Many researchers have conducted extensive investigationsinto the effects on H2 yield through non-catalytic BG of differ-ent biomass types using FBGs and UGs. Previous research hasshown that in general, H2 production from gasification ofbiomass varies between 10 to 65 vol%.39,189–195 It is, however,difficult to assess whether the alterations are caused by thevariety of biomass, type of gasifier or its operating parameters.
Characterization of feedstock is a prime factor in gasifierselection. Generally, woody biomass has an ash content below2% and hence it is appropriate for use in a FXBG.196 This isbecause high-ash-content feedstocks are prone to agglomera-tion in FXBG during gasification, leading to a drop in conver-sion efficiency and possible reliability issues. An updraft-fixed-bed gasifier (UG) yields a product gas with high tar and high-volatile-content raw material, which is unsuitable for manyhigh-purity applications like fuel cells and engines. Therefore,a DG is more fitting in this case, as simple cleaning of the outletgases would make it practical for operation in engines. Inthe case of sawdust, DG can generate large tar yields, with alarge pressure drop within the reactor.9 Agricultural residuessuch as coconut shells, maize cobs, palm kernels and othershells are commonly used as a biomass feedstock for BG,especially in under-developed countries where these materialsare readily available. They are unlikely to create any problemsin FXBGs. Fibrous feedstocks, such as coconut husks andempty fruit bunch are reported to create spanning problemsin the feeder section, thus usually require pretreatment priorto gasification. Spanning means the material matts togetherbecause of the needle-like structure of the biomass, thusspanning and blocking the entrances to processing sections.Pretreatment can involve torrefaction or densification to avoidthis problem.
Most herbaceous biomasses have high ash content and causeslagging problems in DG.197 Ash fouling during gasification is afunction of gasifier operating temperature. It is observed that alow amounts of ash are released between 100 to 500 1C while ashemissions rise sharply beyond 600 1C.36 Slagging occurs becauseof the low melting temperature of the ash. Ca, Mg, K and Nasilicates are often found to have lower melting temperatures.With temperature rise, SiO2 content is found to increase. Whenthe alkali species evaporate, they can form eutectic mixtureswith SiO2, resulting in slagging. Low-temperature operation ofthe gasifier (below the flow temperature of ash) or elevated-temperature operation (above the melting point of ash) canminimize slagging to a considerable extent.7 Of course, somegasifiers, such as the British Gas/Lurgi slagging gasifier, requireslagging to occur, with the slag forming a protective coating onthe gasifier wall. In this case, the viscosity of the slag is equallysignificant. Ash can also be mixed with cement or concrete aspozzolanic material, which can decrease the consumption ofcement/concrete as well as lighten the burden on landfill.198
In addition, it can positively aid in environmental conservationby reducing energy consumptions and GHG emissions ofcement/concrete manufacturing plants.
Numerous indices have been published which relate slaggingpropensity to the fuel’s elemental structure. Amongst these indices,one in particular has been quoted in a number of publications.199–201
This is the alkali index, which is the ratio of the alkalinecomponents of the fuel ash (+Fe2O3) to the acidic compounds(in this case, for a fluidised bed). The greater the alkali index,the higher would be the tendency of the fuel to cause agglo-meration of the bed. However, the use of any single index is notrecommended, given the potential complexity of the compo-nents present, and tests of slag properties for different materialspossibly utilized are always recommended.
3.2 Syngas
Biofuels synthesized from syngas have been exploited in manyhouseholds for daily applications such as cooking food, heatingwater and lighting. The energy which can be produced annuallyfrom biomass is potentially three or four times greater than theworldwide energy demand.202 Huber et al.203 and Rajagopalet al.204 found that thermochemical paths like pyrolysis andgasification can convert non-edible biomass feedstock intosyngas, as depicted in reaction (10). The syngas can be furthertransformed into bio-synthetic natural gas (Bio-SNG) throughmethanation reactions (11) and (12) or transformed into liquidhydrocarbons (HC) via other processes.205 Syngas contains30–60% CO, 25–30% H2, 5–15% CO2, 0–5% CH4 and traces ofwater vapor, H2S, ammonia (NH3) and others, depending on thefeedstock variety and operating variables.206
CHxOy + (1 � y)H2O - CO + (0.5x � y + 1)H2 (10)
Wan et al.207 found that the carbon conversion rate of woodybiomass to syngas is around 92%, 71% for H2 conversion with atotal energy conversion efficiency of 62%, post syngas clean-up.Syngas yield is about 1.2 Nm�3 per kg of wood. Biomass whichis low in ash content is generally employed for syngas production,
Energy & Environmental Science Review
Ope
n A
cces
s A
rtic
le. P
ublis
hed
on 0
2 Ju
ne 2
016.
Dow
nloa
ded
on 1
4/12
/201
7 15
:54:
47.
Thi
s ar
ticle
is li
cens
ed u
nder
a C
reat
ive
Com
mon
s A
ttrib
utio
n-N
onC
omm
erci
al 3
.0 U
npor
ted
Lic
ence
.View Article Online

2956 | Energy Environ. Sci., 2016, 9, 2939--2977 This journal is©The Royal Society of Chemistry 2016
because high ash content causes slagging. This is a problemencountered when herbaceous feedstocks are used. Still, ricehusk is frequently used in gasification all over Asia due to itseasy availability.
Bio-SNG is produced by syngas methanation at elevatedtemperatures of 800 1C to 1000 1C as shown in reactions (11)and (12). The conventional gasification processes employ thesereactions.208 One of the important benefits of Bio-SNG is itshigh octane number which is appropriate for spark-ignition (SI)engines. On the other hand, the low cetane number rendersit unsuitable for compression-ignition (CI) engines.209,210 Atambient conditions, Bio-SNG is present in the gaseous phase soit needs to be compressed and liquefied.
CO + 3H2 - CH4 + H2O(g) (11)
CO + H2O(g) - CO2 + H2 (12)
Syngas can be directly transformed to liquid HCs such as dieseland kerosene fuels and/or gases via a number of distinct pro-cesses, leading to a variety of bio-fuels.202 These transport fuelsinclude bio-alcohols such as methanol, ethanol, heavy straight-chain alcohol mixtures and liquefied gas such as DME.208 DMEshares the same method of production as bio-methanol, albeitit can also be produced via catalytic dehydration of bio-methanol. It finds significant applications such as diesel sub-stitute and cooking.211–213 Fig. 13 shows the different pyrolysisand gasification routes taken to produce bio-fuels.
Interestingly, it is possible to produce SNG (a mixture of H2,CH4, CO and CO2) at low temperatures (250 1C to 400 1C)without producing tars. This is achieved by gasifying feedstockunder the influence of catalysts and within supercritical waterin a process known as SCWG.205,206 This method is especially
applicable for wet biomasses which are otherwise unsuitablefor conventional biomass gasification. Unfortunately, there areseveral issues related to this process: high energy requirements,wet biomass feeding problems and drop in gasification efficiencywith a rise in dry content in the feedstock.210
4. Parametric impact
There are many parameters which have a significant impact onthe product quality during biomass gasification. They includethe following:13,57,60,214–216
� Feedstock type, quality and inherent moisture content� Particle size and density� Operating conditions� Steam-(or other gasification gas)-to-biomass ratio (S/B)� Air equivalence ratio (ER)� Catalyst� SER – sorbent-to-biomass ratio
4.1 Feedstock and moisture content
The most prominent constituent of biomass is lignocellulose,which consists of the non-starch, fibrous part of plant material.Cellulose, hemicellulose and lignin are the three main elementsof biomass. These constituents play an indispensable role duringthermochemical conversion processes such as BG.16,217 Normally,in a typical biomass, the cellulose-to-lignin ratio varies from 0.5 to2.7 and hemicellulose-to-lignin ratio ranges from 0.5 to 2.0. Theproportion of cellulose and hemicellulose are directly related tothe gaseous products yield, while the lignin content determinesthe oil in the product. Therefore, the higher the ratio of celluloseand hemicellulose to lignin in a given biomass, the higher thegaseous product yields from gasifying it.
Fig. 13 Biomass gasification and pyrolysis routes to synthetic biofuels.208
Review Energy & Environmental Science
Ope
n A
cces
s A
rtic
le. P
ublis
hed
on 0
2 Ju
ne 2
016.
Dow
nloa
ded
on 1
4/12
/201
7 15
:54:
47.
Thi
s ar
ticle
is li
cens
ed u
nder
a C
reat
ive
Com
mon
s A
ttrib
utio
n-N
onC
omm
erci
al 3
.0 U
npor
ted
Lic
ence
.View Article Online

This journal is©The Royal Society of Chemistry 2016 Energy Environ. Sci., 2016, 9, 2939--2977 | 2957
Predominantly, two types of moisture content are taken intoconsideration in a biomass feedstock, namely the intrinsicmoisture, which is the water content of the material withouttaking the impact of weather into account; and the extrinsicmoisture, which incorporates the influence of weather conditions.The characteristics of the exit gases and optimal operation ofthe gasifier depend on the moisture content to a significantextent. Woody and low-moisture herbaceous biomasses containless than 15 wt% moisture. This makes them more suitable forthermal conversion, since most gasifiers are designed toaccommodate biomass feedstock with a moisture content of15–30 dry wt%. The problem with high moisture content is theenergy penalty associated with drying the biomass beforegasification.
For every kilogram of moisture in biomass, at least 2260 kJof extra energy is needed to evaporate the water and that spentenergy is not readily recoverable.9
The moisture contents of some biomass varieties are shownin Table 6. It can be clearly seen that fir, Danish pine, rice husk,and wheat straw are preferred over rice straw, food waste, cattlemanure, and water hyacinth for BG, on account of the lowmoisture content. The low moisture content is favorable since ithas a lower energy penalty in the drying process prior togasification.
Researchers found that as the biomass storage time increasesso does its moisture content. This is a common notion; however,its moisture can also be decreased depending upon the typeof seasoning adopted prior to its use as a biomass fuel.218
Therefore, in almost all cases, by the time feedstock enters thegasifier, the moisture content is likely to be higher than thereported or supplied value. This is something that has to beaccounted for in the design of the reactor.214,219 Updraft fixedbed gasifiers can tolerate a maximum moisture content up to60% (wet% basis) whereas downdraft gasifiers can work effi-ciently with feedstock containing a maximum 25% (wet% basis)moisture.9 Usually, drying is done prior to gasification tocounter this problem. Schuster et al.220 established that afeedstock with more than 30 wt% moisture adversely affects
the process temperature resulting in less gas produced, whichalso has a higher tar content. They concluded that biomassmoisture content has a secondary but still significant impact onthe thermal, chemical and overall efficiency of the BG process.It is, therefore, crucial that the actual moisture content isaccounted for while calculating the steam-to-biomass ratio.
4.2 Particle size and density
Researchers have established the direct impact of feedstockparticle dimensions on the product gas yield.37,39,147,192,221,222
De Lasa and co-authors36 argue that temperature and particleheating rate have a vital influence on weight loss of biomassduring BG. Fluid-particle heat transfer is excellent in theparticles of smaller dimensions. More controlled gasificationis achieved if temperatures remain uniform throughout thefeedstock particle. In addition, rate of gasification is enhancedexponentially, according to the Arrhenius rate law, with increas-ing temperature only when internal kinetics control the gasifi-cation process.
It is observed that residual char yield is higher on account ofincomplete pyrolysis due to higher heat transfer resistanceoffered by larger particles.223 Enhancement in carbon conversionand amount of H2 was reported when the particle dimension wasreduced.224 Furthermore, a decrease in particle size improvessyngas efficiency and decreases tar yields.225–227 However, itshould be noticed that particle size should not be smaller thanthat needed, as particle size reduction requires intense energy.36
Downdraft and updraft fixed bed gasifiers are less sensitive toparticle size (o51 mm) than are entrained flow gasifiers, owingto the longer particle residence times within them. Entrainedflow gasifiers should have particle sizes of up to 0.15 mmmaximum.228 Fluidized bed reactors have an intermediatetolerance of less than 6 mm for feed size.9
Normally biomass feedstocks have low density with a porousstructure. Kirubakaran et al.229 suggested that the interactionsbetween reactants and products occur via non-restricted mole-cular transport. In addition, the low density of feedstock due tothe presence of numerous pores results in uniform temperaturethroughout the particles, which in turn manifests in homo-geneous gasification and uniform product composition. In densebiomass raw materials, temperatures vary from the exterior tothe interior of the pellet, resulting in simultaneous drying,pyrolysis and gasification. Consequently, a non-homogeneousgas composition is obtained.
4.3 Operating conditions
The partial pressure of the gasifying agent, temperatureand heating rate within the gasifier are other vital parameterswhich have the potential to influence the exit gas yield andoverall biomass conversion.36,221,230–236 Partial pressure of thegasifying agent has a direct relationship with the reactivityof biomass char while an increase in temperature generallyincreases the heating rate of the feedstock particles by provid-ing a greater temperature difference. Normally, the reactorpressure in EFG is between 20 and 70 bar.9 It has been shownthat a faster heating rate leads to greater gas production and
Table 6 Moisture content of some biomass species16,178
Type of biomass Moisture% (wet basis)
Water hyacinth 95.3Dairy cattle manure 88.0Rice straw 50.0–80.0Food waste 70.0Corn stalks 40.0–60.0Willow 60.0Wood bark 30.0–60.0Bagasse 45.0–50.0Poplar 45.0Saw dust 25.0–55.0Wheat straw 8.0–20.0Switchgrass 13.0–15.0RDF pellets 25.0–35.0Rice husk 7.0–10.0Miscanthus 11.5Danish pine 8.0Fir 6.5
Energy & Environmental Science Review
Ope
n A
cces
s A
rtic
le. P
ublis
hed
on 0
2 Ju
ne 2
016.
Dow
nloa
ded
on 1
4/12
/201
7 15
:54:
47.
Thi
s ar
ticle
is li
cens
ed u
nder
a C
reat
ive
Com
mon
s A
ttrib
utio
n-N
onC
omm
erci
al 3
.0 U
npor
ted
Lic
ence
.View Article Online

2958 | Energy Environ. Sci., 2016, 9, 2939--2977 This journal is©The Royal Society of Chemistry 2016
less tar production. Furthermore, a slower heating rate canactually lead to lower gas yields and higher tar yields. These twoheating rate operations largely influence the design of thegasifier and the desired product. The slower heating rate leadsto a higher tar production rate owing to the recombinationof lower-volatility hydrocarbons on the surface of the charparticles. In addition, a higher temperature can lead to anincrease in the degradation of the tars by transforming them tothe product gases. This is caused by the volatilization of theactive components of tar. The Boudouard reaction (13) and thethermal cracking reaction (14) effectively degrade residual charand tar when the temperature is increased.231 Therefore, main-taining a high temperature can contribute productively for BGwhen product gas is the desired product. Reactor temperaturein fixed bed gasifiers is normally around 1100 1C, although UGrequires more time to reach the working temperature than DG.Temperatures in FBG are normally kept below 1000 1C to avoidash fusion and agglomeration. EFG works at an elevatedtemperature of greater than 1900 1C.9
C + CO2 - 2CO + 172 kJ mol�1 (13)
Tar + heat - CO2 + CO + H2 + CH4 + coke (14)
4.4 Steam-to-biomass ratio (S/B)
The ratio of steam to biomass is an influential parameter thataffects the input energy requirements, outlet gas quality andproduct yields. Low S/B ratios result in higher amounts of char andCH4 whereas increasing S/B positively enhances the reformingreactions by providing an oxidative environment, thereby raisingthe oxidized product gas yield.15
Increasing S/B results in a higher H2 yield and thereforethe syngas has high calorific content. It also produces a lowamount of tar. This is due to water gas shift, reformingand cracking reactions.237 Sharma et al.238 demonstrated anexistence of threshold limit beyond which any increase in S/Bproduces excess steam in the syngas. Energy contained in theexcess steam along with enthalpy losses in generating thissteam, result in reducing process efficiencies. It also negativelyinfluences the temperature inside the gasifier which in turnresults in low tar cracking. Such issues necessitate identifyingan optimum S/B in steam biomass gasification. Usually fixedbed gasifiers have the highest capacity for S/B followed byfluidized reactors and entrained flow gasifiers.9
4.5 Air equivalence ratio (ER)
The ratio of actual air provided to stoichiometric air needed forthe process is known as air equivalence ratio (ER) and is one ofthe important parameters in gasification. Narvaez et al.237
observed that H2 and CO fractions in syngas are inversefunctions of ER. Higher ER results in lower H2 and CO yields,with an increase in CO2 amount. This reduces the calorificcontent of the product gas. On the other hand, a high ERaids in cracking tar on account of higher O2 availability forvolatile species to react with. However, a negligible effect of ERwas reported on nitrogenous products, during gasification.
Zhou et al.239 demonstrated a small rise in NH3 yield when ERis increased from 0.25 to 0.37 at 800 1C, employing saw dust asfeedstock. Bed temperature has a positive impact and increaseslinearly with ER provided feeding-rate is kept constant.36 ER isalso influenced by the amount of moisture and volatiles presentin the feedstocks.240,241 A moisture content up to 15% results inan increase in ER and gas amount but the presence of moistureabove 15% causes irregular temperature variations. A highvolatile fraction in biomass feedstock produces higher tar yield.
Gasification takes place in an air-deficient environment.9 Indowndraft gasifiers, ER B 0.25 gives an optimal product gasyield. A lower ER results in incomplete char-to-gas conversionand hence is desirable in the case of charcoal as a finalproduct.242 In FBG, efficiency is enhanced with the value ofER B 0.26 due to high combustion heat, and then declines. Thesame reasoning holds for higher bed temperatures in FBG.In practical scenarios, an optimum value of ER B 0.2–0.3 isdesired. If it is less than 0.2, it results in incomplete gasificationand hence, more char formation, with a low-calorific productgas, while higher ER will alter gasification into combustionat the cost of overall efficiency.243–246 Oxidant requirement ishighest in entrained flow gasifiers (usually 20% higher).9
4.6 Catalysts
Catalysts ease the thermal and mass transfer resistance throughthe particles while providing an alternative lower-energy pathwayfor the reaction to proceed and, hence, they play an importantrole in BG. Many researchers have found a positive impact ofusing catalysts to promote the gasification and reformation ofthe products. Catalysts can be employed in situ or after gasifica-tion reactions.9
Some of the types of catalysts that have been studied arealkaline (predominantly Na and K) metal, alumina and zeolites,dolomites and limestones, Ni-based, Zn-based, as well as someother exotic and rarer metals such as platinum- and ruthenium-based materials. Alkaline metal oxides, dolomite and Ni-basedcatalysts have a favorable effect on gasification extent becauseof their ability to promote the reformation reactions.189
Alumina silicates are found to be more effective at enhance-ment of char gasification, whereas Ni-based catalysts are moreeffective at the conversion of lighter hydrocarbons.247 Still,advancement to more efficient and economical catalysts isunder progress, with the aim being to enhance the qualityand yield of the desired product while minimizing the residualchar and tar.58,63,137,247–249
4.7 SER – sorbent-to-biomass ratio
Olivares et al.,58 amongst others, classified biomass as acarbon-neutral fuel, since it has already captured CO2 whilegrowing. They further stated that it can be a carbon-negativefuel, if the CO2 produced is captured and stored, duringgasification of biomass. Researchers have studied many materials,including aluminum oxide, dolomite, metal-based sorbents,Ni-based sorbents and rhodium, for their role as sorbents inbiomass gasification.13,139,147,148,250–260
Review Energy & Environmental Science
Ope
n A
cces
s A
rtic
le. P
ublis
hed
on 0
2 Ju
ne 2
016.
Dow
nloa
ded
on 1
4/12
/201
7 15
:54:
47.
Thi
s ar
ticle
is li
cens
ed u
nder
a C
reat
ive
Com
mon
s A
ttrib
utio
n-N
onC
omm
erci
al 3
.0 U
npor
ted
Lic
ence
.View Article Online

This journal is©The Royal Society of Chemistry 2016 Energy Environ. Sci., 2016, 9, 2939--2977 | 2959
Investigators found that solid sorbents have a better efficiencyfor CO2 capture during BG in comparison to liquid sorbents.147,250
CaO has also been suggested as a good choice.253,256,260 Harrisonet al.261–263 and other researchers15 established the basic idea forthe usage of sorbent is that it removes CO2 from the gasificationreactions thus shifting the equilibrium, which in turn enhancesH2 yield. Therefore, usage of a suitable sorbent in steam gasifica-tion of biomass is desirable provided it does not hamper theeconomic considerations.
5. Tar
Tar is a significant potential problem in the gasification ofbiomass as it can lead to equipment blockages, increasedmaintenance and makes operation difficult. It is usually a thick,dark-coloured liquid with a low condensation temperature andhence can lead to blockages in downstream equipment.In particular, light-(C2–6) hydrocarbons can actually avoid con-densation and instead form tarry aerosols, which in turndegrade the quality of outlet gas and potentially make itunsuitable for use in high-purity applications, e.g., applicationsother than boilers.17,264,265 The approximate weight percen-tages of key components of tar are listed here: benzene(38%), toluene (14.5%), single-ring aromatic HCs (14%),naphthalene (9.5%), dual-ring aromatic HCs (8%), heterocycliccompounds (6.5%), phenolic compounds (4.5%), triple-ringaromatic HCs (3.5%), quadruple-ring aromatic HCs (1%), andother compounds in trace amounts.
One standard classification of tar is by molecular weight.266
The classes are presented in Table 7.Different gasifiers with different desired products can lead
to a diverse tar yield and relative component concentrations.Basu et al.17 reported that by average tar production, the orderof reactor types was EFG (B0.4 g Nm�3) o DG (o1 g Nm�3) oFBG (10 g Nm�3) o UG (50 g Nm�3). As a reference, fuel cellshave minimum tar tolerance less than 1 g Nm�3 and gasturbines have a tolerance between 0.05 and 5 g Nm�3. Further-more, internal combustion engines can endure a tar concen-tration of up to 100 g Nm�3 and compressors can bear up to500 g Nm�3. There is no limit on tar presence if the fuel gas isused for direct combustion (e.g. in a boiler), provided thegasifier outlet and burner inlet do not allow the gas to cooldown below the dew point of tar. However, flue gas producedafter burning should be in accordance with the local emissionstandards.
Tar minimization methods are classified as primary or secondarydepending upon the location of tar removal. Tar degradationmethods are also divided into mechanical, thermal, catalytic, self-modification and plasma.267 Modelling of tar will not be pre-sented in great depth within this review but for more informationthe reader is recommended to consult the work by Font Palmaet al.184 who gave a detailed review of tar modelling.
5.1 Tar production
During the heating of biomass, the order of mass loss is asfollows: first, moisture evaporation takes place from 30 1C to120 1C, followed by hemicellulose breakdown between 150 1C to220 1C, lignin breakdown around 220 1C to 400 1C and cellulosebeing the most stable around 315 1C to 450 1C. Lignin degradesover the widest range due to the diverse range of chemicalstructures and bonds present.268 Devolatilization and biomassconversion can occur across a range of temperatures for differentkinds of biomass; this is commonly investigated using thermo-gravimetric analysis (TGA).
Zhang et al.269 conducted experiments with sawdust toanalyze pyrolysis, gasification and oxidation conditions, andfound that pyrolysis at 600 1C produces primary tars whereaspyrolysis and gasification yield secondary and tertiary tarsat around 900 1C to 1000 1C. They also found substantial tardegradation during pyrolysis, steam gasification and oxidationabove 1100 1C. During pyrolysis, dehydrogenation of cellulose,hemicellulose, lignin and carbon gasification generate H2 asshown in (15). Condensable volatile gasification is shown in(16) and water–gas-shift is shown in (17).
C(char) + H2O - CO + H2 �131.37 kJ mol�1 (15)
CxHyOz + H2O - CO + H2 + tar endothermic (16)
CO + H2O 2 CO2 + H2 +41.1 kJ mol�1 (17)
where, CxHyOz represents tar species in the intermediate phase,which eventually decompose to generate gases and final tars.Partial combustion reactions are depicted in (18) and (19).
C(char) + 12O2 - CO +110.87 kJ mol�1 (18)
CxHyOz + 12O2 - CO + H2O + tar exothermic (19)
Reactions (20) and (21) are endothermic in nature so theirreaction rate increases above 1000 1C, reflected by the increasein CO production. In pyrolysis and gasification, above 900 1C,
Table 7 Tar classification
Basis of classification Nomenclature Compound name Example Temperature of formation
Appearance266 Primary Oxygenated compounds Syringols, furans 400–700 1CSecondary Aromatic compounds Phenolics, olefins 700–850 1CTertiary Complex aromatic compounds Toluene, indene 850–1000 1CClass-I GC-undetectable tarsClass-II Heterocyclic compounds Phenol, cresol
Molecular weight266,267 Class-III 1-Ring aromatic compounds Xylene, tolueneClass-IV 2–3-Ring aromatic compounds Naphthalene, phenanthreneClass-V 4–7-Ring aromatic compounds Fluoranthene, coronene
Energy & Environmental Science Review
Ope
n A
cces
s A
rtic
le. P
ublis
hed
on 0
2 Ju
ne 2
016.
Dow
nloa
ded
on 1
4/12
/201
7 15
:54:
47.
Thi
s ar
ticle
is li
cens
ed u
nder
a C
reat
ive
Com
mon
s A
ttrib
utio
n-N
onC
omm
erci
al 3
.0 U
npor
ted
Lic
ence
.View Article Online

2960 | Energy Environ. Sci., 2016, 9, 2939--2977 This journal is©The Royal Society of Chemistry 2016
secondary degradation of light HCs and some tar species is themajor reason for coke formation as depicted in reaction (22).
C(char) + CO2 - 2CO +172.79 kJ mol�1 (20)
CxHyOz + CO2 - CO + H2O + tar endothermic (21)
CnHm - (m/2)H2 + nC (22)
Therefore, the carbon conversion rate is very significantlyenhanced above 1000 1C and 1100 1C, with a drop in cokeand CO2 yield and an increase in CO and H2 generation. Thisreflects the significance of understanding the pyrolysis reactionmechanisms of tar precursors when attempting to predict tardegradation during biomass gasification.
Lignin is an intricate and vastly cross-branched polymer ofphenylpropane linked to other smaller chemical constituents.Water, phenolics and gases are the common groups producedduring lignin decomposition.270,271 However, it is uncertainwhether they are derived from the original structure or if theyare the result of reactions with previous products or otherreactant gases added into the system.
Cellulose is also a primary constituent of plant cell walls’structure and is responsible for primary tar compounds. Thesecompounds from cellulose degradation apart from levoglucosan,can include furfurals, hydroxyacetone and organic acid.272 Hemi-cellulose is the least stable constituent among all the others inbiomass; it degrades faster and at a lower temperature.273 Xylanis the main hemicellulose component of hardwoods andsoftwoods and its degradation yields acids, phenols, aldehydes,ketones and esters with small amounts of other carbohydratesalso produced.272
5.2 Tar measurement and development
Analytical approaches have been evolved over the decades todefine the composition of biomass, such as fractionation ofbiomass samples followed by quantification of isolated andpurified fractions. Although these conventional methods arevalidated by the American Society for Testing and Materials(ASTM), they are time consuming and costly and, therefore, arenot frequently applied in commercial applications.175,184
Over the past few years, analytical techniques such as NearInfrared (NIR) spectroscopy, Thermogravimetric Analyses (TGA)coupled with spectrometers, and TGA coupled with DifferentialThermogravimetric Analyses (DTG) have been employed toquantify isolated fractions obtained from the fractionation ofbiomass samples. These methods offer an advantage over thetraditional methods as they are cheaper, precise and rapid.175
5.3 Tar minimization
Fundamentally, tar minimization is divided into two differentclassifications depending upon the location where tar is deposited.If tar is degraded inside the gasifier it can be referred to asprimary tar reduction, which requires an appropriate selectionof functional parameters discussed earlier such as the designof the gasifier and the use of catalysts during gasification.Secondary methods include thermal, mechanical or catalytic
cracking of tar in a separate step after BG where the tar isdeposited further downstream.264
Self-modification can reduce tar to a considerable extent justby varying operating parameters. Luo and co-authors224 haveexplored the significance of particle size on tar formationthrough extensive experimental investigations. They employedpine saw dust of variable particle sizes in a fixed bed gasifica-tion system. Higher amounts of dry gas and improved carbonconversion with lower tar yields were observed with smallerparticles at the same temperature on account of enhancedthermal conductivity. Smaller particles (o0.075 mm) producedlow tar (0.4%) whereas particles with 0.075 to 0.6 mm sizesgenerated higher amounts of residual solids and tar, at 700 1C.The largest particles with 0.6 to 1 mm sizes gave maximum charand tar yield (410%) even at an elevated temperature of 900 1C.This can be explained on the basis of heat transfer. Gasificationis kinetically controlled with smaller feedstock particles, whilelarger particles offer resistance to thermal conductivity leadingto incomplete devolatilization and higher tar yields.
Mahapatra et al.274 evaluated the influence of surface area-to-volume ratio of biomass raw material in a packed bed gasifier.They concluded that a larger surface area-to-volume ratio leadsto a higher pyrolysis rate which results in increased amounts ofhigher molecular weight compounds as fast pyrolysis products.
It should be noted that closed-top fixed bed gasificationsystems generate higher tar yields as compared to open-topfixed bed systems. Elaborate tests were performed in a colla-borative India–Switzerland project and it was demonstratedthat open-top gasification systems produce the lowest amountof tar and particulates vis-a-vis other gasification systems.25 It ison account of the establishment of front moving propagationtoward the top end of the gasifier due to dual air entry from thetop and nozzles. This ensures higher residence time for gasesat high temperatures and degradation of higher molecularweight species.
With reference to the secondary tar removal and destructionstrategy, tar minimization is categorized in numerous ways267
as presented in Table 8. Mechanical methods are further sub-classified into dry gas cleaning and wet gas cleaning. Dry gascleaning removes tar from the product gases using cyclones,rotating particle separators and a variety of filters. Wet methodsemploy electrostatic precipitators, wet scrubbers, solvent extrac-tion and wet cyclones. Wet treatment of the gases also requirestreating of the collected waste H2O from the gas treatmentsystem.275 Tar yield is an inverse function of the operatingtemperature.276 An inverse relationship is also reported betweenthe tar yield and equivalency ratio. Knight et al.277 providedevidence experimentally with wood chips in a FBG which sug-gested that an increase in pressure from 8 bar to 21 bar degradesoxygenated components like phenols into PAHs.
Other methods of minimizing tar production include plasmagas cleaning and thermal methods, as discussed in the earliersection – Emerging approaches. Plasma gas cleaning can beemployed to minimize both tar and particle quantities. Nairet al.278 found that the naphthalene content was reduced byhalf with 40 J L�1 of corona discharge at 400 1C over 3 minutes.
Review Energy & Environmental Science
Ope
n A
cces
s A
rtic
le. P
ublis
hed
on 0
2 Ju
ne 2
016.
Dow
nloa
ded
on 1
4/12
/201
7 15
:54:
47.
Thi
s ar
ticle
is li
cens
ed u
nder
a C
reat
ive
Com
mon
s A
ttrib
utio
n-N
onC
omm
erci
al 3
.0 U
npor
ted
Lic
ence
.View Article Online

This journal is©The Royal Society of Chemistry 2016 Energy Environ. Sci., 2016, 9, 2939--2977 | 2961
The thermal method uses cracking of tars into lighter HC gasesby employing high temperatures. Fagbemi et al.279 showed thatat high temperatures the products which are mainly char aretransformed to gases and, therefore, it is easier to determine aresidence time. Then using this residence time, a reactor can bebuilt to maximize the overall conversion. This does, however,lead to greater char production in the process of tar removal.
Most of the work for tar minimization has been done in thearea of catalytic cracking of the tar because of the multipleadvantages of catalytic degradation compared to the alternativespreviously mentioned.61,66,280–283 Catalytic cracking, decomposi-tion and reforming of biomass can enable a near-completeelimination of tars. Catalysts are able to degrade comparativelystable compounds such as aromatics and PAHs. Catalysts withinthe gasifying reactor not only minimize tar to a significant extentbut they also enhance the quality, quantity and heat contentof the produced gas. The most commonly applied catalysts areNi-based (on Al2O3 or SiO2 or dolomite, etc.), alkali metal-based(K2CO3), basic catalysts (MgO, CaO, etc.), acid catalysts (zeolite,silica–alumina, etc.) and activated carbon.275 Nickel-basedcatalysts are usually used when syngas or H2 is the desiredoutput. Ni is characterized by high catalytic activity for thereformation reactions but its resistance to sulphur poisoning,sintering and carbon deposition strongly depends on thesupport material, promoters and other additives that are utilizedin its manufacture.275 Ni-based are the best reforming catalystsfor industrial applications in BG. However, they require the rightenvironment and cheap carbon sorbents to have a profoundeffect. Some limitations are also present with non-Ni metalcatalysts, in particular those containing expensive, noble metalslike rhodium.284 Development in known catalysts and workinto new, more novel catalysts are promising options for tarminimization.
6. Power generation methods
Biomass gasification was initially conceived to utilize organicwastes to produce usable products such as fuel gas or a chemicalfeedstock. Later, the technology was extended to treat hazardouswaste, with the invention of plasma BG, along with powergeneration. Examination of the distinctive characteristics of
supercritical water led to SCWG for wet biomass which isotherwise untreatable by gasification, due to technical limita-tions of the former gasification technologies. Advancement inBG paved the way for the poly-generation concept where two ormore usable products are generated, for instance, co-generation ofthermal power with electricity; poly-generation of heat, fertilizerand bio-char; poly-generation of heat, SNG/bio-fuels; and poly-generation of H2 with heat and electricity. All these approachesnot only optimize the thermal efficiency of the process but alsoprovide flexibility and sustainability, thereby enhancing theeconomic advantage in the long run.
6.1 Existing applications
6.1.1 Power generation. Electricity production from theproducts of BG is just one potential application which hasrecently gained ground over conventional combustion. However,this is widely driven by emission legislation changes and thesimplicity of the application rather than economic or technol-ogical advances. Syngas is a highly desirable product. However, itcarries particulate matter and lighter HCs produced duringgasification. Post gas clean-up, it can be combusted in conven-tional burners employing steam cycles for electricity generation.The gas clean-up stage has a variety of available methods:mechanical cleaning, catalytic treatment, thermal treatmentand plasma cleaning. This is one of the most decisive and costlysteps which decides the final application of the exit gases.Unfortunately, there have been closures of some BG electricityproduction plants due to technical issues regarding gas-clean upand ash problems.285
Combustion of the syngas can be undertaken within aboiler, which is commonly employed in case of low-qualitygas. However, the net efficiency of such boiler-based electricitygeneration is B20%, which when compared to a maximum ofB38–50% for conventional gas engines and gas turbines is aless attractive commercial choice. Gas engines have emerged asa promising technology for dispersed power production. This isdue to their compact nature, power generators’ long-standingexperience with natural gas engines, the potential to capturewaste heat easily, simplified process technology and low invest-ment and operational costs at a large scale.286 A schematic isshown in Fig. 14 presenting conventional multi-generation
Table 8 Post-combustion tar elimination methods
MethodSub-classification Technique used Details/examples
Mechanical method275 Dry Usage of mechanical device or equipment Cyclone, rotary partial separator, fabric filter, ceramicfilter, activated carbon adsorber, sand bed filter
Wet Usage of mechanical device or equipment Electrostatic precipitator, wet cyclone, wet scrubberSelf modificationmethod276
Alteration in gasifier design andoperational variables
Appropriate operating parameters like temperature,pressure, equivalence ratio, gasifying media, biomasstypes along with gasifier design are selected
Thermal cracking267,279 Application of high temperature withresidence time
Maximum tar destruction was found at 1250 1Cand 0.5 s
Catalytic cracking275 Usage of appropriate catalyst Tar cracking catalysts are divided into 5 major groups,namely Ni-based, non-Ni-based, alkali metal-based,acid catalysts, basic catalysts and activatedcarbon-based catalysts
Plasma method278 Application of high energy corona discharge —
Energy & Environmental Science Review
Ope
n A
cces
s A
rtic
le. P
ublis
hed
on 0
2 Ju
ne 2
016.
Dow
nloa
ded
on 1
4/12
/201
7 15
:54:
47.
Thi
s ar
ticle
is li
cens
ed u
nder
a C
reat
ive
Com
mon
s A
ttrib
utio
n-N
onC
omm
erci
al 3
.0 U
npor
ted
Lic
ence
.View Article Online

2962 | Energy Environ. Sci., 2016, 9, 2939--2977 This journal is©The Royal Society of Chemistry 2016
approaches. The syngas generated is used in diversified appli-cations such as IC engines, Stirling engine, gas engines, steamand gas turbines.
6.1.2 Producer gas-driven internal combustion (IC) engine.The heating value of the produced gas is a primary factor inevaluating the potential power of the engine. Syngas is blendedwith air prior to induction into the cylinder in order to improvethe likelihood of complete combustion, as is done with allinternal combustion engines. The heating value is reported tobe about 2500 kJ m�3, which is relatively low compared to thepetrol–air mixture heating value of 3800 kJ m�3. Consequently,there is a substantial power loss of about 35%.287 Since thevolume of the cylinder remains constant for a particular engine,the amount of combustible gas entering the cylinder is depen-dent upon the gas pressure. When the engine is combined witha fixed bed gasifier, there is an important drop in pressure atthe inlet of the IC engine. On account of this pressure drop, thevolumetric efficiency is significantly reduced. Consequently,the amount of exit gas mixture in the cylinder is reduced.This adversely affects the IC engine power output. However,by using a booster, this pressure drop can be reduced to 1%.In addition, the number of strokes per unit time is reducedwhen an IC engine is fueled by the syngas mixture due to thelower heating value.
A potential solution to this drop in power output is toenhance the compression ratio (volume of the gas beforecompression to the volume post compression) from around8 to 12 by increasing the H2 percentage in the inlet gas.287 Thisincrease in compression ratio does raise the engine powerbut is limited by the increased potential for vibrations andknocking which are responsible for reduced engine life.209
6.1.3 The Stirling engine. The main problem with gasificationproduct gas is the presence of tar and alkali metals in low amountsproduced from eutectic mixtures at elevated temperatures.Some researchers examined the Stirling engine as a substitutefor the IC engine. It was proposed that this was a feasible
option on account of the low operating costs, low lubricantrequirement, better efficiency and the simple design whichdoes not demand a highly pure gas.288
6.2 Advanced concepts
6.2.1 Co-generation of thermal energy with power. Powergeneration is the most common goal of BG. Despite this, it isinevitable that during this process heat is also generated, andas with other combustion processes in recent years, the idea ofco-generating heat and power has become highly attractive.This idea provides a useful resource with a profitable secondarymarket that makes use of what was previously a waste stream.Power can be effectively transmitted over long distanceswith minimal losses but thermal losses prohibit heat transferover a similar distance. This constrains the location of theco-generation plant and, therefore, it must be placed nearthe producer. Small decentralized co-generation plants areestablished and are successfully in operation across the world.Indeed, the B&W Harboøre installation has run two Jenbachergas engines (648 kWe and 648 kWe upgraded in 2001 to768 kWe) for over 120 000 hours of operation in a CHP context.This is notable since the gasifier is an updraft gasifier.289
Additionally, a 26 MWth plant in Denmark and a 15 MWth
plant in Germany started in 2006 and 2012, respectively.290,291
Cogeneration units can provide heat and power to industrial,commercial and residential buildings. Co-generation ofheat and power by biomass combustion is prevalent,292 albeitgasification is better in terms of electrical efficiency andthe acceptable range of biomass qualities.89,285 However, manyco-generation units for the production of thermal energy withelectricity employing gas engines are installed and workingsuccessfully around the globe.89,285,290,291,293–298
Many researchers have investigated the co-generation strategyto enhance electricity production.42,290,291,299–313 Investigatorshave coupled a Rankine cycle with two gas engines, whichadditionally transforms 10–15% of heat into electricity, andimproves biomass power efficiency from 25–30% to 40% ormore.290,291 Another tactic to optimize the efficiency is tocouple gas and steam turbines to generate power. This iscommonly referred to as Integrated Gasification CombinedCycles (IGCC). This approach has a reported efficiency of 46%for coal gasification and power efficiency of around 32% forbiomass gasification.307,308
6.2.2 Fertilizer and bio-char production. This concept,which has been mentioned earlier in this paper under ‘multi-stage biomass gasification concept’, uses two different reactors forpyrolysis and BG. The absence of PAH opens the door to utilizeash as a fertilizer, for some gasifiers. Some researchers314 havealready investigated the ash content from LT-CFB. A surprisingand welcome finding was that the ash contained 40% calcium,up to 6% phosphorus and 5% Fe with traces of heavy metals.This makes it feasible to re-circulate nutrients.315 Studies werecarried out on fields with different plants. It was found thatleaching of the nutrients was lower and the phosphorus uptakewas identical to that from conventional fertilizer. However, aninitial delay was noted for the plants’ take-up of phosphorus,
Fig. 14 Flow chart of conventional multi-generation scheme employingbiomass gasification.
Review Energy & Environmental Science
Ope
n A
cces
s A
rtic
le. P
ublis
hed
on 0
2 Ju
ne 2
016.
Dow
nloa
ded
on 1
4/12
/201
7 15
:54:
47.
Thi
s ar
ticle
is li
cens
ed u
nder
a C
reat
ive
Com
mon
s A
ttrib
utio
n-N
onC
omm
erci
al 3
.0 U
npor
ted
Lic
ence
.View Article Online

This journal is©The Royal Society of Chemistry 2016 Energy Environ. Sci., 2016, 9, 2939--2977 | 2963
which in turn suppressed plant growth. Acid removal by extractinglime solved the problem, making ash a promising substitute formineral fertilizer.
This gasification technology can also support the enhance-ment of the amount of organic carbon in soil, which has anadditional benefit of being a method of sequestering carbon.The term, ‘Bio-char’, has been coined to describe char whichhas been deliberately left un-gasified and is added to farm soil.Bio-char is known for recirculating organic carbon back intothe ground and aiding in ionic adsorption, thus preventingleaching of vital nutrients and minerals into ground water.316
In addition, enhanced water holding capability results whenbio-char is mixed with sandy soils.317–319 Although leavingsome char un-gasified would decrease the efficiency of the BGprocess, it may provide a carbon-neutral alternative for fertilizerand bio-char production.
6.2.3 Poly-generation of heat, power and hydrogen. Hydro-gen from BG has found numerous applications. Air as agasifying medium gives a low H2 purity in the produced gasesbecause of dilution by N2. CO2 as gasifying agent enhances COcontent through the Boudouard reaction (13). On the otherhand, gasification in the presence of O2 or steam generatesH2-rich gas because of steam reforming and the water–gas-shiftreaction (17) that take place. This also has an impact on theheating values of the gases generated. Obviously, more H2, CH4
and CO in the gas would be beneficial over CO2.Some researchers have modelled H2 generation in conjunc-
tion with heat and power production.320–324 H2 productionfrom rice husk in BG with O2 as the gasifying agent was studiedtheoretically.323 Investigators used two Rankine thermodynamiccycles during power generation for maximal heat retrieval witha H2 production efficiency of 40%. Electric power generationefficiency was 3.25% in the absence of CO2 compression forstorage and 1.5% with compression. Poly-generation of H2,thermal energy and electricity was also modelled by investiga-tors to evaluate H2 generation costs and process applicability inpractical scenarios.320 Ten distinct processes were modelledemploying different reactors for BG, and an exergy analysiswas carried out for cases with and without thermal energyretrieval.321 Investigators also did thermo-economic modellingto inspect the repercussions of this new process to obtain H2,coupled with heat, electricity and CO2 sequestration. Theyfound positive effects when combining different sub-systemsto optimize thermal energy retrieval along with waste heatutilization.324
Apart from these theoretical investigations, large-scale experi-ments were also carried out under a project funded by theEuropean Union to examine heat and power production withH2 generation.322 Unique gasifiers, as mentioned in the earliersection of this paper, were coupled with a secondary reactor forH2O gas shift reactions and a pressure swing adsorption unit tocapture CO2. They report a H2 conversion efficiency of 466%.
6.2.4 Fischer–Tropsch process coupled with gasifier. In 1923,Franz Fischer, Hans Tropsch and Helmut Pichler inventedthe Fischer–Tropsch (FT) process in Germany. Presently, it isa well-known process to synthesize higher HCs using syngas
from gasification. It is a typical example of the Biomass-to-Liquid concept as depicted in Fig. 15. Higher HCs such asdiesel and gasoline are generated via the FT process; these arenormally used as liquid fuels for the transportation sector. Alllarge-scale commercial plants hitherto are either based on CH4
reforming or coal gasification systems.325
Biomass gasification produces syngas which can act as a rawmaterial for an FT process. If the fraction of H2 is low in syngas,then a water gas shift reactor is needed prior to FT synthesis.Syngas is converted to liquid fuels and/or chemicals via theFT process in the presence of Co-based or Fe-based catalysts.Co-based catalysts require higher H2 content in the syngas forfuel production. However, their productivity is more at higherconversion levels, than Fe-based catalysts.326
Climate change and fossil fuel depletion necessitate renew-able transportation fuels. The gasifier-coupled FT plant conceptpresents an encouraging option in this regard. Investigationsprove that FT fuels result in low emissions when employed inIC engines on account of the low volume of nitrogenous andaromatic species. Furthermore, these fuels do not containsulphur which is considered as one of the major pollutants inIC engine exhaust gases.327 This process presents a promisingalternative for the production of renewable liquid fuels. TheFT process coupled with gasification is a feasible option toreduce the burden on conventional transportation fuel; however,it requires significant development and scale-up efforts forcommercial-scale installations.
6.2.5 SNG and other biofuels. Bio-SNG or SNG is a potentialsubstitute for natural gas, with similar chemical composition,and thus benefits from the use of pre-existing transportationand storage facilities. Several researchers have investigated SNGgeneration from the gasification of diverse feedstocks for processoptimization and applications.328–332
All methanation reactions (23)–(25) are exothermic innature.9 Detailed methanation processes and clean-up techni-ques are mentioned in the literature.333–335
2CO + 2H2 - CH4 + CO2 �247 kJ mol�1 (23)
CO + 3H2 - CH4 + H2O �206 kJ mol�1 (24)
CO2 + 4H2 - CH4 + 2H2O �165 kJ mol�1 (25)
Fig. 15 Flow chart depicting FT-fuel synthesis from biomass.
Energy & Environmental Science Review
Ope
n A
cces
s A
rtic
le. P
ublis
hed
on 0
2 Ju
ne 2
016.
Dow
nloa
ded
on 1
4/12
/201
7 15
:54:
47.
Thi
s ar
ticle
is li
cens
ed u
nder
a C
reat
ive
Com
mon
s A
ttrib
utio
n-N
onC
omm
erci
al 3
.0 U
npor
ted
Lic
ence
.View Article Online

2964 | Energy Environ. Sci., 2016, 9, 2939--2977 This journal is©The Royal Society of Chemistry 2016
SNG has been investigated by some researchers for its use as atransportation fuel.328–330 SNG was reported to be more favor-able than other bio-fuels with lower environmental impacts.However, it requires some pre-treatment before usage, unlikeother bio-fuels. Furthermore, it has been suggested that SNGcan be economically generated on a small scale. This contrastswith bio-fuels, which require larger production scales to becost-effective.328 However, in the case of residential applica-tions such as cooking or heating, syngas has proved to be moreefficient than SNG, due to the efficiency drop incurred by thelatter for an extra processing step. Furthermore, it must beconsidered that syngas is more efficient as a fuel source for theproduction of electricity than SNG, using suitable equipment inIGCC plants, on account of the same reason.331
Liquid bio-fuels such as di-methyl ether (DME) or methanolare potential alternatives to oil-based conventional fuels such asgasoline or diesel on account of their suitable characteristics.Existing IC engine design, fuel filling station infrastructure andmarket acceptability coupled with low emissions make them apromising option over SNG or H2, though the main benefit ofany liquid fuel is energy density and ready transportation.Benefits of multi-production of bio-fuels coupled with thermalenergy and electricity production are similar to those forSNG multi-production.89 Researchers have investigated multi-production of heat, power and bio-fuels such as methanol,ethanol, methyl acetate, and FT diesel. They reported it tobe cost-effective, more favorable and flexible than separategeneration.336–339 However, it is less economical compared tofossil fuel generation when the oil price is low. This differencein economics could be mitigated by government-level subsidiesor larger-scale generation benefits.94,340,341
Current state of commercialization of SNG. Throughout thelast decade, many pilot plants have been installed to study thefeasibility of SNG generation from syngas.334,342–344 Sweden isthe first country to have a commercial unit to generate SNGfrom BG-produced syngas. The setup is located in Goteborg,with 20 MW capacity already installed out of a total of 100 MW.A 200 MW plant at Eon in Sweden was installed in March 2014and is working successfully.345–347 A 1 MW plant was estab-lished in Gussing, Austria, to produce SNG from BG syngas,and is also working successfully.348 Thorough investigationsundertaken by Wirth et al.344 demonstrated that in order for aBio-SNG plant to be economical, the installed size should beequal to or greater than 20 MW (output basis). This value wasbased on the inclusion of intricate and costly processes such asgasification, gas cleaning and conditioning, catalytic metha-nation and carbon dioxide removal.
7. Mathematical modelling ofgasification
Product gas characteristics and more general performancemeasures such as process economics and energy efficiency inBG depend on several parameters like the selection of a suitablegasifier as well as the choice and concentration of feedstock
and other variables.189 Operating conditions such as pressure,temperature and flow inside the gasifier need to be optimizedto achieve the desired performance. Evaluation of optimalconditions is frequently carried out through experiments whichare quite costly and time consuming.9
The solution to this problem is partially provided by math-ematical modelling, where models can be generated to evaluatea variety of conditions quickly and cheaply. This simulationwork saves time and resources and imparts qualitative data forreal-life scenarios, albeit not as precisely as the experimenta-tion work. Such models can be used to derive ideal conditionsand permissible limits for gasifiers operating at elevatedtemperatures and pressures. Thus, they also enable the safetyof the plant to be assessed before construction.349 It is also veryhelpful in testing various feedstocks and their behavior in differentkinds of reactors without actually building them. Generally, thesimulation of biomass gasification can be divided into 5 categories:
(i) Thermodynamic Equilibrium Models(ii) Kinetic Models(iii) Computational Fluid Dynamics Models (CFD)(iv) Artificial Neural Network Models (ANN)(v) Tar ModelsThermodynamic models aid in deriving outlet gas charac-
teristics for a specific set of conditions employing a specificgasifier. While generating a thermodynamic model, it is assumedthat reacting species are left for an infinite amount of time.31
It reveals the thermodynamic boundaries which exist for thegiven set of parametric conditions. Practically, it has beenfound that while the results reflect the system potential, theycan vary considerably from real-life scenarios, thus necessitatinga more accurate approach.
Kinetic modelling partially transcends this limitation. Itconsiders the kinetics of key reactions which occur inside thegasifier during biomass gasification, along with gasifier hydro-dynamics.350 It takes into account the process of biomassgasification for a fixed time and determinate volume, thus,making it more exact than the previous modelling method. Thedisadvantage is that although great strides have been made inthe last few decades, the kinetic pathways and reaction rateconstants are still not perfectly understood.
CFD includes a variety of processes such as heat and masstransfer, flow transfer, temperature dissemination, and gas yield,etc., by employing the solutions of numerous mathematicalequations.351 It is highly useful and can be quite accurate,though is complex.
ANN is a comparatively new approach which is analogous tomachine learning. When data from experiments are fed to themodel, it produces numerical results, learning by itself.352 Itsdrawbacks include the lack of analytical results and failurein the cases of limited data.
7.1 Thermodynamic modelling
Application of the first and second laws to reacting systems,together with species mass balances result in equilibriummodels, where the concentrations of reacting species minimizeGibbs free energy. Researchers have employed thermodynamic
Review Energy & Environmental Science
Ope
n A
cces
s A
rtic
le. P
ublis
hed
on 0
2 Ju
ne 2
016.
Dow
nloa
ded
on 1
4/12
/201
7 15
:54:
47.
Thi
s ar
ticle
is li
cens
ed u
nder
a C
reat
ive
Com
mon
s A
ttrib
utio
n-N
onC
omm
erci
al 3
.0 U
npor
ted
Lic
ence
.View Article Online

This journal is©The Royal Society of Chemistry 2016 Energy Environ. Sci., 2016, 9, 2939--2977 | 2965
models to study gasification in BG.353–359 Antonopoulos et al.353
examined the impact of temperature inside the reactor and H2Ocontent in the biomass (olive wood, miscanthus, and cardoon).They found that the reactor temperature was directly related toCO yield and inversely related to H2 and CO2 fractions in gas.In addition, they observed that the lower heating value of theoutlet gas was indirectly related to the reactor temperature. MoreH2O in the inlet was responsible for less net energy in the fuel,as additional energy was required to vaporize the H2O. Theirsimulation results were very close to the experimental data,reflecting the significance of thermodynamic modelling.
The impact of process variables, namely pressure, tempera-ture and feedstock moisture, while employing agriculturalwastes as biomass feedstock, were studied for biomass gasifica-tion by developing an equilibrium model.354 CH4 percentagewas found to be a function of increasing pressure insidethe reactor. However, this model was not very accurate andmiscalculated the H2 and CH4 yield. Babu et al.355 employed thereactivity of char in the reduction zone as the basis to constructan equilibrium model for a BG. They studied steady stateconfiguration and temperature contours over the entire lengthof the reduction area of the reactor. They validated the modellingresults with experiments and reported that the char reactivityfactor changed exponentially through the length of reductionzone in a BG. This research suggested the incorporation of anexponentially-varying char reactivity factor when constructingthermodynamic models to obtain more precise predictions.
Sandeep and Dasappa360 investigated air and oxy-steam bio-mass gasification based on the first and second law of thermo-dynamics. The model was generated for oxy-steam gasification inan open-top fixed bed downdraft gasifier with variable ER and S/B.At S/B of 0.75 (molar basis), maximum exergy efficiency obtainedwas 85% with energy efficiency of 82%. Drops in these efficiencieswere found on increasing S/B on account of enthalpy loss in steamgeneration coupled with physical exergy loss of steam (in theproduct gas). Furthermore, decreases in efficiencies were observedfor air gasification due to the presence of N2. A carbon boundarypoint was observed at S/B of 1.5 and ER of 0.23. This studydemonstrated that higher S/B is needed for high H2 yield whilelower S/B ensures an efficient process with high energy syngas.
Rokni and co-authors361 developed an equilibrium model forMSW gasification coupled with a solid oxide fuel cell (SOFC),which was combined with a Stirling engine to recover thermalenergy of the off gases from SOFC cycles. The SOFC basicallyacted as a topping cycle for a Stirling engine. The whole systemcapacity was 120 kW, which acted as a de-centralized CHP plant.Equilibrium modelling was performed employing a 2-stage air-blown (autothermal) fixed bed reactor, using the Gibbs freeenergy minimization approach. The plant electrical efficiencyvaried from 43 to 48% as a function of MSW composition andplant design. The maximum plant efficiency was found to be48% and CHP efficiency as 95%, at SOFC operating temperatureof 690 1C, provided there was an unaltered fuel mass flow rate.
Vakalis et al.362 devised a novel approach called ‘Multi-box’for thermodynamic modelling where they divided the wholereactor into multiple zones or boxes vis-a-vis gasification stages.
They evaluated solid–vapour equilibria in small-scale down-draft gasifiers. Gases and char compositions were obtained fordifferent ERs (0.2–0.3) and the results were compared withconventional modelling approach results. CO, H2, CO2, CH4
and char yields were closer to the real case scenario than whatwas found via conventional single-stage equilibrium modelling,reflecting the efficiency and accuracy of the technique.
Researchers have also applied thermodynamic models tostudy the influence of numerous parameters in the gas compo-sition and yield when gasifying with a FBG363–369 and theunique gasifier.90,321,370–372 It is relatively easy to develop athermodynamic model to forecast exit gas properties along withthe maximum thermal efficiency. This approach can be mademore accurate by utilizing empirical correlations deduced fromexperimental data.
The previously mentioned restrictions of equilibriummodels can be alleviated by using kinetic modelling forgasification.373
7.2 Kinetic modelling
Kinetic modelling considers reaction kinetics and hydro-dynamics of the gasifier and is thus potentially more accuratein deducing exit gas yield and composition.350,374 Unlike thermo-dynamic models, kinetic models can be applied to low-temperaturegasification. Although it is more intricate than equilibrium modelsand its intricacy increases with the complexity of gasifier design,it is a more precise mathematical approach. The Arrheniuseqn (26) reflects the kinetic parameters which are significant tothe model. It also quantifies the dependency on temperature.9
The laws of conservation of energy, mass and momentum arealso included in the model.
k = A exp(�Ea/RT) (26)
where k is the reaction rate constant; A the pre-exponentialfactor; Ea the activation energy; R is universal gas constant; andT the absolute reaction temperature.
Researchers have developed kinetic models to study theparametric impact of various process variables on the gascomposition and yield, using different feedstocks in differenttypes of gasifiers.375–378 The reaction temperature and S/B weretaken as parameters and a kinetic model was constructed byInayat et al.376 using oil palm empty fruit bunch as the feed-stock with steam as the gasifying media, coupled with in situCO2 capture by CaO. The H2 produced was directly proportionalto both reaction temperature and S/B. However, the efficiencywas reported to drop when increasing S/B beyond a point. Inaddition, this model also deduced that temperature was a moreimportant process variable than S/B. A kinetic model wasdeveloped to study temperature and species concentrationprofiles in both steady and dynamic states using biochar as afeedstock in a downdraft solar packed bed gasifier.375 It wasfound that a downdraft gasifier coupled with solar power was afeasible design. H2-rich exit gas was generated from the conceptwith an efficiency of 55%. These predictions were in accordancewith the experimental measurements.
Energy & Environmental Science Review
Ope
n A
cces
s A
rtic
le. P
ublis
hed
on 0
2 Ju
ne 2
016.
Dow
nloa
ded
on 1
4/12
/201
7 15
:54:
47.
Thi
s ar
ticle
is li
cens
ed u
nder
a C
reat
ive
Com
mon
s A
ttrib
utio
n-N
onC
omm
erci
al 3
.0 U
npor
ted
Lic
ence
.View Article Online

2966 | Energy Environ. Sci., 2016, 9, 2939--2977 This journal is©The Royal Society of Chemistry 2016
Sreejith and co-authors379 generated a kinetic model employ-ing air-steam as the gasifying medium and wood as the feed-stock in a fluidized bed gasifier, to study the influence of CaO assorbent for in situ CO2 capture. The lower heating value of thesyngas was enhanced from 5.58 to 6.12 MJ Nm�3 when thesorbent-to-biomass ratio was increased from 0.75 to 1.5, at ER of0.25 and S/B of 1. Moreover, they reported an increase of 14 to16% in H2 yield when sorbent was introduced in the system. Themaximum H2 yield was 53% in the syngas at ER of 0.25, S/B of1.5, sorbent-to-biomass ratio of 2.7 and temperature of 727 1C.Furthermore, they proved that from an energy efficiency point ofview, air-steam gasification is better than steam gasification.
Khonde et al.380 developed a single reaction model (SRM)and a distributed activation energy model (DAEM) for ricehusk gasification in a 2-stage BG with variable temperatures(700–900 1C) and residence times (12–48 s). They correlated theexperimental data and investigated the kinetics of individualgases and tar cracking. Increase in temperature and residencetime resulted in H2 rich syngas and maximum tar conversion of91% was observed. They argued that N2 and air are moreinfluential for secondary gaseous products. In addition, theyasserted that the DAEM is more appropriate than the SRM onaccount of its accuracy in correlating tar conversion activityover a diverse range of conditions.
The use of computational software packages (Mathematica,MATLAB, ASPEN PLUS, are examples of such) can be incrediblyuseful at saving time, money and resources when applied correctly.Models have previously been applied to predict potential issueswith designs and have been utilized to test novel ideas beforethe purchasing of capital equipment.9
7.3 Computational fluid dynamics modelling
CFD has emerged as a powerful and vital tool in modellingthermochemical reactors such as gasifiers. It is effective inderiving the optimum operating conditions and geometry, heatand mass transfer along with the gas yield to a reasonably gooddegree of accuracy, especially in FBGs, provided the reactorhydrodynamics are known.381 CFD models for BG necessitatesub-modelling of various stages such as vaporization, pyrolysis,char oxidation, etc., making it the most complicated modellingapproach amongst the three discussed so far.382
Some researchers have constructed CFD models to studydifferent types of gasifiers taking diverse parameters.97,357,383
The cold gas efficiency, gas composition, conversion efficiencyand temperature profile of a BG were investigated using woodas feedstock with the finite volume approach.383 Numericalsimulation was performed on a high-resolution mesh whichconsidered both solid and gaseous phases. Temperature pro-files were deduced and matched with the experimental dataalong with the species density. The average temperature profilederived from the CFD model was higher than the experimentalvalue while cold gas efficiency was lower than the ideal case.This variation was due to inability to capture the fine details ofthe highly complex phenomena taking place inside the gasifier.However, other gasifiers such as EFG, which have higher
temperatures and less intricate gas–solid flow profiles can bemodelled with greater precision.
Coute and co-authors384 developed a 2D CFD model basedon the Eulerian–Eulerian approach to study the influence of O2
rich air on BG employing coffee husks as feedstock. The kinetictheory of granular flow was used to analyze the characteristicsof dispersed phase and gas phase behaviors. The impact of O2
on operating temperature, S/B and syngas composition wasalso evaluated. It was reported that N2 and H2 molar fractionswere enhanced with increasing O2 content while CO2 decreased.In addition, cold gas efficiency increased with increasing O2
whereas it decreased with S/B. This study was found to be ingood agreement with the experimental results.
Savuto et al.385 generated a CFD code to evaluate the behaviorof catalytic filters situated inside the freeboard of the reactor andto analyze their performance in steam reforming of CH4 and tarspecies. Parameters such as filtration velocity (70–110 m h�1)and temperature (750–850 1C) were investigated, which haveimpact on the filters’ performance. It was observed that CH4 andC7H8 conversion doubled whereas C6H6 and C10H8 conversionwere quadrupled, with a 100 1C rise in temperature. Further-more, maximum conversion for tar and CH4 was reported atmaximum temperature (850 1C) and minimum filtration velocity(70 m h�1). At these conditions, CH4 conversion was 33% whileC6H6, C7H8 and C10H8 conversions were 41%, 75% and 85%respectively.
The latest advancements in CFD modelling have pavednew ways for the optimization of biomass gasification coupledwith reactor design.351 The capability of CFD to infer gasifierperformance under a broad range of process variables makes ita highly promising option.
7.4 Artificial neural network modelling
ANN is a relatively fresh approach for the modelling of complexprocesses. It is a tool which is already in use in different areassuch as signal processing but its application in outcome pre-dictions in BG is quite new. A significant advantage of ANNsis that they do not require the formulation of complex mathe-matical equations and they can learn and identify non-linearrelations themselves.386 Thus, ANNs may be an interestingoption to evaluate BG where complex non-linearities occur inthe data-set.
Very few researchers have modelled biomass gasificationusing the ANN approach.352,387 A model was constructed toderive exit gas characteristics and heat content along with thetemperature profile in a FBG.387 Predictions were very close tothe experimental data. At a S/B of 2.53, the highest H2 yield wasreported to be 29.1% in experiments. The ANN predicted thisvalue as 28.2%, reflecting the potential of ANN models tosimulate complex gasification to significant precision.
Mikulandric et al.388 developed advanced control solutionscentred on a ‘feedforward-feedback’ control strategy employingcollected operational data from a 75 MWth fixed bed gasifica-tion plant operated by Technical University, Dresden. Theinfluence of the control approach was evaluated by employingan ANN-based prediction model. It was reported that the
Review Energy & Environmental Science
Ope
n A
cces
s A
rtic
le. P
ublis
hed
on 0
2 Ju
ne 2
016.
Dow
nloa
ded
on 1
4/12
/201
7 15
:54:
47.
Thi
s ar
ticle
is li
cens
ed u
nder
a C
reat
ive
Com
mon
s A
ttrib
utio
n-N
onC
omm
erci
al 3
.0 U
npor
ted
Lic
ence
.View Article Online

This journal is©The Royal Society of Chemistry 2016 Energy Environ. Sci., 2016, 9, 2939--2977 | 2967
introduction of advanced control systems for numerous processvariables can increase process efficiency by 25% on account ofalterations in air and fuel distribution on partial product gasgeneration loads. Furthermore, this approach decreased theadverse environmental effects of BG systems. This work demon-strates the significance of advanced modelling strategies such asANN for optimizing gasification process.
ANN modelling is seen as an encouraging approach espe-cially for UG and dual FBG which are difficult to model by othermethods; however, it requires large amounts of data in differ-ent regions of the operating space to produce a sufficientlylarge database for ANN training and model development.
7.5 Tar formation and destruction models
Tar models are classified as either single-compound models,lumped models or kinetic models.184 Single-compound modelsrepresent simple versions of biomass and they reflect how thisbiomass would react whereas lumped and kinetic models utilizeheat and mass transfer information along with rate of reactions.Font-Palma et al.184 reported, via comprehensive experimentalinvestigations, acetol, acetic acid and guaiacols as primary tar modelcompounds, phenols, cresols and toluene as secondary tar modelcompounds and naphthalene as tertiary tar species. Zhao et al.389,390
studied toluene and Ji et al.389,390 investigated phenol with a single-compound model and developed a thermodynamic model for tarformation. Benzene and naphthalene were the only HCs producedwhen toluene was chosen as the tar model and in the latter case,phenol cracking generated naphthalene and benzene followed bytheir decomposition to non-condensable gases and H2O. Thesesimulation results are in close agreement with the experimentalwork done and, therefore, demonstrate the applicability of tarmodel compounds when attempting to understand tar destructionwhile minimizing time-consuming and expensive experiments.
To facilitate the simulation of bubbling FBG, manyresearchers356,391–395 conducted tar modelling using a lumped-model approach, while Abdelouahed et al.396 developed lumpedmodels for dual FBG. Their simulation results were in agreementwith the experimental investigations. Detailed kinetic models canbe studied in the work done by many investigators.397–401 Thesingle compound model approach using stable compounds liketoluene, benzene and naphthalene or the lumped-model approachare considered the best for tar modelling, although these com-pounds appear as secondary and tertiary tars with no knowledge ofkinetics of their development. Comprehensive kinetic modelsemploy numerous species and, therefore, are considered to bevery complex when simulating biomass inside a gasifier. A morefeasible approach is to keep to a minimum the number of tarspecies while modelling tar development during gasification.184
Detailed work can be found in the literature.184,266,356,389–395,397–403
8. Socio-environmental analysis
The major motivation behind biomass gasification is to exploita large variety of waste materials as feedstock, to increaseresource efficiency and reduce adverse climate change via
CO2 mitigation. Although gasification is a key technology toutilize biomass waste, it poses many potential kinds of riskswhich have a significant impact on society and the environ-ment at large.404 One of the main problems is the potentialemissions of particulates (PM10 or PM2.5, dioxins, PAH), CO,SOx, NOx and volatile organics.405 These pollutants can interactwith humans through inhalation, ingestion and dermal contactand thus pose a grave threat to human health.406 A detailedanalysis has been depicted in Table 9.
On the other hand, biomass combustion can also emitcomplex mixtures of particles (PM2.5), semi-volatile matterand gases. Particulate organic matter in PM2.5 ranges fromalkanes, aromatic compounds to carboxylic acids. These havesoluble organic emissions with high concentration of organictracers (from lignin and cellulose combustion).410–412 Thesepollutants are carcinogenic in nature and can induce poten-tially fatal tumors. Their rates of discharge are very high whencompared to efficient biomass gasification. Therefore, as far asharmful emissions are concerned, biomass gasification andeven fossil fuel combustion are generally better than biomasscombustion if the latter does not have pollution mitigation,especially SOx and NOx.412 Consequently, gasification is preferredfor biomass utilization on account of very low emissions after anefficient gas clean-up and conditioning unit.
Gasification is a system which has an inherent risk forfire and explosion vulnerability, especially since the gasifiersoperate at high temperature and pressure.413 This probabilityenhances significantly when H2 is the desired product. It ishighly flammable and, therefore, necessitates a great amountof caution. Ash and tars are noteworthy elements which havepotential for environmental contamination. The waste streamsformed require a suitable disposal system to be implemented thatmeets all legislative guidelines. Techniques like low-temperatureCFB which can produce ash with negligible PAH impurity poselittle threat to the environment, meaning that this ash can alsobe used as a fertilizer.414
The idea of gasifying biomass resources in remote orsparsely populated areas to provide heat and electricity is onethat has received substantial attention over many years, albeitthe progress has been slow.4,415,416 Currently, there are majorrural gasification programs in countries as diverse as Chinasuch as crop straw-based projects like the Xiaoliujia project,projects in Jincheng City and elsewhere;417 India has also seendeployment in places such a Karnataka, where two 500 kWgasifers have been built, along with Africa and elsewhere.418,419
One of the successful projects employing a decentralizedbiomass gasification-based power generation system in anun-electrified Indian village called Hosahalli village in Karnatakaprovince emphatically reflects the promising nature of gasificationsystems.420 Power derived from a biomass gasification system wasemployed for lighting, drinking water supply via pipes, irrigationwater supply and flour milling. A 20 kW gasifier-engine generatorsystem with all the accessories for fuel processing and electricitydistribution was installed in 1988 and operated until 2004.It met all the electricity needs of the entire village. Cost offuel and, operation and maintenance costs were calculated
Energy & Environmental Science Review
Ope
n A
cces
s A
rtic
le. P
ublis
hed
on 0
2 Ju
ne 2
016.
Dow
nloa
ded
on 1
4/12
/201
7 15
:54:
47.
Thi
s ar
ticle
is li
cens
ed u
nder
a C
reat
ive
Com
mon
s A
ttrib
utio
n-N
onC
omm
erci
al 3
.0 U
npor
ted
Lic
ence
.View Article Online

2968 | Energy Environ. Sci., 2016, 9, 2939--2977 This journal is©The Royal Society of Chemistry 2016
as INR 5.85 per kW h at a load of 5 kW and INR 3.34 per kW h ata load of 20 kW. The Hosahalli project has proved the technicaland operating viability of biomass gasification systems in ruralareas of developing countries. Among all the renewable energypower generation technologies, decentralized power generationvia biomass gasification offers great potential for meeting ruralenergy needs on account of its technological maturity, avail-ability in different capacity scales, feasibility of operationduring different times of day/year, economic feasibility, bio-diversity preservation and aid in climate change mitigation.
Often the goal of using biomass as an energy source issimply to replace the cook stove in small communities with areliable and relatively clean source of heating.421,422 Thisis especially attractive if the biomass can replace pollutingfuels like coal briquettes, and is also interesting given the verylarge amounts of such material available in some locations(e.g. for India resources are estimated as 120–150 millionmetric tonnes per annum which represents a potential of about18 000 MW energy).422 Such units are usually small, typically nomore than 10 to 200 hundred kWth and are expected to be robustnon-polluting devices, which can be operated in a communalsetting with diverse feedstock ranging from straws to materialslike coconut shells.423 Such systems can also be combined witheconomic stimulus packages such as soft loans to rural commu-nities to pay for the capital cost of such systems and to providestart-up funding to operate such systems in conjunction withNGOs or other organizations.4 In some circumstances smallgasifiers have proven to be more economic for electricitygeneration than for instance importing diesel fuels to remotecommunities424 and gasification technology is being seenas a vital method for dealing with energy poverty.425,426 Suchtechnologies also offer the possibility of avoiding pollutionassociated with the disposal of agricultural wastes,427 althoughit has been noted that to date there has been relatively littletesting of such technologies in real settings, and this is essentialif gasification technologies are to fully displace conventionalsystems in rural locations.
Researchers including Luque et al.208 and Demirbas et al.210
have conducted extensive investigations on diverse aspects ofbiofuels. Synthetic biofuels like Bio-DME, Bio-H2, hydrothermalupgraded (HTU) diesel, and linear chain HCs, etc., are preparedfrom gasification product gases by employing different pro-cesses. In the absence of contaminants such as particulates, tarand other toxic gases, they are considered cleaner. With a highcetane value, they can be used in IC engines (except Bio-DME) withadvantages such as clean combustion, albeit with a requirementfor engine modification.208 Production of bio-ethanol is also aninteresting idea to help curb crude oil usage and environmentalpollution. However, the technologies available for the majorityof these biofuels are in their infancies with respect to produc-tion, storage and transportation. Moreover, production of thesefuels is a costly affair on account of high installation andproduction costs.208,210
Biofuels have some other adverse environmental effects whichshould also be considered in their long-term sustainabilityassessment. Direct GHG emissions such as from fertilizer usageT
able
9A
nal
ysis
of
gas
ifica
tio
np
ollu
tan
tsan
dth
eir
eff
ect
s40
6–
40
9
Typ
eof
poll
uta
nt
Feat
ure
Eff
ect
onre
spir
ator
ysy
stem
Eff
ect
onca
rdio
-vas
cula
rsy
stem
Eff
ect
onn
ervo
us
syst
emE
ffec
ton
dig
esti
vesy
stem
Con
gen
ital
prob
lem
s
Part
icu
late
sSi
zeo
2.5mm
ish
arm
ful;
toxi
city
vari
esd
epen
din
gu
pon
chem
ical
com
posi
-ti
on;
PAH
,d
ioxi
ns,
Pb,
Hg
are
con
sid
ered
toxi
c
Nos
ean
dth
roat
irri
tati
on,
CO
PD,a
sth
ma,
lun
gca
nce
rM
yoca
rdia
lin
frac
tion
Hea
dac
he,
fati
gue
Live
rce
lld
amag
e,li
ver
can
cer,
gast
ro-i
nte
stin
alca
nce
rR
edu
ced
feta
lgr
owth
,pr
eter
mbi
rth
,low
birt
hw
eigh
t,m
otor
and
cogn
itiv
ed
isab
ilit
ies
CO
Inco
mpl
ete
com
bust
ion
prod
uce
sC
O;
atm
osph
eric
hal
f-li
feof
1–2
mon
ths
Ast
hm
a,C
OPD
,br
onch
itis
,d
yspo
enia
Lun
gin
flam
mat
ion
,an
gin
ain
frac
tion
,ca
rdia
car
rest
Sch
izop
hre
nia
—Pr
eter
mbi
rth
,ca
rdia
cd
efec
ts
SOx
Oxi
des
ofsu
lph
ur;
atm
osph
eric
life
span
is4–
10d
ays
Nos
ean
dth
roat
irri
tati
on,
asth
ma
——
—Pr
eter
mbi
rth
NO
xO
xid
esof
nit
roge
n;
life
span
of1–
2w
eeks
Bro
nch
itis
,C
OPD
,as
thm
a,lu
ng
can
cer
Car
dia
cm
orta
lity
and
mor
bid
ity
Slee
pd
isor
der
s,fa
tigu
e—
Red
uce
dfe
tal
grow
th,
pret
erm
birt
hV
olat
ile
orga
nic
sLa
rge
ran
geof
chem
ical
sw
hic
har
eea
sily
evap
orat
edat
room
tem
pera
ture
;ex
ampl
es–
ben
zen
e,to
luen
e,et
c.
Ast
hm
aLu
ng
infl
amm
atio
nN
ause
a,d
izzi
nes
sLi
ver
fail
ure
,ki
dn
eyfa
ilu
rePr
eter
mbi
rth
,m
otor
and
cogn
i-ti
ved
isab
ilit
ies
Review Energy & Environmental Science
Ope
n A
cces
s A
rtic
le. P
ublis
hed
on 0
2 Ju
ne 2
016.
Dow
nloa
ded
on 1
4/12
/201
7 15
:54:
47.
Thi
s ar
ticle
is li
cens
ed u
nder
a C
reat
ive
Com
mon
s A
ttrib
utio
n-N
onC
omm
erci
al 3
.0 U
npor
ted
Lic
ence
.View Article Online

This journal is©The Royal Society of Chemistry 2016 Energy Environ. Sci., 2016, 9, 2939--2977 | 2969
and indirect from land use change, coupled with the adverseimpact on biodiversity forms the main threat to wide-scaledeployment of biomass growth for biofuel generation.428,429
Soil preservation issues and water utilization are other factorsthat militate against the use of biofuels.430,431 The main con-cerns related to societal impact should be land use change andfiscal sustainability along with proper administrative guide-lines. On the other hand, the independent production ofbiofuel directly improves a country’s energy security and theircurrent and expected future energy mix. Biomass gasificationalso provides an opportunity to provide additional jobs in R&D,engineering and procurement.
9. Conclusions
Biomass is a significant non-conventional energy reserve. Itstopographical independence and comparatively ample avail-ability makes it a promising choice over other renewablesources such as solar, wind or hydroelectric storage. Bioenergytechnologies such as gasification can utilize a variety of bio-mass types to produce useful products including electricalpower and hydrogen. A deep understanding and knowledgeof the process along with the alternative approaches to gasifica-tion are required for optimization and advancements in a cost-effective manner.
An in-depth survey throughout this paper has provided evi-dence about various biomass feedstocks and the applications ofthe potential gasification products. The impacts of different para-meters on the properties and yields of the individual products havebeen discussed with the aim to aid optimization of future researchand the process as a whole. Unique gasifier designs, includinglarge-scale multi-stage gasification and smaller decentralizedpyrolysis plants near the biomass source coupled with a centra-lized gasification unit are interesting and potentially economicalways to optimize biomass utilization. More novel technologies,such as plasma gasification and SCWG could be effective ways tomake the most of toxic and wet biomass to generate power.Various poly-generation approaches to produce heat and poweralong with other products like syngas, H2, fertilizer or biochardemonstrate the developments and opportunities in gasification.
Understanding of tar formation, and advancements inmodelling have been mentioned to pave the way for futureexpansion in discovering and designing new catalysts, to makethe gasification process cleaner and operate with a higherefficiency. Conventional modelling is being supplementedand in some cases replaced by CFD and ANN. Althoughgasification has some adverse social and environmentalimpacts, they can be minimized through appropriate techno-logical and policy implementations.
This paper presents a positive case for biomass gasificationas a promising, viable and economically beneficial technology.It has been shown that the process is not limited to a particularfeedstock and specific product, but is flexible towards thetreatment of biomass wastes that may be toxic or contaminated,for the generation of diversified usable products.
Acknowledgements
M. Zhao thanks for the support by the National RecruitmentProgram of Global Youth Experts (The National Youth 1000 –Talent Program) of China (grant number: 20151710227); M. Zhao,V. S. Sikarwar and M. Z. Memon are grateful for the fundingsupport by Tsinghua University Initiative Scientific ResearchProgram (grant number: 20161080094) and the Volvo Group ina research project of the Research Center for Green Economy andSustainable Development, Tsinghua University (grant number:20153000181). P. Clough thanks the EPSRC for funding a DTAstudentship and J. Yao thanks Imperial College for funding astudentship. We also thank Ms Shujuan Zhang for her assistance.
References
1 R. Saidur, E. A. Abdelaziz, A. Demirbas, M. S. Hossain andS. Mekhilef, Renewable Sustainable Energy Rev., 2011, 15,2262–2289.
2 International Energy Agency Energy Database, http://www.worldenergyoutlook.org/resources/energydevelopment/energyaccessdatabase/, accessed November 2015.
3 S. Heidenreich and P. U. Foscolo, Prog. Energy Combust.Sci., 2015, 46, 72–95.
4 B. Buragohain, P. Mahanta and V. S. Moholkar, RenewableSustainable Energy Rev., 2010, 14, 73–92.
5 Ministry of Coal, Government of India, http://coal.nic.in/content/coal-reserves, accessed September 2014.
6 National Energy Technology Laboratory, USA, http://www.netl.doe.gov/File%20Library/Research/Coal/energy%20systems/gasification/gasifipedia/index.html, accessed March2016.
7 A. K. Rajvanshi, Alternative energy in agriculture, 1986, 2,82–102.
8 National Energy Technology Laboratory USA, http://www.netl.doe.gov/research/coal/energy-systems/gasification/gasifipedia/wabash/, accessed September 2000.
9 P. Basu, Biomass Gasification and Pyrolysis, Elsevier,Oxford, 2010.
10 J. P. Ciferno and J. J. Marano, presented in part at US Depart-ment of Energy, National Energy Technology Laboratory,June 2002.
11 G. Foley and G. Barnard, Biomass gasification in developingcountries-Technical Report, International Institute forEnvironment and Development, Earthscan, UK, 1983.
12 H. Knoef and J. Ahrenfeldt, Handbook biomass gasification,BTG biomass technology group, The Netherlands, 2005.
13 S. Rapagna, N. Jand, A. Kiennemann and P. U. Foscolo,Biomass Bioenergy, 2000, 19, 187–197.
14 C. Higman and M. v. d. Burgt, Gasification, Gulf ProfessionalPublishing, Elsevier, USA, 2008.
15 P. Parthasarathy and K. S. Narayanan, Renewable Energy,2014, 66, 570–579.
16 P. McKendry, Bioresour. Technol., 2002, 83, 37–46.17 P. Basu, in Biomass Gasification and Pyrolysis, ed. P. Basu,
Academic Press, Boston, 2010, pp. 97–116.
Energy & Environmental Science Review
Ope
n A
cces
s A
rtic
le. P
ublis
hed
on 0
2 Ju
ne 2
016.
Dow
nloa
ded
on 1
4/12
/201
7 15
:54:
47.
Thi
s ar
ticle
is li
cens
ed u
nder
a C
reat
ive
Com
mon
s A
ttrib
utio
n-N
onC
omm
erci
al 3
.0 U
npor
ted
Lic
ence
.View Article Online

2970 | Energy Environ. Sci., 2016, 9, 2939--2977 This journal is©The Royal Society of Chemistry 2016
18 C. Li and K. Suzuki, Renewable Sustainable Energy Rev.,2009, 13, 594–604.
19 A. George, A. Brandt, K. Tran, S. M. N. S. Zahari, D. Klein-Marcuschamer, N. Sun, N. Sathitsuksanoh, J. Shi, V. Stavilaand R. Parthasarathi, Green Chem., 2015, 17, 1728–1734.
20 R. El Hage, N. Brosse, L. Chrusciel, C. Sanchez, P. Sannigrahiand A. Ragauskas, Polym. Degrad. Stab., 2009, 94, 1632–1638.
21 H. L. Chum and R. P. Overend, Fuel Process. Technol., 2001,71, 187–195.
22 K. J. Ptasinski, Biofuels, Bioprod. Biorefin., 2008, 2, 239–253.23 P. H. Hasler and T. Nussbaumer, Biomass Bioenergy, 1999,
16.6, 385–395.24 Combustion Gasification and Propulsion Laboratory, IISc,
India, http://cgpl.iisc.ernet.in/site/Portals/0/Technologies/Gasification%20Technology.pdf, accessed August 2011.
25 S. Dasappa, P. Paul, H. Mukunda, N. Rajan, G. Sridhar andH. Sridhar, Curr. Sci., 2004, 87, 908–916.
26 P. Giaordano and S. Dasappa, Test of different biomassinto the IISc open top co-current gasifier, Swiss FederaleOffice of Energy, Project 39772 Contract 80847, 2001.
27 H. S. Mukunda, S. Dasappa, P. J. Paul, N. K. S. Rajan andU. Shrinivasa, Energy Sustainable Dev., 1994, 1, 27–38.
28 P. Basu, Biomass Gasification and Pyrolysis, Academic Press,Boston, 2010, pp. 167–228.
29 K. Gallucci, P. U. Foscolo, presented in part at 16thEuropean Biomass Conference and Exhibition, Valencia,Spain, May 2008.
30 G. Galeno, M. Minutillo and A. Perna, Int. J. HydrogenEnergy, 2011, 36, 1692–1701.
31 P. Basu, Biomass Gasification and Pyrolysis, Academic Press,Boston, 2010, pp. 117–165.
32 D. L. Klass, Biomass for renewable energy, fuels, and chemi-cals, Academic press, USA, 1998.
33 G. Tomlinson, D. Gray, M. Berger, Produced by MITRECorporation for National Renew. Energ. Laboratory, USA,under contract number AL-4159, 1996.
34 P. J. Woolcock and R. C. Brown, Biomass Bioenergy, 2013,52, 54–84.
35 A. Demirbas-, Energy Convers. Manage., 2002, 43, 897–909.36 H. De Lasa, E. Salaices, J. Mazumder and R. Lucky,
Chem. Rev., 2011, 111, 5404–5433.37 N. Nipattummakul, I. I. Ahmed, A. K. Gupta and S. Kerdsuwan,
Int. J. Hydrogen Energy, 2011, 36, 3835–3843.38 I. Dincer, Int. J. Hydrogen Energy, 2012, 37, 1954–1971.39 C. Franco, F. Pinto, I. Gulyurtlu and I. Cabrita, Fuel, 2003,
82, 835–842.40 N. Nipattummakul, S. Pathumsawad and S. Kerdsuwan,
International Conference on Thermal Treatment Technol-ogies and Hazardous Waste Combustors, California, USA,May 2010.
41 L. Wei, S. Xu, L. Zhang, C. Liu, H. Zhu and S. Liu,Int. J. Hydrogen Energy, 2007, 32, 24–31.
42 P. V. Aravind and W. De Jong, Prog. Energy Combust. Sci.,2012, 38, 737–764.
43 M. Asadullah, Renewable Sustainable Energy Rev., 2014, 29,201–215.
44 D. J. Wilhelm, D. R. Simbeck, A. D. Karp and R. L. Dickenson,Fuel Process. Technol., 2001, 71, 139–148.
45 I. Wender, Fuel Process. Technol., 1996, 48, 189–297.46 N. Abdoulmoumine, A. Kulkarni and S. Adhikari, Ind. Eng.
Chem. Res., 2014, 53, 5767–5777.47 H. Cui, S. Q. Turn, V. Keffer, D. Evans, T. Tran and
M. Foley, Energy Fuels, 2010, 24, 1222–1233.48 S. Hurley, C. C. Xu, F. Preto, Y. Shao, H. Li, J. Wang and
G. Tourigny, Fuel, 2012, 91, 170–176.49 Y. Ohtsuka, N. Tsubouchi, T. Kikuchi and H. Hashimoto,
Powder Technol., 2009, 190, 340–347.50 L. A. Bissett, An engineering assessment of entrainment
gasification, U.S. Department of Energy, MERC/RI-78/2,Morgantown, USA, 1978.
51 F. Fabry, C. Rehmet, V. Rohani and L. Fulcheri, WasteBiomass Valorization, 2013, 4, 421–439.
52 N. Agon, M. Hrabovsky, O. Chumak, M. Hlına, V. Kopecky,A. Maslani, A. Bosmans, L. Helsen, S. Skoblja and G. Van Oost,Waste Manage., 2016, 47, 246–255.
53 I. Matveev, Plasma Assisted Combustion, and PollutionControl, Methods of Plasma Generation for PAC, PublishersOutside Press Inc., Denver, 2016, vol. 1.
54 I. Matveev, Plasma Assisted Combustion, and PollutionControl, Methods of Plasma Generation for PAC, PublishersOutside Press Inc., Denver, 2016, vol. 2.
55 K. A. Magrini-Bair, S. Czernik, R. French, Y. O. Parent,E. Chornet, D. C. Dayton, C. Feik and R. Bain, Appl. Catal.,A, 2007, 318, 199–206.
56 C. Pfeifer, R. Rauch and H. Hofbauer, Ind. Eng. Chem. Res.,2004, 43, 1634–1640.
57 J. Delgado, M. P. Aznar and J. Corella, Ind. Eng. Chem. Res.,1997, 36, 1535–1543.
58 A. Olivares, M. P. Aznar, M. A. Caballero, J. Gil,E. Frances and J. Corella, Ind. Eng. Chem. Res., 1997, 36,5220–5226.
59 A. Orıo, J. Corella and I. Narvaez, Ind. Eng. Chem. Res.,1997, 36, 3800–3808.
60 S. Rapagna, N. Jand and P. U. Foscolo, Int. J. HydrogenEnergy, 1998, 23, 551–557.
61 P. A. Simell, E. K. Hirvensalo, V. T. Smolander andA. O. I. Krause, Ind. Eng. Chem. Res., 1999, 38, 1250–1257.
62 J. Corella, J. M. Toledo and R. Padilla, Energy Fuels, 2004,18, 713–720.
63 L. Devi, K. J. Ptasinski, F. J. J. G. Janssen, S. V. B. VanPaasen, P. C. A. Bergman and J. H. A. Kiel, RenewableEnergy, 2005, 30, 565–587.
64 R. L. Bain, D. C. Dayton, D. L. Carpenter, S. R. Czernik,C. J. Feik, R. J. French, K. A. Magrini-Bair and S. D. Phillips,Ind. Eng. Chem. Res., 2005, 44, 7945–7956.
65 D. Swierczynski, C. Courson, L. Bedel, A. Kiennemann andJ. Guille, Chem. Mater., 2006, 18, 4025–4032.
66 D. Swierczynski, C. Courson and A. Kiennemann, Chem.Eng. Process., 2008, 47, 508–513.
67 H. O. A. Fredriksson, R. J. Lancee, P. C. Thune, H. J. Veringaand J. W. H. Niemantsverdriet, Appl. Catal., B, 2013, 130–131,168–177.
Review Energy & Environmental Science
Ope
n A
cces
s A
rtic
le. P
ublis
hed
on 0
2 Ju
ne 2
016.
Dow
nloa
ded
on 1
4/12
/201
7 15
:54:
47.
Thi
s ar
ticle
is li
cens
ed u
nder
a C
reat
ive
Com
mon
s A
ttrib
utio
n-N
onC
omm
erci
al 3
.0 U
npor
ted
Lic
ence
.View Article Online

This journal is©The Royal Society of Chemistry 2016 Energy Environ. Sci., 2016, 9, 2939--2977 | 2971
68 M. Virginie, J. Adanez, C. Courson, L. F. De Diego, F. Garcıa-Labiano, D. Niznansky, A. Kiennemann, P. Gayan andA. Abad, Appl. Catal., B, 2012, 121–122, 214–222.
69 S. Rapagna, K. Gallucci, M. Di Marcello, P. U. Foscolo,M. Nacken, S. Heidenreich and M. Matt, Fuel, 2012, 97,718–724.
70 M. Virginie, C. Courson, D. Niznansky, N. Chaoui andA. Kiennemann, Appl. Catal., B, 2010, 101, 90–100.
71 H. Depner and A. Jess, Fuel, 1999, 78, 1369–1377.72 L. Ma, H. Verelst and G. V. Baron, Catal. Today, 2005, 105,
729–734.73 M. Nacken, M. Lina, K. Engelen, S. Heidenreich and
G. V. Baron, Ind. Eng. Chem. Res., 2007, 46, 1945–1951.74 Y. Hu, M. Watanabe, C. Aida and M. Horio, Chem. Eng. Sci.,
2006, 61, 1854–1863.75 M. Stemmler, A. Tamburro and M. Muller, Fuel, 2013, 108,
31–36.76 W. F. Elseviers and H. Verelst, Fuel, 1999, 78, 601–612.77 V. Patrick, G. R. Gavalas, M. Flytzani-Stephanopoulos and
K. Jothimurugesan, Ind. Eng. Chem. Res., 1989, 28, 931–940.78 Y. Zeng, S. Kaytakoglu and D. P. Harrison, Chem. Eng. Sci.,
2000, 55, 4893–4900.79 M. Stemmler and M. Muller, Ind. Eng. Chem. Res., 2010, 49,
9230–9237.80 M. Diaz-Somoano and M. R. Martınez-Tarazona, Energy
Fuels, 2005, 19, 442–446.81 K. J. Wolf, M. Muller, K. Hilpert and L. Singheiser, Energy
Fuels, 2004, 18, 1841–1850.82 D. Barisano, C. Freda, F. Nanna, E. Fanelli and A. Villone,
Bioresour. Technol., 2012, 118, 187–194.83 A. Gomez-Barea, P. Ollero and B. Leckner, Fuel, 2013, 103,
42–52.84 U. Henriksen, J. Ahrenfeldt, T. K. Jensen, B. Gøbel, J. D.
Bentzen, C. Hindsgaul and L. H. Sørensen, Energy, 2006,31, 1542–1553.
85 F. Trippe, M. Frohling, F. Schultmann, R. Stahl andE. Henrich, Fuel Process. Technol., 2011, 92, 2169–2184.
86 S. Czemik and A. Bridgwater, Energy Fuels, 2004, 18, 590–598.87 A. Gomez-Barea, B. Leckner, A. Villanueva Perales, S. Nilsson
and D. Fuentes Cano, Appl. Therm. Eng., 2013, 50, 1453–1462.88 P. Hofmann, A. Schweiger, L. Fryda, K. D. Panopoulos,
U. Hohenwarter, J. D. Bentzen, J. P. Ouweltjes, J. Ahrenfeldt,U. Henriksen and E. Kakaras, J. Power Sources, 2007, 173,357–366.
89 J. Ahrenfeldt, T. P. Thomsen, U. Henriksen and L. R. Clausen,Appl. Therm. Eng., 2013, 50, 1407–1417.
90 S. Nilsson, A. Gomez-Barea, D. Fuentes-Cano and P. Ollero,Fuel, 2012, 97, 730–740.
91 A. Gomez-Barea, S. Nilsson, F. V. Barrero and M. Campoy,Fuel Process. Technol., 2010, 91, 1624–1633.
92 S. Nilsson, A. Gomez-Barea and D. F. Cano, Fuel, 2012, 92,346–353.
93 T. P. Thomsen, J. Ahrenfeldt and S. T. Thomsen, BiomassBioenergy, 2013, 53, 81–94.
94 P. Haro, F. Trippe, R. Stahl and E. Henrich, Appl. Energy,2013, 108, 54–65.
95 A. V. Bridgwater, Biomass Bioenergy, 2012, 38, 68–94.96 www.bioliq.de, accessed February 2016.97 T. Jakobs, N. Djordjevic, S. Fleck, M. Mancini, R. Weber
and T. Kolb, Appl. Energy, 2012, 93, 449–456.98 H. Leibold, A. Hornung and H. Seifert, Powder Technol.,
2008, 180, 265–270.99 S. Heidenreich, Fuel, 2013, 104, 83–94.
100 Y. Somrang, PhD thesis, Imperial College London, 2012.101 A. Oasmaa and S. Czernik, Energy Fuels, 1999, 13, 914–921.102 L. Tang, H. Huang, H. Hao and K. Zhao, J. Electrost., 2013,
71, 839–847.103 I. Janajreh, S. S. Raza and A. S. Valmundsson, Energy
Convers. Manage., 2013, 65, 801–809.104 L. Zhang, C. Xu and P. Champagne, Energy Convers.
Manage., 2010, 51, 969–982.105 Y. Kalinci, A. Hepbasli and I. Dincer, Int. J. Hydrogen
Energy, 2011, 36, 11408–11417.106 A. Mountouris, E. Voutsas and D. Tassios, Energy Convers.
Manage., 2008, 49, 2264–2271.107 P. Rutberg, A. N. Bratsev, V. A. Kuznetsov, V. E. Popov,
A. A. Ufimtsev and S. V. Shtengel, Biomass Bioenergy, 2011,35, 495–504.
108 J. L. Shie, F. J. Tsou and K. L. Lin, Bioresour. Technol., 2010,101, 5571–5577.
109 L. Tang and H. Huang, Fuel, 2005, 84, 2055–2063.110 M. Hlina, M. Hrabovsky, T. Kavka and M. Konrad, Waste
Manage., 2014, 34, 63–66.111 C. J. Lupa, S. R. Wylie, A. Shaw, A. Al-Shamma’A, A. J.
Sweetman and B. M. J. Herbert, Fuel Process. Technol.,2012, 97, 79–84.
112 D. H. Shin, Y. C. Hong, S. J. Lee, Y. J. Kim, C. H. Cho,S. H. Ma, S. M. Chun, B. J. Lee and H. S. Uhm, Surf. Coat.Technol., 2013, 228, S520–S523.
113 S. J. Yoon and J. G. Lee, Int. J. Hydrogen Energy, 2012, 37,17093–17100.
114 S. J. Yoon, Y. M. Yun, M. W. Seo, Y. K. Kim, H. W. Ra andJ. G. Lee, Int. J. Hydrogen Energy, 2013, 38, 14559–14567.
115 Ottawa Citizen Online News, http://ottawacitizen.com/news/local-news/plasco-energy-group-files-for-creditor-protection,accessed February 2015.
116 The Environment Media Group Ltd. News, http://www.letsrecycle.com/news/latest-news/words-largest-gasification-plant-nears-completion/, accessed May 2015.
117 A. Kruse, Biofuels, Bioprod. Biorefin., 2008, 2, 415–437.118 A. Kruse, J. Supercrit. Fluids, 2009, 47, 391–399.119 Y. Matsumura, T. Minowa, B. Potic, S. R. A. Kersten,
W. Prins, W. P. M. Van Swaaij, B. Van De Beld, D. C. Elliott,G. G. Neuenschwander, A. Kruse and M. J. Antal Jr, BiomassBioenergy, 2005, 29, 269–292.
120 P. Basu, Biomass Gasification and Pyrolysis, Academic Press,Boston, 2010, pp. 229–267.
121 Y. Guo, S. Z. Wang, D. H. Xu, Y. M. Gong, H. H. Ma andX. Y. Tang, Renewable Sustainable Energy Rev., 2010, 14,334–343.
122 A. J. Byrd, S. Kumar, L. Kong, H. Ramsurn and R. B. Gupta,Int. J. Hydrogen Energy, 2011, 36, 3426–3433.
Energy & Environmental Science Review
Ope
n A
cces
s A
rtic
le. P
ublis
hed
on 0
2 Ju
ne 2
016.
Dow
nloa
ded
on 1
4/12
/201
7 15
:54:
47.
Thi
s ar
ticle
is li
cens
ed u
nder
a C
reat
ive
Com
mon
s A
ttrib
utio
n-N
onC
omm
erci
al 3
.0 U
npor
ted
Lic
ence
.View Article Online

2972 | Energy Environ. Sci., 2016, 9, 2939--2977 This journal is©The Royal Society of Chemistry 2016
123 Y. Chen, L. Guo, W. Cao, H. Jin, S. Guo and X. Zhang,Int. J. Hydrogen Energy, 2013, 38, 12991–12999.
124 E. Kipçak and M. Akgun, J. Supercrit. Fluids, 2012, 69, 57–63.125 A. Miller, D. Hendry, N. Wilkinson, C. Venkitasamy and
W. Jacoby, Bioresour. Technol., 2012, 119, 41–47.126 V. Sricharoenchaikul, Bioresour. Technol., 2009, 100,
638–643.127 J. Yanik, S. Ebale, A. Kruse, M. Saglam and M. Yuksel, Fuel,
2007, 86, 2410–2415.128 W. Feng, H. J. Van Der Kooi and J. De Swaan Arons, Chem.
Eng. Process., 2004, 43, 1459–1467.129 P. Azadi and R. Farnood, Int. J. Hydrogen Energy, 2011, 36,
9529–9541.130 D. C. Elliott, Biofuels, Bioprod. Biorefin., 2008, 2, 254–265.131 F. Marias, S. Letellier, P. Cezac and J. P. Serin, Biomass
Bioenergy, 2011, 35, 59–73.132 Y. Lu, L. Guo, X. Zhang and Q. Yan, Chem. Eng. J., 2007,
131, 233–244.133 D. Castello and L. Fiori, Bioresour. Technol., 2011, 102,
7574–7582.134 N. H. Florin and A. T. Harris, Chem. Eng. Sci., 2008, 63,
287–316.135 P. McKendry, Bioresour. Technol., 2002, 83, 55–63.136 L. Han, Q. Wang, Y. Yang, C. Yu, M. Fang and Z. Luo,
Int. J. Hydrogen Energy, 2011, 36, 4820–4829.137 D. Sutton, B. Kelleher and J. R. H. Ross, Fuel Process.
Technol., 2001, 73, 155–173.138 X. Xiao, D. D. Le, L. Li, X. Meng, J. Cao, K. Morishita and
T. Takarada, Biomass Bioenergy, 2010, 34, 1505–1512.139 N. H. Florin and A. T. Harris, Int. J. Hydrogen Energy, 2007,
32, 4119–4134.140 S. Rapagna, H. Provendier, C. Petit, A. Kiennemann and
P. U. Foscolo, Biomass Bioenergy, 2002, 22, 377–388.141 D. Ross, R. Noda, M. Horio, A. Kosminski, P. Ashman and
P. Mullinger, Fuel, 2007, 86, 1417–1429.142 P. Weerachanchai, M. Horio and C. Tangsathitkulchai,
Bioresour. Technol., 2009, 100, 1419–1427.143 S. Chen, D. Wang, Z. Xue, X. Sun and W. Xiang,
Int. J. Hydrogen Energy, 2011, 36, 4887–4899.144 M. Balat, M. Balat, E. Kirtay and H. Balat, Energy Convers.
Manage., 2009, 50, 3158–3168.145 A. Tanksale, J. N. Beltramini and G. M. Lu, Renewable
Sustainable Energy Rev., 2010, 14, 166–182.146 B. Acharya, A. Dutta and P. Basu, Energy Fuels, 2009, 23,
5077–5083.147 B. Acharya, A. Dutta and P. Basu, Int. J. Hydrogen Energy,
2010, 35, 1582–1589.148 H. Guoxin and H. Hao, Biomass Bioenergy, 2009, 33,
899–906.149 T. Hanaoka, T. Yoshida, S. Fujimoto, K. Kamei, M. Harada,
Y. Suzuki, H. Hatano, S. Y. Yokoyama and T. Minowa,Biomass Bioenergy, 2005, 28, 63–68.
150 N. Howaniec and A. Smolinski, Int. J. Hydrogen Energy,2011, 36, 2038–2043.
151 L. Wei, S. Xu, J. Liu, C. Liu and S. Liu, Energy Fuels, 2008,22, 1997–2004.
152 C. Pfeifer, B. Puchner and H. Hofbauer, Int. J. Chem. React.Eng., 2007, 5, A9, DOI: 10.2202/1542-6580.1395.
153 C. Pfeifer, B. Puchner and H. Hofbauer, Chem. Eng. Sci.,2009, 64, 5073–5083.
154 V. Manovic and E. J. Anthony, Int. J. Environ. Res. PublicHealth, 2010, 7, 3129–3140.
155 L. S. Fan and F. Li, Ind. Eng. Chem. Res., 2010, 49(21),10200–10201.
156 B. Moghtaderi, Energy Fuels, 2012, 26, 15–40.157 A. Raheem, W. A. K. G. Wan Azlina, Y. H. Taufiq Yap,
M. K. Danquah and R. Harun, Renewable SustainableEnergy Rev., 2015, 49, 990–999.
158 T. Shirvani, X. Yan, O. R. Inderwildi, P. P. Edwards andD. A. King, Energy Environ. Sci., 2011, 4, 3773–3778.
159 A. G. Chakinala, D. W. Brilman, W. P. van Swaaij andS. R. Kersten, Ind. Eng. Chem. Res., 2009, 49, 1113–1122.
160 A. Demirbas, Energy Sources, Part A, 2009, 31, 746–753.161 A. Hirano, K. Hon-Nami, S. Kunito, M. Hada and
Y. Ogushi, Catal. Today, 1998, 45, 399–404.162 X. Miao and Q. Wu, J. Biotechnol., 2004, 110, 85–93.163 T. Minowa and S. Sawayama, Fuel, 1999, 78, 1213–1215.164 W. Peng, Q. Wu and P. Tu, J. Appl. Phycol., 2000, 12, 147–152.165 S. Grierson, V. Strezov, G. Ellem, R. Mcgregor and
J. Herbertson, J. Anal. Appl. Pyrolysis, 2009, 85, 118–123.166 A. E. Harman-Ware, T. Morgan, M. Wilson, M. Crocker,
J. Zhang, K. Liu, J. Stork and S. Debolt, Renewable Energy,2013, 60, 625–632.
167 X. Miao, Q. Wu and C. Yang, J. Anal. Appl. Pyrolysis, 2004,71, 855–863.
168 T. M. Brown, P. Duan and P. E. Savage, Energy Fuels, 2010,24, 3639–3646.
169 Y. Dote, S. Sawayama, S. Inoue, T. Minowa and S.-y. Yokoyama,Fuel, 1994, 73, 1855–1857.
170 T.-o. Matsui, A. Nishihara, C. Ueda, M. Ohtsuki, N.-o. Ikenagaand T. Suzuki, Fuel, 1997, 76, 1043–1048.
171 T. Minowa, S.-y. Yokoyama, M. Kishimoto and T. Okakura,Fuel, 1995, 74, 1735–1738.
172 S. Zou, Y. Wu, M. Yang, C. Li and J. Tong, Energy Environ.Sci., 2010, 3, 1073–1078.
173 K. L. Kadam, Energy, 2002, 27, 905–922.174 M. Carrier, A. Loppinet-Serani, D. Denux, J. M. Lasnier,
F. Ham-Pichavant, F. Cansell and C. Aymonier, BiomassBioenergy, 2011, 35, 298–307.
175 D. J. Lloyd, Chemistry of the Proteins and its EconomicApplications., J & A Churchill, London, 1926.
176 T. Werpy, G. Petersen, A. Aden, J. Bozell, J. Holladay,J. White, A. Manheim, D. Eliot, L. Lasure and S. Jones,Department of Energy, Washington USA, Aug 2004.
177 P. Parthasarathy and K. S. Narayanan, Renewable Energy,2014, 66, 570–579.
178 P. Basu, in Biomass Gasification, Pyrolysis and Torrefaction, ed.P. Basu, Academic Press, Boston, 2nd edn, 2013, pp. 47–86.
179 K. Gao and K. R. McKinley, J. Appl. Phycol., 1994, 6, 45–60.180 L. Sanchez-Silva, D. Lopez-Gonzalez, J. Villasenor, P. Sanchez
and J. Valverde, Bioresour. Technol., 2012, 109, 163–172.181 A. Bridgwater, Fuel, 1995, 74, 631–653.
Review Energy & Environmental Science
Ope
n A
cces
s A
rtic
le. P
ublis
hed
on 0
2 Ju
ne 2
016.
Dow
nloa
ded
on 1
4/12
/201
7 15
:54:
47.
Thi
s ar
ticle
is li
cens
ed u
nder
a C
reat
ive
Com
mon
s A
ttrib
utio
n-N
onC
omm
erci
al 3
.0 U
npor
ted
Lic
ence
.View Article Online

This journal is©The Royal Society of Chemistry 2016 Energy Environ. Sci., 2016, 9, 2939--2977 | 2973
182 E. Henrich, S. Burkle, Z. Meza-Renken and S. Rumpel,J. Anal. Appl. Pyrolysis, 1999, 49, 221–241.
183 P. C. A. Bergman, ECN Report, Energy Research Center of theNetherlands, ECN-C-05-073, The Netherlands, 2005.
184 C. Font Palma, Appl. Energy, 2013, 111, 129–141.185 J. Hrdlicka, D. Carpenter, M. Pomeroy, in Technical report,
Parametric gasification of oak and pine feedstocks using theTCPDU and slipstream water–gas shift catalysis, NationalRenewable Energy Laboratories, NREL/TP-510-44557,Golden, Colorado, USA, 2008.
186 T. Hosoya, H. Kawamoto and S. Saka, J. Anal. Appl.Pyrolysis, 2007, 80, 118–125.
187 D. Lv, M. Xu, X. Liu, Z. Zhan, Z. Li and H. Yao, Fuel Process.Technol., 2010, 91, 903–909.
188 P. Azadi, O. R. Inderwildi, R. Farnood and D. A. King,Renewable Sustainable Energy Rev., 2013, 21, 506–523.
189 M. Ni, D. Y. C. Leung, M. K. H. Leung and K. Sumathy, FuelProcess. Technol., 2006, 87, 461–472.
190 A. A. Boateng, W. P. Walawender, L. T. Fan and C. S. Chee,Bioresour. Technol., 1992, 40, 235–239.
191 A. C. C. Chang, H. F. Chang, F. J. Lin, K. H. Lin andC. H. Chen, Int. J. Hydrogen Energy, 2011, 36, 14252–14260.
192 N. Gao, A. Li and C. Quan, Bioresour. Technol., 2009, 100,4271–4277.
193 N. Gao, A. Li, C. Quan and F. Gao, Int. J. Hydrogen Energy,2008, 33, 5430–5438.
194 J. Herguido, J. Corella and J. Gonzalez-Saiz, Ind. Eng. Chem.Res., 1992, 31, 1274–1282.
195 S. Turn, C. Kinoshita, Z. Zhang, D. Ishimura and J. Zhou,Int. J. Hydrogen Energy, 1998, 23, 641–648.
196 M. Asadullah, T. Miyazawa, S.-i. Ito, K. Kunimori andK. Tomishige, Appl. Catal., A, 2003, 246, 103–116.
197 C. Di Blasi, Prog. Energy Combust. Sci., 2009, 35, 121–140.198 S. Sinthaworn and P. Nimityongskul, Waste Manage., 2009,
29, 1526–1531.199 L. Fryda, K. Panopoulos, P. Vourliotis, E. Pavlidou and
E. Kakaras, Fuel, 2006, 85, 1685–1699.200 D. Vamvuka, D. Zografos and G. Alevizos, Bioresour. Technol.,
2008, 99, 3534–3544.201 M. Sakawa, Y. Sakurai and Y. Hara, Fuel, 1982, 717.202 M. Guo, W. Song and J. Buhain, Renewable Sustainable
Energy Rev., 2015, 42, 712–725.203 G. W. Huber and A. Corma, Angew. Chem., Int. Ed., 2007,
46, 7184–7201.204 D. Rajagopal, S. E. Sexton, D. Roland-Holst and
D. Zilberman, Environ. Res. Lett., 2007, 2, 044004, DOI:10.1088/1748-9326/2/4/044004.
205 T. Yoshida, Y. Oshima and Y. Matsumura, Biomass Bioenergy,2004, 26, 71–78.
206 Y. Richardson, J. Blin and A. Julbe, Prog. Energy Combust.Sci., 2012, 38, 765–781.
207 C. Wan, F. Yu, Y. Zhang, Q. Li and J. Wooten, J. BiobasedMater. Bioenergy, 2013, 7, 690–695.
208 R. Luque, L. Herrero-Davila, J. M. Campelo, J. H. Clark,J. M. Hidalgo, D. Luna, J. M. Marinas and A. A. Romero,Energy Environ. Sci., 2008, 1, 542–564.
209 J. M. Bergthorson and M. J. Thomson, Renewable Sustain-able Energy Rev., 2015, 42, 1393–1417.
210 A. Demirbas, Prog. Energy Combust. Sci., 2007, 33, 1–18.211 A. Eliassi, L. Savadkoohi and A. Kargari, Chem. Eng. Commun.,
2007, 194, 1495–1502.212 J. Pickett, D. Anderson, D. Bowles, T. Bridgwater, P. Jarvis,
N. Mortimer, M. Poliakoff and J. Woods, Sustainable Biofuels:Prospects and Challenges, The Royal Society, London, UK, 2008.
213 F. Yaripour, F. Baghaei, I. Schmidt and J. Perregaard,Catal. Commun., 2005, 6, 147–152.
214 O. Beaumont and Y. Schwob, Ind. Eng. Chem. Process Des.Dev., 1984, 23, 637–641.
215 C. Di Blasi, Ind. Eng. Chem. Res., 1996, 35, 37–46.216 C. Di Blasi and C. Branca, Energy Fuels, 2003, 17, 247–254.217 M. Van de Velden, J. Baeyens, A. Brems, B. Janssens and
R. Dewil, Renewable Energy, 2010, 35, 232–242.218 UK Forestry Commission Publication, http://www.forestry.
gov.uk/pdf/eng-yh-seasoningwoodforfuel.pdf/$FILE/eng-yh-seasoningwoodforfuel/pdf, accessed November 2011.
219 H. Balat and E. Kirtay, Int. J. Hydrogen Energy, 2010, 35,7416–7426.
220 G. Schuster, G. Loffler, K. Weigl and H. Hofbauer,Bioresour. Technol., 2001, 77, 71–79.
221 S. Luo, B. Xiao, X. Guo, Z. Hu, S. Liu and M. He, Int.J. Hydrogen Energy, 2009, 34, 1260–1264.
222 L. Wei, S. Xu, J. Liu, C. Liu and S. Liu, Energy Fuels, 2008,22, 1997–2004.
223 P. Lv, Z. Xiong, J. Chang, C. Wu, Y. Chen and J. Zhu,Bioresour. Technol., 2004, 95, 95–101.
224 S. Luo, B. Xiao, X. Guo, Z. Hu, S. Liu and M. He, Int.J. Hydrogen Energy, 2009, 34, 1260–1264.
225 J. J. Hernandez, G. Aranda-Almansa and A. Bula, FuelProcess. Technol., 2010, 91, 681–692.
226 N. Jand and P. U. Foscolo, Ind. Eng. Chem. Res., 2005, 44,5079–5089.
227 S. Rapagna and G. M. di Celso, Biomass Bioenergy, 2008, 32,1123–1129.
228 A. v. d. Drift, H. Boerrigter, B. Coda, M. K. Cieplik andK. Hemmes, Entrained flow gasification of biomass, ECNand Shell Global Solutions, ECN-C-04-039, The Nether-lands, 2004.
229 V. Kirubakaran, V. Sivaramakrishnan, R. Nalini, T. Sekar,M. Premalatha and P. Subramanian, Renewable SustainableEnergy Rev., 2009, 13, 179–186.
230 A. Demirbas, Energy Sources, Part A, 2009, 31, 1728–1736.231 M. He, Z. Hu, B. Xiao, J. Li, X. Guo, S. Luo, F. Yang, Y. Feng,
G. Yang and S. Liu, Int. J. Hydrogen Energy, 2009, 34,195–203.
232 A. Inayat, M. M. Ahmad, M. I. A. Mutalib and S. Yusup,J. Appl. Sci., 2010, 10, 3183–3190.
233 A. Kumar, K. Eskridge, D. D. Jones and M. A. Hanna,Bioresour. Technol., 2009, 100, 2062–2068.
234 J. Li, Y. Yin, X. Zhang, J. Liu and R. Yan, Int. J. HydrogenEnergy, 2009, 34, 9108–9115.
235 P. M. Lv, Z. H. Xiong, J. Chang, C. Z. Wu, Y. Chen andJ. X. Zhu, Bioresour. Technol., 2004, 95, 95–101.
Energy & Environmental Science Review
Ope
n A
cces
s A
rtic
le. P
ublis
hed
on 0
2 Ju
ne 2
016.
Dow
nloa
ded
on 1
4/12
/201
7 15
:54:
47.
Thi
s ar
ticle
is li
cens
ed u
nder
a C
reat
ive
Com
mon
s A
ttrib
utio
n-N
onC
omm
erci
al 3
.0 U
npor
ted
Lic
ence
.View Article Online

2974 | Energy Environ. Sci., 2016, 9, 2939--2977 This journal is©The Royal Society of Chemistry 2016
236 M. Massoudi Farid, H. J. Jeong and J. Hwang, Fuel, 2015,162, 234–238.
237 I. Narvaez, A. Orio, M. P. Aznar and J. Corella, Ind. Eng.Chem. Res., 1996, 35, 2110–2120.
238 S. Sharma and P. N. Sheth, Energy Convers. Manage., 2016,110, 307–318.
239 J. Zhou, S. M. Masutani, D. M. Ishimura, S. Q. Turn andC. M. Kinoshita, Ind. Eng. Chem. Res., 2000, 39, 626–634.
240 C. Hanping, L. Bin, Y. Haiping, Y. Guolai and Z. Shihong,Energy Fuels, 2008, 22, 3493–3498.
241 M. C. Palancar, M. Serrano and J. M. Aragon, PowderTechnol., 2009, 194, 42–50.
242 T. Reed and A. Das, Handbook of biomass downdraft gasifierengine systems, Biomass Energy Foundation, USA, 1988.
243 M. A. Hamad, A. M. Radwan, D. A. Heggo and T. Moustafa,Renewable Energy, 2016, 85, 1290–1300.
244 J. H. Kihedu, R. Yoshiie and I. Naruse, Fuel Process.Technol., 2016, 141(part 1), 93–98.
245 Z. Ud Din and Z. A. Zainal, Renewable Sustainable EnergyRev., 2016, 53, 1356–1376.
246 Z. Wang, T. He, J. Qin, J. Wu, J. Li, Z. Zi, G. Liu, J. Wu andL. Sun, Fuel, 2015, 150, 386–393.
247 P. Corte, C. Lacoste and J. P. Traverse, J. Anal. Appl.Pyrolysis, 1985, 7, 323–335.
248 J. Arauzo, D. Radlein, J. Piskorz and D. S. Scott, Ind. Eng.Chem. Res., 1997, 36, 67–75.
249 L. Garcia, A. Benedicto, E. Romeo, M. L. Salvador, J. Arauzoand R. Bilbao, Energy Fuels, 2002, 16, 1222–1230.
250 D. Alvarez, M. Pena and A. G. Borrego, Energy Fuels, 2007,21, 1534–1542.
251 M. Asadullah, K. Fujimoto and K. Tomishige, Ind. Eng.Chem. Res., 2001, 40, 5894–5900.
252 A. K. Dalai, E. Sasaoka, H. Hikita and D. Ferdoust, EnergyFuels, 2003, 17, 1456–1463.
253 B. Feng, H. An and E. Tan, Energy Fuels, 2007, 21,426–434.
254 J. Gil, M. A. Caballero, J. A. Martın, M. P. Aznar andJ. Corella, Ind. Eng. Chem. Res., 1999, 38, 4226–4235.
255 J. Guan, Q. Wang, X. Li, Z. Luo and K. Cen, RenewableEnergy, 2007, 32, 2502–2515.
256 H. Gupta and L. S. Fan, Ind. Eng. Chem. Res., 2002, 41,4035–4042.
257 S. Lin, M. Harada, Y. Suzuki and H. Hatano, Fuel, 2006, 85,1143–1150.
258 M. R. Mahishi and D. Y. Goswami, Int. J. Hydrogen Energy,2007, 32, 2803–2808.
259 B. Moghtaderi, Fuel, 2007, 86, 2422–2430.260 A. B. Rao and E. S. Rubin, Environ. Sci. Technol., 2002, 36,
4467–4475.261 D. P. Harrison, Greenhouse Gas Control Technologies, Elsevier
Science Ltd, Oxford, UK, 2005.262 D. P. Harrison, Energy Procedia, 2009, 1, 675–681.263 A. Silaban, M. Narcida and D. P. Harrison, Resour., Conserv.
Recycl., 1992, 7, 139–153.264 L. Devi, K. J. Ptasinski and F. J. J. G. Janssen, Biomass
Bioenergy, 2002, 24, 125–140.
265 E. M. Fitzpatrick, K. D. Bartle, M. L. Kubacki, J. M. Jones,M. Pourkashanian, A. B. Ross, A. Williams and K. Kubica,Fuel, 2009, 88, 2409–2417.
266 P. Morf, P. Hasler and T. Nussbaumer, Fuel, 2002, 81,843–853.
267 J. Han and H. Kim, Renewable Sustainable Energy Rev.,2008, 12, 397–416.
268 H. Yang, R. Yan, H. Chen, C. Zheng, D. H. Lee andD. T. Liang, Energy Fuels, 2006, 20, 388–393.
269 Y. Zhang, S. Kajitani, M. Ashizawa and Y. Oki, Fuel, 2009,89, 302–309.
270 M. Asmadi, H. Kawamoto and S. Saka, J. Anal. Appl.Pyrolysis, 2011, 92, 417–425.
271 H. E. Jegers and M. T. Klein, Ind. Eng. Chem. Process Des.Dev., 1985, 24, 173–183.
272 A. L. Sullivan and R. Ball, Atmos. Environ., 2012, 47,133–141.
273 L. Burhenne, J. Messmer, T. Aicher and M. P. Laborie,J. Anal. Appl. Pyrolysis, 2013, 101, 177–184.
274 S. Mahapatra and S. Dasappa, Energy Sustainable Dev.,2014, 19, 122–129.
275 S. Anis and Z. A. Zainal, Renewable Sustainable Energy Rev.,2011, 15, 2355–2377.
276 C. M. Kinoshita, Y. Wang and J. Zhou, J. Anal. Appl.Pyrolysis, 1994, 29, 169–181.
277 R. A. Knight, Biomass Bioenergy, 2000, 18, 67–77.278 S. A. Nair, K. Yan, A. J. M. Pemen, G. J. J. Winands, F. M.
van Gompel, H. E. M. van Leuken, E. J. M. van Heesch,K. J. Ptasinski and A. A. H. Drinkenburg, J. Electrost., 2004, 61,117–127.
279 L. Fagbemi, L. Khezami and R. Capart, Appl. Energy, 2001,69, 293–306.
280 Z. Abu El-Rub, E. A. Bramer and G. Brem, Fuel, 2008, 87,2243–2252.
281 L. Devi, K. J. Ptasinski and F. J. J. G. Janssen, Fuel Process.Technol., 2005, 86, 707–730.
282 P. Gilbert, C. Ryu, V. Sharifi and J. Swithenbank, Bioresour.Technol., 2009, 100, 6045–6051.
283 P. Lv, Z. Yuan, L. Ma, C. Wu, Y. Chen and J. Zhu, RenewableEnergy, 2007, 32, 2173–2185.
284 M. Asadullah, T. Miyazawa, S.-i. Ito, K. Kunimori, S. Koyamaand K. Tomishige, Biomass Bioenergy, 2004, 26, 269–279.
285 S. O. Negro, R. A. A. Suurs and M. P. Hekkert, Technol.Forecast. Soc., 2008, 75, 57–77.
286 L. Dong, M. Asadullah, S. Zhang, X. S. Wang, H. Wu andC. Z. Li, Fuel, 2013, 108, 409–416.
287 UN Food and Agriculture Organization Papers, http://www.fao.org/forestry/62269/en/, accessed 1986.
288 E. C. Beagle, Proceedings of the first international producergas conference, Colombo, Srilanka, 1982.
289 Babcock and Wilcox Volund Brochures, http://www.volund.dk/B/media/downloads/brochures-BIO/biomass_gasification_plants.pdf, accessed 2011.
290 Swedish Energy Agency Report, http://www.ieatask33.org/app/webroot/files/file/publications/new/Small%20Small_scale_gasification_overview.pdf, accessed May 2011.
Review Energy & Environmental Science
Ope
n A
cces
s A
rtic
le. P
ublis
hed
on 0
2 Ju
ne 2
016.
Dow
nloa
ded
on 1
4/12
/201
7 15
:54:
47.
Thi
s ar
ticle
is li
cens
ed u
nder
a C
reat
ive
Com
mon
s A
ttrib
utio
n-N
onC
omm
erci
al 3
.0 U
npor
ted
Lic
ence
.View Article Online
This journal is©The Royal Society of Chemistry 2016 Energy Environ. Sci., 2016, 9, 2939--2977 | 2975
291 R. Rauch, J. Hrbek and H. Hofbauer, Wiley Interdiscip. Rev.:Energy Environ., 2014, 3, 343–362.
292 International Energy Agency Report, http://www.ieabcc.nl/meetings/32_03_meeting_SaltLakeCity.pdf, accessed February2003.
293 International Energy Agency Report, http://www.ieabcc.nl/meetings/32_03_meeting_SaltLakeCity.pdf, accessed February2003.
294 R. Rauch, M. Bolhar-Nordenkampf, K. Bosch, C. Aichernig,H. Hofbauer, International Conference on Biomass Utiliza-tion, Thailand, June 2002.
295 A. F. Kirkels and G. P. J. Verbong, Renewable SustainableEnergy Rev., 2011, 15, 471–481.
296 R. Kramreiter, M. Url, J. Kotik and H. Hofbauer, FuelProcess. Technol., 2008, 89, 90–102.
297 M + W Group Germany Brochure, http://www.mwgroup.net/wp-content/uploads/2014/11/Brochure_CHP_Generation_EN.pdf, accessed 2014.
298 Z. Zhou, X. Yin, J. Xu and L. Ma, Energy Policy, 2012, 51,52–57.
299 U. Arena, F. Di Gregorio and M. Santonastasi, Chem. Eng.J., 2010, 162, 580–590.
300 C. Bang-Møller, M. Rokni and B. Elmegaard, Energy, 2011,36, 4740–4752.
301 C. Bang-Møller, M. Rokni, B. Elmegaard, J. Ahrenfeldt andU. B. Henriksen, Energy, 2013, 58, 527–537.
302 S. Bengtsson, Biomass Bioenergy, 2011, 35, S2–S7.303 F. Hamdullahpur, C. O. Colpan, I. Dincer, Proceedings of the
18th World Hydrogen Energy Conference, 2010, pp. 305–313.304 W. Doherty, A. Reynolds and D. Kennedy, Energy, 2010, 35,
4545–4555.305 A. Giuffrida, M. C. Romano and G. Lozza, Energy, 2013, 53,
221–229.306 Gussing and Trisaia Plants Online Report, http://www.
uniqueproject.eu/public/deliverables/D7.2.pdf, accessedDecember 2010.
307 US Environmental Protection Agency, http://www3.epa.gov/chp/documents/biomass_chp_catalog.pdf, accessedSeptember 2007.
308 A. J. Minchener, Fuel, 2005, 84, 2222–2235.309 M. Morandin, F. Marechal and S. Giacomini, Biomass
Bioenergy, 2013, 49, 299–314.310 F. P. Nagel, S. Ghosh, C. Pitta, T. J. Schildhauer and
S. Biollaz, Biomass Bioenergy, 2011, 35, 354–362.311 F. P. Nagel, T. J. Schildhauer, N. McCaughey and S. M. A.
Biollaz, Int. J. Hydrogen Energy, 2009, 34, 6826–6844.312 K. Ståhl and M. Neergaard, Biomass Bioenergy, 1998, 15,
205–211.313 S. Wongchanapai, H. Iwai, M. Saito and H. Yoshida,
J. Power Sources, 2012, 216, 314–322.314 K. K, PhD thesis, Aalborg University, 2009.315 P. Stoholm, R. G. Nielsen, L. Sarbaek and L. Tobiasen,
12th European Biomass Conference, Amsterdam, 2002.316 J. Lehmann and S. Joseph, Biochar for Environmental
Management – Science and Technology, Earth Scan, London,2009.
317 L. D, North American Biochar Conference, Boulder, Color-ado, USA, Aug 2009.
318 S. Joseph and J. Lehmann, Biochar for EnvironmentalManagement – Science and Technology, Earth Scan, London,2009.
319 M. Rillig and J. E. Thies, Biochar for EnvironmentalManagement – Science and Technology, Earth Scan, London,2009.
320 A. Abuadala and I. Dincer, Int. J. Hydrogen Energy, 2011, 36,12780–12793.
321 A. Bhattacharya, A. Bhattacharya and A. Datta, Int.J. Hydrogen Energy, 2012, 37, 18782–18790.
322 Unique Gasifier for Hydrogen Production Research ProjectReport, http://www.unifhy.eu, accessed September 2012.
323 S. Shabani, M. Aghajani Delavar and M. Azmi, Int.J. Hydrogen Energy, 2013, 38, 3630–3639.
324 R. Toonssen, N. Woudstra and A. H. M. Verkooijen, Int.J. Hydrogen Energy, 2008, 33, 4074–4082.
325 S. S. Ail and S. Dasappa, Renewable Sustainable Energy Rev.,2016, 58, 267–286.
326 E. van Steen and M. Claeys, Chem. Eng. Technol., 2008, 31,655–666.
327 J. M. Bergthorson and M. J. Thomson, Renewable Sustain-able Energy Rev., 2015, 42, 1393–1417.
328 M. Åhman, Energy Policy, 2010, 38, 208–217.329 E. Fahlen and E. O. Ahlgren, Energy, 2009, 34, 2184–2195.330 R. Felder and R. Dones, Biomass Bioenergy, 2007, 31, 403–415.331 L. Shuying, W. Guocai and P. DeLaquil, Energy Sustainable
Dev., 2001, 5, 47–53.332 B. Steubing, R. Zah and C. Ludwig, Biomass Bioenergy,
2011, 35, 2950–2960.333 T. Grobl, H. Walter and M. Haider, Appl. Energy, 2012, 97,
451–461.334 J. Kopyscinski, T. J. Schildhauer and S. M. A. Biollaz, Fuel,
2010, 89, 1763–1783.335 C. M. van der Meijden, H. J. Veringa and L. P. L. M. Rabou,
Biomass Bioenergy, 2010, 34, 302–311.336 E. Dotzauer, D. Djuric Ilic, L. Trygg and G. Broman, J Clean
Prod., 2013.337 P. Haro, P. Ollero, A. L. Villanueva Perales and A. Gomez-
Barea, Appl. Energy, 2013, 102, 950–961.338 J. C. Meerman, A. Ramırez, W. C. Turkenburg and A. P. C.
Faaij, Renewable Sustainable Energy Rev., 2012, 16, 6083–6102.339 A. Narvaez, D. Chadwick and L. Kershenbaum, Appl.
Energy, 2014, 113, 1109–1117.340 K. S. Ng and J. Sadhukhan, Biomass Bioenergy, 2011, 35,
3218–3234.341 E. Wetterlund, S. Leduc, E. Dotzauer and G. Kindermann,
Energy, 2012, 41, 462–472.342 P. Hottinger, S. Biollaz, C. Pitta, J. Karl, Proceedings of 17th
European Biomass Conference and Exhibition, Hamburg,Germany, 2009.
343 C. R. Vitasari, M. Jurascik and K. J. Ptasinski, Energy, 2011,36, 3825–3837.
344 S. Wirth and J. Markard, Technol. Forecas. Soc., 2011, 78,635–649.
Energy & Environmental Science Review
Ope
n A
cces
s A
rtic
le. P
ublis
hed
on 0
2 Ju
ne 2
016.
Dow
nloa
ded
on 1
4/12
/201
7 15
:54:
47.
Thi
s ar
ticle
is li
cens
ed u
nder
a C
reat
ive
Com
mon
s A
ttrib
utio
n-N
onC
omm
erci
al 3
.0 U
npor
ted
Lic
ence
.View Article Online

2976 | Energy Environ. Sci., 2016, 9, 2939--2977 This journal is©The Royal Society of Chemistry 2016
345 B. F. Moller, A. Molin and K. Stahl, The Third InternationalConference on Thermo-chemical Conversion of Biomass, ChicagoUSA, 2013.
346 GoBiGas Project Online Information, http://gobigas.goteborgenergi.se/En/, accessed 2013.
347 G. I, presented in part at Baltic Bioenergy, Oslo, May, 2013.348 T. Schildhauer, S. Biollaz, D. Ulrich, H. Tremmel, R. Rauch
and M. Koch, Proceedings of 17th European Biomass Conferenceand Exhibition, Hamburg, Germany, 2009.
349 M. L. de Souza-Santos, Solid Fuels Combustion and Gasification:Modeling, Simulation, CRC Press, 2010.
350 A. K. Sharma, Sol. Energy, 2008, 82, 918–928.351 Y. Wang and L. Yan, Int. J. Mol. Sci., 2008, 9, 1108–1130.352 M. Puig-Arnavat, J. A. Hernandez, J. C. Bruno and
A. Coronas, Biomass Bioenergy, 2013, 49, 279–289.353 I. S. Antonopoulos, A. Karagiannidis, A. Gkouletsos and
G. Perkoulidis, Waste Manage., 2012, 32, 710–718.354 E. Azzone, M. Morini and M. Pinelli, Renewable Energy,
2012, 46, 248–254.355 B. V. Babu and P. N. Sheth, Energy Convers. Manage., 2006,
47, 2602–2611.356 N. S. Barman, S. Ghosh and S. De, Bioresour. Technol.,
2012, 107, 505–511.357 J. Gao, Y. Zhao, S. Sun, H. Che, G. Zhao and J. Wu, Chem.
Eng. J., 2012, 213, 97–103.358 A. Melgar, J. F. Perez, H. Laget and A. Horillo, Energy
Convers. Manage., 2007, 48, 59–67.359 A. K. Sharma, Energy Convers. Manage., 2008, 49, 832–842.360 K. Sandeep and S. Dasappa, Int. J. Hydrogen Energy, 2014,
39, 19474–19484.361 M. Rokni, Int. J. Hydrogen Energy, 2015, 40, 7855–7869.362 S. Vakalis, F. Patuzzi and M. Baratieri, Bioresour. Technol.,
2016, 206, 173–179.363 W. Doherty, A. Reynolds and D. Kennedy, Biomass Bioenergy,
2009, 33, 1158–1167.364 A. Gungor, Int. J. Hydrogen Energy, 2011, 36, 6592–6600.365 I. Hannula and E. Kurkela, Biomass Bioenergy, 2012, 38, 58–67.366 P. Kaushal, T. Proell and H. Hofbauer, Biomass Bioenergy,
2011, 35, 2491–2498.367 C. Loha, P. K. Chatterjee and H. Chattopadhyay, Energy
Convers. Manage., 2011, 52, 1583–1588.368 T. D. B. Nguyen, S. I. Ngo, Y. I. Lim, J. W. Lee, U. D.
Lee and B. H. Song, Energy Convers. Manage., 2012, 54,100–112.
369 J. Xie, W. Zhong, B. Jin, Y. Shao and H. Liu, Bioresour.Technol., 2012, 121, 36–46.
370 P. Baggio, M. Baratieri, L. Fiori, M. Grigiante, D. Avi andP. Tosi, Energy Convers. Manage., 2009, 50, 1426–1435.
371 A. Deydier, F. Marias, P. Bernada, F. Couture and U. Michon,Biomass Bioenergy, 2011, 35, 133–145.
372 A. Pirc, M. Sekavcnik and M. Mori, Stroj. Vestn.-J. Mech. E.,2012, 58, 291–299.
373 X. T. Li, J. R. Grace, C. J. Lim, A. P. Watkinson, H. P. Chenand J. R. Kim, Biomass Bioenergy, 2004, 26, 171–193.
374 M. K. Karmakar and A. B. Datta, Bioresour. Technol., 2011,102, 1907–1913.
375 E. D. Gordillo and A. Belghit, Biomass Bioenergy, 2011, 35,2034–2043.
376 A. Inayat, M. M. Ahmad, M. I. A. Mutalib and S. Yusup, FuelProcess. Technol., 2012, 93, 26–34.
377 M. B. Nikoo and N. Mahinpey, Biomass Bioenergy, 2008, 32,1245–1254.
378 A. Saravanakumar, M. J. Hagge, T. M. Haridasan andK. M. Bryden, Biomass Bioenergy, 2011, 35, 4248–4260.
379 C. C. Sreejith, C. Muraleedharan and P. Arun, Fuel Process.Technol., 2015, 130, 197–207.
380 R. Khonde and A. Chaurasia, Int. J. Hydrogen Energy, 2016,41, 8793–8802.
381 P. Pepiot, C. J. Dibble and T. D. Foust, Computational fluiddynamics modeling of biomass gasification and pyrolysis,in Computational Modeling in Lignocellulosic Biofuel Produc-tion, ACS Symposium Series, National Renewable EnergyLoboratory, USA, 2010, vol. 1052, pp. 273–298.
382 C. Di Blasi, Prog. Energy Combust. Sci., 2008, 34, 47–90.383 I. Janajreh and M. Al Shrah, Energy Convers. Manage., 2013,
65, 783–792.384 N. Couto, V. Silva, E. Monteiro, P. Brito and A. Rouboa,
Renewable Energy, 2015, 77, 174–181.385 E. Savuto, A. Di Carlo, E. Bocci, A. D’Orazio, M. Villarini,
M. Carlini and P. U. Foscolo, Int. J. Hydrogen Energy, 2015,40, 7991–8004.
386 M. Kasiri and A. R. Khataee, Artificial neural networkmodeling of water and wastewater treatment processes, NOVAScience Publisher, Inc., USA, 2011.
387 C. Sreejith, C. Muraleedharan and P. Arun, Biomass Convers.Biorefin., 2013, 3, 283–304.
388 R. Mikulandric, D. Loncar, D. Bohning, R. Bohme andM. Beckmann, Energy Convers. Manage., 2015, 104, 135–146.
389 P. Ji, W. Feng and B. Chen, Chem. Eng. Sci., 2009, 64,582–592.
390 B. Zhao, X. Zhang, L. Chen, R. Qu, G. Meng, X. Yi andL. Sun, Biomass Bioenergy, 2010, 34, 140–144.
391 J. Corella, M. A. Caballero, M. P. Aznar and C. Brage, Ind.Eng. Chem. Res., 2003, 42, 3001–3011.
392 W. de Jong, O. Unal, J. Andries, K. R. G. Hein andH. Spliethoff, Appl. Energy, 2003, 74, 425–437.
393 R. Radmanesh, J. Cnaouki and C. Guy, AIChE J., 2006, 52,4258–4272.
394 K. Umeki, T. Namioka and K. Yoshikawa, Appl. Energy,2012, 90, 38–45.
395 K. Umeki, K. Yamamoto, T. Namioka and K. Yoshikawa,Appl. Energy, 2010, 87, 791–798.
396 L. Abdelouahed, O. Authier, G. Mauviel, J. P. Corriou,G. Verdier and A. Dufour, Energy Fuels, 2012, 26,3840–3855.
397 J. C. G. Andrae, Fuel, 2013, 107, 740–748.398 K. Norinaga and O. Deutschmann, Ind. Eng. Chem. Res.,
2007, 46, 3547–3557.399 K. Norinaga, O. Deutschmann, N. Saegusa and J. i. Hayashi,
J. Anal. Appl. Pyrolysis, 2009, 86, 148–160.400 K. Norinaga, Y. Sakurai, R. Sato and J. I. Hayashi, Chem.
Eng. J., 2011, 178, 282–290.
Review Energy & Environmental Science
Ope
n A
cces
s A
rtic
le. P
ublis
hed
on 0
2 Ju
ne 2
016.
Dow
nloa
ded
on 1
4/12
/201
7 15
:54:
47.
Thi
s ar
ticle
is li
cens
ed u
nder
a C
reat
ive
Com
mon
s A
ttrib
utio
n-N
onC
omm
erci
al 3
.0 U
npor
ted
Lic
ence
.View Article Online

This journal is©The Royal Society of Chemistry 2016 Energy Environ. Sci., 2016, 9, 2939--2977 | 2977
401 K. Norinaga, T. Shoji, S. Kudo and J. I. Hayashi, Fuel, 2013,103, 141–150.
402 T. Faravelli, A. Frassoldati, G. Migliavacca and E. Ranzi,Biomass Bioenergy, 2010, 34, 290–301.
403 A. Jess, Fuel, 1996, 75, 1441–1448.404 B. Kjellstrom, Hazards of producer gas operation, The Beijer
Institute, Stockholm, Sweden, 1984.405 G. San Miguel, M. P. Domınguez, M. Hernandez and
F. Sanz-Perez, Biomass Bioenergy, 2012, 47, 134–144.406 M. Kampa and E. Castanas, Environ. Pollut., 2008, 151,
362–367.407 L. Curtis, W. Rea, P. Smith-Willis, E. Fenyves and Y. Pan,
Environ. Int., 2006, 32, 815–830.408 Q. Sun, X. Hong and L. E. Wold, Circulation, 2010, 121,
2755–2765.409 L. Trasande and G. D. Thurston, J. Allergy Clin. Immunol.,
2005, 115, 689–699.410 L. B. Clarke, Fuel, 1993, 72, 731–736.411 H. Cui, S. Q. Turn, V. Keffer, D. Evans, T. Tran and
M. Foley, Fuel, 2013, 108, 1–12.412 J. Lewtas, Mutat. Res., 2007, 636, 95–133.413 G. Genon, D. Panepinto and F. Viggiano, WIT Trans. Ecol.
Environ., 2014, 2, 995–1006.414 Dong Energy Demnark, http://www.dongenergy.com/en/
investors/company-announcements/company-announcement-detail?omxid=536723, accessed 2010.
415 R. V. Siemons, Biomass Bioenergy, 2001, 20, 271–285.416 H. E. Stassen, in World Bank Technical Paper, Small-scale
biomass gasifiers for heat and power: a global review,Record Number 19951812605, 1995, pp. xvii + 61.
417 Z. Zhang, W. Zhao and W. Zhao, Sustainability, 2014, 6,9159–9178.
418 https://energypedia.info/wiki/Biomass_Gasification_(Small-scale), accessed May 2016.
419 UNDP India, http://www.in.undp.org/content/india/en/home/operations/projects/environment_and_energy/biomass_energy_forruralindia.html, accessed May 2016.
420 N. Ravindranath, H. Somashekar, S. Dasappa andJ. C. Reddy, Curr. Sci., 2004, 87, 932–941.
421 H. Garrido, V. Vendeirinho and M. Brito, Renewable Energy,2016, 92, 47–57.
422 K. A. Motghare, A. P. Rathod, K. L. Wasewar andN. K. Labhsetwar, Waste Manage., 2016, 47, 40–45.
423 V. C. J. Singh and S. J. Sekhar, Appl. Therm. Eng., 2015, 97,22–27.
424 A. Sanchez, E. Torres and R. Kalid, Renewable SustainableEnergy Rev., 2015, 49, 278–290.
425 H. F. V. Flores, T. Furubayashi and T. Nakata, CleanTechnol. Environ., 2016, 1–18.
426 C. S. Li, N. Mustafa, T. Doevendans, S. A. Chin andA. W. A. Karim Ghani, Chem. Eng. Trans., 2015, 45, 1441–1446.
427 T. Zhang, J. Ni and D. Xie, Environ. Sci. Pollut. Res., 2015,22, 16453–16462.
428 US Environmental Protection Agency, https://yosemite.epa.gov/ee/epa/eed.nsf/webpages/biofuels.html, accessed May2016.
429 A. D. Watt, R. H. W. Bradshaw, J. Young, D. Alard,T. Bolger, D. Chamberlain, F. Fernandez-Gonzalez,R. Fuller, P. Gurrea, K. Henle, R. Johnson, Z. Korsos,P. Lavelle, J. Niemela, P. Nowicki, M. Rebane,C. Scheidegger, J. P. Sousa, C. Van Swaay and A. Vanbergen,Issues Environ. Sci. Technol., 2007, 135–160.
430 J. Gressel, Plant Sci., 2008, 174, 246–263.431 J. C. Lovett, Afr. J. Ecol., 2007, 45, 117–119.
Energy & Environmental Science Review
Ope
n A
cces
s A
rtic
le. P
ublis
hed
on 0
2 Ju
ne 2
016.
Dow
nloa
ded
on 1
4/12
/201
7 15
:54:
47.
Thi
s ar
ticle
is li
cens
ed u
nder
a C
reat
ive
Com
mon
s A
ttrib
utio
n-N
onC
omm
erci
al 3
.0 U
npor
ted
Lic
ence
.View Article Online