Embed Size (px)
Citation preview
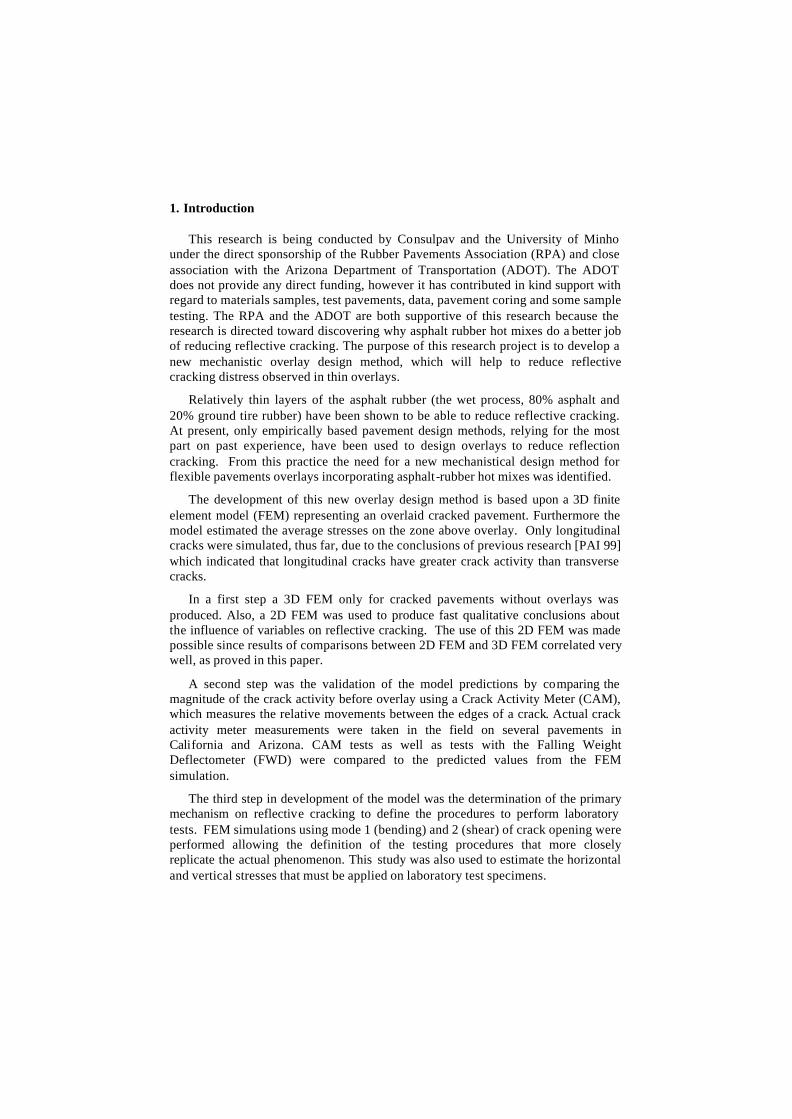
An Overlay Design Method for Reflective Cracking Jorge C. Pais*, Jorge B. Sousa**, George B. Way***, and Richard N. Stubstad**** * University of Minho Department of Civil Engineering, 4800 Guimarães - Portugal [email protected] ** Consulpav Portugal Taguspark – Tecnologia I, nº26, 2780 Oeiras - Portugal [email protected] *** Arizona Department of Transportation, Materials Section 1221 North 21st Avenue – MD 068R Phoenix Arizona 85009-3740, USA [email protected] **** Consulpav International P.O. Box 700 Oak View, California 93022 - USA [email protected] ABSTRACT: The purpose of this paper is to develop a pavement design method to address reflective cracking using sound mechanistic principles reinforced by practical experience. This paper presents the initial concept of the proposed overlay design method. Test sections have been constructed to assess the effect of overlay thickness, crack width and load to validate the design method. Crack activity under the effect of traffic loads was initially based on finite element results, where stresses in the zone above cracks were calculated. This numerical simulation was calibrated with crack activity results measured on in-service cracked pavements in Arizona and California. A test method was then developed to perform reflective cracking tests in the laboratory. This test method is based on findings about the primary mechanism that causes reflective cracking, and the ratio between horizontal and shear stresses in the overlay above cracks. Comparisons between expected performance of asphalt-rubber hot mix and conventional asphalt overlays were made, taking into account the models produced through this research.
KEY-WORDS: Reflective Cracking, Asphalt-Rubber Hot Mix, Asphalt Rubber Asphalt Concrete, Finite Element
Modelling, Overlay Design Method
1. Introduction
This research is being conducted by Consulpav and the University of Minho under the direct sponsorship of the Rubber Pavements Association (RPA) and close association with the Arizona Department of Transportation (ADOT). The ADOT does not provide any direct funding, however it has contributed in kind support with regard to materials samples, test pavements, data, pavement coring and some sample testing. The RPA and the ADOT are both supportive of this research because the research is directed toward discovering why asphalt rubber hot mixes do a better job of reducing reflective cracking. The purpose of this research project is to develop a new mechanistic overlay design method, which will help to reduce reflective cracking distress observed in thin overlays.
Relatively thin layers of the asphalt rubber (the wet process, 80% asphalt and 20% ground tire rubber) have been shown to be able to reduce reflective cracking. At present, only empirically based pavement design methods, relying for the most part on past experience, have been used to design overlays to reduce reflection cracking. From this practice the need for a new mechanistical design method for flexible pavements overlays incorporating asphalt-rubber hot mixes was identified.
The development of this new overlay design method is based upon a 3D finite element model (FEM) representing an overlaid cracked pavement. Furthermore the model estimated the average stresses on the zone above overlay. Only longitudinal cracks were simulated, thus far, due to the conclusions of previous research [PAI 99] which indicated that longitudinal cracks have greater crack activity than transverse cracks.
In a first step a 3D FEM only for cracked pavements without overlays was produced. Also, a 2D FEM was used to produce fast qualitative conclusions about the influence of variables on reflective cracking. The use of this 2D FEM was made possible since results of comparisons between 2D FEM and 3D FEM correlated very well, as proved in this paper.
A second step was the validation of the model predictions by comparing the magnitude of the crack activity before overlay using a Crack Activity Meter (CAM), which measures the relative movements between the edges of a crack. Actual crack activity meter measurements were taken in the field on several pavements in California and Arizona. CAM tests as well as tests with the Falling Weight Deflectometer (FWD) were compared to the predicted values from the FEM simulation.
The third step in development of the model was the determination of the primary mechanism on reflective cracking to define the procedures to perform laboratory tests. FEM simulations using mode 1 (bending) and 2 (shear) of crack opening were performed allowing the definition of the testing procedures that more closely replicate the actual phenomenon. This study was also used to estimate the horizontal and vertical stresses that must be applied on laboratory test specimens.

The fourth step was performing laboratory tests using the Reflective Cracking Device (RCD) with asphalt rubber mixes and conventional mixes using the recommended stress levels and loading patterns.
The fifth step, determination of the shift factors between laboratory and field results is currently under way.
This paper presents the summary of the models developed, validation efforts and comparison of the model predictions assuming that the shift factor is 1. This value is just an assumption at this stage to show how the model ranks the mixes.
2. Reflective cracking
Overlays are the most commonly used method for rehabilitating cracked pavements. However, they often do not perform as expected because of existing cracks that propagate through the newly constructed overlay within a short period of time [HAA 89]. This problem is called “reflective cracking” and is well identified when an overlay shows a crack pattern identical to that existing in the old pavement. When an overlay is placed on a cracked pavement, the cracks in the old pavement surface will propagate through the overlay and will appear in the surface.
Reflective cracking is caused by thermal contraction, by repeated traffic loads, or by a combination of these mechanisms. In addition, the temperature dependent stiffness of the materials and flaws in the overlay (i.e. built -in cracks during construction) as reported by [HAL 87] can have an important effect.
Existing overlay design methods do not take into account reflective cracking. The only form of cracking typically mechanically modeled is flexural fatigue, which only captures the following phenomena:
1. Tensile strain at the bottom of the overlay — especially for thicker overlays when the neutral zone is above the bottom of the new overlay.
2. Tensile strain at the bottom of the existing asphalt concrete — especially for relatively intact (uncracked) pavements.
3. Compressive stresses or strains at the top of the unbound materials — when the failure mechanism is not fatigue cracking.
However, to minimize or delay crack propagation, some other experience based
techniques are used which include the increase of overlay thickness, modification of asphalt properties or a stress-absorbing interlayer placed between the existing pavement and the overlay layer.
Even so, the existing cracks propagate up to the new pavement surface producing a too early failure of the entire pavement with high costs for the Highways Agencies and for the road users. Thus, the development of an overlay design method, which
includes a criterion for reflective cracking, is of great importance for road maintenance.
A design method to take into account the reflective cracking must consider the discontinuity produced by the cracks on the existing pavement. This cracking condition can only be modeled using a special numerical technique such as finite element analysis which is associated with fracture mechanics concepts. In this work, finite element modeling was used to estimate stresses, which are employed to define force level to perform laboratory tests.
3. Numerical simulation to estimate stresses in the overlay
In general multi-layered, elastic layered theory techniques have been used to
evaluate the distribution of stresses and strains in pavement structures. Multi-layer methods are based on the theory of continuum mechanics and do not take into account the physical discontinuities such as cracks that exist in pavements.
Finite element model techniques are currently the most comprehensive way of modelling the pavement and are considered to be the most appropriate tool for improving the understanding of the behaviour of flexible pavement structures. Such a finite element model would consider the effects of flexible layer thicknesses and material properties. The material properties and behaviour are essential in this analysis, as with any form of theoretical pavement assessment. It is also possible to describe the interface between layers and cracks.
A simple finite element mesh can be developed to carry out a basic analysis. However, to adequately model the characteristics of the pavement structure in order to fully understand its behaviour, a 3D FEM is required.
Thus, the SAP2000 finite element software was chosen which incorporates these features and allows easy and fast analysis. The 3D FEM to simulate an overlaid cracked pavement was made in two parts. In the first part, 3D FEM represented the cracked pavement and validated the results of the CAM testing before overlay. Only after this validation the full 3D FEM was made and validated with FWD results obtained after overlay.
3.1. Validation of 3D FEM using the crack activity before overlay
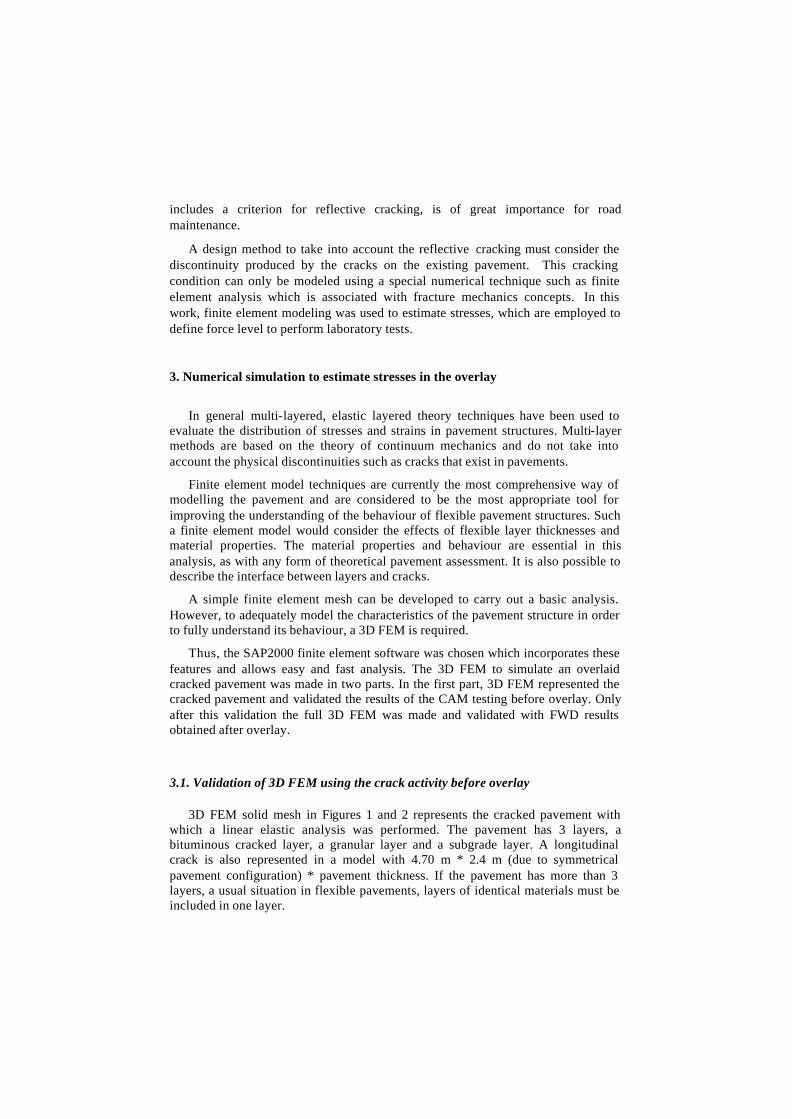
3D FEM solid mesh in Figures 1 and 2 represents the cracked pavement with which a linear elastic analysis was performed. The pavement has 3 layers, a bituminous cracked layer, a granular layer and a subgrade layer. A longitudinal crack is also represented in a model with 4.70 m * 2.4 m (due to symmetrical pavement configuration) * pavement thickness. If the pavement has more than 3 layers, a usual situation in flexible pavements, layers of identical materials must be included in one layer.
It has been demonstrated by [PAI 99] that the most important component of the crack activity is the relative vertical displacement. This is so because after an overlay the horizontal displacements are reduced to extremely small values. Because it is difficult to measure stresses in cracked pavements or overlays and it is relatively simple to measure crack activity, a model was developed to evaluate to which extent the same basic principles and models being developed for the determination of the stresses in overlays could predict the vertical crack activity.
Figure 1. 3D mesh used to calculate the crack activity before overlay
Figure 2. 3D representation of finite element mesh
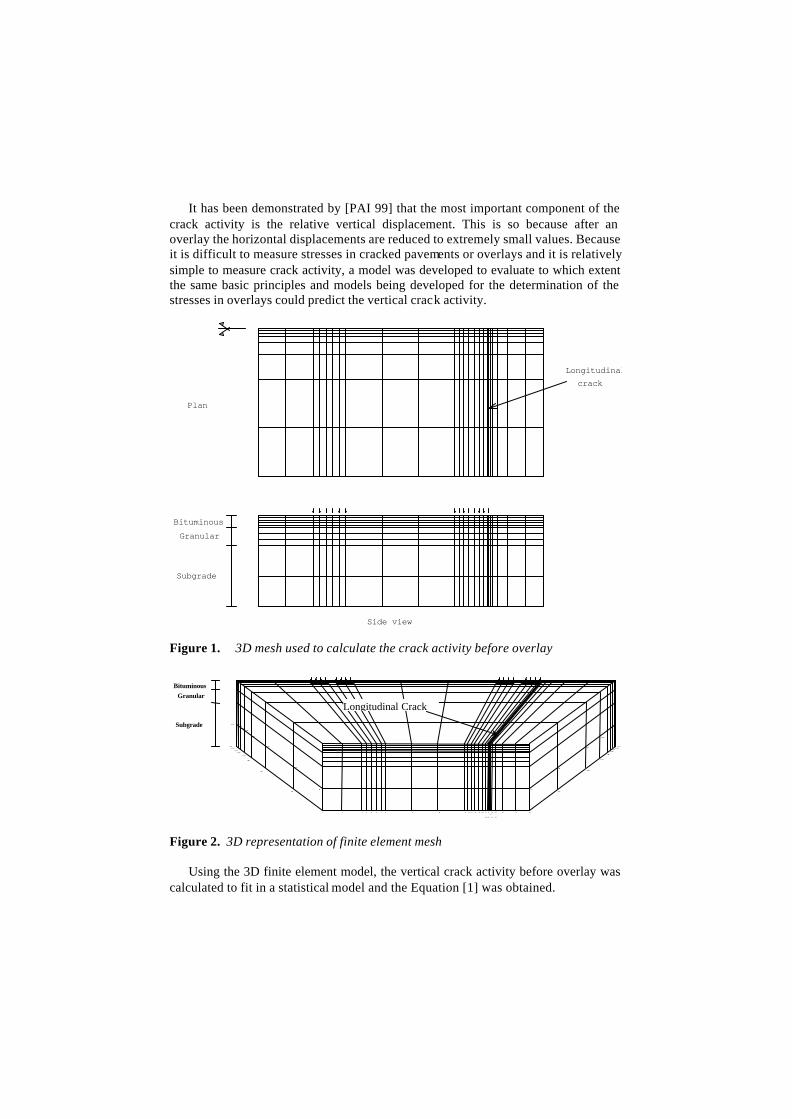
Using the 3D finite element model, the vertical crack activity before overlay was calculated to fit in a statistical model and the Equation [1] was obtained.
BituminousGranular
Subgrade
Plan
Side view
Longitudinalcrack
Bituminous Granular
Subgrade
1 2 3 4 5 6 7 8 9 10 11 1 2 1 3 14 15 1 6 1 7 18 24 2 5 2 6 27 2 8 2 3
20 2 1 2 2 1 9
29 589
1177 1765 2353 2941 3529 4117 4705
617 1205
1793 2381 2969 3557 4145 4733
61 6 1204
1792 2380 2968 3556 4144 4732 644
1232 1820
5 6
Longitudinal Crack
( ) ( ) ( ) ( ) ( ) fMsubeMgradMbetcTgrabTbetaAct +++++= log.log.log.log.log. [1] where:
Act = vertical crack activity before overlay; Tbet = bituminous cracked layer thickness; Tgra = granular layer thickness; Mbet = bituminous cracked layer modulus; Mgra = granular layer modulus; Msub = subgrade modulus; a, b, c, d, e, f = statistical coefficients given by Table 1.
Table 1. Coefficients for the model of vertical crack activity before overlay
Coefficients a b c d e f
11.773 -21.388 -52.893 -94.619 -16.418 1181.66
A comparison between the FEM calculated and the statistical estimated vertical crack activity before overlay is shown in Figure 3 where a good correlation can be observed.
0
50
100
150
200
250
300
0 50 100 150 200 250 300
FEM values
Sta
t va
lues
Figure 3. Comparison between FEM and Statistical vertical crack activity before
overlay
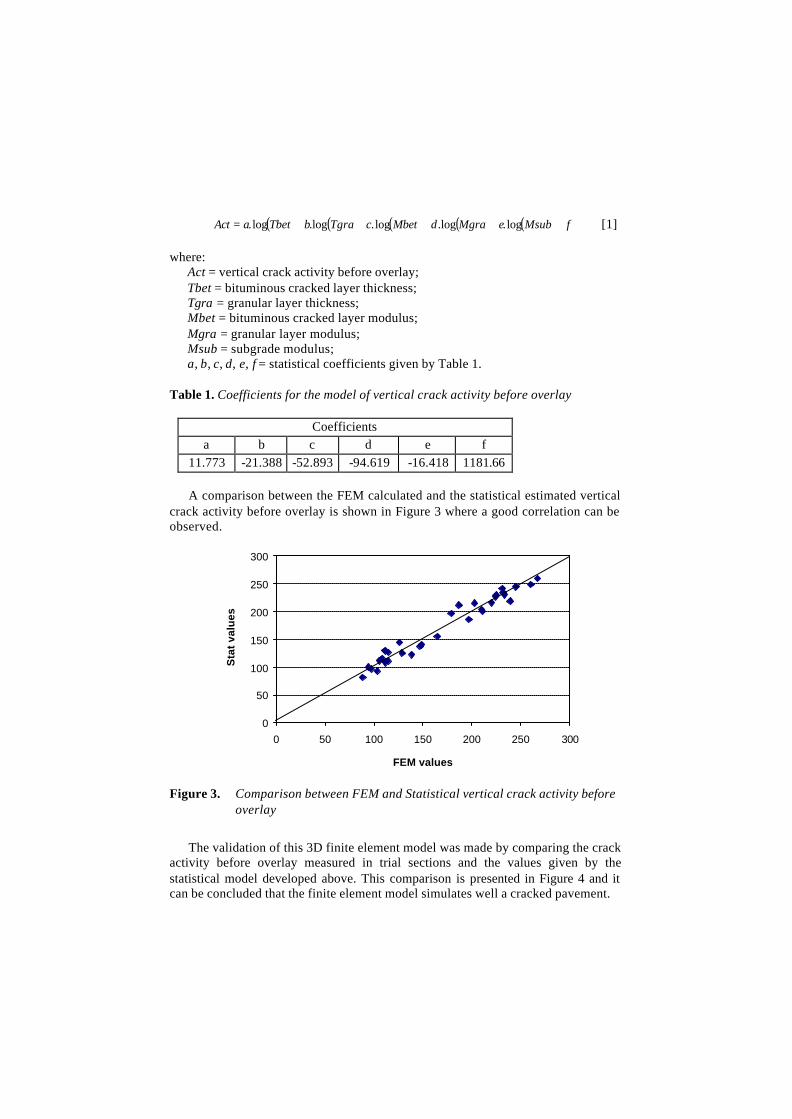
The validation of this 3D finite element model was made by comparing the crack activity before overlay measured in trial sections and the values given by the statistical model developed above. This comparison is presented in Figure 4 and it can be concluded that the finite element model simulates well a cracked pavement.
The small differences observed in this comparison, mainly due to low levels of crack activity, where the finite element model gives larger values than the measured, could possibly be due to the evaluation of pavement layer modulus in cracked zones where the pavement shows a non-constant linear behavior.
y = 0.8384x + 54.581R2 = 0.89
0
50
100
150
200
250
300
350
400
0 50 100 150 200 250 300 350 400
Measured Crack Activity (E-6m)
Pre
dict
ed C
rack
Act
ivity
(E
-6m
)
Figure 4. Comparison between measured and FEM predicted vertical crack
activity before overlay 3.2. Validation of 3D FEM using FWD measurements after overlay
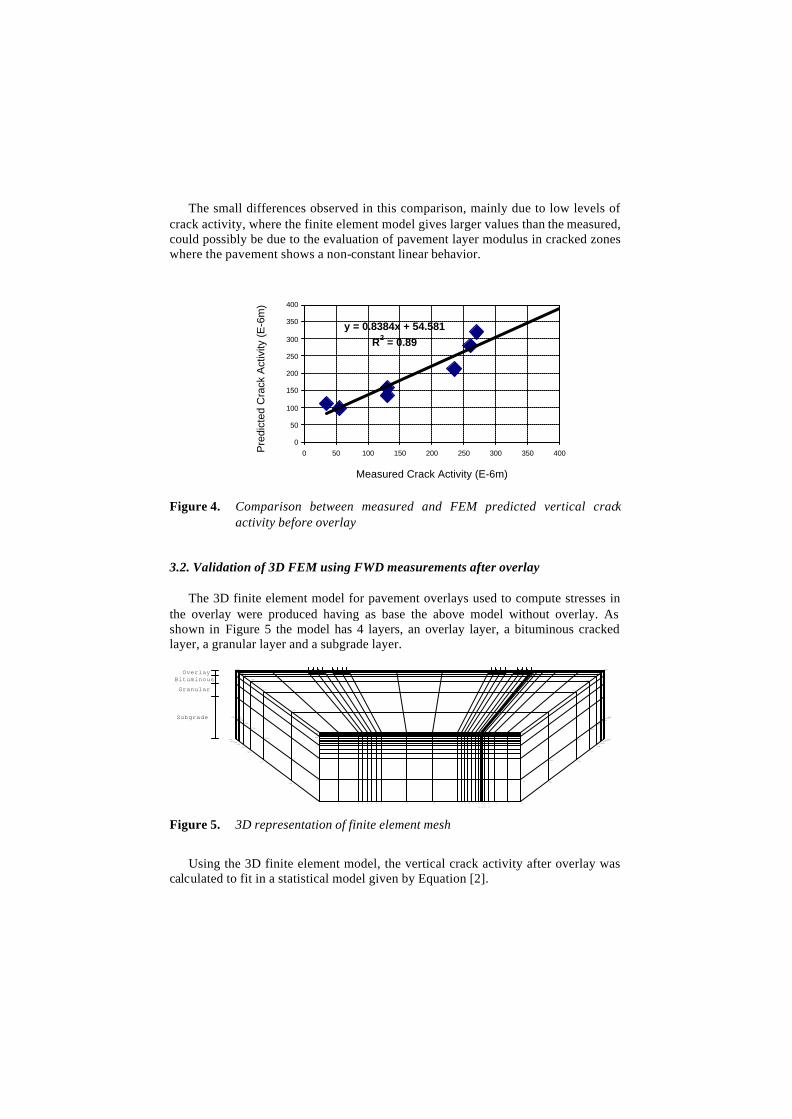
The 3D finite element model for pavement overlays used to compute stresses in the overlay were produced having as base the above model without overlay. As shown in Figure 5 the model has 4 layers, an overlay layer, a bituminous cracked layer, a granular layer and a subgrade layer.
Figure 5. 3D representation of finite element mesh
Using the 3D finite element model, the vertical crack activity after overlay was calculated to fit in a statistical model given by Equation [2].
OverlayBituminous
Granular
Subgrade
1 2 3 4 5 6 7 8 9 10 11 12 13 14 15 16 17 18 24 25 26 27 2823
20 21 2219
29
57
141
281
561 588
589
1177
1765
2353
1149
1737
2325
294135294117
4705
2913
5265
350140894677
617
1205
1793
2381
2969355741454733
616
1204
1792
2380
296835564144
4732
644
1232
1820
240829963584
41724760
1176
1764
2352
294035284116
47045292
56
[ ]bmthicknessOverlayaxVCAAO )( *)6101( =− [2]
Where:
( )[ ]∏=
+=6
121 ln*
iiii aXaa [3]
( )[ ]∏=
+=6
121 ln*
iiii bXbb [4]
and aij and b ij coefficients are given by the Table 2 Table 2. Statistical coefficients for vertical crack activity after overlay model
i Xi a1i a2i b1i b2i 1 Cracked thickness (m) -1.190E-01 -1.286E+00 6.065E-02 -8.820E-012 Granular thickness (m) 4.940E-01 -3.279E+00 4.751E-03 2.967E-013 Overlay modulus (MPa) -2.885E-01 2.945E+00 -8.227E-03 1.457E+004 Cracked modulus (MPa) 1.734E-01 -6.342E-01 -1.826E-01 3.036E+005 Granular modulus (MPa) -9.188E-03 6.512E-01 -1.051E-01 1.465E+006 Subgrade modulus (MPa) -5.246E-01 4.856E+00 3.770E-02 9.037E-01
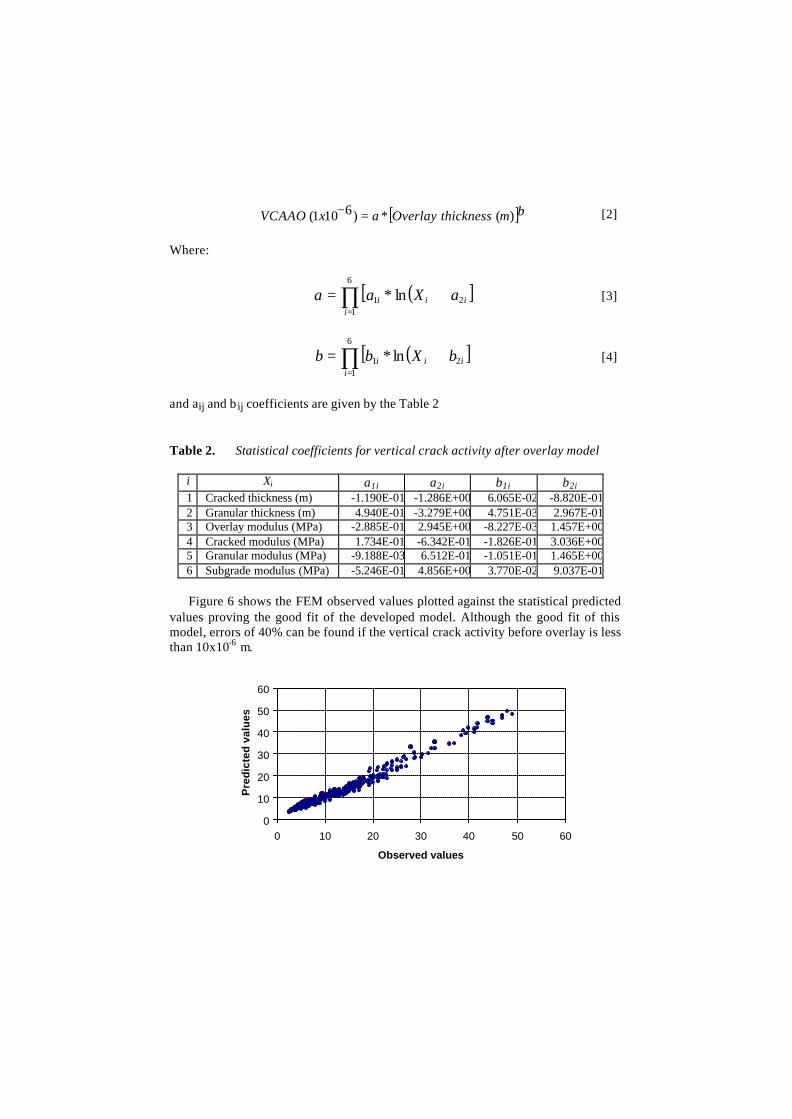
Figure 6 shows the FEM observed values plotted against the statistical predicted
values proving the good fit of the developed model. Although the good fit of this model, errors of 40% can be found if the vertical crack activity before overlay is less than 10x10-6 m.
0
10
20
30
40
50
60
0 10 20 30 40 50 60
Observed values
Pre
dic
ted
val
ues
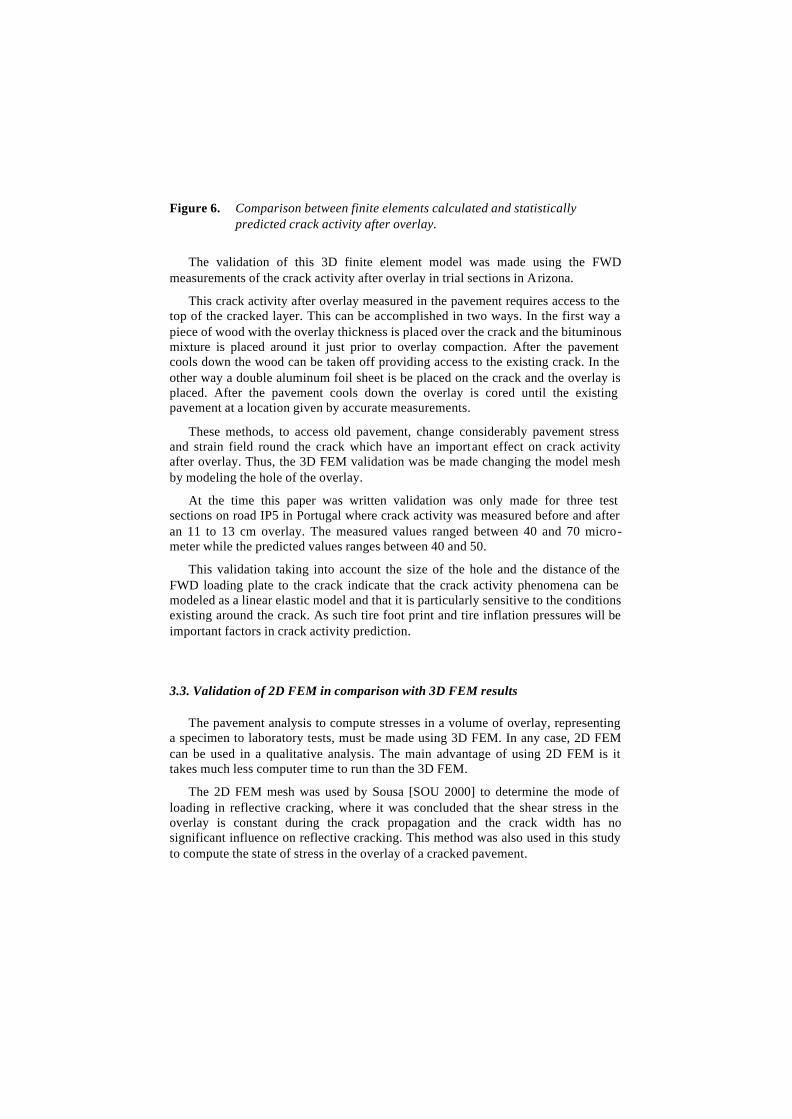
Figure 6. Comparison between finite elements calculated and statistically predicted crack activity after overlay.
The validation of this 3D finite element model was made using the FWD measurements of the crack activity after overlay in trial sections in Arizona.
This crack activity after overlay measured in the pavement requires access to the top of the cracked layer. This can be accomplished in two ways. In the first way a piece of wood with the overlay thickness is placed over the crack and the bituminous mixture is placed around it just prior to overlay compaction. After the pavement cools down the wood can be taken off providing access to the existing crack. In the other way a double aluminum foil sheet is be placed on the crack and the overlay is placed. After the pavement cools down the overlay is cored until the existing pavement at a location given by accurate measurements.
These methods, to access old pavement, change considerably pavement stress and strain field round the crack which have an important effect on crack activity after overlay. Thus, the 3D FEM validation was be made changing the model mesh by modeling the hole of the overlay.
At the time this paper was written validation was only made for three test sections on road IP5 in Portugal where crack activity was measured before and after an 11 to 13 cm overlay. The measured values ranged between 40 and 70 micro-meter while the predicted values ranges between 40 and 50.
This validation taking into account the size of the hole and the distance of the FWD loading plate to the crack indicate that the crack activity phenomena can be modeled as a linear elastic model and that it is particularly sensitive to the conditions existing around the crack. As such tire foot print and tire inflation pressures will be important factors in crack activity prediction.
3.3. Validation of 2D FEM in comparison with 3D FEM results
The pavement analysis to compute stresses in a volume of overlay, representing a specimen to laboratory tests, must be made using 3D FEM. In any case, 2D FEM can be used in a qualitative analysis. The main advantage of using 2D FEM is it takes much less computer time to run than the 3D FEM.
The 2D FEM mesh was used by Sousa [SOU 2000] to determine the mode of loading in reflective cracking, where it was concluded that the shear stress in the overlay is constant during the crack propagation and the crack width has no significant influence on reflective cracking. This method was also used in this study to compute the state of stress in the overlay of a cracked pavement.
The Average Shear Stress Above the Crack was computed within a volume of the overlay corresponding to the crack width*150mm*overlay thickness as presented in Figure 7.
Figure 7. Schematic view of volume used to compute the Average Shear Stress Above the Crack.
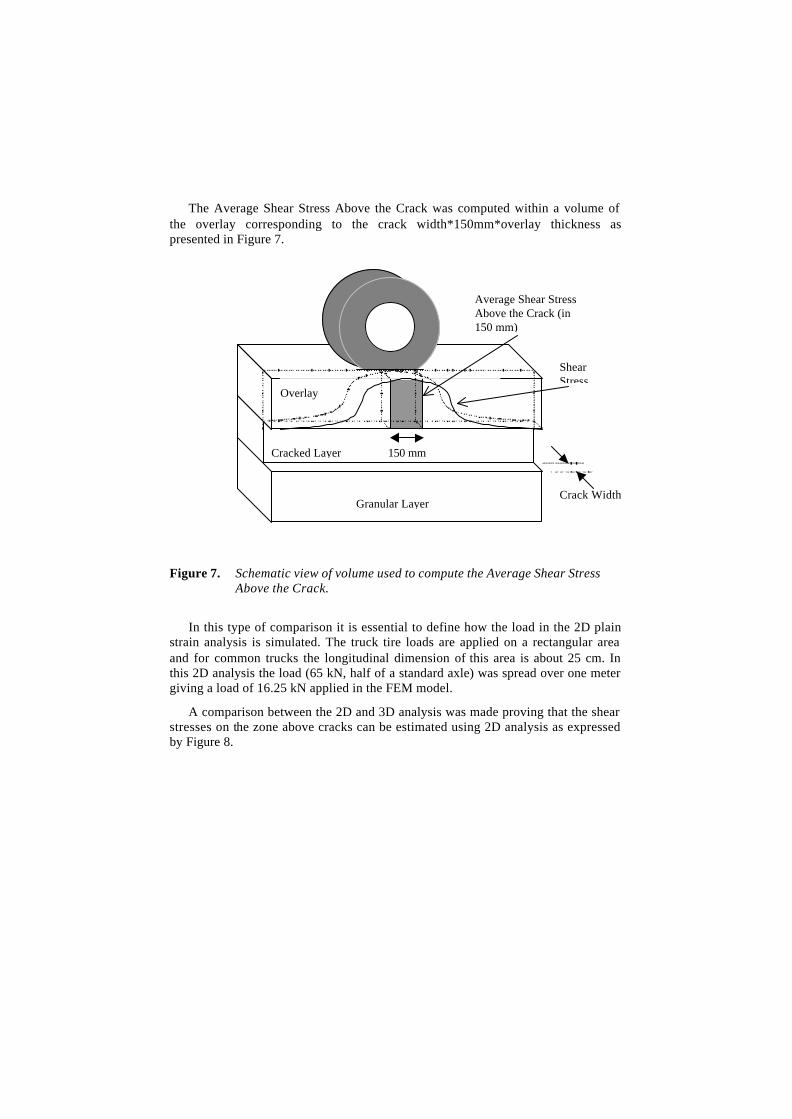
In this type of comparison it is essential to define how the load in the 2D plain strain analysis is simulated. The truck tire loads are applied on a rectangular area and for common trucks the longitudinal dimension of this area is about 25 cm. In this 2D analysis the load (65 kN, half of a standard axle) was spread over one meter giving a load of 16.25 kN applied in the FEM model.
A comparison between the 2D and 3D analysis was made proving that the shear stresses on the zone above cracks can be estimated using 2D analysis as expressed by Figure 8.
150 mm
Crack Width
ShearStress
Average Shear StressAbove the Crack (in150 mm)
Granular Layer
Cracked Layer
Overlay
y = 0.185xR
2 = 0.9104
0
50
100
150
200
250
300
350
0 500 1000 1500 2000
3D (average stress in kPa on an area of 15cm * overlay thickness)
2D (a
vera
ge
stre
ss in
kP
a o
n a
n
area
of
15 c
m *
ove
rlay
th
ickn
ess)
FEM values
Figure 8. Comparison between 2D and 3D FEM stresses 3.4. Sensitivity analysis using 2D FEM
To define a model to estimate the average stress level in overlay, the influence, in terms of trend laws, of the pavement variables on stress must be known. This influence must be made for at least 3 levels of each variable otherwise a linear trend will be found.
So, this analysis using 2D modeling was made calculating the average shear stress in the zone above the existing crack for a meter of pavement for 4800 combinations (not a full factorial) varying the pavement characteristics as follow:
Overlay thickness (20; 60; 100 and 140 mm) Overlay modulus (2000; 4000; 6000; 8000 and 10000 MPa)
Bituminous thickness (100; 150; 200 and 250 mm) Bituminous modulus (2000; 2750 and 3500 MPa)
Granular thickness (200; 300 and 400 mm) Granular modulus (150; 300 and 450 MPa)
Subgrade modulus (50; 100 and 150 MPa) Subgrade “thickness” (1000 mm)
Crack width (5 mm)
A sensitivity analysis was made using seven variables from which the following conclusions were determined:
• The influence of overlay thickness on shear stress follows a power law, decreasing the shear stress as the overlay thickness increases. The shear
stress decreases on average 4 times when the overlay thickness increases from 20 mm (0.8 inches) to 140 mm (5.5 inches);
• The influence of cracked layer thickness on shear stress follows a logarithmic law, increasing the average shear stress as the bituminous cracked thickness increases. In this case the shear stress increase on average 2 times when the bituminous cracked thickness increases from 100 mm (3.9 inches) to 250 mm (9.8 inches);
• The influence of granular thickness on average shear stress follows a logarithmic law, decreasing the shear stress with the increase of granular thickness. This shear stress decreases on average 10 % when the granular thickness increases from 200 mm (7.9 inches) to 400 mm (15.8 inches);
• The influence of overlay modulus on average shear stress follows a logarithmic law, increasing the shear stress with the increase of overlay modulus. This shear stress increases on average 20 % when the overlay modulus increases from 2 000 MPa (290,000 psi) to 10 000 MPa (1,450,000 psi);
• The influence of bituminous cracked layer modulus on average shear stress follows a logarithmic law, increasing the shear stress with the increase of bituminous cracked layer modulus. This shear stress increases on average 15 % when the bituminous cracked layer modulus increases from 2 000 MPa (290,000psi) to 3 500 MPa (508,000 psi);
• The influence of granular modulus on the average shear stress follows a logarithmic law, decreasing the shear stress with the increase of granular modulus. This shear stress decreases on average 20 % when the granular modulus increases from 150 MPa (21,750 psi) to 450 MPa (65,250psi);
• The influence of subgrade modulus on average shear stress follows a logarithmic law, decreasing the shear stress with the increase of subgrade modulus. This shear stress decreases on average 15 % when the subgrade modulus increases from 50 MPa (7,250 psi) to 150 MPa (21,750 psi).
3.5. Model for Average Shear Stress
The 3D FEM was used to calculate the average shear stress on the overlay in a volume of (overlay thickness * crack width * 150 mm) representing the zone of a test specimen for laboratory tests that is subjected to the shear stress. The 150 mm length was selected to obtain the most stressed area within the tire length. It also happens to be the width of the specimen that can be used in the RCD testing device.
A small number of computer runs 384 (= 4x3x2x2x2x2x2) were executed once the qualitative influence of pavement variables on shear stress is known from 2D analysis. The following combinations were made:
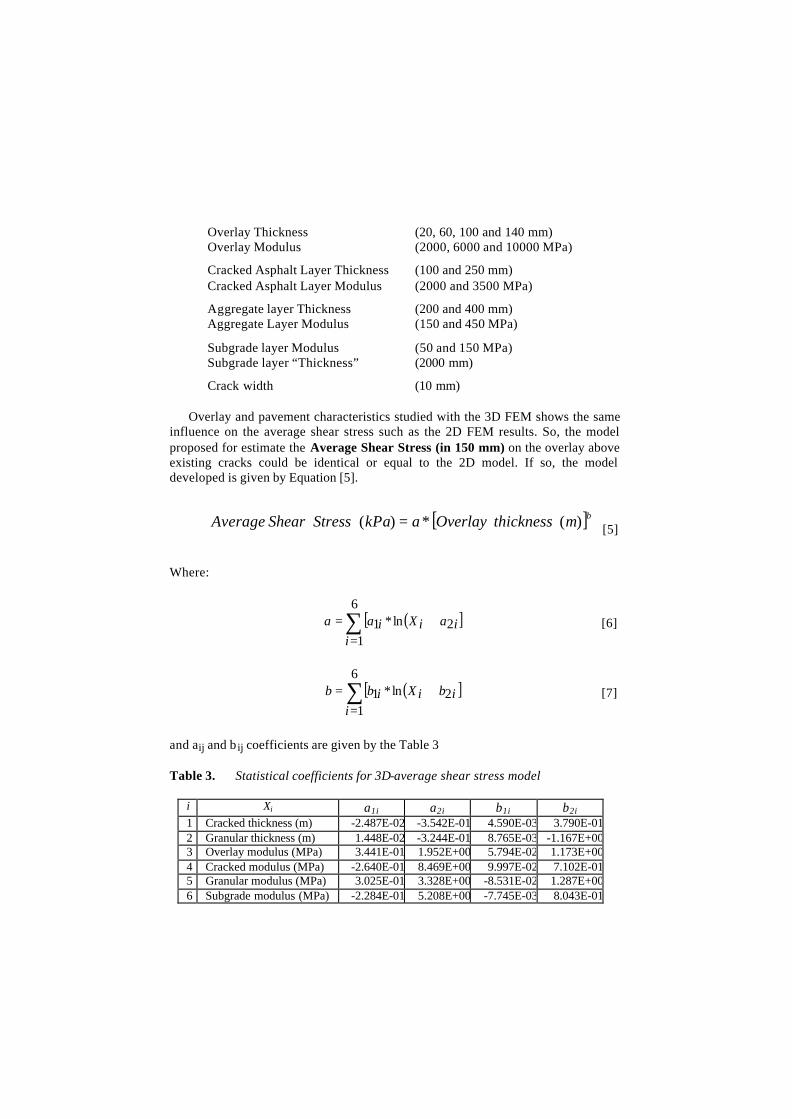
Overlay Thickness (20, 60, 100 and 140 mm) Overlay Modulus (2000, 6000 and 10000 MPa)
Cracked Asphalt Layer Thickness (100 and 250 mm) Cracked Asphalt Layer Modulus (2000 and 3500 MPa)
Aggregate layer Thickness (200 and 400 mm) Aggregate Layer Modulus (150 and 450 MPa)
Subgrade layer Modulus (50 and 150 MPa) Subgrade layer “Thickness” (2000 mm)
Crack width (10 mm)
Overlay and pavement characteristics studied with the 3D FEM shows the same influence on the average shear stress such as the 2D FEM results. So, the model proposed for estimate the Average Shear Stress (in 150 mm) on the overlay above existing cracks could be identical or equal to the 2D model. If so, the model developed is given by Equation [5].
[ ]bmthicknessOverlayakPaStressShearAverage )( *)( =
[5]
Where:
( )[ ]∑=
+=6
12ln*1
iiaiXiaa [6]
( )[ ]∑=
+=6
12ln*1
iibiXibb [7]
and aij and b ij coefficients are given by the Table 3 Table 3. Statistical coefficients for 3D-average shear stress model
i Xi a1i a2i b1i b2i 1 Cracked thickness (m) -2.487E-02 -3.542E-01 4.590E-03 3.790E-012 Granular thickness (m) 1.448E-02 -3.244E-01 8.765E-03 -1.167E+003 Overlay modulus (MPa) 3.441E-01 1.952E+00 5.794E-02 1.173E+004 Cracked modulus (MPa) -2.640E-01 8.469E+00 9.997E-02 7.102E-015 Granular modulus (MPa) 3.025E-01 3.328E+00 -8.531E-02 1.287E+006 Subgrade modulus (MPa) -2.284E-01 5.208E+00 -7.745E-03 8.043E-01
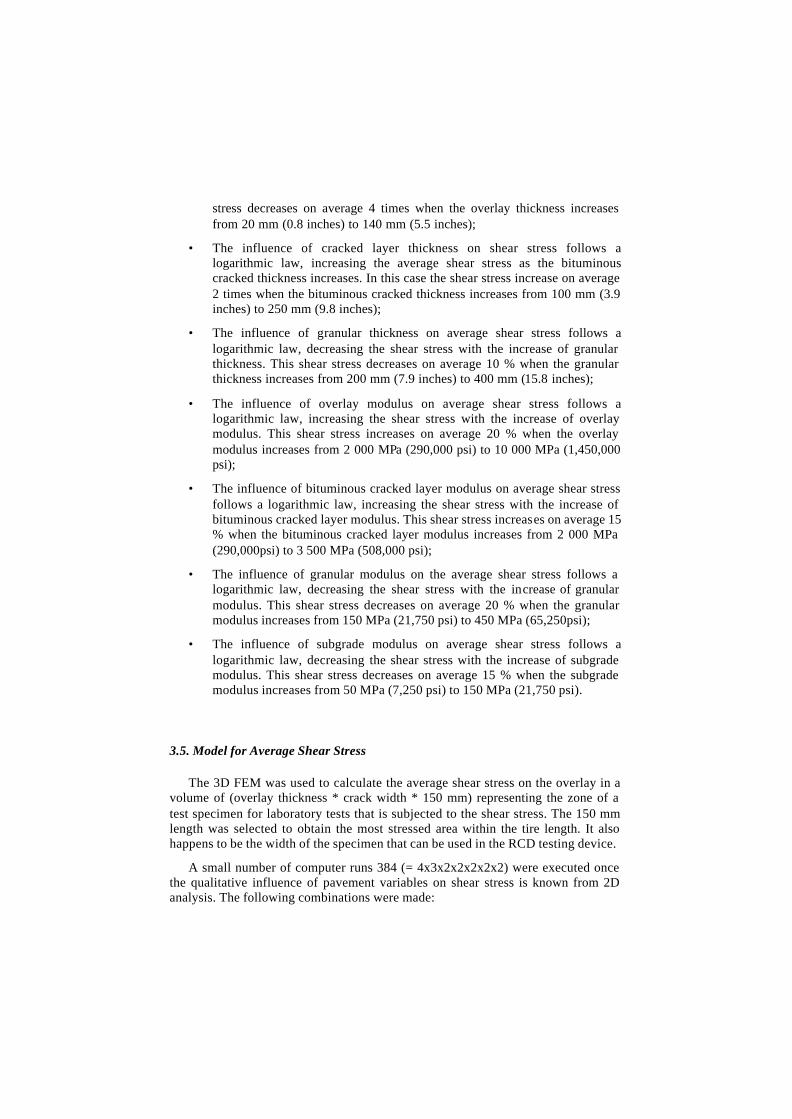
The Figures 9 and 10 show the FEM observed values plotted against the
statistical predicted values proving the good fit of the developed model for which the relative errors are less that 10%. Only in two cases an error of 14% was found.
0
250
500
750
1000
1250
1500
0 250 500 750 1000 1250 1500
Observed values
Pre
dic
ted
val
ues
Figure 9. Plot of FEM values ”observed” against statistical values “predicted”
-20
-15
-10
-5
0
5
10
0 500 1000 1500 2000
Predicted values
Res
idua
l (%
)
Figure 10. Residual (in percent) for predicted values
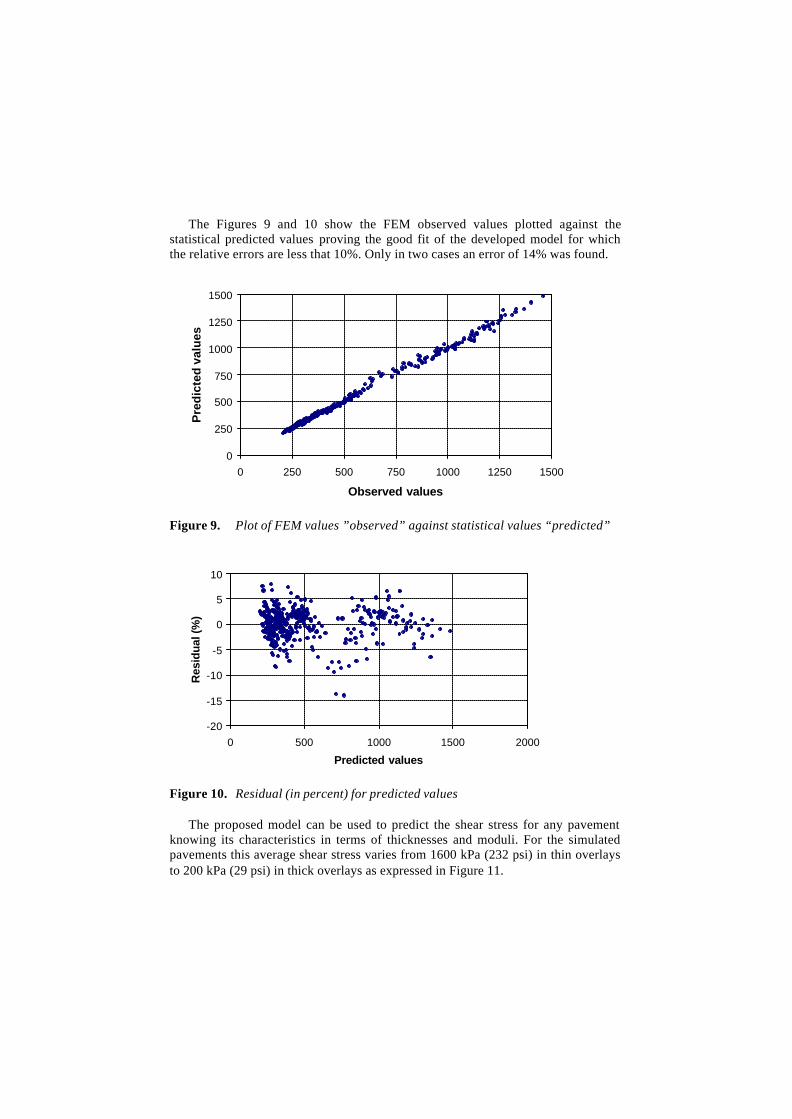
The proposed model can be used to predict the shear stress for any pavement knowing its characteristics in terms of thicknesses and moduli. For the simulated pavements this average shear stress varies from 1600 kPa (232 psi) in thin overlays to 200 kPa (29 psi) in thick overlays as expressed in Figure 11.
0
200
400
600
800
1000
1200
1400
1600
Ave
rag
e S
hea
r st
ress
in 1
50 m
m (
kPa)
Figure 11. Average Shear Stress on the overlay as function of overlay thickness. With each thickness all other variables are considered. 4. Conditioning mechanism on reflective cracking phenomenon
Reflective cracking tests must be executed applying a constant shear force on the test specimen as concluded by Sousa [SOU 2000] because this force remains constant during crack propagation. In the other direction (horizontal) a stress simulating either tension or compression must be applied.
When a wheel passes on a longitudinally-cracked pavement it either passes over the crack or adjacent to the crack. In the first case the zone above the crack works mostly in tension while otherwise mostly in shear.
In the FEM simulations the load was applied in the two situations described above. In one case the overlay deflects and the bottom (or all the overlay depending on the thickness and other parameters) of the overlay is mostly in tension. In the other the zone over the crack is mostly under shear.
This study was executed only with the 2D mesh given the good relationship obtained with the 3D mesh. For this analysis 384 combinations were investigated in both simulations (shear and tension).
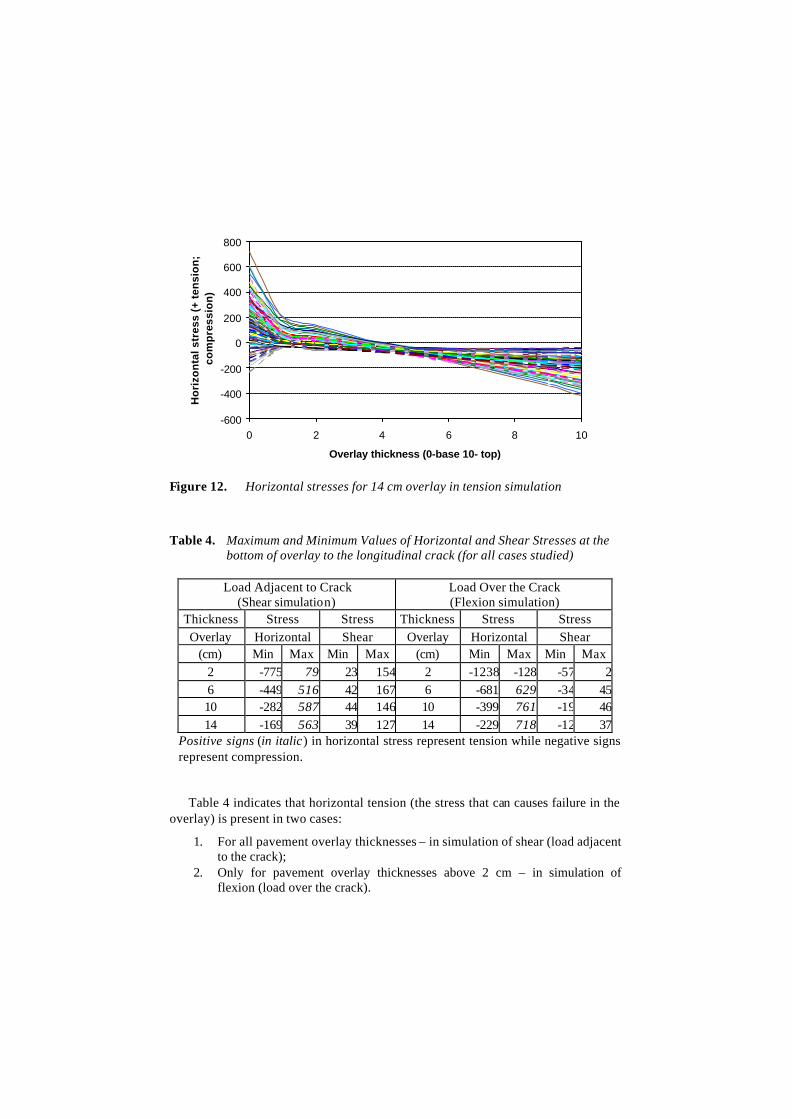
An example of the stresses study is given by Figure 12 where horizontal stresses for 14 cm overlay in tension simulation is plotted against overlay thickness location (Position 0 represents the bottom, position 10 represents the top).
In summary for the thicknesses evaluated the values of maximum and minimum values of horizontal and shear stresses at the bottom of the overlay is presented in Table 4.
-600
-400
-200
0
200
400
600
800
0 2 4 6 8 10
Overlay thickness (0-base 10- top)
Ho
rizo
nta
l str
ess
(+ t
ensi
on
; -
com
pre
ssio
n)
Figure 12. Horizontal stresses for 14 cm overlay in tension simulation
Table 4. Maximum and Minimum Values of Horizontal and Shear Stresses at the
bottom of overlay to the longitudinal crack (for all cases studied)
Load Adjacent to Crack (Shear simulation)
Load Over the Crack (Flexion simulation)
Thickness Stress Stress Thickness Stress Stress Overlay Horizontal Shear Overlay Horizontal Shear
(cm) Min Max Min Max (cm) Min Max Min Max 2 -775 79 23 154 2 -1238 -128 -57 26 -449 516 42 167 6 -681 629 -34 4510 -282 587 44 146 10 -399 761 -19 4614 -169 563 39 127 14 -229 718 -12 37
Positive signs (in italic) in horizontal stress represent tension while negative signs represent compression.
Table 4 indicates that horizontal tension (the stress that can causes failure in the overlay) is present in two cases:
1. For all pavement overlay thicknesses – in simulation of shear (load adjacent to the crack);
2. Only for pavement overlay thicknesses above 2 cm – in simulation of flexion (load over the crack).
In shear simulation for very thin overlay (about 20 mm) the value of the tension is negligible in all cases given that it is about 10 times less then the value in compression. Thus in thin overlays (about 20 mm) the overlay layer is mostly under compression. As such the prevalent failing mechanism must be shear (tension due to thermal effects can also be present but may not be significant in longitudinal cracks due to the short distance to the shoulder).
For thick overlays tension is predominantly present. As such a flexural distress mechanism must be considered. For intermediate overlay thickness a combination of the two modes may be the cause of the crack propagation.
It must be concluded that in the RCD tests a combination of shear and tension stresses must to be applied to be more representative of the average overlay conditions.
However it should be taken into consideration in further refinements of this procedure that for 20 mm overlay that the tension values are almost negligible. The overlay is mostly under compression and shear states of stress.
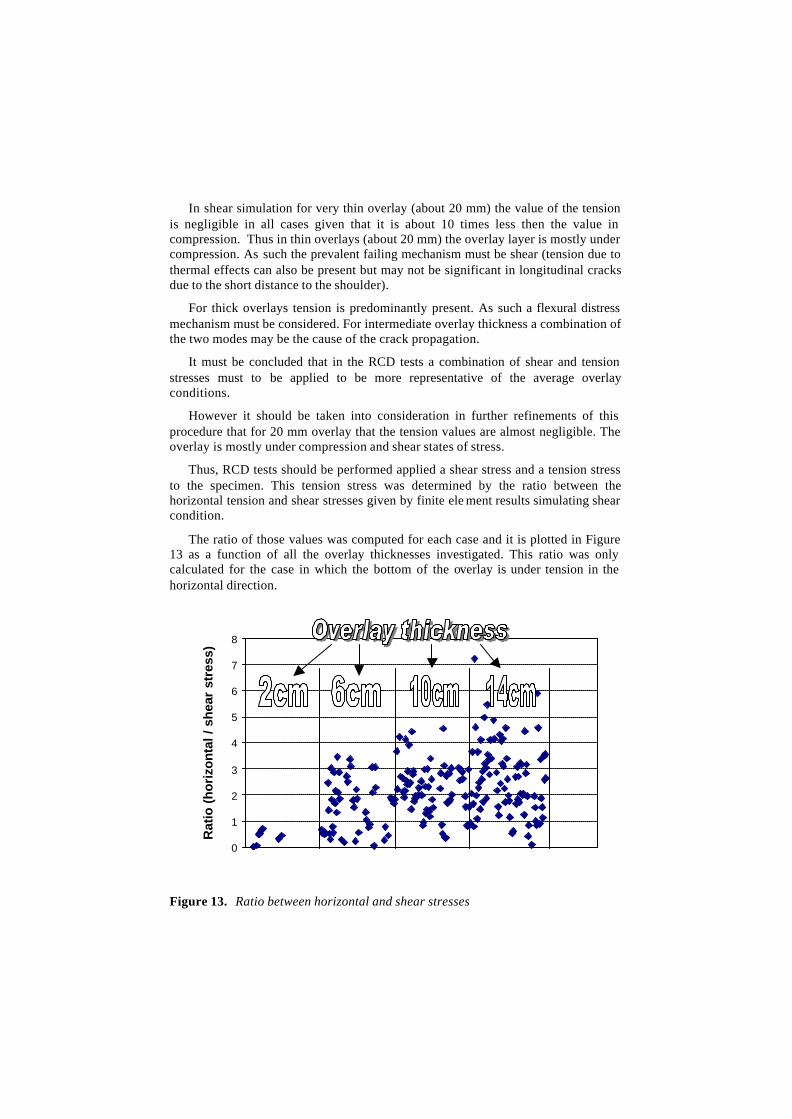
Thus, RCD tests should be performed applied a shear stress and a tension stress to the specimen. This tension stress was determined by the ratio between the horizontal tension and shear stresses given by finite ele ment results simulating shear condition.
The ratio of those values was computed for each case and it is plotted in Figure 13 as a function of all the overlay thicknesses investigated. This ratio was only calculated for the case in which the bottom of the overlay is under tension in the horizontal direction.
0
1
2
3
4
5
6
7
8
Rat
io (
ho
rizo
nta
l / s
hea
r st
ress
)
Figure 13. Ratio between horizontal and shear stresses
It can be observed that on average, for thicknesses up to 60 mm (2.4 inches) the ratio between horizontal tension and shear stresses is about 2.
It would be ideal to determine for each pavement condition the type of load to be applied to the RCD specimen. This may be done in a more detailed case. For instance to determined the material properties to be placed on a 20 mm overlay the tension should be replaced by compression or at most be reduced to null value. However generically, and taking into consideration that eventually the effect of thermal stress in the transversal cracks must also be considered, a ratio of 2 between shear stress and tensile stress was adopted.
5. Proposal to perform RCD tests
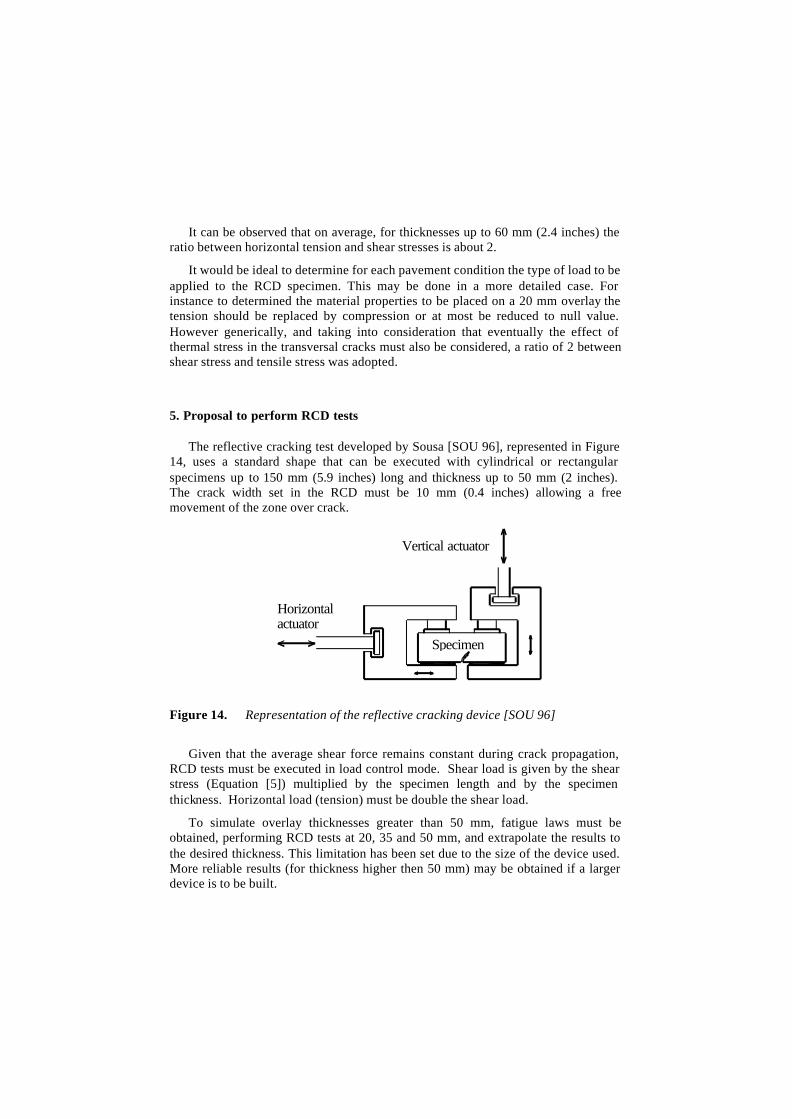
The reflective cracking test developed by Sousa [SOU 96], represented in Figure 14, uses a standard shape that can be executed with cylindrical or rectangular specimens up to 150 mm (5.9 inches) long and thickness up to 50 mm (2 inches). The crack width set in the RCD must be 10 mm (0.4 inches) allowing a free movement of the zone over crack.
Vertical actuator
actuator Specimen
Horizontal
Figure 14. Representation of the reflective cracking device [SOU 96]
Given that the average shear force remains constant during crack propagation, RCD tests must be executed in load control mode. Shear load is given by the shear stress (Equation [5]) multiplied by the specimen length and by the specimen thickness. Horizontal load (tension) must be double the shear load.
To simulate overlay thicknesses greater than 50 mm, fatigue laws must be obtained, performing RCD tests at 20, 35 and 50 mm, and extrapolate the results to the desired thickness. This limitation has been set due to the size of the device used. More reliable results (for thickness higher then 50 mm) may be obtained if a larger device is to be built.
6. Proposed overlay design method
The proposed overlay design method is presented in Figure 15 and 16, respectively the Level 1 and Level 3 procedures. These two levels are due the reflective cracking characterization. The Level 1 must be applied when RCD tests were performed and fatigue laws are available. Otherwise, Level 3 procedures must be followed and RCD tests are required. A Level 2 is being considered based on results obtained from flexural fatigue testes and correlated with RCD results.
The first step, in all levels procedures, consists in the FWD characterization and coring where layer moduli and thicknesses are determined allowing the definition of the existing pavement.
In the second step the overlay characteristics must be defined, namely the overlay thickness and material type which define the layer modulus at the representative temperature of overlay and 10 Hz frequency.
The third step is the determination of shear stress in the overlay using the model [5], which require the information of pavement and overlay thicknesses and moduli. The shear force, which is the product of shear stress by overlay thickness and specimen length, must also be calculated.
In fourth step the reflective cracking fatigue life is calculated by entering the shear force and overlay thickness in the fatigue model of the material type used in the overlay – Level 1. If no fatigue model is available for the selected material, the Level 2 or 3 is applied. If Level 3 is to be followed then the fourth step consists on:
• Execute RCD test at overlay thickness for overlay thickness ≤ 50 mm, or
• Execute RCD tests at 20, 35 and 50 mm and extrapolate to desired thickness for overlay thickness > 50 mm.
With the fatigue life obtained in the RCD device it will be necessary to multiply by a shift factor. This factor is currently being determined based on the last 20 years of experience in Arizona DOT.
The last step in overlay design is the comparison between the calculated fatigue life and the design traffic. If the traffic is greater than the fatigue life, the overlay thickness must be increased or a different material must be used. Otherwise the overlay design is concluded.
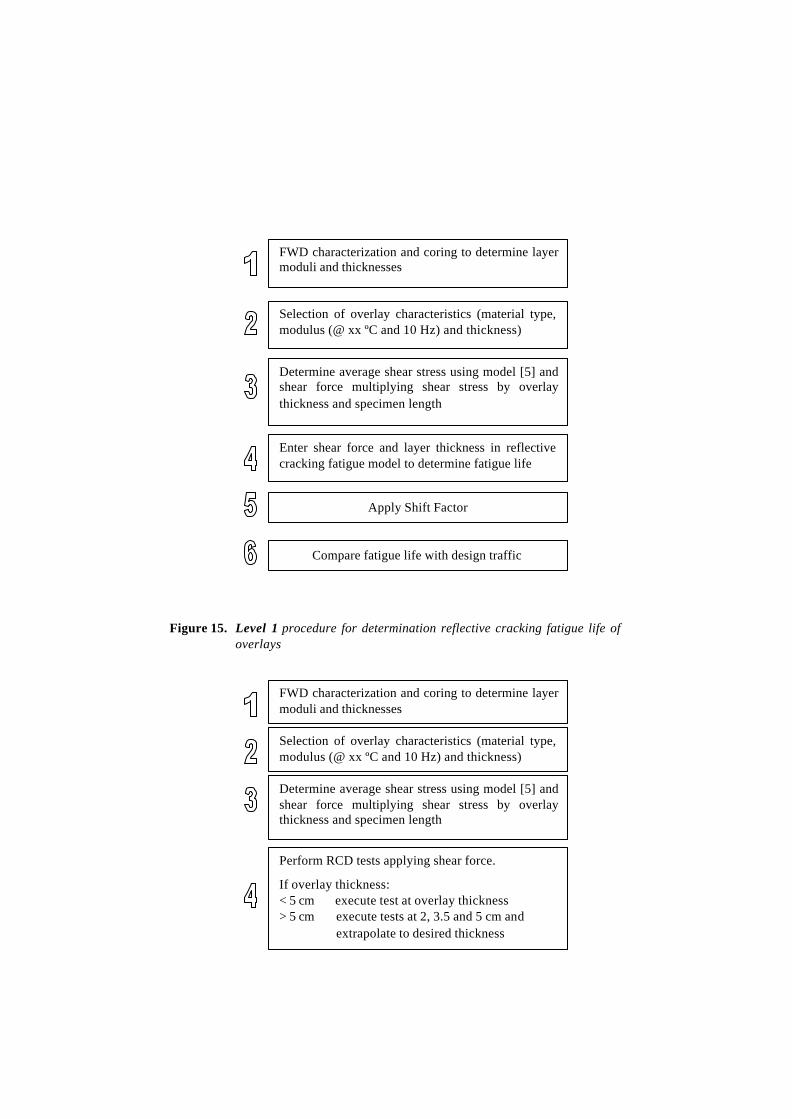
Figure 15. Level 1 procedure for determination reflective cracking fatigue life of
overlays
FWD characterization and coring to determine layer moduli and thicknesses
Selection of overlay characteristics (material type, modulus (@ xx ºC and 10 Hz) and thickness)
Determine average shear stress using model [5] and shear force multiplying shear stress by overlay thickness and specimen length
Enter shear force and layer thickness in reflective cracking fatigue model to determine fatigue life
FWD characterization and coring to determine layer moduli and thicknesses
Selection of overlay characteristics (material type, modulus (@ xx ºC and 10 Hz) and thickness)
Determine average shear stress using model [5] and shear force multiplying shear stress by overlay thickness and specimen length
Perform RCD tests applying shear force.
If overlay thickness: < 5 cm ⇒ execute test at overlay thickness > 5 cm ⇒ execute tests at 2, 3.5 and 5 cm and extrapolate to desired thickness
Compare fatigue life with design traffic
Apply Shift Factor
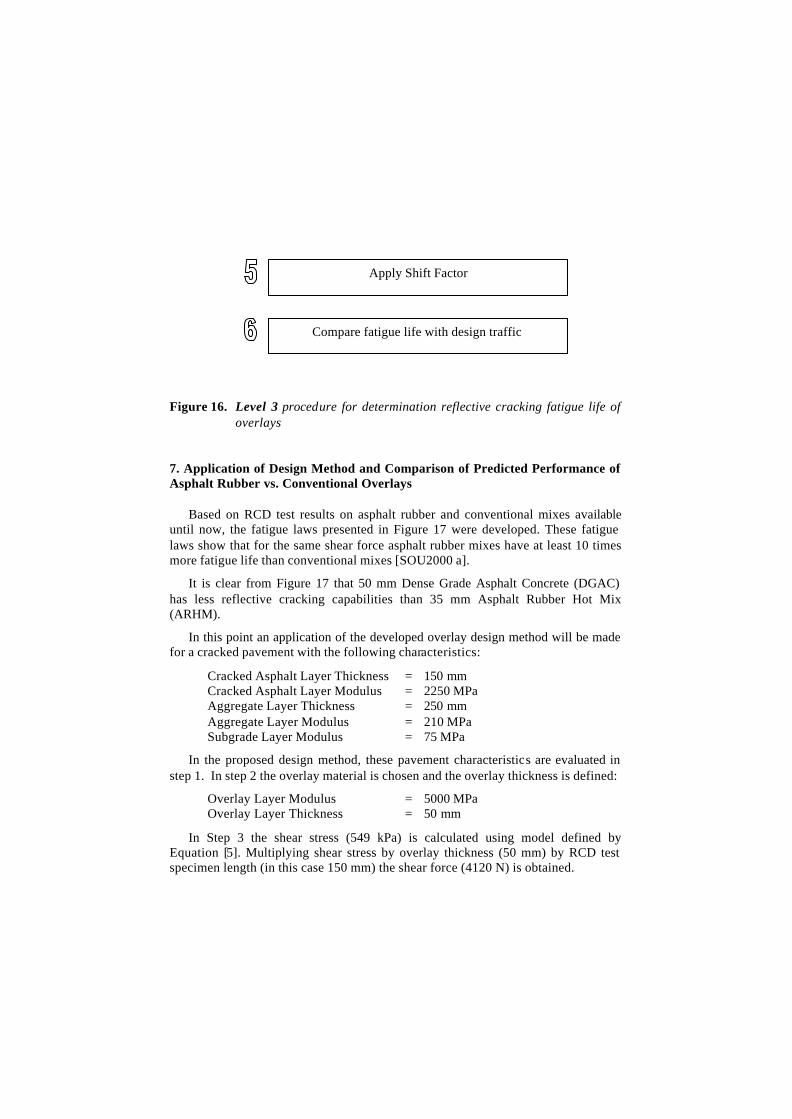
Figure 16. Level 3 procedure for determination reflective cracking fatigue life of
overlays 7. Application of Design Method and Comparison of Predicted Performance of Asphalt Rubber vs. Conventional Overlays
Based on RCD test results on asphalt rubber and conventional mixes available until now, the fatigue laws presented in Figure 17 were developed. These fatigue laws show that for the same shear force asphalt rubber mixes have at least 10 times more fatigue life than conventional mixes [SOU2000 a].
It is clear from Figure 17 that 50 mm Dense Grade Asphalt Concrete (DGAC) has less reflective cracking capabilities than 35 mm Asphalt Rubber Hot Mix (ARHM).
In this point an application of the developed overlay design method will be made for a cracked pavement with the following characteristics:
Cracked Asphalt Layer Thickness = 150 mm Cracked Asphalt Layer Modulus = 2250 MPa Aggregate Layer Thickness = 250 mm Aggregate Layer Modulus = 210 MPa Subgrade Layer Modulus = 75 MPa
In the proposed design method, these pavement characteristics are evaluated in step 1. In step 2 the overlay material is chosen and the overlay thickness is defined:
Overlay Layer Modulus = 5000 MPa Overlay Layer Thickness = 50 mm
In Step 3 the shear stress (549 kPa) is calculated using model defined by Equation [5]. Multiplying shear stress by overlay thickness (50 mm) by RCD test specimen length (in this case 150 mm) the shear force (4120 N) is obtained.
Compare fatigue life with design traffic
Apply Shift Factor
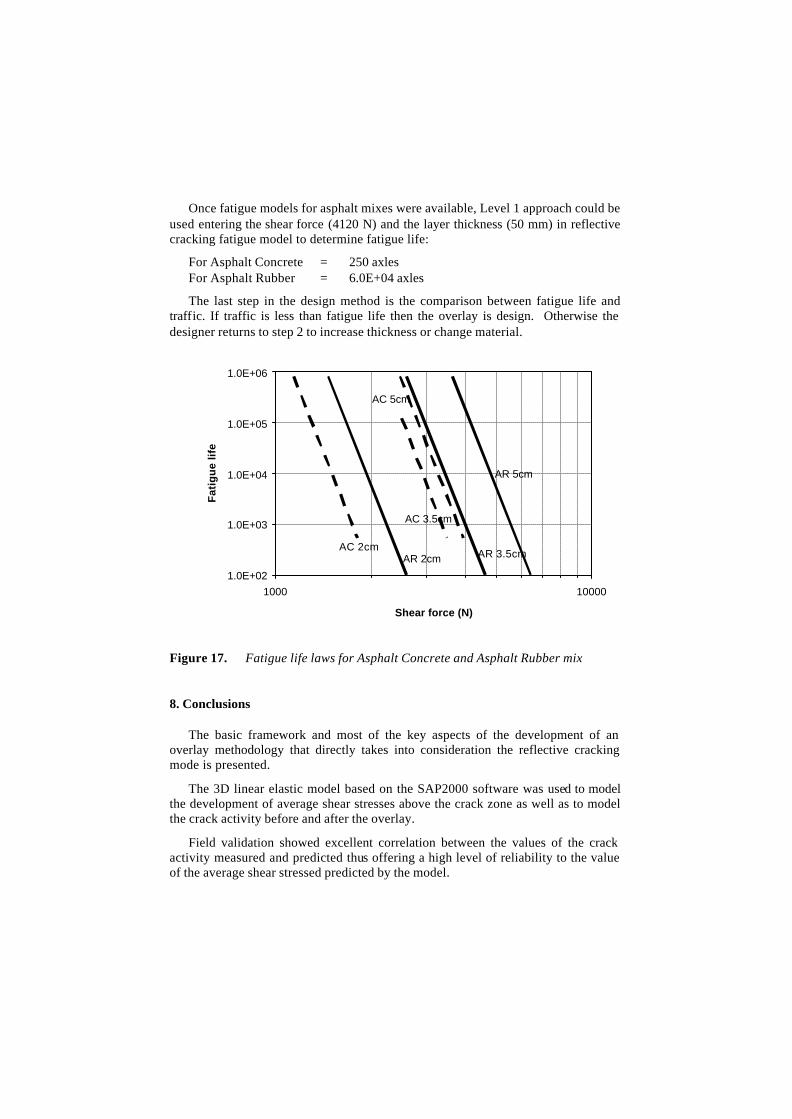
Once fatigue models for asphalt mixes were available, Level 1 approach could be used entering the shear force (4120 N) and the layer thickness (50 mm) in reflective cracking fatigue model to determine fatigue life:
For Asphalt Concrete = 250 axles For Asphalt Rubber = 6.0E+04 axles
The last step in the design method is the comparison between fatigue life and traffic. If traffic is less than fatigue life then the overlay is design. Otherwise the designer returns to step 2 to increase thickness or change material.
1.0E+02
1.0E+03
1.0E+04
1.0E+05
1.0E+06
1000 10000
Shear force (N)
Fat
igu
e lif
e
AR 2cm AR 3.5cm
AR 5cm
AC 5cm
AC 3.5cm
AC 2cm
Figure 17. Fatigue life laws for Asphalt Concrete and Asphalt Rubber mix 8. Conclusions
The basic framework and most of the key aspects of the development of an overlay methodology that directly takes into consideration the reflective cracking mode is presented.
The 3D linear elastic model based on the SAP2000 software was used to model the development of average shear stresses above the crack zone as well as to model the crack activity before and after the overlay.
Field validation showed excellent correlation between the values of the crack activity measured and predicted thus offering a high level of reliability to the value of the average shear stressed predicted by the model.
Statistical models were developed based on the results of more them 5000 finite element computations so that easy to use EXCEL spread sheets can be used to predict shear stresses on the overlays for a wide range of currently encountered situations doing away with tedious and complex 3D analysis.
Compressive analysis for the determination of a shift factor between RCD results and reflective fatigue cracking actually observed in Arizona pavements is being performed. This paper presents a comparison of performance between conventional dense graded mix and asphalt rubber mixed using this model. Assuming, at this stage a shift factor of 1, a rubber mixes have a much higher capability to resist reflective fatigue cracking then asphalt rubber hot mixes.
9. References [PAI 99] Pais, J.C.. “The reflective cracking in flexible pavement overlay design (in
Portuguese)”, Ph. D. Thesis, University of Minho, Portugal, 1999
[HAA 89] Haas, R and Joseph, P.E., "Design oriented evaluation of alternatives for reflection cracking through pavement overlays" First International Conference on Reflective Cracking in Pavements , Liege, Belgium, 1989.
[HAL 87] Halim, A.O., Phang, W.A. and Haas, R. "Realizing structural design objectives through minimization of construction induced cracking" Sixth International Conference on Structural Design of Asphalt Pavements , Michigan, 1987.
[SOU 2000] Sousa, J.B., Pais, J.C. and Stubstad, R.N. "Mode of loading in reflective and flexural fatigue cracking" Fourth International Conference on Reflective Cracking, Ottawa, 2000.
[SOU 96] Sousa, J.B., Shatnawi, S. and Cox, J., “An approach for investigating reflective fatigue cracking in asphalt-aggregate overlays” Proceedings of the Third International RILEM Conference on Reflective Cracking in Pavements, 1996.
[SOU 2000 a] Sousa, J.B., Pais, J.C., Saïm, R. and Stubstad, R.N. "Development of an Overlay design Method based on Reflective Cracking Concepts " CONSULPAV report to Rubber Pavements Association, Walnut Creek 2000.