Embed Size (px)
Citation preview

Reflective Cracking between Precast Prestressed Box Girders
Upul Attanayake, Ph.D., P.E. Haluk Aktan, Ph.D., P.E
Western Michigan University
WisDOT ID no. 0092-14-01
June 2017

ii
DISCLAIMER
This research was funded through the Wisconsin Highway Research Program by the Wisconsin
Department of Transportation and the Federal Highway Administration under Project 0092-14-01.
The contents of this report reflect the views of the authors who are responsible for the facts and
accuracy of the data presented herein. The contents do not necessarily reflect the official views of
the Wisconsin Department of Transportation or the Federal Highway Administration at the time
of publication.
This document is disseminated under the sponsorship of the Department of Transportation
in the interest of information exchange. The United States Government assumes no liability for
its contents or use thereof. This report does not constitute a standard, specification or regulation.
The United States Government does not endorse products or manufacturers. Trade and
manufacturers’ names appear in this report only because they are considered essential to the object
of the document.

iii
ACKNOWLEGEMENT
The project team appreciates the support of the Wisconsin Highway Research Program (WHRP)
in sponsoring this research project. We appreciate continued support by William Oliva, James
Luebke, and other members of the project oversight committee. We would like to thank Anthony
Santilli of Wisconsin DOT, Scott Westenberger of Pheifer Brothers Construction Company, and
Mathew Madderom of Northern Lakes Concrete for facilitating access to bridge sites and sharing
quality control test data and other project related information. Special thanks are due to the many
students at Western Michigan University who helped with this project including Abul Fazal
Mazumder, Timothy Schnell, Lizmert Lopez, Ramzi Abdullah, and Ling Kit Kong.

iv
TECHNICAL REPORT DOCUMENTATION PAGE
1. Report No. WHRP 0092-14-01
2. Government Accession No. 3. Recipient’s Catalog No.
4. Title and Subtitle Reflective Cracking between Precast Prestressed Box Girders
5. Report Date 06/30/2017
6. Performing Organization Code
7. Author(s) Upul Attanayake, Ph.D., P.E. and Haluk Aktan, Ph.D., P.E.
8. Performing Organization Report No.
9. Performing Organization Name and Address Western Michigan University 1903 W. Michigan Ave Kalamazoo, MI 49008-5316
10. Work Unit No.
11. Contract or Grant No. WHRP 0092-14-01
12. Sponsoring Agency Name and Address Wisconsin Department of Transportation Research & Library Unit 4802 Sheboygan Ave. Rm 104, Madison, WI 53707
13. Type of Report and Period Covered Final Report 08/20/2013 – 06/30/2017 14. Sponsoring Agency Code
15. Supplementary Notes 16. Abstract The adjacent precast prestressed concrete box-beam bridge is the bridge of choice for short and short-to-medium span bridges. This choice is because of the ease of construction, favorable span-to-depth ratios, aesthetic appeal, and high torsional stiffness. However, this bridge is losing favor primarily because of persisting durability performance issues resulting from longitudinal deck cracking at the shear key locations. This project was initiated to develop practical recommendations for modifications to current adjacent precast prestressed box-beam bridge details, specifications, and methods used in Wisconsin with a goal of minimizing the potential for developing longitudinal deck cracking over shear keys. A list of best practices was developed after conducting (i) an extensive review of state-of-the art literature and highway agency manuals and guides and (ii) a survey of selected highway agencies and fabricators. In addition, the impact of using various wearing surface types on adjacent box-beam bridge superstructure durability performance was evaluated using NBI data. Based on the outcome of these activities, shear key detail and material and construction specifications were updated. The revised details and specifications were implemented on three bridges: one with traditional abutments and a 6 in. thick cast-in-place concrete slab, and the other two with Geosynthetic Reinforced Soil (GRS) abutments and 2 in. thick masonry overlays. Deck cracking over the shear keys was documented during the inspection conducted just after construction and after the bridges had been in service for five months. In addition to the cracking over shear keys, randomly dispersed short cracks were observed on these decks. This observation is consistent for all three bridges. Subsequent analysis was conducted using structural details of these bridges, and material property data recorded during construction shows that shrinkage and thermal gradient loads initiate cracking irrespective of the overlay types used on these bridges. Recommendations include continuing with updated details and specifications while exploring the use of crack resistant overlay types and revising details through additional research.
17. Key Words Adjacent box-beam, longitudinal deck cracking, post-tension, shear key.
18. Distribution Statement No restrictions. This document is available through the National Technical Information Service. 5285 Port Royal Road Springfield, VA 22161
19. Security Classif. (of this report) Unclassified
20. Security Classif. (of this page) Unclassified
21. No. of Pages 128 w/o Appendices
22. Price
Form DOT F 1700.7 (8-72) Reproduction of completed page authorized

v
EXECUTIVE SUMMARY
The adjacent precast concrete box-beam bridge is the bridge of choice for short and short-to-
medium span bridges, especially if removing clearance is limited making falsework removal
problematic. However, this bridge is losing favor primarily because of persisting durability
performance issues such as longitudinal deck cracking over the shear keys. Therefore, this project
was initiated to develop practical recommendations for modifications to current adjacent precast
prestressed box-beam bridge details, specifications, and methods used in Wisconsin with a goal of
minimizing the potential for developing reflective deck cracking.
A list of best design and construction practices was developed and presented after conducting (i)
an extensive review of state-of-the art literature and highway agency manuals and guides, (ii) a
survey of selected highway agencies and fabricators, and (iii) an evaluation of the impact of
wearing surface types on adjacent box-beam bridge superstructure durability performance.
Based on the outcome of these efforts, Wisconsin DOT design details along with material and
construction specifications were updated. The use of box-beams with rectangular voids is
continued because these sections have the least dead load per unit length and minimize the impact
on the fabrication process. Shear key configuration was updated to a full-depth shear key which
allows adequate confinement to prevent grout spall even if the shear key material is debonded from
the beam. Further, full-depth shear keys have shown an improved performance of bridge
superstructure in terms of longitudinal deck cracking. An asphalt wearing surface with a
waterproofing membrane has shown better performance compared to a cast-in-place deck slab and
has contributed to maintaining adjacent box-beam bridges in good or satisfactory condition over
30 years. However, overlay types used in Wisconsin were not updated because the use of asphalt
overlays with a waterproofing membrane has been discontinued in Wisconsin.
The revised details and specifications were implemented on three bridges. One of the bridges was
constructed on traditional abutments with a 6 in. thick cast-in-place concrete slab. The other two
bridges were constructed on Geosynthetic Reinforced Soil (GRS) abutments with 2 in. thick
masonry overlays. The updated specifications and design details of these three bridges are
presented in Appendix F. These bridges were inspected just after construction and after being in
service for five months, and longitudinal deck cracking over the shear keys was documented.

vi
Randomly dispersed short cracks were also observed on these decks. All three bridges show a
similar pattern of cracking. Subsequent analysis was conducted using structural details of these
bridges and material property data recorded during construction. The analysis results revealed that
the stresses developed due to shrinkage and thermal gradient loads are high enough to initiate
cracking in typical concrete mixes. Full-depth cracking due to shrinkage and thermal gradient
loads initiates over the supports. Thin concrete overlay used on B-14-216 and B-14-217 undergoes
higher stresses than the thick overlay due to smaller volume-to-surface ratio. Cast-in-place end
diaphragms are used in B-26-40 bridge to tie the superstructure with the integral abutments. Bridge
specifications allow casting the diaphragms with the slab or two weeks prior to placing the slab.
Casting the diaphragms and slab together reduces the slab stresses due to concrete shrinkage, a
practice recommended to continue. Recommendations include continuing with updated details
and specifications while exploring the use of crack resistant overlay types and revising transverse
connection details through additional research.

vii
TABLE OF CONTENTS DISCLAIMER......................................................................................................................... ii
ACKNOWLEGEMENT ........................................................................................................ iii
TECHNICAL REPORT DOCUMENTATION PAGE ...................................................... iv
EXECUTIVE SUMMARY .................................................................................................... v
LIST OF FIGURES ............................................................................................................... ix
LIST OF TABLES ................................................................................................................ xii
1 INTRODUCTION............................................................................................................. 1
1.1 Overview ..................................................................................................................... 1
1.2 Project Objectives and Tasks ...................................................................................... 1
1.3 Report Organization .................................................................................................... 2
2 STATE-OF-THE-ART LITERATURE REVIEW ........................................................ 3
2.1 Objective and Approach .............................................................................................. 3
2.2 Bridge Performance ..................................................................................................... 3
2.3 Box-Beam Geometry ................................................................................................... 4
2.4 Shear Key Configuration ............................................................................................. 6
2.5 Transverse Post-Tensioning ........................................................................................ 8
2.6 Grout, Mortar, and Non-Shrink Material .................................................................. 11
2.7 Deck Overlay and Reinforced Concrete Slab ............................................................ 16
2.8 Bearing Layout .......................................................................................................... 19
2.9 Design and Construction Recommendations ............................................................ 21
2.10 Summary and Conclusions ........................................................................................ 25
3 STATE DEPARTMENT OF TRANSPORTATION PRACTICES .......................... 30
3.1 Objective and Approach ............................................................................................ 30
3.2 DOT Practices ........................................................................................................... 32
3.3 Survey of Transportation Agencies and Fabricators ................................................. 44
4 IN-SERVICE BRIDGE PERFORMANCE .................................................................. 50
4.1 Objective and Approach ............................................................................................ 50
4.2 Wisconsin Bridge Performance ................................................................................. 50
4.3 Impact of Cast-in-place Concrete Slab and Overlay on Superstructure Durability .. 62
5 PERFORMANCE EVALUATION OF NEWLY CONSTRUCTED BRIDGES ...... 73

viii
5.1 Objective and Approach ............................................................................................ 73
5.2 Design and Construction Recommendations ............................................................ 73
5.3 Wisconsin-47 over Lost Creek (B-26-40) ................................................................. 77
5.4 Shaw Brook Bridge (B-14-216) and Pratt Creek Bridge (B-14-217) ....................... 85
5.5 Structural System Response to Shrinkage and Thermal Gradient Loads .................. 92
5.6 Summary of Findings ................................................................................................ 99
6 SUMMARY, CONCLUSIONS, AND RECOMMENDATIONS ............................. 101
6.1 Summary and Conclusions ...................................................................................... 101
6.2 Recommendations ................................................................................................... 103
7 BIBLIOGRAPHY ......................................................................................................... 107
APPENDIX A: Grout and Special Mixes for Box-Beam Shear Keys
APPENDIX B: State Department of Transportation Practices
APPENDIX C: Wisconsin Department of Transportation Practices
APPENDIX D: Survey Questionnaire and Results
APPENDIX E: Wisconsin Bridge Performance
APPENDIX F: Revised Specifications and Design Details
APPENDIX G: Newly Built Bridge Performance

ix
LIST OF FIGURES
Figure 2-1. Beam geometries used in side-by-side box-beam bridges .................................... 5
Figure 2-2. Shear key configurations used in side-by-side box-beam bridges ........................ 7
Figure 2-3. A shear key with missing grout ............................................................................. 8
Figure 2-4. Recommended number of diaphragms (source: Grace et al. 2012) ...................... 9
Figure 2-5. Recommended transverse post-tensioning force magnitude for a bridge deck slab
with 5000 psi (Source: Grace et al. 2012) ............................................................. 9
Figure 2-6. (a) Shear key material attached to a beam and (b) beam surface after grout had fallen
off ......................................................................................................................... 13
Figure 2-7. Shear-key interface cracks before deck slab placement ...................................... 13
Figure 2-8. Components of waterproofing membrane systems (Russell 2012) ..................... 16
Figure 2-9. Typical GRS-IBS detail (FHWA 2011) .............................................................. 20
Figure 2-10. Alberta MOT GRS-IBS detail (Alberta MOT 2017) ........................................ 20
Figure 2-11. Grouting adjacent box-beam shear keys using type R-2 grout (Oakland Drive over
I-94, MI) .............................................................................................................. 24
Figure 2-12. Pumping W.R. Meadows Sealight CG-86 non-shrink grout (Source: Oliva et al.
2007) .................................................................................................................... 24
Figure 2-13. Grouting of full-depth deck panel connections (Source: Courtesy of MDOT) 24
Figure 3-1. Typical box-beam geometries used by the State DOTs ...................................... 32
Figure 3-2. Shear key configurations used by various state DOTs ........................................ 33
Figure 3-3. Bearing configurations used by the state DOTs .................................................. 41
Figure 3-4. Bearing pad plan ................................................................................................. 42
Figure 3-5. The bearing layout given with the most recent standard details ......................... 42
Figure 3-6. The primary approaches for maintaining roadway crown .................................. 46
Figure 4-1. Number of bridges vs. year built ......................................................................... 51
Figure 4-2. NBI deck rating: number of bridges vs. year built and ADT .............................. 52
Figure 4-3. NBI superstructure rating: number of bridges vs. year built and ADT ................ 53
Figure 4-4. NBI deck rating: number of bridges vs. year built and ADTT ........................... 54
Figure 4-5. NBI superstructure rating: number of bridges vs. year built and ADTT ............ 54
Figure 4-6. NBI deck rating: number of bridges vs. skew ..................................................... 55
Figure 4-7. NBI superstructure rating: number of bridges vs. skew ...................................... 55

x
Figure 4-8. NBI deck rating: number of bridges (post-1983) vs. skew and ADT .................. 56
Figure 4-9. NBI superstructure rating: number of bridges (post-1983) vs. skew and ADT ... 56
Figure 4-10. Reflective deck cracking ................................................................................... 58
Figure 4-11. Fascia beam detail and transverse cracks .......................................................... 60
Figure 4-12. A stress pocket exposed to surface water ........................................................... 60
Figure 4-13. The deck overlay construction joint .................................................................. 61
Figure 4-14. Flood water trapped inside boxes ...................................................................... 61
Figure 4-15. Percent of superstructures with a cast-in-place deck and a monolithic wearing
surface against age and ADT (Condition Rating 6) ......................................... 69
Figure 4-16. Percent of superstructures with a cast-in-place deck and a monolithic wearing
surface against age and ADT (Condition Rating < 6) ......................................... 70
Figure 4-17. Percent of superstructures with a bituminous wearing surface against age and ADT
(Condition Rating 6) ......................................................................................... 70
Figure 4-18. Percent of superstructures with a bituminous wearing surface against age and ADT
(Condition Rating < 6) ......................................................................................... 71
Figure 4-19. Bridge deck protective system used in the Europe (Attanayake et al. 2002) .... 72
Figure 5-1. Bridge location (Source: Google Maps) ............................................................. 78
Figure 5-2. Monolithically cast end diaphragm and deck slab .............................................. 79
Figure 5-3. A general view of the bridge ............................................................................... 80
Figure 5-4. Crack locations on west abutment (facing east) .................................................. 81
Figure 5-5. Deck slab crack width (the crack located in between beam 5 and 6 over the west
abutment) ............................................................................................................. 81
Figure 5-6. Geometry of the crack located in between beam 5 and 6 over the west abutment82
Figure 5-7. Crack over beam 2 .............................................................................................. 82
Figure 5-8. Geometry of the crack above beam 2 on the west abutment ............................... 83
Figure 5-9. Longitudinal crack along the 4th shear key over west abutment ......................... 84
Figure 5-10. Longitudinal crack along the 4th shear key over east abutment ........................ 85
Figure 5-11. General view of the bridge ................................................................................ 87
Figure 5-12. Cracks over the west abutment ......................................................................... 88
Figure 5-13. Self-adhesive compressible sealer at the shear key ........................................... 88
Figure 5-14. Condition of the joint between the approach and bridge deck .......................... 89

xi
Figure 5-15. Erosion of backfill material ............................................................................... 90
Figure 5-16. General view of the bridge ................................................................................ 91
Figure 5-17. Cracks over the east abutment ........................................................................... 91
Figure 5-18. Erosion of backfill material ............................................................................... 92
Figure 5-19. Total shrinkage developed in B-26-40 deck slab during a 7-day period with 3-day
curing ................................................................................................................... 93
Figure 5-20. Total shrinkage developed in B-26-40 deck slab during a 7-day period with 7-day
curing ................................................................................................................... 94
Figure 5-21. Development of modulus of elasticity with time .............................................. 94
Figure 5-22. The maximum principal stress distribution under shrinkage at 7 days with 3-day
moist curing (B-26-40) ........................................................................................ 96
Figure 5-23. The maximum principal stress developed in the deck slab with 10 0F temperature
difference between heating up and cooling down (B-26-40) .............................. 96
Figure 5-24. Symbol plot showing the maximum principal stress distribution due to thermal
gradient loading and shrinkage ............................................................................ 97
Figure 5-25. The maximum principal stresses at top and bottom surfaces of the deck slab of 7
days with 3 days curing (B-26-40) ...................................................................... 98
Figure 5-26. The maximum principal stresses at top and bottom surfaces of the deck slab of 7
days with 3 days curing (B-14-216) .................................................................... 98
Figure 5-27. Bridge B-26-40 beam and end diaphragm detail .............................................. 99
Figure 6-1. Flat anchorage geometry and technical detail ................................................... 105
Figure 6-2. Interior beam with and without transverse post-tensioning ducts ..................... 106
Figure 6-3. Exterior beam with and without transverse post-tensioning ducts .................... 106

xii
LIST OF TABLES
Table 2-1. Post-Tensioning Force Requirement for a 50 ft Long, 25 ft Wide Bridge ........... 11
Table 2-2. A Summary of Shrinkage and Strength of Different Admixtures Documented in
Literature .............................................................................................................. 15
Table 2-3. Flexible Overlay with a Waterproofing Membrane ............................................. 17
Table 2-4. Waterproofing Membranes: Advantages, Installation Challenges, and Performance
Issues .................................................................................................................... 18
Table 2-5. Best Design Practices Recommended/Suggested in the Literature ...................... 21
Table 2-6. Best Construction Practices Recommended/Suggested in the Literature ............. 22
Table 3-1. States That Participated in Two Previous Surveys and the Ones Selected for Review
............................................................................................................................. 30
Table 3-2. Shear Key Configurations Used by the State DOTs ............................................ 33
Table 3-3. Post-Tensioning Force Used by the State DOTs .................................................. 35
Table 3-4. Typical Shear Key Grout Mix and Placement Requirements .............................. 36
Table 3-5. Shear Key Grout Mixes Given in a Recent Special Provisions............................ 36
Table 3-6. NYSDOT Shear Key Grout Test Requirements ................................................... 37
Table 3-7. NYSDOT Approved Grout List for Shear Keys (Part 1 of 2) .............................. 38
Table 3-8. NYSDOT Approved Grout List for Shear Keys (Part 2 of 2) .............................. 39
Table 3-9. Overlay or Concrete Slab Used by the State DOTs ............................................. 40
Table 3-10. States Selected and Participated in the Survey ................................................... 45
Table 3-11. Role of the Participant and Participation Percentage ......................................... 45
Table 3-12. Wearing Surface Type, Implementation, and Observation of Longitudinal Reflective
Cracking ............................................................................................................... 46
Table 3-13. Superstructure Cross-Section and Longitudinal Reflective Cracking Potential . 46
Table 3-14. The Box-Beam Cross-section, Current Implementation, and Preference for Future
Adoption .............................................................................................................. 47
Table 3-15. Shear Key Configuration, Current Implementation, and Preference for Future
Adoption .............................................................................................................. 48
Table 3-16. Shear Key Material and Current Implementation .............................................. 49
Table 3-17. Shear Key Material Workability Requirements and Current Implementation ... 49
Table 4-1. Number of Bridges vs. ADT ................................................................................ 51

xiii
Table 4-2. Percent of Bridges in Each NBI Rating and ADT Categories .............................. 52
Table 4-3. Percent of Bridges in Each NBI Rating and ADTT Categories ........................... 53
Table 4-4. Number of Post-1983 Bridges with Skew ≤ 20 Deg. and ADT <1,000 and the
Numbers Selected for Inspection ......................................................................... 57
Table 4-5. Inventory Data of Selected Bridges for Inspection .............................................. 57
Table 4-6. NBI Condition Rating of the Bridges ................................................................... 57
Table 4-7. Summary of Inspection Data Related to Reflective Cracking and Shear Key
Condition ............................................................................................................. 59
Table 4-8. Deck Structure Type, Wearing Surface Type, and the Most Common Deck Structure
and Wearing Surface Type Combinations for Adjacent Box-Beam Bridges ...... 63
Table 4-9. Total Number of Box-Beam Bridges in Each State (NBI 2014) .......................... 64
Table 4-10. Box-Beam Bridges with Deck Structure and Wearing Surface Types ............... 64
Table 4-11. Durability Performance of Bridge Superstructures with a Cast-in-Place Deck and a
Monolithic Wearing Surface ................................................................................ 66
Table 4-12. Durability Performance of Bridge Superstructures with a Bituminous Wearing
Surface ................................................................................................................. 68
Table 5-1. Cast-in-Place Concrete Slab - Mix Design and Fresh Properties ......................... 79
Table 5-2. Bridge Inventory and Design Data ....................................................................... 86
Table 5-3. Grade E Overlay Specifications, Mix Design, and QA/QC Data ......................... 86

1
1 INTRODUCTION
1.1 OVERVIEW
The adjacent precast concrete box-beam bridge, also known as the side-by-side box-beam bridge,
is the bridge of choice for short and short-to-medium span bridges. This choice is because of the
ease of construction, favorable span-to-depth ratios, aesthetic appeal, and high torsional stiffness.
However, this bridge is losing favor primarily because of persisting durability performance issues
related to longitudinal cracking at the shear key locations. This bridge design was first introduced
to the U.S. in the 1950’s. Design changes have been periodically incorporated since then primarily
to abate the cracking. However, performance problems, specifically the longitudinal deck cracking
over shear keys, still persist. The deck cracking is identified as the leading cause for triggering
other distresses and safety concerns.
1.2 PROJECT OBJECTIVES AND TASKS
The objective of this project is to suggest practical recommendations for modifications to current
adjacent precast prestressed box-beam bridge details, specifications, and methods used in
Wisconsin with a goal of minimizing the potential for developing longitudinal deck cracking over
the shear keys. The investigation includes the following:
Review past and present efforts documented in literature to solve this problem.
Survey WisDOT regional bridge maintenance engineers, industry fabricators, and other
State DOT’s to identify extent and consistency of this problem.
Review past applications of this structure type in Wisconsin including visiting sites to make
observations and measurements.
Make recommendations for improved policies, design detailing, specifications, and
construction inspection.
Identify a candidate precast box-beam test structure to incorporate revised details and
construction practices.
Monitor the structure and document the performance of updated practices.

2
1.3 REPORT ORGANIZATION
The report is organized into 7 chapters:
Chapter 2 - The State-of-the-Art Literature Review
Chapter 3 - State Department of Transportation Practices
Chapter 4 - In-service Bridge Performance
Chapter 5 - Newly Built Bridge Performance
Chapter 6 - Summary, Conclusions, and Recommendations
Chapter 7 - Bibliography
The report appendices include the following data:
Appendix A: Grout and Special Mixes for Box-Beam Shear Keys
Appendix B: State Department of Transportation Practices
Appendix C: Wisconsin Department of Transportation Practices
Appendix D: Survey Questionnaire and Results
Appendix E: Wisconsin Bridge Performance
Appendix F: Revised Specifications and Design Details
Appendix G: Newly Built Bridge Performance

3
2 STATE-OF-THE-ART LITERATURE REVIEW
2.1 OBJECTIVE AND APPROACH
Recent studies and findings/recommendations related to box-beam bridge performance are
documented in this chapter. Specific attention is given to box-beam geometry, shear key
configuration, transverse post-tensioning procedures, shear key grout materials, deck overlay or
concrete slab, bearing layout, and design and construction recommendations.
2.2 BRIDGE PERFORMANCE
Longitudinal reflective deck cracking along the shear keys of side-by-side box-beam bridge
superstructures has been identified as a recurrent problem (Huckelbridge et al. 1995; Lall at el.
1998; Miller et al. 1999; Aktan et al. 2005; Attanayake and Aktan 2013). The reflective cracks
allow penetration of surface water along the full-length of the beams. Since the moisture often
gets trapped in the shear keys, reflective deck cracking is a durability concern in states where de-
icing salt is used for winter maintenance. The surface water is often laced with chloride ions that
diffuse into concrete and initiate corrosion of prestressing tendons and reinforcements leading to
delamination, cracking, spall and breaking of the prestressing tendon.
The purpose of shear keys and transverse post-tension is for the beams to develop continuity in the
transverse direction for developing moment and shear stiffness. Reflective cracking of the bridge
with full-depth shear keys and transverse post-tensioning may not lead to differential movement
of the beams unless the shear keys are not properly grouted or there is significant deterioration. In
the case of partial-depth grouted shear keys, the shear key failure may lead to loss of load transfer
capacity between two adjacent box-beams. In this case, overloading of individual box beams may
occur (Harries 2006).
The box beam connection details and construction practices that assure durability of the system
are essential. Addressing the critical need, NCHRP Synthesis Report 393 was developed
documenting the best practices implemented by the North American Highway Agencies in terms
of connection design, details, materials, and construction practices (Russell 2009). At about the
same time, the Precast/Prestressed Concrete Institute also published a report on the State-of-the-
Art of Precast/Prestressed Adjacent Box Beam Bridges (PCI 2011). In conjunction with these
studies, two comprehensive national surveys were conducted to identify the extent and consistency

4
of the reflective cracking problem as well as collecting information on connection design, details,
materials, and construction practices (Russell 2009; PCI 2011).
Russell (2009) and PCI (2011) provide a list of recommendations for design, fabrication, and
construction. Throughout the years, a few states, including Michigan and New York, have
implemented a majority of the design, fabrication, and construction best practices, described in the
above two documents. Attanayake and Aktan (2013) described Michigan’s evolving design
provisions, performance of in-service bridges, and observations during demolitions and
construction of new bridges. Michigan’s most up-to-date design and construction specifications
could not abate reflective cracking prior to opening the bridge for traffic. The design includes full-
depth grouted partial depth shear keys, transverse post-tensioning, and a 6-in. thick cast-in-place
concrete slab (Attanayake and Aktan 2013). Cracking was also documented at the interface
between the grout and box-beam during construction. Several researchers proposed that increasing
the magnitude of post-tensioning force can be a potential solution to mitigate reflective cracking
(Grace and Jensen 2008). However, Ulku et al. (2010) have demonstrated that increased post-
tensioning will not mitigate reflective deck cracking. Lall et al. (1998) acknowledge having
reflective deck cracking on the NYSDOT system as well. NYSDOT has implemented full-depth
shear keys, a cast-in-place concrete slab, and transverse post-tensioning.
The following sections of this chapter present the efforts and outcome of recent studies to mitigate
reflective deck cracking and associated durability performance.
2.3 BOX-BEAM GEOMETRY
The common box-beam standard sections include rectangular or circular voids. The selection of
a beam geometry for a specific bridge is based on the availability of formwork, fabricator
familiarity, and ease of fabrication. Hence, the standard section shown in Figure 2-1a is commonly
used by the North America highway agencies. The standard sections in China, Japan, and Korea
are presented in Figure 2-1d, e, and f (Yuan et al. 2013; Yamane et al. 1994; Kim et al. 2008). In
earlier bridges, the box-beam void was formed using corrugated cardboard boxes. Fabrication
challenges and accumulation of moisture inside the void forced highway agencies to look for
alternate materials to form the voids (Aktan el al. 2005). Also, the concrete cover of the top layer
of prestressing strands in the box-beam bottom flange and located nearest the void was not

5
adequate (Aktan et al. 2005). At present, the void is formed by placing nonabsorbent material
such as Styrofoam blocks. Drains or weep holes are provided at the bottom flange to drain
moisture from inside the void. Storm et al. (2013) discuss implications of Styrofoam block
deformation on prestressed box-beam camber calculation. Even though the focus of their work
was on camber calculation, the Styrofoam block deformation may cause nonuniform thickness and
insufficient concrete cover to prestressing strands. The uneven interior concrete surface may also
affect the effectiveness of the drains provided at the end of each void. In that regard, Japan and
Korean standard sections can provide adequate cover to prestressing strands for enhanced
durability.
(a) Single void
(b) Two rectangular voids
(c) Two circular voids
(d) Single circular void section used in China
(e) Single void section used in Japan
(f) Single void section used in Korea
Figure 2-1. Beam geometries used in side-by-side box-beam bridges

6
2.4 SHEAR KEY CONFIGURATION
The partial-depth shear key (Figure 2-2a) was the common configuration in earlier bridges. Due
to its inability to transfer moment in the transverse direction and observed reflective deck cracking,
highway agencies started requiring full-depth grouted shear keys. As an example, since 1985
Michigan has used the full-depth grouted partial depth shear key shown in Figure 2-2b. Field
observations documented grout spall (Figure 2-3). The inability to contain the grout within the
key region is one of the challenges of using the configuration shown in Figure 2-2b. The NYSDOT
uses the shear key configuration shown in Figure 2-2c (Lall et al. 1998). This configuration was
developed by the North-East Precast/Prestressed Concrete Institute (NE PCI) and has the ability
to contain grout within the shear key. According to Lall et al. (1998), the use of full-depth shear
keys, cast-in-place reinforced concrete deck, and transverse post-tensioning reduced reflective
deck cracking.
Yamane et al. (1994) presented the shear key configuration used in Japan (Figure 2-2d). The
Japanese shear key is formed by filling the space with cast-in-place concrete. Figure 2-2e shows
the shear key configuration also with cast-in-place concrete used in Korea (Kim et al. 2008). The
first side-by-side box-beam with cast-in-place concrete shear key and transverse post-tensioning
was built in Korea in 2005. After conducting static and dynamic load testing on the bridge, Kim
et al. (2008) recommend using cast-in-place concrete for the shear keys and transverse post-
tensioning. As a result of contractor reluctance to use post-tensioning on site for small span
bridges, side-by-side box-beam bridges designed with transverse post-tension did not achieve wide
use in the UK in the 1960s. Hence, other forms of transverse connections were designed. One of
the designs proposed by the North Western Road Construction Unit (NWRCU) is shown in Figure
2-2f. This design utilized reinforcements within the shear key with cast-in-place concrete (Cusens
1974).

7
(a) Partial depth shear key
(b) Full-depth grouted partial depth shear key
(c) Full-depth shear key
(d) Cast-in-place concrete shear key used in Japan
(e) Cast-in-place concrete shear key used in Korea
(f) Cast-in-place reinforced concrete shear key used in the UK.
Figure 2-2. Shear key configurations used in side-by-side box-beam bridges

8
Figure 2-3. A shear key with missing grout
Dong (2002) studied the shear key performance by finite element analysis technique under thermal
and truck loads. Five shear key configurations were considered in this analysis. Dong (2002)
recommended using full-depth shear key to resist the transverse tensile stresses developed near the
base of the shear key without exceeding the tensile strength of non-shrink grout material. The
bond strength limitation between the grout and beam surface was not considered in this analysis.
A perfect bond between the grout and the beam surface was assumed. In general, the bond strength
at the beam-grout interface is much weaker than the tensile strength of grout.
2.5 TRANSVERSE POST-TENSIONING
Korea constructed the first side-by-side box-beam bridge in 2005 (Kim et al. 2008). The span of
the bridge is 43 ft. Five diaphragms (3 intermediate and two end diaphragms) are placed at equal
spacing for transverse post-tensioning. Transverse ducts that were 2 in. in diameter were placed
in the upper and lower part of the beam side with a transverse post-tensioning force of 32
kips/strand. End diaphragms included 4 strands while intermediate diaphragms included 6 strands;
hence, the force at each end and intermediate diaphragm is 128 kips and 192 kips, respectively. In
other words, the post-tensioning force is 19 kips/ft.
Grace et al. (2012) used finite element models to determine the number of diaphragms and amount
of transverse post-tensioning force required to mitigate longitudinal deck cracking due to the
combined effect of temperature gradient and traffic loads. The analysis recommendations were
related to the number of diaphragms and the post-tensioning force to mitigate reflective cracking
(Figure 2-4 and Figure 2-5).

9
Figure 2-4. Recommended number of diaphragms (source: Grace et al. 2012)
Figure 2-5. Recommended transverse post-tensioning force magnitude for a bridge deck slab with 5000 psi
(Source: Grace et al. 2012)
5
6
7
8
9
10
11
0 20 40 60 80 100 120 140
Number of Diaphragm
s
Span (ft)
48 in. Beam
36 in. Beam
90
100
110
120
130
140
150
160
170
0 10 20 30 40 50 60 70 80 90
Post‐Ten
sioning Force per Diaphragm
(kip)
Bridge Width (ft)

10
Recommendations from Hanna et al. (2009) are included in the PCI Bridge Design Manual post-
tensioning magnitudes to reflect the most recent AASHTO LRFD loads. The outcome of this
study is an equation to calculate post-tensioning force per unit length of the bridge. Hence, by
knowing the spacing between transverse post-tensioning ducts, the force per diaphragm can be
calculated. The proposed equation is given below.
P = . 1.0 . 8.0
Where, D = box depth (in.) W = bridge width (in.) KL = correction factor for span-to-depth ratio
=1.0 0.003 30
KS = skew correction factor = 1.0 + 0.002θ L = bridge span (in.) θ = skew angle (deg.)
The recommendations by Grace et al. (2012) and Hanna et al. (2009) are for applying post-
tensioning through diaphragms before placing the cast-in-place concrete slab or the wearing
surface. Aktan et al. (2009) demonstrated that the shear keys located longitudinally in between
the diaphragms are not compressed when post-tensioning is applied through the diaphragms.
Hence, transverse post-tensioning and increasing post-tensioning will not prevent cracking at the
beam-shear key interface. The cast-in-place concrete slab is expected to provide an added
protection in terms of durability. However, the reflective cracks develop in the cast-in-place slab
even before the bridge is opened to traffic (Attanayake and Aktan 2013). The solution was to
apply post-tensioning in two stages, before and after placing the concrete deck slab. This post-
tensioning sequence will compress the cast-in-place concrete slab and close the cracks.
Attanayake and Aktan (2009) also developed a rational design process to calculate the post-
tensioning required at each diaphragm during each stage of post-tensioning. As an example, Table
2-1 presents the required two-stage post-tensioning for a 25 ft wide, 50 ft long bridge with 5
diaphragms. The effectiveness of applying two-stage post-tensioning was also demonstrated by
Ulku et al. (2010). However, Ulku et al. (2010) did not consider the effect of cast-in-place concrete
shrinkage and creep effects. Hence, further studies are required to evaluate the impact of the
intrinsic loads such as shrinkage and creep effects.

11
Table 2-1. Post-Tensioning Force Requirement for a 50 ft Long, 25 ft Wide Bridge
Posttension Force per Diaphragm, kips End Diaphragm Intermediate Diaphragm Middle Diaphragm
Before deck placement 7 41 52 After deck placement 63 105 130 Total 70 146 182
Ulku (2009) studied post-tension stress distribution at grouted connections of full-depth deck
panels. The study evaluated the effect of grout modulus, the bond between grout and the panel,
and post-tension spacing. After studying the post-tension stress distribution at connections with
grout of similar modulus to concrete, Ulku (2009) presented two major conclusions: (1) the
compression is limited to a width of 1.35 times the precast panel dimension in the direction of
post-tensioning; and (2) to achieve a uniform compression, the maximum post-tension spacing
needs to be limited to the precast panel dimension measured in the direction of post-tensioning.
The compressed zone width can be increased to 2 times the panel dimension in the direction of
post-tensioning by using a grout with lower modulus of elasticity. This requires using a grout with
an elasticity modulus of less than 50 ksi (i.e. the ratio of panel concrete modulus to grout modulus
of 100 or greater). Use of grout with such a low modulus is not practical in prefabricated structures
because the grouted connection stiffness is not adequate to transfer load.
With regards to box-beams, post-tensioning can be applied at the top and bottom flanges to develop
adequate compression along the shear keys. Attanayake and Aktan (2013) recommended to limit
the maximum post-tension spacing equal to the width of the fascia beam. However, it is necessary
to perform a cost-benefit analysis, considering the life-cycle cost, and an evaluation of
implementation challenges of the above-stated recommendations to justify implementation of such
a post-tension configuration.
2.6 GROUT, MORTAR, AND NON-SHRINK MATERIAL
Shear keys are formed with grout, mortar, or cast-in-place concrete. The cast-in-place concrete
shear keys are common in Japan and Korea (Yamane et al. 1994; Kim et al. 2008). The common
practice in the US is to use mortar (a mix of cement, sand, and water). There is limited bond that
develops between the mortar and beam. Hence, the bond between the shear key mortar and the
beam surface is lost before grout cracking. The loss of bond was documented during a forensic
investigation of a side-by-side box-beam bridge that was being demolished in Michigan

12
(Attanayake and Aktan 2013). As shown in Figure 2-6, the shear key mortar adherence to the
beam was limited. Further, as shown in Figure 2-7, when typical cement mortar is used, grout-
beam interface cracking develops shortly after grouting (Attanayake and Aktan 2013).
A few studies evaluated the potential use of commercial grout material. Gulyas et al. (1995)
evaluated non-shrink grout using several test configurations including the composite direct tension
test. According to Gulyas et al. (1995), the bond failed at a tensile load of 1940 lbs. The equivalent
stress magnitude of this load is about 75 psi, which is much lower than the seven-day tensile
strength of non-shrink grout (390 psi) used in the test. The use of Set-45 (magnesium ammonium
phosphate; MgNH4PO4) mortar has increased the bond strength by 214% compared to the non-
shrink grout. The composite testing of grouted shear key assembly performed by Gulyas et al.
(1995) is a practical approach for evaluating the effect of shear key shape, substrate preparation
method, grouting procedures, curing methods, and grout properties on the shear key performance.
Sang (2010) evaluated performance of shear key with cementitious grout, epoxy grout, and fiber
reinforced cementitious grout. According to his study, epoxy grout and fiber reinforced
cementitious grout provided better bond strength as compared to cementitious grout. Hoomes et
al. (2014) evaluated bond strength of High Performance Fiber Reinforced Cementitious (HPRFC)
materials using the Direct Tension Bond Test (ASTM C 1404), the California Test 551, the
Guillotine Shear Test, and the Splitting Prism Test (based on ASTM C 496/496M). The direct
tension test provided consistent results. Difficulties in conducting direct tension bond tests were
documented. Both the direct tension bond test and the California test 551 data gave the lowest
coefficient of variation. Several different mixes were included in the study, and the lowest average
bond strength of 366 psi was documented using the direct tension bond test. As can be seen from
literature, new material with improved properties have been developed during the last decade.
With the use of these materials developing durable prefabricated component connections is a
possibility. Hoomes et al. (2014) recommends performing bond strength evaluation tests after
identifying the most suitable test configuration to represent the structural response expected from
the connection.
Sharpe (2007) summarized the small-scale specimen test results documented in literature. As
presented in Sharpe (2007), the weakest failure mode associated with grouted keyways is the

13
beam-shear key interface bond failure. This observation strengthens the discussion presented
previously in the chapter.
After evaluating literature on box-beam performance, it can be concluded that a grout material
which (i) provides an adequate bond strength for the specific application, (ii) shows non-shrink
properties (or a very low shrinkage after maximum expansion), and (iii) has a low permeability or
chloride absorption needs to be considered for shear keys to eliminate the weak link in the
structural system.
(a) (b) Figure 2-6. (a) Shear key material attached to a beam and (b) beam surface after grout had fallen off
Figure 2-7. Shear-key interface cracks before deck slab placement
The commercial grouts are of interest to many DOTs. This is especially true for the repair
materials which possess high bond strength and compatible properties to concrete. Commercial
grouts are considered by several DOTs for prefabricated element connections. Hence, a list of
commercially available grout materials and the material properties, application limitations, and
possibility of extending the grout for filling larger voids is developed and presented in Appendix
A. As discussed in Chapter 3, NYSDOT provides an approved commercial grout list for forming
box-beam shear keys.
In addition to commercial grout material properties documented in the manufacturer’s data sheets,
the laboratory and field data presented in the literature are also summarized in Appendix A.
Compressive strength data documented in the literature are compared to the material data sheets.

14
In the majority of cases, the compressive strength presented in the literature is significantly
different than that presented in the material data sheets by the manufacturer. This highlights the
importance of conducting mock-up testing in order to evaluate the application procedures and
material behavior under anticipated exposure conditions before recommending a specific material
for forming shear keys between box-beams.
Ultra high performance concrete (UHPC) is often specified for connecting precast elements. As
an example, the Iowa DOT used UHPC to grout dowel pockets at the longitudinal connection
between the pi-girders. The exposed surface of the UHPC connection often requires grinding
because there is a tendency of steel fibers to protrude out of the surface (Perry et al. 2010). UHPC
was also specified to form the longitudinal closure joints between deck modules in the US Highway 6
Bridge over the Keg Creek project in Iowa. The longitudinal connections are 6 in. wide and 8 in. deep
and reinforced with #5 hairpin bars at 8 in. spacing. The bridge was constructed in 2011. Seven
months later, cracking was documented at the interface between UHPC connections and girder flanges
(Phares et al. 2013). According to Royce (2016), NYSDOT has constructed 30 bridges utilizing UHPC
connections. Durability performance of these bridges would justify the use of UHPC in the field.
The closure between full-depth deck panels and decked bulb-tee girders is often formed using high
performance concrete (HPC). Japan, Korea, and Texas DOT use concrete filled shear keys in box-
beam bridges. Appendix A includes the mix designs and material properties of HPC documented
in the literature. HPC develops early strength as presented by French et al. (2011) and Freyne et
al. (2012). On the other hand, HPC shrinks. Unless adequate bond strength can be developed,
HPC may not be suitable for shear keys since it may lead to cracking at the interface between the
beam and shear key.
Shrinkage can be managed by using shrinkage reducing admixtures or expansive cement.
Chaunsali et al. (2013) investigated the potential use of shrinkage-reducing admixtures (SRA),
shrinkage-compensating cements (Type K and G), and mineral admixtures as a means of reducing
drying shrinkage cracks in Illinois bridge decks. Mix designs, shrinkage or expansion, and strength
values were recorded in two tables in Appendix A, Table A-10 and Table A-11. Table 2-2 provides
a summary of the data presented in Appendix A. Type K and G expansive cement showed the
lowest shrinkage at the end of 100 days. Furthermore, fly ash and silica fume affect the shrinkage
characteristics of expansive cement Type K and G. As shown in Table 2-2, the use of Type K with

15
Type F fly ash as well as Type G with Type C fly ash resulted in concrete expansion (Chaunsali
et al. 2013). Troli and Collepardi (2011) show the potential of reducing shrinkage using dead
burnt lime, which is CaO processed in temperatures higher than 1000°C. Also, there is a potential
of developing expansive concrete using dead burnt lime and a shrinkage reducing admixture
(SRA). Ramey et al. (1997) showed the impact of mixing and curing conditions on
shrinkage/expansion properties of the mixes with Type K cement with or without micro silica.
Battaglia et al. (2008) evaluated Eclipse® SRA for Wisconsin concrete and did not recommend its
use due to a tendency of destabilizing the air void structure. This product is not included in the
Wisconsin DOT approved product list. Eclipse® reduces shrinkage but is not appropriate for
developing non-shrink grout or concrete (Table 2-2).
Table 2-2. A Summary of Shrinkage and Strength of Different Admixtures Documented in Literature
Source: Admixture Shrinkage Strength
µε % psi
Chaunsali et al. (2013)
Tetraguard AS20 (4.45 L/m3) -450 4700 Komponent (Type K) -90 4400 Conex (Type G) (6%) -30 4400 Type K + F Fly Ash 40 4250 Type K + C Fly Ash -10 4600 Type K + C Silica Fume -110 5700 Type G + F Fly Ash -70 4250 Type G + C Fly Ash 10 4400 Type G + C Silica Fume -100 5500
Freyne et al. (2012) HPC 1 -260 6976 HPC 2 -320 7005
Troli and Collepardi (2011) CaO1+SRA 250 7397 CaO -220 7832 Plain concrete -580 6962
Manufacturer Datasheet KSC Concrete 0.045 4500 KSC Komponent Concrete 0.045 4500 KSC Komponent Grout Mix 0.045 7250
Ramey et al. (1997)
Type K Cement – Cold2 0.037 7455 Type K Cement with MS3 - Cold 0.027 8369 Type K Cement - Dry -0.018 6512 Type K Cement with MS - Dry -0.032 7092 Type K Cement - Hot 0.041 6280 Type K Cement with MS - Hot 0.041 6701 Type K Cement - Moist 0.041 6614 Type K Cement with MS – Moist 0.045 6802
Manufacturer Datasheet Eclipse 4500 -0.030
1 Dead burnt lime – CaO subjected to higher temperatures than 1000°C. 2 Cold: mixed and moist cured at 40 0F; Dry: mixed and cured at 40% RH and 72 0F; Hot: mixed and moist
cured at 90 0F; Moist: mixed and moist cured at 72 0F. 3 MS – micro silica

16
2.7 DECK OVERLAY AND REINFORCED CONCRETE SLAB
2.7.1 Deck Overlay
As shown in Figure 2-8, flexible overlay deck protection systems can be developed with either a
preformed sheet or liquid membranes. Each of these deck protection systems consists of five
components. These components are placed over the box-beam and shear key assemblage in the
following order: primer, membrane, protection board, tack coat, and asphaltic concrete. Recently,
the NCHRP Synthesis 425: Waterproofing Membranes for Concrete Bridge Decks was developed
by Russell (2012) with an objective of documenting information related to materials, specifications
requirements, design details, application methods, system performance, and costs of waterproofing
membranes used on new and existing bridge decks since 1995. This report section only provides
an overview of waterproofing membrane types, advantages of each waterproofing membrane
system, installation challenges, and performance issues. Detailed information on waterproofing
systems can be found in the NCHRP Synthesis 425 (Russell 2012).
(a) Preformed sheet membrane system
(b) Liquid membrane system
Components: 1. Concrete girders 2. Primer 3. Preformed membrane 4. Protection board 5. Tack coat 6. Asphaltic concrete
Components: 1. Concrete girders 2. Primer 3. Liquid membrane with fabric 4. Protection board 5. Tack coat 6. Asphaltic concrete
Figure 2-8. Components of waterproofing membrane systems (Russell 2012)
According to the survey results presented in Russell (2012), the life of the membrane system is
limited by the life of the asphalt. Sixty percent (60%) of respondents acknowledged that 1/4th of
the bridge population with waterproofing membranes placed on new bridge decks provided
between 16 to 20 years of service life. Moreover, Krauss et al. (2009) present information such as
service life, cost, overlay, thickness and installation time for flexible overlay. This information is

17
not specifically for box beams; rather it is for flexible overlay with a waterproofing membrane in
general (Table 2-3).
Table 2-3. Flexible Overlay with a Waterproofing Membrane
Rehabilitation Method
Expected Service Life Range (years)
[Mean]
Cost Range as of Year 2009 ($/ft2) [Mean]
Overlay Thickness (in.) [Mean]
Estimated Installation Time
Asphalt overlays with a Membrane
3-40 [12-19] 1.5-23.5 [3.1 - 7.6] 1.5 - 4 [2.4 - 3.1] > 3 days
2.7.1.1 Membranes
Table 2-4 shows two major waterproofing membrane types (preformed and liquid), advantages of
each waterproofing membrane system, installation challenges, and performance issues. The
performance of the system is greatly influenced by the installation design, workmanship, and the
composition of the waterproofing membrane (Kepler et al. 2000; Price 1989).
Preformed sheets are applied by rolling and using a pressure-sensitive adhesive on the sheet
(Russell 2012). The types of preformed sheets are bituminized fabrics, polymer, elastomer based
systems, bituminized laminated boards, and mineral dressed bitumen protective sheets (Price
1989). The bituminized laminated board is also used as a protective board in membrane systems.
The liquid membranes are applied using either a spray apparatus or a roller and squeegees.
Depending on the manufacturer’s recommendations, the membranes are placed as either hot or
cold. It may or may not have a reinforcing fabric. If a reinforcing fabric is used, the first layer of
liquid is sprayed before the fabric is placed. Then, the fabric is placed over the liquid, and the
second layer of liquid is applied (Russell 2012).
Constructed-in-place systems can be subdivided into bituminous and resinous liquid-sprayed
systems. Bituminous systems are subdivided into bituminous solutions or compositions and keg
mastic asphalt. The keg mastic asphalt requires heat to transform it into liquid. Asphalt-based
liquids are various bitumen solutions blended in hydrocarbon solvents, two-part polymer modified
compositions or refined natural or elastomer-modified mastic asphalts. Resinous membranes are
subdivided into polyurethane, epoxy, and acrylic resin based systems (Price 1989). Polyurethane-
based systems are all elastomers with carborundum of coal tar. Other polyurethane systems,
known as pitch epoxies, are modified with coal tar. The acrylic systems are based on
polymethacrylate resin (Liang et al. 2010).

18
Table 2-4. Waterproofing Membranes: Advantages, Installation Challenges, and Performance Issues
Preformed Sheets Membrane Liquid Membrane
Advantages
Quality and thickness can be controlled during manufacturing
Elastomer materials provide a moderately satisfactory bond
Can be applied in one application by a sprayer or a squeegee without laps
Blisters and pinholes are easy to repair in self-sealing materials
Does not depend on the geometry of the deck Less vulnerable to poor workmanship Epoxy resin develops an excellent bond with
concrete Acrylic resin develops an adequately strong
bond with concrete
Installation Challenges
Blisters have to be repaired by puncturing and patching
Bitumen protective sheets usually are damaged under base course
Bitumen laminated boards are usually damaged under base coarse asphalt
Difficult to install on curved or rough decks Installation is labor intensive More vulnerable to poor workmanship Require lapses at each edge Some bitumen fabric material having a
thickness less than 1/6 in. (4 mm) are punctured by hot aggregate
Certain elastomer materials soften under asphalt with a risk of puncturing, but can be protected with a sand carpet
Difficult to ensure consistent quality and thickness
Bituminous solutions are likely to blister during placement
Keg mastic are likely to blister during placement and soften under medium to high ambient temperature
Epoxy resin systems are likely to blister and embrittled with the application of hot asphaltic materials
Performance Issues
Membrane leakage Debonding due to water accumulation
2.7.2 Concrete Slab
Attanayake and Aktan (2013) documented the initiation of reflective deck cracks even before
completing the approach pavements of a new Michigan DOT bridge deck with full-depth grouted
partial depth shear keys, transverse post-tensioning, and a 6 in. cast-in-place concrete slab. The
causes of reflective crack initiation are not identified. However, considering the time of cracking
and loading on the bridge, the observation by Attanayake and Aktan (2013) indicates that the
reasons for cracking may be due to concrete shrinkage, temperature gradient, time dependent
losses of box-beam prestress, or a combination thereof. Also, the reflective cracks were observed
over the supports (abutments and piers). Finite element analysis results presented by Sharpe
(2007) support the findings.
Sharpe (2007) describes the impact of the concrete shrinkage on reflective cracking and
recommends reducing shrinkage effects. As discussed in the previous section and Appendix A,

19
the use of expansive cement Type K and G with mineral admixtures can be used for reducing
shrinkage. Lall et al. (1997) recommend a higher amount of steel reinforcement in the concrete
slab to reduce the crack width by increasing the number of cracks. A prudent approach is to use
non-shrink mixes to reduce concrete cracking potential.
2.8 BEARING LAYOUT
Lall et al. (1997) recommends full-width bearing pads to prevent off-axis tilting. Sang (2010)
recommends placing bearing pads underneath the shear keys to prevent differential movement of
the beams due to cracking or less stiff shear keys. PCI (2011) recommends providing a 3-point
bearing system to minimize the rocking of girders.
The common practice is to use neoprene pads on reinforced concrete abutments and pier/bent caps
to support box-beams. More recently, a Geosynthetic Reinforced Soil (GRS) Integrated Bridge
System (IBS) is introduced as a cost effective solution for small, single span bridges (FHWA
2011). According to FHWA (2011) and NYSDOT (2015), when the GRS-IBS concept is
implemented to build adjacent box-beam bridges, beams are directly supported on a bearing bed
prepared using reinforced soil (Figure 2-9). Even though FHWA (2011) suggests using a jointless
pavement over the abutments, NYSDOT (2015) acknowledges the need of using an expansion
joint to accommodate bridge movement due to thermal expansion and contraction. The Alberta
Ministry of Transportation (Alberta MOT 2017) detail includes a precast concrete abutment seat
and neoprene pads. Since cracking is imminent at the pavement-beam end interface, Alberta MOT
(2017) detail includes a waterproofing membrane (Figure 2-10).

20
Figure 2-9. Typical GRS-IBS detail (FHWA 2011)
Figure 2-10. Alberta MOT GRS-IBS detail (Alberta MOT 2017)

21
2.9 DESIGN AND CONSTRUCTION RECOMMENDATIONS
Table 2-5 and Table 2-6 list the design and construction recommendations and concepts
documented in the literature.
Table 2-5. Best Design Practices Recommended/Suggested in the Literature
NCHRP Synthesis 393 PCI State-of-the-Art Report PCI Northeast Provide full-depth shear keys that
can be grouted easily. Provide transverse post-
tensioning so that tensile stresses do not occur across the joint.
Provide a cast-in-place, reinforced concrete, composite deck with a specified concrete compressive strength of 4,000 psi and a minimum thickness of 5 in., to limit the potential for longitudinal deck cracking.
Provide shear key geometries that allow deck concrete to fill the key, or use full depth shear keys.
Utilize high performance or high strength, low permeability concrete in the beams and deck slab.
Provide a minimum of 1.5 in. cover to all reinforcing. Use 2 in. where practical.
Utilize strand patterns which omit the use of prestressing strands in the exterior corners.
Design for composite action with a reinforced concrete deck slab (minimum thickness of 5 in.).
Minimize skews where practical. Provide lateral restraint at piers and
abutments. Consider 3-point bearing system to
minimize rocking of girders. Utilize corrosion inhibitor in the
concrete mix design for the beams. Provide waterproofing between top of
structural member and overlay if a noncomposite overlay is to be used.
Provide full-depth shear keys.

22
Table 2-6. Best Construction Practices Recommended/Suggested in the Literature
NCHRP Synthesis 393 PCI State-of-the-Art Report PCI Northeast
Use stay-in-place expanded polystyrene to form the voids.
Sandblast the longitudinal keyway surfaces of the box beams immediately before shipping to provide a better bonding surface for the grout.
Clean the keyway surfaces with compressed air or water before erection of the beams to provide a better bonding surface for the grout.
Grout the keyways before transversely post-tensioning to ensure compression in the grout.
Use a grout with high bond strength to the box beam keyway surfaces to limit cracking.
Provide proper curing for the grout to reduce shrinkage stresses and ensure proper strength development.
Provide wet curing of the concrete deck for at least 7 days to reduce the potential for shrinkage cracking and to provide a durable surface.
Utilize polystyrene material to form voids.
Provide consistent casting conditions to minimize differential camber in beams.
Properly anchor polystyrene forms to prevent floating of forms during casting.
Provide vent holes for beam curing in addition to drainage holes in boxes.
When extending stirrups for shear connection to slab, consider bent shape of bar in relation to placement of void forms.
When extending mild reinforcing steel at the ends of beams, provide straight bars and bend after fabrication.
Provide transverse post-tensioning to compress joints and minimize differential deflections between boxes.
Sandblast shear keys prior to grouting or concreting.
Utilize epoxy grout in keyways when using small shear keys.
Post-tension transverse ties after grouting on square bridges.
Post-tension transverse ties prior to grouting shear keys on skewed bridges.
Grind concrete pier and abutment surfaces if necessary to achieve uniform bearing surface.
Offset longitudinal deck joints a minimum of 1 ft from edge of adjacent box in staged construction.
When differential camber occurs, force beams together or provide smooth transition with joint grout material.
Bridges with skew < 30°
Layout working lines. Verify beam seat elevations and install
bearing pads. If seats are high, grind to correct elevations and if seats are low, use shims as required.
Erect beams. Install hardwood wedges between adjacent beams to maintain proper shear key joint opening.
Install polyethylene closed cell backer rod as joint filler at shear key locations. Filler shall be placed below the bottom of the shear key joints. Filler shall be installed sufficiently tight to prevent loss of the shear key grout.
Install transverse ties through ducts. Verify the hardwood wedges are in place. Post-tension transverse ties to approximately 5 kips to remove sag in the tie and to seat the chuck.
Grout shear key. Ensure the structural integrity of the superstructure. Clean it with an oil free air-blast immediately prior to grout placement. Verify the backer rod is still in place. Rod carefully to eliminate voids.
Shear key grout shall attain a minimum compressive strength of 1500 psi before post-tension application.
Post-tension transverse ties to 30 kips beginning with inner most ties and proceeding symmetrically about mid-span towards the member ends. For box beams with top and bottom transverse ties, tension the bottom and top tie to 15 kips. Repeat the sequence once more so that each transverse tie has 30 kips of tension.
Finish work. Remove wedges and patch the deck and fascia beams at transverse tie locations. Place overlay concrete.

23
2.9.1 Grouting Shear Keys
All grouting operations with cementitious materials require wetting the precast element surfaces
to attain a saturated-surface-dry condition before placing the grout or special concrete. Generally,
wetting of the component surfaces should start at least 4 hours before the grout placement.
However, most grout material datasheets recommend a wetting process to start 24 hours before
placement.
Surface preparation is important and is a critical factor for bonding grout to the precast elements.
The surface should be clean from any foreign materials, and the joints should be roughened or
mechanically abraded to allow forming a mechanical bond between the grout and the precast
elements. Cementitious grout with non-shrink properties is often recommended in precast
construction due to assumed material compatibility of the grout with precast elements. The
material datasheet for magnesium phosphate grouts indicates the need for special surface
preparation to enhance bonding at the grout – precast element interface. Once the surface is
prepared, the magnesium phosphate grout will provide desired bonding properties as per the
manufacturer datasheet.
Ambient vibration, propagating from traffic or other construction operations, is a factor that
promotes grout cracking and failure at the grout-precast element interface bond. Grouts, mostly
those requiring longer setting time, are sensitive to the structural vibration. The impact of vibration
needs to be considered, for example, in the case of staged construction.
Grout placement methods include dry packing, gravity flow (pouring), and pumping (Figure 2-11,
Figure 2-12, and Figure 2-13). Dry packing is commonly used for shear keys. Moreover, grout
mixed at flowable and fluid consistency can be pumped into tight spaces. The pumping process
requires a leak-proof formwork that can withstand the pumping pressure. Joints are commonly
sealed with a foam backer rod, which is flexible and may not be sufficient for pressure grouting.

24
Figure 2-11. Grouting adjacent box-beam shear keys using type R-2 grout (Oakland Drive over I-94, MI)
Figure 2-12. Pumping W.R. Meadows Sealight CG-86 non-shrink grout (Source: Oliva et al. 2007)
Figure 2-13. Grouting of full-depth deck panel connections (Source: Courtesy of MDOT)

25
2.10 SUMMARY AND CONCLUSIONS
Recent studies and findings/recommendations related to box-beam bridge performance, box-beam
geometry, shear key configuration, transverse post-tensioning, shear key grout material, deck
overlay or concrete slab, bearing layout, and construction recommendations are summarized in
this chapter. The following sections provide the conclusions derived from the information
presented in the chapter.
2.10.1 Box-Beam Bridge Performance
Review of literature and Michigan experience show that reflective deck cracking develops
irrespective of the changes implemented to abate cracking.
2.10.2 Box-Beam and Shear Key Geometry
The box-beam with rectangular voids is commonly used by the state DOTs. Compared to the
sections used in other countries, the box-beam with rectangular voids has the least self-weight.
Unless additional investigations are performed to justify the added benefits of using a different
section, the use of box-beams with rectangular voids is preferred to minimize the impact on the
fabrication process.
Box-beams with full-depth shear keys are used by several state DOTs as well in Japan, Korea, and
China. The drawback of using a full-depth grouted partial-depth shear key was discussed. A full-
depth shear key provides adequate confinement to prevent grout spall even when the shear key
material is cracked. Further, it provides an adequate space for material placement and
consolidation.
2.10.3 Transverse Post-Tensioning
Aktan et al. (2009) demonstrated that the shear keys located longitudinally in between the
diaphragms are not compressed when post-tensioning is applied through the diaphragms, even
under increased post-tensioning. Two-stage post-tensioning is suggested, before placement and
after strength gain of the concrete deck slab. Ulku et al. (2010) demonstrated the effectiveness of
applying two-stage post-tensioning to mitigate reflective cracking.

26
2.10.4 Shear Key Grout
Cementitious grout with non-shrink properties is often recommended in precast construction due
to assumed material compatibility of the grout with precast elements. Beam surface preparation
is important and critical for effective bonding between the grout and precast elements. The surface
should be saturated-surface-dry for cementitious grouts, free from any foreign materials, and
roughened or mechanically abraded. Following a good surface preparation, an adequately strong
mechanical bond can be developed between grout and the beam surface. Use of commercial grouts
requires special surface preparation to achieve the desired bonding properties. Hence,
manufacturer recommendations need to be strictly followed.
Grout placement methods include dry packing, gravity flow (pouring), and pumping. Grout mixed
at flowable and fluid consistency can be pumped into tight spaces to form shear keys. Flowable
grout requires a leak-proof formwork.
2.10.5 Cast-in-Place Concrete Slab
The literature showed that the reflective deck cracking develops even before the bridge is opened
to traffic. In addition, despite the use of full-depth grouted partial depth shear keys, transverse
post-tensioning, and a 6 in. cast-in-place concrete slab, the reflective deck cracking persisted.
These observations show that the cracking might be originating due to concrete shrinkage,
temperature gradient load, time dependent losses of box-beam prestress, or a combination thereof.
Use of non-shrink concrete with staged post-tensioning may decrease the cracking potential.
2.10.6 Flexible Overlay with Waterproofing Membrane
The literature presented that a flexible overlay deck system can be developed with either preformed
sheets or liquid membranes. The system can provide a service life between 16 to 20 years. Both
membrane systems present advantages, installation challenges, and performance issues. Its
performance can be greatly influenced by the installation design, workmanship, and the
composition of the membrane.
2.10.7 Bearing Layout
Different bearing configurations are proposed in the literature. Other than transferring load from
superstructure to substructure, the prime objective of using a specific bearing configuration is to

27
ensure box-beam stability. The literature findings are inconclusive but recommend using a bearing
configuration that can prevent box-beam rocking during construction.
2.10.8 Design Recommendations
Based on the information presented in this chapter, the following design recommendations are
presented:
Specify full-depth shear keys.
Specify two-stage transverse post-tensioning.
Specify a cast-in-place reinforced concrete slab with a compressive strength of 4000 psi
and a minimum thickness of 5 inches.
Avoid skew where practical.
Provide lateral restraint at piers and abutments.
Provide a minimum of 1.5 in. cover to all reinforcing. Use 2 in. cover where practical.
Utilize corrosion inhibitor in the concrete mix design for the beams.
Utilize high performance or high strength, low permeable, non-shrink deck concrete.
Use non-shrink grout material that possesses a high bond strength.
2.10.9 Construction Recommendations
Based on the information presented in this chapter, the following construction recommendations
are presented.
2.10.9.1 General Recommendations
Use expanded polystyrene blocks to form box-beam void.
Properly anchor the foam blocks.
Provide vent holes for beam curing in addition to drainage holes in boxes.
When extending stirrups for shear connection to slab, consider a bent shape of bar in
relation to placement of foam blocks.
Verify beam seat elevations and install bearing pads. Grind concrete pier and abutment
surfaces, if necessary. Consider a 3-point bearing system to minimize rocking of girders.
Sandblast the longitudinal keyway surfaces immediately before shipping.

28
Erect beams. When differential camber occurs, force beams to match the camber or
provide smooth transitions with joint grout material.
Install hardwood wedges between adjacent beams to maintain beam spacing.
Install a polyethylene closed cell backer rod as the formwork at shear key locations.
Install formwork around post-tensioning ducts to prevent shear key grout getting into the
ducts.
Install transverse ties through ducts. Verify that the hardwood wedges are in place. Post-
tension transverse ties to approximately 5 kips to remove sag in the tie and to seat the
chuck.
Grout the keyways before transverse post-tensioning.
Use a grout with high bond strength to form shear keys.
Provide proper curing for the grout.
Remove wedges.
Post-tension transverse ties to attain the specified force at each post-tensioning location.
When two or more post-tensioning ducts are located along the beam depth, apply half of
the force specified at each location along the depth. Repeat the sequence along beam depth
to attain the specified force at each location.
Start posttensioning over the supports and sequentially proceed towards the midspan to
prevent tensile stresses developing at the shear keys over the supports.
Follow the steps given in Section 2.10.9.2 or Section 2.10.9.3 as applicable to complete
construction.
2.10.9.2 Recommendations for a Deck with an Overlay
Post-tension transverse ties to attain the specified force at each post-tensioning location by
following the sequence presented in Section 2.10.9.1.
Grout post-tensioning ducts.
Place an overlay with a waterproofing on top of structural members. Offset longitudinal
construction deck joint a minimum of 1 foot from the closest shear key.
Fill the stress pockets with a non-shrink grout.

29
2.10.9.3 Recommendations for a Deck with a Cast-in-place Concrete Slab
Apply the required first-stage post-tension by following the sequence presented in Section
2.10.9.1.
Place a cast-in-place concrete slab with a single layer of reinforcement.
Offset the longitudinal construction deck joint a minimum of 1 foot from the closest shear
key.
Provide wet curing of the concrete deck for at least 7 days.
Provide consistent casting conditions.
Apply the second stage post-tensioning to compress the box-beam, shear key, and cast-in-
place concrete slab assembly. Follow a post-tensioning sequence similar to first stage post-
tensioning.
Grout post-tensioning ducts.
Fill the stress pockets with a non-shrink grout.

30
3 STATE DEPARTMENT OF TRANSPORTATION PRACTICES
3.1 OBJECTIVE AND APPROACH
This chapter includes the documentation of department of transportation (DOT) practices related
to box-beam geometry, shear key configuration, transverse post-tensioning, shear key grout
material, deck overlay or concrete slab, bearing layout, and construction procedures. Two surveys
were previously conducted for the NCHRP Synthesis 393 (Russell 2009) and the PCI State-of-the-
Art Report (PCI 2011) (Table 3-1). During this project, the surveys cited above were reviewed,
and the states with box-beam bridges were selected. Twenty one out of 35 states affirmed on the
NCHRP Synthesis 393 survey that they have side-by-side box-beam bridges. Out of 29 states that
affirmed, on the PCI survey, that they have box-beam bridges, only 27 states have side-by-side
box-beams. After considering the states with side-by-side box-beam bridges and the exposure
conditions in the State of Wisconsin, 17 states were selected for review (Table 3-1).
Table 3-1. States That Participated in Two Previous Surveys and the Ones Selected for Review
No State Survey Participation
Remarks States Selected for
Review PCI NCHRP Synthesis 393 1 CT Yes - 2 DE Yes Yes 3 IA - - 4 IL Yes - 5 IN Yes - 6 KS - - 7 KY Yes - 8 MA Yes Yes 9 MD Yes Yes Solid slab boxes only
10 ME - - 11 MI Yes Yes 12 MN - - 13 MO Yes Yes 14 ND Yes - Spread box beam only 15 NE - - 16 NH Yes Yes 17 NJ Yes Yes 18 NY Yes Yes 19 OH Yes Yes 20 PA Yes Yes 21 RI Yes - 22 SD - - 23 VA - Yes 24 VT Yes - 25 WI - Yes 26 WV - -
- denotes either negative responses or no response

31
From the information available in the respective DOT websites, the data related to box-beam
bridges is compiled. Appendix B presents the compiled information from all the selected DOTs
except the Wisconsin DOT (WisDOT).
In order to compile WisDOT practice, the Wisconsin Highway Structures Information (HSI)
system was used to acquire bridge plans, design calculations, and other documents. The HSI
database was queried using the following options and yielded 168 bridges.
STRC_TYPE=B; SpanMaterial=PRECAST CONC; SpanMaterial=PREST CONCRETE;
and SpanConfiguration = BOX GIRDER and BOX SECTIONS.
In addition, there were six bridges constructed as continuous for live load. These bridges were
identified using the following options:
STRC_TYPE=B; SpanMaterial=CONT PREST CONC; and SpanConfiguration =BOX
GIRDER.
From HSI, a total of 174 bridges were identified. Five bridges had a superstructure other than box-
beams; 4 of them were widened using box-beams. These 5 bridges were not considered in the
analysis. Also, one of the bridges had box-beams in only one span out of the seven spans. Since
the bridge has one complete span with box-beams, it was considered in the analysis. The oldest
box-beam bridge that is still in service in Wisconsin was built in 1954. Appendix C presents the
compiled information from WisDOT.
In addition to the information acquired through respective DOT websites, a survey was conducted
to learn designers’, inspectors’, and fabricators’ experience related to the reflective deck cracking.
This chapter presents a summary of compiled information from all 17 states and the survey.

32
3.2 DOT PRACTICES
3.2.1 Box-Beam Geometry
The geometries of box-beams used by the respective DOTs are shown in Figure 3-1.
DOT: CT, DE, IL, IN, MI, NJ, PA, WI
DOT: MA, NY, RI
DOT: OH
Figure 3-1. Typical box-beam geometries used by the State DOTs
The most recent WisDOT standard details show rectangular sections up to 42 in. in depth. The
section depth ranges from a 12 in. (solid section) to 42 in. with a rectangular void. Beam width
ranges from 36 in. to 48 in. Typical exterior girders support the curb that varies in width and
height. It appears that these variations depend on the width of the beam and the height of the
overlay being placed upon the bridge. Use of closed stirrups is the current standard practice. Weep
holes of 1 in. in diameter are provided at each end of a void to drain moisture. The number of
weep holes at each end of a void ranges from 1 to 2 depending on the width of the section.
3.2.2 Shear Key Configuration
Partial depth, full-depth grouted partial depth, and full-depth shear keys are commonly used
(Figure 3-2). Table 3-2 lists the DOTs and the shear key configurations used in the respective
jurisdiction.

33
(a) Partial depth shear key
(b) Full-depth grouted partial depth shear key
(c) Full-depth shear key
Figure 3-2. Shear key configurations used by various state DOTs
Table 3-2. Shear Key Configurations Used by the State DOTs
State DOT Shear Key Configuration
Remarks Partial depth
Full-depth grouted partial depth
Full-depth
CT, DE √
IL, MI, OH, WI √
KY, NJ, PA Partial depth shear key. Grout depth information could not be identified.
NY, MA, RI √
VT Grouted shear key depth is 2/3 of the
beam depth.

34
3.2.3 Transverse Post-Tensioning
Transverse post-tensioning details used by 17 state DOTs are given in Appendix B and C. A
summary is provided in Table 3-3. The use of post-tensioning strands or tie-rods is the common
practice. The number of post-tensioning duct locations along the span and depth of a girder as
well as the tie force calculation methods vary significantly. As an example, Connecticut DOT has
tables showing predetermined post-tensioning tie locations. Illinois DOT has a formula to
calculate the number of transverse tie locations along the span. As per the formula, a 50 ft span
requires only one tie location along the span. In Indiana, transverse post-tensioning is applied at
1/3 and 1/4 points along the span for bridges up to 40 ft and over 40 ft, respectively. Post-
tensioning is not applied over the supports (abutments or piers). New Jersey calculates the post-
tensioning force based on superstructure dead load. Michigan has tables showing post-tensioning
duct locations along the depth and span as well as the force per diaphragm. The duct locations and
tie forces were determined based on refined finite element analysis. Vermont provides a graph to
calculate midspan post-tensioning force per foot for a given section. The post-tensioning force per
duct is calculated by multiplying the force per foot and duct spacing.
As presented in Appendix B, skew policy on box-beam bridges varies significantly. As an
example, Michigan allows placing transverse post-tensioning ducts parallel to skew up to 300.
Whereas, NJ and KY allow placing transverse post-tensioning ducts parallel to skew up to 150 and
100, respectively.

35
Table 3-3. Post-Tensioning Force Used by the State DOTs
State DOT Post-Tension Force Tie Location
CT 30 kips/ location At the ends (i.e. over the supports) and multiple locations
along the span DE -
IL - Uses a formula to calculate number of post-tensioning
locations along a span. Transverse ties are not provided over the supports.
IN 20 ksi per rod. 1/3 locations for span ≤ 40 ft ¼ locations for span > 40 ft
Ties are not provided over the supports.
KY 20 ksi per rod. 1 location for span ≤ 50 ft 2 locations for span > 50 ft
Ties are not provided over the supports.
MA - Ends and midspan for span ≤ 50 ft
Ends, ¼ locations, and midspan for span > 50 ft
MI 120 kips/diaphragm
4 location for span ≤ 50 ft 5 locations for span 50 ft < span ≤ 62 ft 6 locations for span 62 ft < span ≤ 100 ft
7 locations for span > 100 ft MO - NH -
NJ Calculated based on
superstructure dead load Ties are provided
NY - Ends and midspan for span ≤ 50 ft
Ends, ¼ locations, and midspan for span > 50 ft
OH - Midspan for span ≤ 50 ft
1/3 locations for span 50 ft < span ≤ 75 ft ¼ locations for span > 75 ft
PA - -
RI 44 kips at each duct Ends and midspan for span ≤ 50 ft
Ends, ¼ locations, and midspan for span > 50 ft
VA - Only slabs are used.
Post-tensioning is placed at ends, ¼ locations, and midspan.
VT A chart is provided. Force per tendon is calculated based on
duct spacing. -
WI 86.7 kips per duct
1 at center and 1 at each end for span ≤ 50 ft 2 at center (12 ft apart) and 1 at each end
for 50 ft < span ≤ 62 ft 1 at center, 1 at each quarter point, and 1 at each end
for span > 62 ft
3.2.4 Grout, Mortar, and Non-Shrink Material
Non-shrink grout and mortar are commonly specified. Yet, the requirements vary significantly.
As an example, AASHTO LRFD (2013) Section 5.14.4.3.2 specifies using grout that can reach
5000 psi in 24 hours. The Michigan Department of Transportation uses R-2 mortar specified in
Section 702 of the Standard Specifications for Construction. This mix is primarily developed with

36
cement, water and fine aggregate. A total air content of 14% +/-4% is required in the mix. This
mix can only develop about 3500 psi in 3 days (Aktan et al. 2009). The Delaware specification
requires grout that can reach 5000 psi in 24 hours. The typical grout mix used in Wisconsin and
placement requirements are presented in Table 3-4. The special provisions of a recent bridge
detailed the mix and placement requirements shown in Table 3-5. NYSDOT allows commercial
grouts and has an approved product list for grouting box-beam shear keys. Even though the
Wisconsin DOT is not using commercial grouts to form the shear key, a few products that are
listed in the NYSDOT list are also in the Wisconsin approved product list. These are 1107
Advantage Grout, NC Grout, and Sika Grout 212. Only Sika Grout 212 shows freeze/thaw
resistance and expansion during hardening, making it a suitable product for forming shear keys in
Wisconsin adjacent box-beam bridges. However, none of the technical data sheets provide bond
strength with the substrate, a very important parameter for developing durable connections.
Table 3-4. Typical Shear Key Grout Mix and Placement Requirements
Cement (lbs/yd3) 920 (Type I) Sand (lbs/yd3) @ SSD (Saturated Surface Dry) 2.65 specific gravity
2,350
Water To reach approximately 5 in. slump or to a consistency to insure that the voids are completely filled
Air content 14% +/- 4% by using masonry cement or an air entraining admixture Placement requirements Grout shall be rodded to insure that the voids are completely filled.
Table 3-5. Shear Key Grout Mixes Given in a Recent Special Provisions
Mix 1
Type 1 portland cement (lbs/yd3) 468 Type ‘N’ masonry cement (lbs/yd3) 349 Fine aggregate (lbs/yd3) 1,991 Net water (approximate) (lbs/yd3) 415
Mix 2
Type 1 portland cement (lbs/yd3) 930 Fine aggregate (lbs/yd3) 1,966 Net water (approximate) (lbs/yd3) 415 Air content 14% +/- 4% by using an air entraining admixture
3.2.4.1 NYSDOT Approved Commercial Grout for Shear Keys
Table 3-6 lists the shear key grout test requirements. The approved cement based grout materials
for placement in shear keys between prestressed concrete box-beams and hollow slab units are
listed in Table 3-7 and Table 3-8. The list was revised on May 2, 2016. The following grout
properties are compiled from the manufacturer datasheets and presented in Table 3-7 and Table
3-8:

37
Compressive strength at 1, 3, 7, 28 days,
Initial setting time,
Grout pocket dimensions,
Working temperature range,
Freeze/thaw resistance,
Non-shrink properties (Change in height/volume as per ASTM C1090), and
Possibility for extending grout.
The following is an excerpt of NYSDOT specification that details the process of getting an
approval for a grout to be included in the department approved product list of Cement Based Grout
Materials for Shear Keys.
GENERAL.The material must be flowable to fill the shear key with no voids. The Department will test the material in accordance with Test Method NY 701-12P, C following the manufacturer's proportioning and mixing instructions printed on the package. Material meeting the requirements of this specification will be placed on the Approved List. The Approved List titled: Shear Key Grout will state the precise water-grout ratio by weight. This ratio shall not be altered. For field use, follow the manufacturer’s mixing and curing recommendations. MATERIAL REQUIREMENTS. The material shall be a prepackaged dry component: to which water or emulsified compound is added, used for concrete repair, containing no metallic expansion aides, to which no aggregate may be added. The material must meet the shear key pourability test as per Test Method NY 701-12P,C and the requirements of Table 701-06 (Table 3-6).
Table 3-6. NYSDOT Shear Key Grout Test Requirements
TABLE 701-06 SHEAR KEY GROUT TEST REQUIREMENT Min. Max. Initial Set (minutes) 120 - Expansion (%) 0.02 1.0 Contraction (%) - 0.0 7 Day Compressive Strength (psi) 6000 - Freeze-Thaw Loss % (25 cycles) - 1.0 Total Chloride Content (% by weight) - 0.05 Total Sulfate Content (% by weight) - 5.0

38
Table 3-7. NYSDOT Approved Grout List for Shear Keys (Part 1 of 2)
1107
Adv
anta
ge G
rout
Cer
ti-V
ex G
rou
t 11
00
NY
DO
T
Con
set
Gro
ut N
Y
Har
ris
DO
T
Con
stru
ctio
n G
rout
Kem
set
Gro
ut
Map
ei P
lan
igro
ut
740
NC
Gro
ut
Compressive strength (ksi)
1 day 2.5 4.8 3.15 - 4.4 5.0 - 3 days 5.0 6.2 - 4.5 5.8 6.0 4.0 7 days 6.0 7.1 6.0 5.8 7.4 7.4 6.0
28 days 8.0 8.2 7.48 8.0 8.3 9.4 7.5
Initial setting time (min) 30 200 180 - 42 420 150-210
Fill depth/thickness for neat grout (in.) Min - - - 1 - 0.5 1
Max 3 12 2 2 2 2.375 2
Working temperature (oF) Min 45 50 40 40 40 41 40
Max 90 80 90 85 90 95 -
Freeze/thaw resistant - YES - - - YES -
Change in Height/Volume (%) (as per ASTM C1090 or CRD-C-621)
28 days - 1.9 0.10 0.03 - 0.15 -
Extend with aggregate YES YES YES YES YES YES YES

39
Table 3-8. NYSDOT Approved Grout List for Shear Keys (Part 2 of 2)
Pro
Gro
ut
100
Pro
Spec
C11
07
Con
stru
ctio
n G
rout
Pro
Spec
Hig
h S
tren
gth
Pre
cisi
on
Gro
ut
SC
Mu
lti-
Pu
rpos
e G
rout
Sik
aGro
ut 2
12
Sym
ons
NY
DO
T,
Mu
ltiP
urp
ose
Con
stru
ctio
n G
rout
+
Su
reG
rou
t 10
6
Compressive strength (ksi)
1 day - 5.5 5.5 3.1 3.5 5.2 2.4
3 days 5.2 - 7.0 5.0 - - -
7 days 9.2 7.3 8.5 6.9 5.7 6.5 6.4 28 days 10.0 8.5 10.0 8.4 6.2 8.1 7.6
Initial setting time (min) - 300 – 420 360 - 300 15-20 240
Fill depth/thickness for neat grout (in.) Min - 1 1 - 0.5 - - Max - 4 4 3 2 2 -
Working temperature (oF) Min 50 40 40 50 40 40 - Max 80 90 90 80 - - -
Freeze/thaw resistant YES - YES YES YES YES YES Change in Height/Volume (%)
28 days - - 0.03 0.03 0.06 0.04 0.68 (as per ASTM C1090 or CRD-C-621) Extend with aggregate - YES YES YES YES YES -
+ Only three grout types are approved by the NYSDOT from this supplier. They are 1107 Advantage, HD 50, and Pave Patch 3000. The 1107 Advantage is already included in the table. The description of the HD 50 states that it is for vertical applications and bridge decks. Hence, the date from HD 50 specification is included in the table for the Symons NY DOT MultiPurpose Construction Grout.

40
3.2.5 Deck Overlay or Concrete Slab
The most common practice is to use an overlay or a reinforced concrete cast-in-place slab over the
box-beams (Table 3-9).
Table 3-9. Overlay or Concrete Slab Used by the State DOTs
State DOT Overlay or Concrete Slab
IN 1 in. monolithic concrete 3 in. asphalt concrete- only for non-composite prestressed box beams 6 in. reinforced concrete cast-in-place slab
MI 6 in. reinforced concrete cast-in-place slab Hot mix asphalt where the ADT is less than 500 and/or commercial traffic is less than 3% of ADT
NH 3 in. concrete wearing surface NJ 5 in reinforced concrete cast-in-place slab
OH 6 in reinforced concrete cast-in-place slab Asphalt wearing of 8 inches maximum for non-composite
PA 5 ½ in reinforced concrete cast-in-place slab A bituminous wearing course of 2 ½ inches minimum and 6 inches maximum for non-composite
RI A minimum of 5 in. thick reinforced concrete cast-in-place slab A bituminous wearing surface with a waterproof membrane
According to section 19.3.9.2 of Wisconsin Bridge Manual, three types of overlays can be used as
the wearing surface of box-beam bridges. They are as follows:
Concrete overlay-Grade E or C,
Asphaltic overlay with waterproofing membrane,
Modified mix asphalt.
Only the STH 76 over the Embarrass River (B440198) Bridge consists of a 5 in. thick cast-in-place
concrete slab with a single mat of reinforcement. This bridge has been built following Michigan
practice to evaluate the potential for mitigating reflective cracking with a 5 in. thick slab and post-
tensioning.
3.2.6 Bearing Layout
Different bearing configurations are used by the state DOTs to prevent box-beam rocking during
construction (Figure 3-3).
.

41
State: CT, KY Note: Two bearing pads at each end. Bearing axis is perpendicular to the bridge longitudinal axis.
State: IN, MA, OH, PA, VA, VT Note: Two bearing pads at each end. Bearing axis is parallel to the longitudinal axis of the substructure.
State: IL Note: 1 in. fabric pad across two beams (This provides two bearings underneath each beam end).
State: DE, MI, NJ, NY, PA, RI Note: A full-width bearing pad at each end.
Figure 3-3. Bearing configurations used by the state DOTs

42
The standard practice in Wisconsin was to have the bearing pads located at the corners of the
girder, with adjacent girders sharing a bearing pad (Figure 3-4). The bearing pads were specified
to be ½ in. in thickness. A filler material was placed in between the bearings. The current standard
detail is to place 12 in. wide full-width bearing pads over the pier and 8 in. wide full width pads
over the abutments (Figure 3-5). It appears that these are the only two bearing pad configurations
that have been used.
(a) Over an abutment
(b) Over a pier
Figure 3-4. Bearing pad plan
Figure 3-5. The bearing layout given with the most recent standard details

43
3.2.7 Construction Specifications
The construction procedures specified by each state vary significantly. A few states have specific
guidelines for constructing bridges with a skew of ≤ 300 and > 300 while many DOTs limit bridge
skew to 20 or 30 degrees. Additional details are provided in Appendix B. This section provides a
few highlights from the specifications related to box-beam bridges with a skew of ≤ 300.
Use expanded polystyrene blocks to form box-beam voids.
Properly anchor the foam blocks.
Provide drains or weep holes at the lowest point in each box-beam void in the finished
structure. Puncture weep holes immediately after removal from casting bed. Note: Some
states provide a hole at each end of a void, or two holes at each end if the beam is wide.
Rough finish box-beam top surfaces to provide a ¼ inch surface texture unless otherwise
required.
Verify beam seat elevations and install bearing pads. Shim beam bearing pads to minimize
the rocking of girders. The use of a tapered sole plate or a tapered grout pad may be
required so that the bearing surfaces are set level in the longitudinal direction.
Drill position dowel holes into bridge seats through holes provided in each beam end.
Insert dowels. At the expansion bearings, fill position dowel holes with hot-poured rubber-
asphalt type filler to at least 3 inches above the position dowels. Fill the remainder of the
hole with a specified grout. Fill holes at fixed bearings with a specified grout.
Install hardwood wedges between adjacent beams to maintain beam spacing.
Seal the bottom of the longitudinal shear keys with a closed cell polyethylene foam backer
rod. Also, provide gaskets at the post-tensioning duct locations to prevent shear key grout
from flowing into the ducts.
Install transverse ties.
Tension each transverse tie to 5 kips. Note: Some states do not require applying this initial
tension.
Pre-wet all shear key surfaces for a minimum of 24 hours if the surfaces are not protected
using penetrating sealants. Note: When commercial grout is used, the manufacturer
recommendations for surface preparation need to be followed.

44
Clean shear key surfaces with high-pressure water. Note: Some states recommend using oil
free air-blast for cleaning. When commercial grout is used, the manufacturer
recommendations for surface preparation must be followed.
Place non-shrink grout in the longitudinal keyways to form shear keys and rod or vibrate
grout to form a solid, tight shear key. Note: Some states use cement, sand, and water mix
with chemical admixtures while a few others use epoxy and other commercial grouts in
shear keys. When commercial grout is used, the manufacturer’s instructions are strictly to
be followed. Also, exposure conditions at the time of grouting shear keys need to be
considered.
Cure grout for 48 hours. Note: Some states require a minimum of 24 hours of grout curing
before post-tension application. Expected exposure conditions need to be considered when
planning grouting and curing operations.
Apply post-tensioning after grout has attained the minimum required strength.
On shallow members with one row of ties, tension each transverse tie to provide the required force.
On deep members with multiple rows of ties, tension each transverse tie to provide half of the required force. Then, repeat this tensioning sequence once more so that each tie is tensioned to provide the total required force.
Begin with the tendons at each end, and then work symmetrically towards the midspan from each end.
Use galvanized end anchorage hardware.
Grout post-tensioning ducts.
Grout stress pockets.
Place reinforced concrete deck slab with adequate cover to protect steel.
3.3 SURVEY OF TRANSPORTATION AGENCIES AND FABRICATORS
3.3.1 Overview
An online survey was developed and administered using QuestionPro website. The survey was
sent to the 17 states stated previously, the region offices in Wisconsin, and a few
Precast/Prestressed Concrete Institute (PCI) regional managers. Only 10 out of 17 states
responded to the survey (Table 3-10). Since the survey was sent to a selected number of PCI

45
regional managers, Montana, West Virginia, and Wyoming also participated. Therefore, all
together 13 states participated in the survey.
Table 3-10. States Selected and Participated in the Survey
No States Selected for
the Survey States Participated in
the Survey
1 CT - 2 DE Yes 3 IL Yes 4 IN - 5 KY - 6 MA Yes 7 MI Yes 8 MO Yes 9 NH Yes
10 NJ Yes 11 NY - 12 OH Yes 13 PA - 14 RI Yes 15 VA - 16 VT - 17 WI Yes
3.3.2 Survey Results
The survey was attempted by 24 participants. Only 13 completed it while 11 participants provided
answers to a limited number of questions in the survey. The participants represented design,
inspection, fabrication, and some other roles (Table 3-11). The participants were primarily from
the State Departments of Transportation (86.36%) and the precast industry (13.64%).
Table 3-11. Role of the Participant and Participation Percentage
Role of the Participant Percentage with Respect to the
Number of Participants, % Design 63.64 Inspection 18.18 Construction 0 Fabrication 13.64 Other 4.55
3.3.2.1 Wearing Surface
Various wearing surface types have been used on box-beam bridges (Table 3-12). The most
common type is the asphalt wearing surface with a waterproofing membrane. Irrespective of the
wearing surface type, reflective cracking has been documented. However, none of the respondents
has used a cast-in-place slab with a single layer of reinforcing steel and non-shrink concrete.

46
Table 3-12. Wearing Surface Type, Implementation, and Observation of Longitudinal Reflective Cracking
Wearing Surface Type Response,
% Longitudinal reflective Cracking, %
Yes No Box-beams with an asphalt wearing surface 15.38 100.00 Box-beams with a waterproofing membrane and an asphalt wearing surface
34.62 77.78 22.22
Box-beams with a concrete wearing surface 23.08 85.71 14.29 Box-beams with a cast-in-place slab with a single layer of reinforcing steel 23.08 60.00 40.00
Box-beams with a cast-in-place slab with a single layer of reinforcing steel and non-shrink concrete
0.00 - -
Box-beams without a wearing surface 3.85 50.00 50.00
3.3.2.2 Roadway Crown
As shown in Figure 3-6, a roadway crown is formed primarily using two approaches. The most
common practice is to change the girder elevations and place a uniformly thick wearing surface or
a concrete slab (Table 3-13). However, the superstructures built with both approaches show
reflective cracking (Table 3-13).
(a) Girders are placed at the same elevation, and the wearing surface thickness is varied.
(b) Girder elevations are changed, and a constant wearing surface thickness is maintained.
Figure 3-6. The primary approaches for maintaining roadway crown
Table 3-13. Superstructure Cross-Section and Longitudinal Reflective Cracking Potential
An approach for maintaining roadway crown
Response, % Longitudinal reflective Cracking, %
Yes No Girders are placed at the same elevation and the wearing surface thickness is varied.
16.67 66.67 33.33
Girder elevations are changed and a constant wearing surface thickness is maintained.
83.33 80.00 20.00
3.3.2.3 Box-Beam Geometry
The most commonly used section has a single rectangular cavity (section 2 in Table 3-14). The
preference for section 2 and section 3 for future implementation is 60% and 40%, respectively.
The void of the beam is formed with Styrofoam. There is a tendency to float the foam during
fabrications that alters the beam cross-section. One of the challenges noted in the survey is resizing

47
the Styrofoam to fit the space available during fabrication. Box-beam fabrication is a challenge
when non-standard shear keys are used. The survey responses were not consistent on the impact
of using Styrofoam on durability and moisture accumulation within the void. However, as a
common practice, drains are provided at each end of the void.
Table 3-14. The Box-Beam Cross-section, Current Implementation, and Preference for Future Adoption
Box-Beam Section Implementation
within US, % Preference for Future
Adoption, %
Section 1 - -
Section 2 73.33 60.00
Section 3 - 40.00
Section 4 13.33 -
Section 5 13.33 -
3.3.2.4 Shear Key
Five shear key configurations were presented in the survey (Table 3-15). The most commonly
used is the partial-depth shear key. The full-depth grouted, partial-depth shear key has the highest
preference for future implementation. The other preferred types are full-depth (New England)
shear key and full-depth concrete shear key. The maximum space between box-beams at the shear
key bottom ranges from ½ in. to 1½ in. The minimum space between box-beams at the shear key
bottom ranges from 0 in. to 1 ½ in. This indicates that, in certain cases, box-beams are placed next
to each other, and post-tensioning force is allowed to transfer across the sections without
compressing shear keys. The flexible foam formwork is used to hold shear key grout. However,
the formwork is left in place without removing it. There is a potential for moisture accumulation
within shear keys when the formwork is left in place. Only a very few states, such as Michigan,

48
use wooden formwork which is removed at the end of construction. A few other states use wooden
formwork only at the staged construction line; then it is removed at the end of construction.
Table 3-15. Shear Key Configuration, Current Implementation, and Preference for Future Adoption
Shear Key Configuration Implementation
within US, % Preference for
Future Adoption, %
Partial-depth shear key
50.0 -
Full-depth concrete shear key
- 25.0
Full-depth reinforced concrete shear key
- -
Full-depth grouted partial-depth shear key
12.5 50.0
Full-depth shear key
37.5 25.0
3.3.2.5 Shear Key Material
Proprietary material is commonly used to form the shear key (Table 3-16). Pourable grout is the
most preferred (Table 3-17). None of the participants uses beam-shear key interface bond
enhancing material.

49
Table 3-16. Shear Key Material and Current Implementation
Shear Key Material Implementation
within US, % Remarks
Cement mortar (water, cement, fine aggregate) 25.00
Cement mortar with adequate air content 18.75
Cement mortar with adequate air content and shrinkage reducing admixtures
25.00
Concrete -
Concrete with adequate air content and shrinkage reducing admixtures
-
Proprietary material or other, please list 31.25 Epoxy grout; Dayton Superior; Non-shrink grout with minimum compressive strength of 6000 psi.
Table 3-17. Shear Key Material Workability Requirements and Current Implementation
Workability Requirement Implementation within US, % Slump < 4 in. 12.5 4 in. < Slump < 6 in. 12.5 Pourable 75.0
3.3.2.6 Transverse Post-Tensioning
The most common practice is to use prestressing tendons. A rational process is not followed for
calculation of the number of post-tensioning locations and the force. None of the participants has
tried applying post-tensioning in two stages: before placing and after hardening the cast-in-place
concrete slab. One of the challenges for applying two-stage post-tensioning might be the duct
misalignment. Also, no respondents have tried applying post-tensioning through the top and
bottom flanges of the box-beam instead of applying through the rigid diaphragms. The challenges
associated with providing post-tensioning through top and bottom flanges include conflict with
reinforcement and prestressing steel, along with the weight of the beam if flanges are thickened to
accommodate post-tensioning ducts.
3.3.2.7 Suggestions to Eliminate/Minimize Reflective Cracking
Survey participants presented the following suggestions to minimize reflective cracking:
Use transverse post-tensioning.
Apply a stress of about 90 psi on gross cross sectional area.
Use a stronger grout material.
Modify bearing details to prevent rocking under loads.

50
4 IN-SERVICE BRIDGE PERFORMANCE
4.1 OBJECTIVE AND APPROACH
One of the objectives of the work covered in this chapter is to document the adjacent box-beam
bridge performance in the State of Wisconsin. The inspection scope was limited to longitudinal
cracking and its influence on bridge superstructure performance. The inspection was limited to 11
bridges that were built on or after 1983. The bridge performance data was collected by visual
inspection.
The second objective is to evaluate the impact of cast-in-place concrete slab or overlay on bridge
superstrucure durability performance. Considering similar exposure conditions, 17 states were
selected. Even though the best approach for this type of study is to review the inspection forms, it
is not practical due to a large volume of documents and challanges with accessing inspection forms
from several highway agencies. Hence, the bridge condition rating available in the National Bridge
Inventory (NBI) database was used.
4.2 WISCONSIN BRIDGE PERFORMANCE
4.2.1 Selection of Bridges
The Wisconsin Highway Structures Information (HSI) system was used to acquire bridge
inventory and condition data. As discussed in Chapter 3, 169 bridges were identified. The oldest
bridge that is still in service was built in 1954. Until 1982, use of tie-rods was the practice for
transverse connection. In 1983, transverse post-tensioning strands were introduced with a force
of 86.7 kips/duct. Hence, inventory data was grouped as pre-1983 and post-1983. As shown in
Figure 4-1, 116 bridges were built with transverse post-tensioning. The majority of these bridges
are on roads with low traffic. As shown in Table 4-1, 107 bridges are on roads with average daily
traffic (ADT) of less than 1,000. Only 9 bridges carry more than 10,000 vehicles a day.

51
Figure 4-1. Number of bridges vs. year built
Table 4-1. Number of Bridges vs. ADT
Number of Bridges Average Daily Traffic (ADT) 107 ADT ≤ 999 53 999 < ADT ≤ 9,999
9 ADT ≥ 10,000
The NBI rating of deck and superstructure was reviewed and summarized in Table 4-2. The impact
of ADT on bridge deterioration is highlighted with the deck and superstructure condition data
shown in Table 4-2. As an example, 15% of the bridges built during 2000 and 2009 (and with
1000≤ ADT≤9999) have a deck rating of either 4 or 5, while none of the bridges built during that
era with ADT ≤ 999 has such deck ratings. The NBI rating, with respect to ADT, is shown in
Figure 4-2 and Figure 4-3.
The average daily truck traffic (ADTT) volumes were also considered. Out of 169 bridges, 116
bridges appear not to have truck traffic (i.e., 69%) (Table 4-3). The database does not contain
ADTT data for 7 bridges. Hence, only 46 bridges carry measurable truck traffic. Moreover, bridge
performance with respect to the ADTT was evaluated. Unfortunately, due to a limited number of
bridges in each ADTT category, the impact of ADTT on bridge deterioration is inconclusive. The
data is graphically presented in Figure 4-4 and Figure 4-5. Additionally, as presented in literature,
traffic can be a cause for crack propagation rather than initiation. Hence, the bridges carrying a
low volume of traffic are considered for inspection to document longitudinal cracks.
0
5
10
15
20
25
30
35
40
45
50
1950-1959 1960-1969 1970-1982 1983-1989 1990-1999 2000-2009 2010+
Nu
mb
er o
f B
rid
ges
Year Built

52
Table 4-2. Percent of Bridges in Each NBI Rating and ADT Categories
Percent of Bridges in Each NBI Rating Category NBI Deck Rating NBI Superstructure Rating
Year Built ADT Number of Vehicles
4 - 5 6 - 7 8 - 9 4 - 5 6 - 7 8 - 9
1950-1959 ADT ≤ 999 3 0 100 0 67 33 0
1000≤ ADT≤9999 2 50 50 0 50 50 0 ADT 10000 -* - - - - - -
1960-1969 ADT ≤ 999 10 30 60 10 40 50 10
1000≤ ADT≤9999 10 20 50 30 30 50 20 ADT 10000 1 100 - - 0 0 100
1970-1982 ADT ≤ 999 18 22 56 22 17 33 50
1000≤ ADT≤9999 7 29 57 14 43 29 29 ADT 10000 2 0 100 0 0 100 0
1983-1989 ADT ≤ 999 30 10 70 20 13 63 23
1000≤ ADT≤9999 10 30 60 10 0 80 20 ADT 10000 1 0 100 0 0 100 0
1990-1999 ADT ≤ 999 34 0 50 50 0 24 76
1000≤ ADT≤9999 10 20 50 30 0 60 40 ADT 10000 1 0 100 0 0 100 0
2000-2009 ADT ≤ 999 12 0 8 92 0 8 92
1000≤ ADT≤9999 13 15 62 23 0 23 77 ADT 10000 4 0 50 50 0 25 75
2010+ ADT ≤ 999 - - - - - - -
1000≤ ADT≤9999 1 0 0 100 0 0 100 ADT 10000 - - - - - - -
* ‘-’ No bridges are in that ADT category
The deck and superstructure rating is also presented in Figure 4-2 and Figure 4-3.
Figure 4-2. NBI deck rating: number of bridges vs. year built and ADT

53
Figure 4-3. NBI superstructure rating: number of bridges vs. year built and ADT
Table 4-3. Percent of Bridges in Each NBI Rating and ADTT Categories
Percent of Bridges in Each NBI Rating Category NBI Deck Rating NBI Superstructure Rating
Year Built ADT Number
of Bridges 4 - 5 6 - 7 8 - 9 4 - 5 6 - 7 8 - 9
1950-1959 ADTT = 0 5 20 80 0 60 40 0
ADTT ≤ 100 -* - - - - - - ADTT > 100 - - - - - - -
1960-1969 ADTT = 0 17 35 41 24 35 41 24
ADTT ≤ 100 1 0 100 0 100 0 0 ADTT > 100 3 0 100 0 0 100 0
1970-1982 ADTT = 0 24 21 62 17 21 33 46
ADTT ≤ 100 - - - - - - - ADTT > 100 3 33 33 33 33 67 0
1983-1989 ADTT = 0 35 14 66 20 8 66 26
ADTT ≤ 100 - - - - - - - ADTT > 100 6 17 83 0 17 83 0
1990-1999 ADTT = 0 33 6 55 39 0 30 70
ADTT ≤ 100 9 0 33 67 0 22 78 ADTT > 100 3 0 67 33 0 100 0
2000-2009 ADTT = 0 3 67 0 33 0 33 67
ADTT ≤ 100 12 0 33 67 0 17 83 ADTT > 100 8 0 63 37 0 25 75
2010+ ADTT = 0 - - - - - - -
ADTT ≤ 100 1 0 0 100 0 0 100 ADTT > 100 - - - - - - -
* ‘-’ No bridges are in that ADTT category
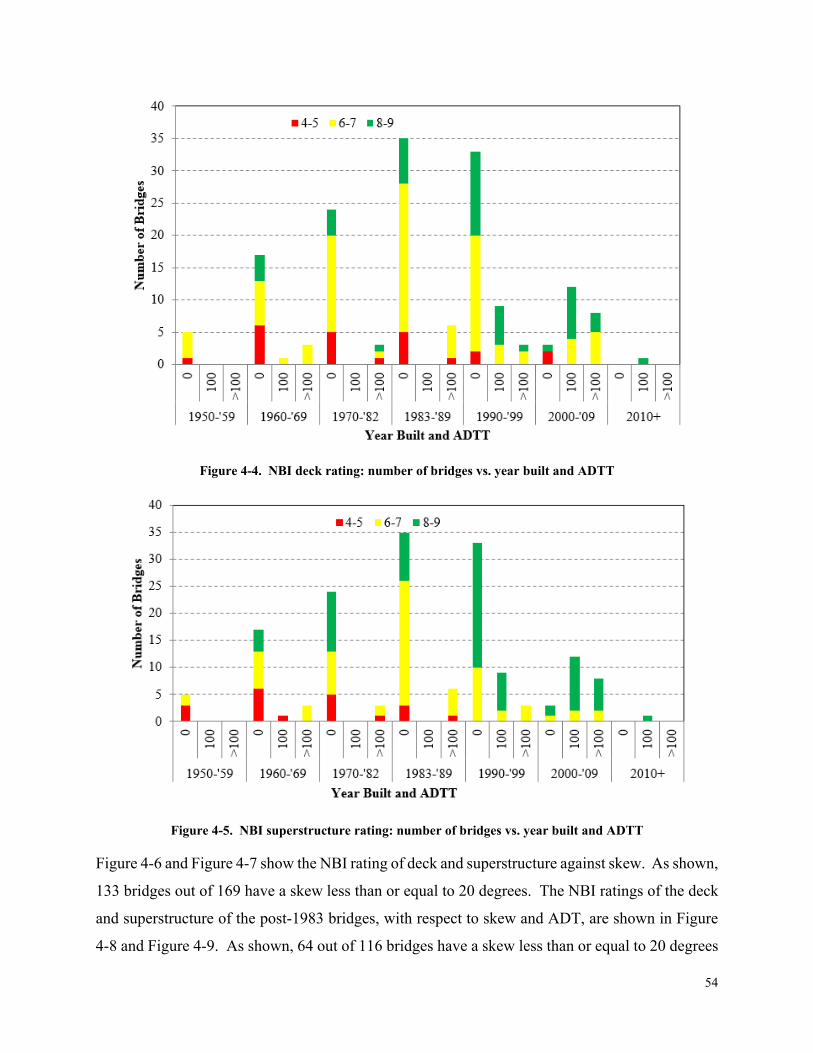
54
Figure 4-4. NBI deck rating: number of bridges vs. year built and ADTT
Figure 4-5. NBI superstructure rating: number of bridges vs. year built and ADTT
Figure 4-6 and Figure 4-7 show the NBI rating of deck and superstructure against skew. As shown,
133 bridges out of 169 have a skew less than or equal to 20 degrees. The NBI ratings of the deck
and superstructure of the post-1983 bridges, with respect to skew and ADT, are shown in Figure
4-8 and Figure 4-9. As shown, 64 out of 116 bridges have a skew less than or equal to 20 degrees

55
and carry less than 1,000 ADT. In order to eliminate the impact of traffic on reflective crack
propagation and complexities arising from skew, only the bridges with a skew up to 20 degrees
and ADT less than 1,000 are considered for selecting a pool of 10 bridges for inspection.
Figure 4-6. NBI deck rating: number of bridges vs. skew
Figure 4-7. NBI superstructure rating: number of bridges vs. skew

56
Figure 4-8. NBI deck rating: number of bridges (post-1983) vs. skew and ADT
Figure 4-9. NBI superstructure rating: number of bridges (post-1983) vs. skew and ADT
Among the 64 post-1983 bridges with a skew up to 20 degrees and ADT less than 1,000, one
bridge was built in 2013. Hence, that bridge was also eliminated, and the remaining 63 bridges
were selected for further analysis. Table 4-4 shows the number of bridges constructed at various
time periods and the associated numbers identified for field inspection. With this process, 10
bridges were identified for inspection. An additional bridge, which was constructed in 2008 with
a 6 in. thick cast-in-place deck, was included as the 11th bridge based on feedback from the research
project oversight committee members (Table 4-5). While inventory data is presented in Table 4-5,

57
the NBI condition rating and the inspection date are given in Table 4-6. As shown in Table 4-6,
the condition rating of bridges ranges from 6 to 9.
Table 4-4. Number of Post-1983 Bridges with Skew ≤ 20 Deg. and ADT <1,000 and the Numbers Selected for Inspection
Period Number of bridges with
skew ≤ 20 deg., and ADT < 1,000 Number of bridges selected for
inspection 2000 – 2010 11 2 1990-1999 28 4 1983-1989 24 4
Table 4-5. Inventory Data of Selected Bridges for Inspection
Bridge ID Year Built
Feature Intersected Facility Carried SpansMax
Span (ft)Length
(ft) Skew (Deg.)
Deck Width (ft)
ADT
B440198 2008 Embarrass River STH 76 3 61 185 0 41 1100
B290135 2005 Sprague Mather
Flowage Speedway Road 1 24 24 0 25 100
B290133 2005 Little Yellow River 25th Street West 1 34 34 20 25 100
B370257 1992 Plover River Esker Road 1 48 48 0 25 40
B290091 1991 Little Yellow River 11th Street 1 30 30 0 25 20
B290096 1991 Rynears Flowage 20th Street West 1 30 30 0 25 100
B370134 1990 Spring Brook School Road 1 34 34 20 25 50
B050282 1989 BR Kewaunee River County Line Road 1 50 50 0 25 100
B200094 1987 W Branch of
Milwaukee River River Drive 1 48 48 10 25 100
B360127 1985 E Twin River Zander Road 2 30 60 20 29 140
B360125 1985 Danmar Road Branch River 2 44 88 15 34 110
Table 4-6. NBI Condition Rating of the Bridges
Bridge ID Year Built
Spans Max
Span (ft) Length
(ft) Skew(Deg.)
Deck Width (ft)
ADTNBI Rating NBI Inspection
Date Deck Superstructure
B440198 2008 3 61 185 0 41 1100 8 8 08/01/2012 B290135 2005 1 24 24 0 25 100 9 9 06/12/2012 B290133 2005 1 34 34 20 25 100 9 9 12/06/2012
B370257 1992 1 48 48 0 25 40 7 7 10/19/2012 B290091 1991 1 30 30 0 25 20 8 8 05/12/2012 B290096 1991 1 30 30 0 25 100 8 8 12/06/2012 B370134 1990 1 34 34 20 25 50 7 7 09/01/2012
B050282 1989 1 50 50 0 25 100 7 8 10/15/2012 B200094 1987 1 48 48 10 25 100 7 7 10/29/2012 B360127 1985 2 30 60 20 29 140 6 6 11/26/2012 B360125 1985 2 44 88 15 34 110 7 7 11/14/2012

58
4.2.2 Bridge Inspection Summary and Conclusions
The bridges were inspected during the first week of October 2013. During the 3-day inspection
period, a 50% - 70% chance of rain was predicted. There was no need for spraying water on the
deck since all bridge sites received some rain. Moist deck conditions exposed reflective
longitudinal cracks. Due to water levels rising under some of the bridges, it was not possible to
document the condition of shear keys on a couple of bridges.
Bridge design details and field observations of each bridge are presented in Appendix E. The
following are the summaries and conclusions derived from field observations:
1. Irrespective of the age or the design changes, reflective cracking was documented on all
the bridge decks (Figure 4-10). Where full-length reflective cracking was not present,
short-length cracks directly over the piers or abutments and above the shear keys were
documented. This observation verifies that the reflective cracking initiates over the
supports (piers and abutments) and develops to full-length cracks under live loads. Table
4-7 summarizes the inspection data in terms of reflective deck cracking and moisture and
efflorescence documented at the shear keys.
(a) Full-length reflective cracks
(b) A short crack over the abutment and above a
shear key
Figure 4-10. Reflective deck cracking

59
Table 4-7. Summary of Inspection Data Related to Reflective Cracking and Shear Key Condition
Bridge ID Year Built
Feature Intersected Facility Carried Reflective Cracking
Moist Shear Keys
Efflorescence
B440198 2008 Embarrass River STH 76 Yes No No
B290135 2005 Sprague Mather
Flowage Speedway Road Yes Yes No
B290133 2005 Little Yellow River 25th Street West Yes -* -
B370257 1992 Plover River Esker Road Yes Yes Yes
B290091 1991 Little Yellow River 11th Street Yes Yes No
B290096 1991 Rynears Flowage 20th Street West Yes - -
B370134 1990 Spring Brook School Road Yes Yes Yes
B050282 1989 BR Kewaunee River County Line Road Yes Yes Yes
B200094 1987 W Branch of
Milwaukee River River Drive Yes Yes Yes
B360127 1985 E Twin River Zander Road Yes Yes Yes
B360125 1985 Danmar Road Branch River Yes Yes Yes
* Beam soffits were not inspected.
2. Two different fascia beam geometries have been used since 1983. In one case, a curb is
integrated into the beam geometry (Figure 4-11a). The most recent design incorporates a
solid block with reinforcement detail to attach bridge railings (Figure 4-11b). Irrespective
of these changes, transverse cracking was documented on the fascia beams.

60
(i) Fascia beam detail
(ii) Transverse cracks over the curb
(a) Fascia beam with an integral curb
(i) Fascia beam detail
(ii) Transverse cracks over the fascia beam (b) Fascia beam without an integral curb but with a solid block
Figure 4-11. Fascia beam detail and transverse cracks
3. The current bridge superstructure configuration permits surface water laced with deicing
salts to drain over the fascia beam and into the stress pockets (Figure 4-12).
Figure 4-12. A stress pocket exposed to surface water

61
4. In some bridges, the construction joint of the deck overlay was placed directly over the
shear key located at the bridge centerline (Figure 4-13). This joint has not been sealed.
Hence, the surface water can seep through this joint moistening the shear key and the
beams.
(a) The deck overlay construction joint
(b) Close-up view of the construction joint
Figure 4-13. The deck overlay construction joint
5. As shown below, the flood level had reached the superstructure of one of the inspected
bridges. As a result, flood water percolated through the drains at the beam soffit. The
efflorescence at the drains is an indication of the amount of water trapped inside the boxes
(Figure 4-14).
(a) Indication of flood water level
(b) Drains with moisture and efflorescence
Figure 4-14. Flood water trapped inside boxes

62
4.3 IMPACT OF CAST-IN-PLACE CONCRETE SLAB AND OVERLAY ON SUPERSTRUCTURE DURABILITY
Different bridge deck protection systems are used to enhance bridge durability (Russell 2012). In
adjacent box-beam bridges, the superstructure is protected with a 5 to 6 in. thick cast-in-place
concrete slab, rigid overlay, or a flexible overlay with a waterproofing membrane. Use of a cast-
in-place concrete slab requires a minimum of 7-day moist curing. Installation of overlays may
take from 1 to 3 days depending on the overlay type (Krauss et al. 2009). Typically, cast-in-place
concrete slabs are used on high-volume road or freeway bridges while overlays are used on low-
volume roads. According to the Recording and Coding Guide for the Structure Inventory and
Appraisal of the Nation’s Bridges (FHWA 1995), a bridge superstructure with a rating of 7 is in
good condition, and a rating of 6 indicates a satisfactory condition. Generally, a bridge
superstructure is recommended to be replaced when it is rated at 4 or below. Hence, a service life
of a bridge superstructure can be considered as the time it takes to reach the NBI rating of 4 from
the year built. In other words, the time it takes for a bridge superstructure to reach a predefined
NBI rating can be used as a service life indicator. In this study, the time it takes from year built
until the deck superstructure is assigned a rating of 6 or 7 is defined as the service life to avoid the
impact of any repairs on bridge durability performance.
4.3.1 Deck and Wearing Surface Types
According to FHWA (1995), deck structure types applicable for box-beam bridges are concrete
cast-in-place (Code 1) and concrete precast panels (Code 2). Code 1 is used when a 5 to 6 in. thick
cast-in-place concrete slab is placed on top of the box-beams. This is typical for bridges that are
on freeways or highways with high ADT. For low-volume roads, box-beam top surface is used
with or without a wearing surface. Then, code 2 is used to represent the deck structure type and is
referred to as concrete precast panels. Ten (10) different wearing surface types are listed in FHWA
(1995). The coding ranges from 0 to 9. Only codes 0 to 6 and 9 are applicable for box-beams.
Column 1 and 2 of Table 4-8 present deck structure types, wearing surface types, and the associated
codes. Column 3 of the same table lists the most commonly used combinations of deck structure
and wearing surface types. The numbers shown within brackets represent the relevant codes.

63
Table 4-8. Deck Structure Type, Wearing Surface Type, and the Most Common Deck Structure and Wearing Surface Type Combinations for Adjacent Box-Beam Bridges
Deck structure type Wearing surface type Mostly commonly used deck structure and wearing surface
combinations Code Description Code Description
1 Concrete Cast-in-Place
1 Monolithic Concrete (concurrently placed with structural deck)
Concrete cast-in-place (1) Monolithic (1)
2 Concrete Precast Panels
2 Integral Concrete (separate non-modified layer of concrete added to structural deck)
Concrete Precast Panels (2) Monolithic (1)
3 Latex Concrete or Similar Additive
Concrete Precast Panels (2) Integral(2)
4 Low Slump Concrete
Concrete Precast Panels (2) Bituminous (6)
5 Epoxy Overlay
Concrete Precast Panels(2) None(0)
6 Bituminous
9 Other
0
None (no additional concrete thickness or wearing surface included in the deck)
4.3.2 Durability Performance Analysis
Following the approach discussed in Chapter 3, 17 states with side-by-side box-beam bridges, and
the exposure conditions similar to the State of Wisconsin, are selected. The NBI database of year
2014 is used for this purpose (NBI 2014). Table 4-9 shows the total number of box-beam bridges
in each state. Table 4-10 presents the total number of box-beam bridges under each combination.
The last category (“Other”) includes all the box-beam bridges with deck structure and wearing
surface type combinations that do not belong to the combinations listed in Table 4-10. According
to the data shown in Table 4-10, cast-in-place concrete slabs with monolithic concrete wearing
surface and bituminous overlay on box-beams are the most common combinations. For further
analysis, the states with more than 30 bridges with these two combinations are selected.

64
Table 4-9. Total Number of Box-Beam Bridges in Each State (NBI 2014)
State Total number of Box
Beam Bridges Connecticut 286 Delaware 108 Illinois 8796 Indiana 4465
Kentucky 3531 Massachusetts 175
Michigan 2480 Montana 11
New Hampshire 41 New Jersey 528 New York 1939
Ohio 6892 Pennsylvania 3332 Rhode Island 67
Virginia 310 Vermont 27
Wisconsin 88 Total 33,076
Table 4-10. Box-Beam Bridges with Deck Structure and Wearing Surface Types
Combination of Deck Structure and Wearing Surface Type
CT DE IL IN KY MA MI NH MO NJ NY OH PA RI VA VT WI
Concrete cast-in-place, Monolithic
- 32 - 609 596 5 656 - 1 299 117 146 1341 5 12 2 40
Concrete Precast Panels, Bituminous
5 31 3192 2665 853 125 944 8 - 67 1 - 22 37 78 14 1
Concrete Precast Panels, None
- - 3371 107 226 - 28 2 - 1 - - - - 1 5 4
Concrete Precast Panels, Monolithic
- - 1 457 1315 5 62 - - 2 - - 4 - 1 - 1
Concrete Precast Panels, Integral
- - 247 181 43 1 38 1 - - 2 - - - - 1 1
Other 281 45 1985 446 498 39 752 30 10 159 1819 6746 1965 25 218 5 41
The durability performance of bridge superstructures with (1) cast-in-place concrete deck and
monolithic wearing surface types and (2) precast panel deck structure and bituminous wearing
surface types are evaluated. The other parameters considered in the analysis include ADT, bridge
superstructure age, and bridge superstructure condition rating. ADT is divided into three ranges:
ADT ≤ 1,000; 1,000 < ADT ≤ 10,000; and ADT > 10,000. The year of bridge reconstruction is
also taken into consideration when calculating the service life (age) of a bridge superstructure.
The year reconstructed is used as the year built for the analysis of reconstructed bridges. The

65
superstructure age is categorized into four ranges: 0-10, 11-20, 21-30 and greater than 30 years.
The condition rating defined in the NBI is used, and the ranges are defined as greater than 7 (very
good to excellent), 6 and 7 (satisfactory to good), and less than 6 (failed to fair).
4.3.2.1 Superstructure with a Cast-in-place Concrete Deck and a Monolithic Wearing Surface
The total number of bridges with a cast-in-place concrete deck and a monolithic wearing surface
is 3836. Out of 3836 bridges, 52% (1992), 36% (1382), and 12% (462) carry ADT ≤ 1,000; 1000
< ADT ≤ 10,000; and ADT > 10,000 respectively. Table 4-11 shows the analysis results.
Table 4-11a presents analysis results of 1992 bridges with ADT ≤ 1,000. The following
conclusions can be derived from the results:
A total of 777 (39%) are in very good to excellent, 1039 (52.2%) are in satisfactory to
good, and 176 (8.8%) are in failed to fair condition.
37.5% (i.e., 747 out of 1992) of these bridges have been in service for more than 20 years
and have maintained a condition rating of more than or equal to 6.
14.2% (i.e., 282 out of 1992) of these bridges have been in service for more than 30 years
and have maintained a condition rating of more than or equal to 6.
5.1% (i.e., 101 out of 1992) of these bridges have been in service for more than 30 years
with a condition rating less than 6.
Table 4-11b presents analysis results of 1382 bridges with 1000 < ADT ≤ 10,000. The following
conclusions can be derived from the results:
A total of 527 (38.1%) are in very good to excellent, 724 (52.4%) are in satisfactory to
good, and 131 (9.5%) are in failed to fair condition.
35.6% (i.e., 493 out of 1382) of these bridges have been in service for more than 20 years
and have maintained a condition rating of more than or equal to 6.
11.5% (i.e., 160 out of 1382) of these bridges have been in service for more than 30 years
and have maintained a condition rating of more than or equal to 6.
4.6% (i.e., 64 out of 1382) of these bridges have been in service for more than 30 years
with a condition rating less than 6.

66
Table 4-11c presents analysis results of 462 bridges with ADT > 10,000. The following
conclusions can be derived from the results:
A total of 153 (33.1%) are in very good to excellent, 253 (54.8%) are in satisfactory to
good, and 56 (12.1%) are in failed to fair condition.
30.5% (i.e., 141 out of 462) of these bridges have been in service for more than 20 years
and have maintained a condition rating of more than or equal to 6.
6.2% (i.e., 29 out of 462) of these bridges have been in service for more than 30 years and
have maintained a condition rating of more than or equal to 6.
5.6% (i.e., 26 out of 462) of these bridges have been in service for more than 30 years with
a condition rating less than 6.
Table 4-11. Durability Performance of Bridge Superstructures with a Cast-in-Place Deck and a Monolithic Wearing Surface
(a) ADT ≤ 1,000
Age (Years)
Condition Rating >7 Condition Rating 6 and 7 Condition Rating <6 Number of
Bridges Percentage
(%) Number of
Bridges Percentage
(%) Number of
Bridges Percentage
(%) < 10 413 20.7 129 6.5 36 1.8
11-20 228 11.4 299 15.0 13 0.7 21-30 108 5.4 357 17.9 26 1.3 > 30 28 1.4 254 12.8 101 5.1 Total 777 39.0 1039 52.2 176 8.8
(b) 1,000 < ADT ≤ 10,000
Age (Years)
Condition Rating >7 Condition Rating 6 and 7 Condition Rating <6 Number of
Bridges Percentage
(%) Number of
Bridges Percentage
(%) Number of
Bridges Percentage
(%) < 10 281 20.3 95 6.9 19 1.4
11-20 157 11.4 225 16.3 21 1.5 21-30 76 5.5 257 18.6 27 2.0 > 30 13 0.9 147 10.6 64 4.6 Total 527 38.1 724 52.4 131 9.5
(c) ADT > 10,000
Age (Years)
Condition Rating >7 Condition Rating 6 and 7 Condition Rating <6
Number of Bridges
Percentage (%)
Number of Bridges
Percentage (%)
Number of Bridges
Percentage (%)
< 10 89 19.3 35 7.6 4 0.9 11-20 50 10.8 91 19.7 13 2.8 21-30 12 2.6 100 21.6 13 2.8 > 30 2 0.4 27 5.8 26 5.6 Total 153 33.1 253 54.8 56 12.1

67
4.3.2.2 Superstructure with a Bituminous Wearing Surface
The total number of bridges with a bituminous wearing surface is 7991. Out of 7991 bridges,
80.5% (6430), 17.5% (1398), and 2% (163) carry ADT ≤ 1,000; 1000 < ADT ≤ 10,000; and ADT
> 10,000 respectively. Table 4-12 shows the analysis results.
Table 4-12a presents analysis results of 6430 bridges with ADT ≤ 1,000. The following
conclusions can be derived from the results:
A total of 1921 (29.9%) are in very good to excellent, 3757 (58.4%) are in satisfactory to
good, and 752 (11.7%) are in failed to fair condition.
57.5% (i.e., 3698 out of 6430) of these bridges have been in service for more than 20 years
and have maintained a condition rating of more than or equal to 6.
31.1% (i.e., 2003 out of 6430) of these bridges have been in service for more than 30 years
and have maintained a condition rating of more than or equal to 6.
9.3% (i.e., 597 out of 6430) of these bridges have been in service for more than 30 years
with a condition rating less than 6.
Table 4-12b presents analysis results of 1398 bridges with 1000 < ADT ≤ 10,000. The following
conclusions can be derived from the results:
A total of 274 (19.6%) are in very good to excellent, 764 (54.6%) are in satisfactory to
good, and 360 (25.8%) are in failed to fair condition.
53.7% (i.e., 751 out of 1398) of these bridges have been in service for more than 20 years
and have maintained a condition rating of more than or equal to 6.
33.3% (i.e., 465 out of 1398) of these bridges have been in service for more than 30 years
and have maintained a condition rating of more than or equal to 6.
20.2% (i.e., 282 out of 1398) of these bridges have been in service for more than 30 years
with a condition rating less than 6.
Table 4-12c presents analysis results of 163 bridges with ADT > 10,000. The following
conclusions can be derived from the results:
A total of 23 (14.1%) are in very good to excellent, 79 (48.5%) are in satisfactory to good,
and 61 (37.4%) are in failed to fair condition.

68
37.5% (i.e., 61 out of 163) of these bridges have been in service for more than 20 years and
have maintained a condition rating of more than or equal to 6.
23.4% (i.e., 38 out of 163) of these bridges have been in service for more than 30 years and
have maintained a condition rating of more than or equal to 6.
31.9% (i.e., 52 out of 163) of these bridges have been in service for more than 30 years
with a condition rating less than 6.
Table 4-12. Durability Performance of Bridge Superstructures with a Bituminous Wearing Surface
(a) ADT ≤ 1,000
Age (Years)
Condition Rating >7 Condition Rating 6 and 7 Condition Rating <6 Number of
Bridges Percentage
(%) Number of
Bridges Percentage
(%) Number of
Bridges Percentage
(%) 0-10 500 7.8 165 2.6 7 0.1
11-20 623 9.7 692 10.8 29 0.5 21-30 610 9.5 1085 16.9 119 1.9 >30 188 2.9 1815 28.2 597 9.3
Total 1921 29.9 3757 58.4 752 11.7
(b) 1,000 < ADT ≤ 10,000 Condition Rating >7 Condition Rating 6 and 7 Condition Rating <6
Age (Years)
Number of Bridges
Percentage (%)
Number of Bridges
Percentage (%)
Number of Bridges
Percentage (%)
0-10 82 5.9 27 1.9 3 0.2 11-20 67 4.8 111 7.9 11 0.8 21-30 76 5.4 210 15.0 64 4.6 >30 49 3.5 416 29.8 282 20.2
Total 274 19.6 764 54.6 360 25.8
(c) ADT > 10,000 Condition Rating >7 Condition Rating 6 and 7 Condition Rating <6
Age (Years)
Number of Bridges
Percentage (%)
Number of Bridges
Percentage (%)
Number of Bridges
Percentage (%)
0-10 10 6.1 7 4.3 - - 11-20 8 4.9 16 9.8 3 1.8 21-30 1 0.6 22 13.5 6 3.7 >30 4 2.5 34 20.9 52 31.9
Total 23 14.1 79 48.5 61 37.4
4.3.2.3 Performance Comparison
Durability performance of bridge superstructures with (1) a cast-in-place concrete deck and a
monolithic wearing surface, and (2) box-beams and a bituminous wearing surface is compared.
As shown in Figure 4-15, when a cast-in-place concrete deck with a monolithic wearing surface is
used, the number of bridge superstructures in service for more than 30 years drops drastically.
Performance during first 30 years is not affected by the traffic volume. However, rate of

69
deterioration beyond 30 years is greatly affected by the traffic volume. As shown in Figure 4-16,
irrespective of the age or the traffic volume, very few bridge superstructures remain in service
once reaching a condition rating of less than 6. This is primarily due to a drastic increase in rate
of deterioration after the condition rating drops below 6.
In contrast, a large percentage of bridge superstructures with a bituminous wearing surface have
been in service for more than 30 years (Figure 4-17). Similar to the performance of superstructures
with a cast-in-place deck and a monolithic wearing surface, the rate of deterioration of
superstructures with a bituminous wearing surface increases with the traffic volume (Figure 4-18).
As shown in Figure 4-17 and Figure 4-18, a majority of the superstructures with a bituminous
wearing surface and a service life of more than 30 years has a condition rating of 6 or greater.
Figure 4-15. Percent of superstructures with a cast-in-place deck and a monolithic wearing surface against
age and ADT (Condition Rating 6)

70
Figure 4-16. Percent of superstructures with a cast-in-place deck and a monolithic wearing surface against
age and ADT (Condition Rating < 6)
Figure 4-17. Percent of superstructures with a bituminous wearing surface against age and ADT (Condition
Rating 6)

71
Figure 4-18. Percent of superstructures with a bituminous wearing surface against age and ADT (Condition
Rating < 6)
4.3.3 Bridge Durability Performance Evaluation Summary, Conclusions, and Recommendations
The 2014 NBI data is used for evaluating the impact of deck structure and wearing surface types
on bridge superstructure durability performance. Data for 17 different states was selected.
Typically, waterproofing membranes are used with bituminous wearing surfaces. Due to lack of
data, the impact of various waterproofing membranes on durability is not investigated during this
study. Based on the analysis results the following conclusions can be derived:
1) Box-beam bridge superstructures with cast-in-place decks and monolithic wearing surfaces
show better performance during the first 20 years in service.
2) A large number of box-beam bridge superstructures with bituminous wearing surfaces have
been in service for more than 30 years with a superstructure condition rating of 6 or greater.
3) There is a possibility of using a bituminous wearing surface on box-beams to develop
durable bridges when ADT ≤ 10,000.
After evaluating the impact of deck structure and wearing surface types on bridge superstructure
durability performance, and looking at the national and international practices, it is recommended
to consider using a multi-layer bridge deck protective system for improving durability of bridge
decks. As an example, the Ministry of Transportation Ontario uses a multi-layer protective system
(Lai 2008); Massachusetts DOT places a wearing surface with a waterproofing membrane on top

72
of concrete deck structures (MassDOT 2017); and some countries in Europe use a multi-layer
bridge deck protective system (as shown in Figure 4-19) (Attanayake et al. 2002). Use of an
exposed deck or a wearing surface depends on the current highway agency policies. In order to
propose amendments to current policies, a comprehensive study needs to be conducted with a
statistically meaningful data set that evaluates the effectiveness of various bridge deck preservation
policies and strategies implemented by the highway agencies.
Figure 4-19. Bridge deck protective system used in the Europe (Attanayake et al. 2002)

73
5 PERFORMANCE EVALUATION OF NEWLY CONSTRUCTED BRIDGES
5.1 OBJECTIVE AND APPROACH
Chapter 2 and 3 of this report document the details and construction practices implemented by
various highway agencies for minimizing reflective deck cracking on adjacent box-beam bridges.
Chapter 3 also includes a summary of the responses received from a selected number of highway
agencies for a survey conducted as part of this study. A representative sample of in-service box-
beam bridges in Wisconsin was inspected, and the findings are documented in Chapter 4. Based
on the outcome of the efforts described in Chapters 2, 3, and 4, a list of best practices was
developed. In 2016, WisDOT built three adjacent box-beam bridges and incorporated a limited
number of recommendations.
This chapter presents (a) the list of best practices documented through the efforts documented in
Chapter 2, 3, and 4, (b) details and practices implemented in three recently constructed bridges,
(c) performance of bridge decks documented during the field visits that were conducted following
construction, and (d) structural response to shrinkage and thermal gradient loads. The inspection
scope was limited to visual inspection and evaluating bridge performance in terms of longitudinal
deck cracking.
5.2 DESIGN AND CONSTRUCTION RECOMMENDATIONS
This section presents a list of best practices identified through the efforts documented in Chapter
2, 3, and 4.
5.2.1 Box-Beam Section
The box-beam with rectangular voids is the standard used by the state DOTs. Compared
to the sections used in other countries, the box-beam with rectangular voids has the least
dead load per unit length. Further, fabricators are familiar with this cross-section, and the
formwork is readily available. Hence, the use of box-beams with rectangular voids
minimizes the impact on the fabrication process.
The use of a full-depth shear keys allows adequate confinement to prevent grout spall even
if the shear key material is debonded from the beam.

74
Inspection of the interior condition of the voids is a challenge during routine inspection.
Irrespective of the material used to form the voids, historical records have shown that the
deterioration starts from the interior of the voids. Providing two drain holes at each end of
a void minimizes moisture accumulation and helps inspection of the interior.
5.2.2 Shear Key Grout
Cementitious grout with expansive or non-shrink properties is often recommended in
precast construction due to assumed material compatibility. Surface preparation is
important and critical for effective bonding between the grout and box-beam. Some state
DOTs use approved commercial grouts instead of traditional mortar due to non-shrink and
strong bond properties.
Use of a cementitious grout with non-shrink properties and adequate bond strength that
develops at least 3,000 psi compressive strength before transverse post-tension application
is desired. The grout strength needs to reach at least 5,000 psi by the time the cast-in-place
concrete slab is poured or an overlay is placed to form adequately stiff connections for load
transfer.
5.2.3 Cast-in-Place Concrete Slab or Wearing Surface
Chapter 4 presents the durability performance of box-beam bridge superstructures with an exposed
deck slab or a bituminous wearing surface with a waterproofing membrane. The practice is
governed by the policies of a highway agency. In order to propose amendments to current policies,
a comprehensive study needs to be conducted with a statistically meaningful data set by evaluating
the effectiveness of various bridge deck preservation policies and strategies implemented by the
highway agencies. Until such amendments are developed, the following practices are proposed:
Use of an asphalt wearing surface with a waterproofing membrane has contributed to
maintaining adjacent box-beam bridges in good or satisfactory condition over 30 years.
With a cost effective life-cycle treatment plan, the service life can be extended. With a
proven performance record, other wearing surface types can be used on box-beam bridge
decks.

75
Irrespective of the type of wearing surface used on bridge decks, the longitudinal
construction joint needs to be offset a minimum of 1.5 ft but not greater than 2 ft from the
closest shear key.
5.2.4 Transverse Post-Tensioning
The shear keys that are located longitudinally in between the diaphragms are not compressed when
post-tensioning is applied through the diaphragms, even under increased post-tensioning.
Developing recommendations for revising post-tension details and procedures or alternative
connection details requires additional research. Hence, the use of adequate post-tensioning at least
for maintaining structural redundancy is recommended.
Wisconsin DOT standard detail specifies placing girder end dowel bars and grouting after post-
tension application. This construction sequence is encouraged because it allows compressing shear
key grout over the abutments and piers, and avoids post-tension force transfer to the substructure.
5.2.5 Construction Process
Properly anchored expanded polystyrene blocks shall be used to form box-beam voids.
Voids shall be vented and drained by casting two, one-inch diameter tubes at the bottom
edges of the corner fillets. Puncture the holes immediately after removal from casting bed.
When extending stirrups for shear connection to slab, consider a bent shape of bar in
relation to placement of foam blocks.
Two, 2 in. diameter dowel holes shall be provided at each beam end.
Box-beam top surfaces shall be rough finished to provide a ¼ inch surface texture unless
otherwise required.
The longitudinal keyway surfaces shall be sandblasted immediately before shipping.
Beam seats shall be sloped to match the roadway crown.
Beam seats shall be sloped parallel to grade line if the grade at the bridge is greater than
1%. Elevations shall be placed on plans to meet these requirements. Beam bearing pads
shall be shimmed to minimize rocking of girders. The bearing surfaces shall be set level
in the longitudinal direction.

76
Beams shall be erected. When differential camber occurs, beams shall be forced together,
or a smooth transition shall be provided with joint grout material.
Hardwood wedges shall be installed between adjacent beams to maintain beam spacing.
Gaskets shall be provided at the post-tensioning duct locations to prevent shear key grout
flowing into the ducts. The gasket shall be sponge neoprene of 2 ¾ in. minimum thickness.
A transition between changing slopes of post-tensioning ducts shall be provided by either
a circular or parabolic curve with a minimum length of 3 ft.
The transverse ties shall be installed. The position of the hardwood wedges shall be
verified.
All shear key surfaces shall be prewetted for a minimum of 24 hours if the surfaces are not
protected using penetrating sealants. Note: When commercial grout is used, the
manufacturer’s recommendations for surface preparation shall be followed.
Shear key surfaces shall be cleaned with high-pressure water or oil free air-blast. Note:
When commercial grout is used, the manufacturer’s recommendations for surface
preparation shall be followed.
A Polyethylene closed cell backer rod shall be installed at shear key locations.
Transverse ties shall be post-tensioned to approximately 5,000 lbs to remove sag in the tie
and to seat the chuck.
Shear keys shall be grouted with a non-shrink cementitious grout with adequate bond
strength and a compressive strength of at least 3,000 psi. Grout shall be rodded or vibrated
to form a solid, tight shear key. Note: When commercial grout is used, the manufacturer’s
instructions shall strictly be followed. Also, exposure conditions at the time of grouting
shear keys shall be considered.
Proper curing shall be provided for the grout. Note: When commercial grout is used, the
manufacturer’s recommendations shall be followed.
Wedges shall be removed before post-tension application.
Post-tensioning shall be applied to compress box-beam and shear key assembly.
Galvanized end anchorage hardware shall be used.
On shallow members with one row of ties along the depth, each transverse tie shall be
tensioned to provide the required force.

77
On deep members with multiple rows of ties along the depth, each transverse tie shall be
tensioned to provide half of the required force. This tensioning sequence shall be repeated
once more so that each tie is tensioned to provide the total required force.
Tensioning shall begin with the tendons at each end and then work symmetrically towards
the midspan from each end.
Post-tensioning ducts shall be pressure grouted from one grout pipe until all entrapped air
is expelled and grout begins to flow from the open grout pipe. The open grout pipe shall
be closed and a pressure of 50 psi maintained for 15 seconds.
Holes shall be drilled in piers and abutments for dowels. For expansion joints, hot-poured
rubber-asphalt type shall be used to fill up to 3 in. in the dowel holes. The remainder of
the hole shall be filled with non-shrink grout. For fixed joints, the entire hole shall be filled
with non-shrink grout.
The stress pockets shall be filled with chloride free non-shrink grout after post-tensioning.
An approved wearing surface type shall be installed. Note: The grout strength shall reach
at least 5,000 psi by the time the wearing surface is installed to form adequately stiff
connections.
Longitudinal construction joints shall be offset a minimum of 1.5 ft, but not greater than 2
ft from the closest shear key.
5.3 WISCONSIN-47 OVER LOST CREEK (B-26-40)
Wisconsin bridge B-26-40 that carries Wisconsin-47 over Lost Creek is located in the town of
Sherman in Iron County, Wisconsin (Figure 5-1), just southeast of the unincorporated community
of Manitowish. This single span, straight bridge is aligned in the east-west direction and carries
an average daily traffic volume of less than 1,100 vehicles. After demolition of the existing bridge,
the new bridge was constructed at the same alignment in September 2016.

78
(a) Bridge location on a map (b) Arial view of bridge
Figure 5-1. Bridge location (Source: Google Maps)
A new superstructure with two 12 ft wide traffic lanes and two 5 ft shoulders was constructed
using nine 4-ft wide 17 inch deep prestressed concrete box-beams and a 6-in. thick cast-in-place
concrete deck slab with a minimum specified 28-day strength of 4000 psi. Girders are positioned
at different elevations to form a road crown. Bridge span and width are 35 ft and 37.5 ft
respectively. The bridge superstructure is transversely post-tensioned over the abutments, and at
quarter-points and mid-span. The specified post-tensioning force is 86.7 kips per duct (about 12.38
kip/ft), and applied at the mid-depth of the beam through the diaphragms. Full-depth grouted shear
keys are used. Post-tensioning was applied after the grout had cured 2 days and had attained a
compressive strength of 3,000 psi. Structural details of the bridge and relevant sections of the
project special provisions are presented in Appendix F. As per the structural details and the project
special provisions, a majority of design and construction recommendations listed in section 5.2 of
this report is implemented. However, the cast-in-place slab and end diaphragms used a typical
concrete mix. Table 5-1 shows the concrete mix design, fresh and hardened concrete properties,
and ambient temperature at the time of concrete placement. Shear keys were formed with BASF
MasterFlow® 928 of which the properties are in compliance with the project special provisions.
The technical data sheet of the grout is provided in Appendix F.

79
Table 5-1. Cast-in-Place Concrete Slab - Mix Design and Fresh Properties
Material Quantity Course Aggregate 1.5 in. (with 0.75% moisture) 7600.00 lb Course Aggregate 0.75 in. (with 0.75% moisture) 9000.00 lb Washed Sand (with 2.78% moisture) 11,780.00 lb St. Marys Cement Type I/II 4060.00 lb Class C Flyash 1045.00 lb Water Added 1467.18 lb Air Entraining Admixture – Sika Air 260 20.50 oz Water Reducing Admixture – Sikament 686 152.00 oz Total Water in the Mix 1910.26 lb W/C ratio 0.374 Measured Average Air content 5.3% Measured Average Concrete temperature 65 0F Measured Average Slump 3.25 in. Ambient Temperature 65 0F Average Compressive Strength 4815 psi
5.3.1 Bridge Inspection Summary
As shown in Appendix F, bridge details provide two options for casting deck slab and end
diaphragms: in a single operation or with two discrete operations executed within two weeks. For
this project, the contractor selected the first option, and the slab and end diaphragms were poured
on the 6th of October (Figure 5-2). The bridge deck was first inspected on October 10th and 11th
for longitudinal cracking. Ambient temperature during these two days ranged from the mid 50’s
to high 60’s in Fahrenheit while there was a rain in the morning of October 11. The slab was
inspected prior to pouring the approach slab and allowed inspection of slab cross-section over the
abutments. As specified in the plans, the deck was moist cured for seven days by placing a wet
burlap over the entire deck and covering the burlap with a large plastic sheet and a tarp. Figure
5-3 shows a general view of the bridge.
Figure 5-2. Monolithically cast end diaphragm and deck slab

80
(a) Facing east
(b) Facing west
(c) Side view
Figure 5-3. A general view of the bridge

81
As shown in Figure 5-3c, due to site constraints, only the deck slab was inspected. Two cracks
were identified over the west abutment. Both cracks had an average width of less than 0.005
inches. Figure 5-4 shows the crack locations in reference to the bridge cross-section. The first
crack was located above the shear key between beam 5 and 6. Figure 5-6 documents the geometry
of the crack. As shown, the crack has reached the full depth of the slab; additionally, the crack has
propagated approximately 8 inches along the deck. Since the end diaphragm stem length parallel
to bridge longitudinal axis is 12 inches, the crack has not propagated to the deck slab over the
beams.
Figure 5-4. Crack locations on west abutment (facing east)
Figure 5-5. Deck slab crack width (the crack located in between beam 5 and 6 over the west abutment)

82
(a) Full-depth crack
(b) Crack propagation along deck
Figure 5-6. Geometry of the crack located in between beam 5 and 6 over the west abutment
The second crack was documented above beam 2. It is located 14 inches towards beam 3 from the
shear key between beams 1 and 2. The crack appeared slightly smaller, widthwise, than the other
crack. This crack also had reached the full depth of the slab and had propagated approximately 2
inches along the deck (Figure 5-7 and Figure 5-8).
Figure 5-7. Crack over beam 2

83
(a) Full-depth deck slab crack
(b) Crack propagation along deck
Figure 5-8. Geometry of the crack above beam 2 on the west abutment
A follow-up inspection was conducted on March 8, 2017 (five months after initial inspection). By
March, the bridge had been subjected to several months of winter weather conditions. On the day
of inspection, the ambient temperature was about 20 0F but feeling much colder with high winds.
A detailed summary of inspection data is presented in Appendix G. Several cracks were
documented over the shear keys. The length and width of the longest crack over the west abutment
was about 28 inches and 0.02 in., and located along the 4th shear key (Figure 5-9). The length and
width of the longest crack over the east abutment was about 60 inches and 0.01 in., and located
along the 4th shear key (Figure 5-10).

84
(a) Crack along the 4th shear key on west abutment
(b) A close up view of the crack
Figure 5-9. Longitudinal crack along the 4th shear key over west abutment

85
(a) Crack along the 4th shear key on east abutment
(b) A close up view of the crack
Figure 5-10. Longitudinal crack along the 4th shear key over east abutment
5.4 SHAW BROOK BRIDGE (B-14-216) AND PRATT CREEK BRIDGE (B-14-217)
Both projects started on July 5, 2016 and completed on September 17, 2016. These two structures
represent the first adjacent box beam bridges with Geosynthetic Reinforced Soil (GRS) abutments
in Wisconsin. Structural details are presented in Appendix F. As per the structural details, a
majority of design and construction recommendations listed in section 5.2 of this report is
implemented. As shown in Table 5-2, both bridges have comparable span lengths while the bridge
B-14-217 has a skew of 15 degrees.

86
Table 5-2. Bridge Inventory and Design Data
Inventory and Design Data Bridge ID
B-14-216 B-14-217 Length 43 ft 46 ft Width 37 ft – 10.75 in. 33 ft – 9.5 in. Skew 0 15 deg. AADT (2015) 1300 440 Number of beams 9 8 Number of posttension locations along the span
6 6
Posttension force 12.1 kip/ft 11.3 kip/ft
Girders are supported on GRS abutments at different elevations to form the road crown. Each
superstructure is transversely post-tensioned over the abutments and at four locations within the
span. The specified posttensioning force is 86.7 kips per duct and applied at mid-depth of the
beam through the diaphragms. Full-depth grouted shear keys are used. Shear keys are formed
with BASF MasterFlow® 928 of which the properties are in compliance with the project special
provisions. The technical data sheet of the grout is provided in Appendix F. Posttensioning was
applied after the grout had cured for 2 days. According to the test data, the 3-day and 28-day
strengths of grout are 4,745 psi and 6,515 psi, respectively. Grade E concrete overlay is used on
both superstructures. Overlay specification, mix design, fresh and hardened concrete properties,
and ambient temperature at the time of overlay placement are given in Table 5-3.
Table 5-3. Grade E Overlay Specifications, Mix Design, and QA/QC Data
Grade E Overlay Specifications Mix Design Cement 823 lb Cement 823 lb Total Aggregate 2810 lb Coarse Aggregate (1.3% Moisture) 1454 lb Fine Aggregate 50% of total aggregate Fine Aggregate (3.5% Moisture) 1423 lb Water (Design) 32 gal Coarse Aggregate Absorption 1.5% Water (Maximum) 35 gal Fine Aggregate Absorption 3.3% Air Content 6% +/- 1% Water Added to the Mix 242 lb Slump < 2 in. Air Entrainment 8.75 oz Water Reducer 35 oz Water/Cement Ratio 0.29
Fresh and Hardened Concrete Properties and Ambient Temperature
B-14-216 B-14-217 Testing Date 08/30/2016 09/08/2016 Slump 1.4 1.25 Air Content 6% 5.8% Concrete Temperature 78 0F 78 0F 28-day Strength 5567 psi 5815 psi Ambient Temperature 80 0F -

87
5.4.1 Bridge Inspection Summary
The research team did not inspect this bridge during construction or just after construction. The
first inspection was conducted on March 9, 2017. By the time of inspection, both bridges had been
subjected to several months of winter weather conditions. On the day of inspection, the ambient
temperature was about 20 0F. A detailed summary of inspection data is presented in Appendix G.
5.4.1.1 Shaw Brook Bridge (B-14-216)
A general view of the bridge is shown in Figure 5-11. Several closely spaced cracks were
documented over the abutments (Figure 5-12). The width of those cracks was about 0.01 in. A
few cracks with the length ranging from 24 in. to 36 in. were documented over the shear keys.
Since the scope of the project is to evaluate the bridge performance in terms of longitudinal deck
cracking, the large number of hairline cracks that were observed after spaying water on the bridge
deck was not documented. Observation of such hairline cracks is expected with the mix design
used for the overlay. Low water levels at the bridge allowed inspecting beam soffits and the shear
keys. As shown in Figure 5-13, no shear key grout leak was observed.
Figure 5-11. General view of the bridge

88
(a) Cracks over the west abutment (b) A close up view of a crack Figure 5-12. Cracks over the west abutment
Figure 5-13. Self-adhesive compressible sealer at the shear key
The other observations include the opening at the joint between approach and bridge deck (Figure
5-14) and erosion of the backfill material (Figure 5-15). A gap of about 0.25 in. wide was recorded
at the joint between the approach and the bridge deck. This is expected due to contraction of bridge
superstructure under cold weather conditions.

89
(a) Gap between the approach and bridge deck
(b) Depth of the gap (3.5 in.) between the approach and bridge deck
Figure 5-14. Condition of the joint between the approach and bridge deck

90
(a) Erosion of backfill material near the fascia beam
(b) Backfill material underneath the fascia beam
(c) Erosion of backfill materal at other locations
Figure 5-15. Erosion of backfill material

91
5.4.1.2 Pratt Creek Bridge (B-14-217)
A general view of the bridge is shown in Figure 5-16. A 12 ft long, 0.013 in. wide crack was
documented at the east abutment and over the 3rd shear key (Figure 5-17). In addition, several
short cracks were documented at both abutments. Similar to B-14-216, erosion of backfill material
was observed (Figure 5-18).
Figure 5-16. General view of the bridge
(a) A 12 ft long crack over the east abutment (b) A close up view of a crack
Figure 5-17. Cracks over the east abutment

92
(a) Erosion of backfill material near the fascia beam
(b) A close up view
Figure 5-18. Erosion of backfill material
5.5 STRUCTURAL SYSTEM RESPONSE TO SHRINKAGE AND THERMAL GRADIENT LOADS
The structural system response under shrinkage and thermal gradient loads was simulated using
three dimensional finite element (FE) models. Two FE models were developed representing as
built details of B-26-40 and B-14-216 structures. Simulation of concrete elasticity modulus and
shrinkage development with respect to time required using user subroutines (USDFLD, UEXPAN,
and UMAT) written in FORTRAN. The USDFLD subroutine serves two purposes. First, it is
used to obtain instantaneous values of strain throughout the analysis. Second, it is used to change
field variables with time. The instantaneous strain is called using the GETVRM command and
placed as a state variable in the STATEV array for every element during each increment of the
analysis. The UEXPAN subroutine is used to define incremental thermal strains (Abaqus 2013).

93
The strains can be a function of temperature, field variables, and/or state variables. By excluding
thermal effects, the subroutine can be modified to model other forms of expansion and shrinkage
(Kasera 2014). The UMAT subroutine was used to calculate the modulus of elasticity and stress
at each time increment. Intel Composer XE 2013 SP1 was used to compile the subroutine. A right
hand Cartesian coordinate system was used with a z-axis parallel to the bridge longitudinal axis
and an x-axis parallel to the width of the bridge. Five shrinkage calculation models, listed in ACI
209.2R-08, were considered: ACI 209R-92, Bazant-Baweja B3, CEB MC90, CEB MC90-99, and
GL2000. The CEB MC90-99 model calculates autogeneous as well as drying shrinkage; however,
the other models only calculate drying shrinkage. These models were used to calculate the total
shrinkage developed in the B-26-40 cast-in-place concrete deck slab. In order to account for lack
of curing, a 3-day curing period was considered. Shrinkage was calculated up to 7 days, and
presented in Figure 5-19. In addition, a curing period of 7 days was considered, and the total
shrinkage up to 7 days was calculated. Since CEM MC90-99 is the only model that calculates
autogeneous shrinkage, as shown in Figure 5-19 and Figure 5-20, it represents shrinkage
development in the slab during the curing period. With a 3-day effective curing period, a total
shrinkage of 45 microstrains develops in 7 days (Figure 5-19). With a 7-day effective curing
period, a total shrinkage of 30 microstrains develops in 7 days (Figure 5-20). After evaluating all
five models, the CEM MC90-99 model was implemented in FE models to simulate shrinkage.
Figure 5-19. Total shrinkage developed in B-26-40 deck slab during a 7-day period with 3-day curing

94
Figure 5-20. Total shrinkage developed in B-26-40 deck slab during a 7-day period with 7-day curing
In order to calculate the stresses developed in the deck as a result of drying and autogeneous
shrinkage, the modulus of elasticity development of concrete in the deck slab needs to be modeled.
To serve this purpose, the models presented in ACI 209.2R-08 were considered. The results are
shown in Figure 5-21. ACI 209R-92 and Bazant-Baweja B3 models are similar. The CEB MC90-
99 model gives the highest modulus values and is incorporated in the user subroutine material
model (UMAT) in FORTRAN.
Figure 5-21. Development of modulus of elasticity with time
The maximum principal stress distribution under shrinkage at 7 days with 3-day moist curing of a
6 in. thick cast-in-place concrete slab is shown in Figure 5-22. In addition to concrete shrinkage,

95
temperature gradient develops tensile stresses in the deck. Literature recommended fifth and
second-order thermal profiles to represent the thermal gradient profile at noon and 6 p.m. during a
summer day (Priestley 1978; Hedegaard et al. 2013). Due to lack of precise models and field data
for adjacent box-beam bridges, these two profiles were used to evaluate the stresses developed in
bridge B-26-40. The maximum principal stress developed in the deck slab with a 10 0F
temperature difference between heating up and cooling down is shown in Figure 5-23. As shown
in the figures, the maximum principal stress over the support is oriented in a direction
perpendicular to the longitudinal axis (Figure 5-24). Hence, there is a potential to develop cracks
parallel to the longitudinal axis of the bridge. These results support the field observations that the
cracking starts over the supports. As shown in Figure 5-25, both top and bottom surfaces of the
deck slab over the supports are under tension due to concrete shrinkage. Even though the stresses
are less than the cracking strength of concrete at 7 days, concrete shrinkage will eventually develop
into such values resulting in stresses that are greater than concrete cracking strength. As shown in
Figure 5-23, temperature gradient can result in stresses that are greater than the cracking strength
of concrete. Since the tensile stresses are developed at the top surface under the thermal gradient,
most of the cracks will initiate from the top surface and propagate through the thickness with
increased shrinkage. Also, as shown in Figure 5-25, principal stresses are greater in the proximity
of the shear keys or the beam webs. (Note that the shear key locations are marked with white
lines.) When a 2 in. thick overlay is used, the volume-to-surface ratio is smaller compared to a 6
in thick concrete slab of the same size. Hence, greater shrinkage values result. Bridge B-14-216
has a 2 in. thick overlay, and shrinkage simulation resulted in greater stresses than those observed
in B-26-40 (Figure 5-26). When a 6 in. slab is used, the maximum principle stresses are developed
over the supports and distributed across bridge width (Figure 5-22). With a 2 in. overlay, the
maximum stresses are also developed over the supports, but concentrated around bridge centerline
(Figure 5-26).

96
West Abutment
East Abutment
Figure 5-22. The maximum principal stress distribution under shrinkage at 7 days with 3-day moist curing (B-26-40)
West Abutment West Abutment
East Abutment East Abutment Top Surface Bottom Surface
Figure 5-23. The maximum principal stress developed in the deck slab with 10 0F temperature difference between heating up and cooling down (B-26-40)

97
West Abutment West Abutment
East Abutment
East Abutment
(a) The maximum principal stress due to thermal gradient (b) The maximum principal stress due to shrinkage
(c) A close up view of the maximum principal stress distribution over the east abutment due to thermal gradient
(d) A close up view of the maximum principal stress distribution over the east abutment due to shrinkage
Figure 5-24. Symbol plot showing the maximum principal stress distribution due to thermal gradient loading and shrinkage

98
Top Surface Bottom Surface
Figure 5-25. The maximum principal stresses at top and bottom surfaces of the deck slab of 7 days with 3 days curing (B-26-40)
Top Surface Bottom Surface
Figure 5-26. The maximum principal stresses at top and bottom surfaces of the deck slab of 7 days with 3 days curing (B-14-216)
Figure 5-27 shows the beam end and abutment details of bridge B-26-40. The beam end diaphragm
length is 34 in. In addition, the 18 in. thick end diaphragm is either constructed integrally with the
6 in. thick concrete slab or constructed prior to pouring the slab. A parametric study was conducted
to evaluate the impact of the having an end diaphragm and the casting sequence of the end
diaphragm on the stresses developed in the deck slab due to concrete shrinkage. Based on the
parametric analysis results, the following conclusions can be derived:
End diaphragm provides additional constraints to the system and increases deck slab
stresses compared to a bridge without an end diaphragm.
Construction of an end diaphragm with the slab reduces deck slab stresses due to shrinkage
of the slab and the end diaphragm. However, stresses in the deck with an end diaphragm
are slightly greater than the stresses developed in a bridge without an end diaphragm.

99
Figure 5-27. Bridge B-26-40 beam and end diaphragm detail
As shown in B-14-216 and B-14-217 bridge plans (see Appendix F for details), a bridge
superstructure is supported on a bearing bed prepared using reinforced soil. Vertical stress and
strain data presented in Adams et al. (2011) were used, and an equivalent modulus of 7000 psi was
calculated. Poisson’s ratio of 0.35 was assumed. With these parameters, the impact of reduction
in vertical stiffness on deck stresses due to shrinkage was investigated. Even though the reduction
in vertical support stiffness reduces deck stresses, the combined effect of shrinkage and thermal
gradient load can develop stresses greater than the cracking strength of the overlay.
5.6 SUMMARY OF FINDINGS
Bridge B-26-40 was inspected just five days after pouring the deck and prior to construction of the
approaches. Two cracks were documented over the west abutment. During this time, the deck
slab was subjected to only barrier loads and volume change loads such as heat of hydration,
shrinkage, and temperature gradient due to ambient weather. The early appearance of these cracks
indicates that the cracking is initiated primarily due to the aforementioned loads. B-26-40 and two
other bridges that were constructed with GRS abutments (B-14-216 and B-14-217) were inspected
in March, 2017 (i.e., 5 months after construction). A limited number of long cracks were
documented on all three bridge decks. Additionally, randomly dispersed short cracks over the

100
beam ends were documented. On all three bridges, typical concrete mixes are used for the
overlays. Apart from deck cracking, drainage problems and cracking (or opening) of the joint
between the approach pavement and bridge superstructure were documented.
Refined finite element analysis was conducted by incorporating user subroutines to simulate
concrete strength and shrinkage development with time. Further, the temperature gradient effect
was also investigated. Based on the analysis results, the following conclusions can be derived:
Concrete shrinkage develops tensile stresses through the thickness of an overlay and the
greatest stresses are located over the supports of the superstructure.
Thin concrete overlays develop greater stresses compared to thick overlays due to a smaller
volume-to-surface ratio.
Temperature gradient load develops tensile stresses at the top surface and over the entire
deck area. A differential temperature of 10 0F between heating up and cooling down is
enough to develop stresses greater than the concrete cracking strength.
The combined effect of shrinkage and thermal gradient loads is adequate to develop full
length longitudinal deck cracking.
Due to lack of field data for developing temperature gradient profiles for adjacent box-
beam bridges, the profiles derived for multi-cell box-beams were used. Hence, field
verification of temperature profile and strain development in the bridge superstructure is
necessary to validate the findings of this study and develop recommendations for reducing
or eliminating longitudinal deck cracking.

101
6 SUMMARY, CONCLUSIONS, AND RECOMMENDATIONS
6.1 SUMMARY AND CONCLUSIONS
The adjacent precast concrete box-beam bridge is the bridge of choice for short and short-to-
medium span bridges. This choice is because of the ease of construction, favorable span-to-depth
ratios, aesthetic appeal, and high torsional stiffness. However, this bridge is losing favor primarily
because of persisting durability performance issues such as longitudinal cracking at the shear key
locations. This research project was initiated to identify modifications to the current precast
prestressed adjacent box-beam bridge details, specifications, and methods used in Wisconsin with
a goal of minimizing the potential for developing longitudinal deck cracking over the shear keys.
This project was conducted in two phases. During the first phase of the project, details and best
practices documented in literature and implemented by various highway agencies for minimizing
longitudinal deck cracking on adjacent box-beam bridges were reviewed and documented. A
selected number of highway agencies were surveyed to document their adjacent box-beam bridge
design, construction practices, and performance observations with the implementation of their
most recent policies. Also, a representative sample of in-service box-beam bridges in Wisconsin
was inspected. Based on the outcome of the aforementioned efforts, a list of best practices was
developed, and revised details and specifications were presented. In 2016, WisDOT built three
adjacent box-beam bridges and incorporated a limited number of recommendations. One of the
bridges (B-26-40) was constructed on traditional abutments and incorporated a 6 in. thick cast-in-
place concrete slab. The other two bridges (B-14-216 and B-14-217) were constructed on
Geosynthetic Reinforced Soil (GRS) abutments and incorporated a 2 in. thick concrete overlay.
The details and special provisions of these projects are presented in Appendix F.
The B-26-40 bridge deck was inspected on the 5th day following deck pour (i.e., during the 7-day
moist curing period). Two cracks were identified over the west abutment. One of the cracks was
8 in. long and located above a shear key while the other crack was located above a box-beam. The
inspection data shows that the cracking initiates well before the bridge is opened to traffic due to
volume change loads. A follow-up inspection was conducted on March 08, 2017 (five months
after construction and the bridge had been subjected to several months of winter weather
conditions). Several cracks were documented over the shear keys. The length and width of the

102
longest crack over the west abutment was about 28 in. and 0.02 in., respectively, and located along
the 4th shear key. The length and width of the longest crack over the east abutment was about 60
in. and 0.01 in., respectively, and located along the 4th shear key. This observation shows that the
negative temperature gradient, coupled with concrete shrinkage, could be the leading cause of
cracking.
The B-14-216 and B-14-217 bridge decks were inspected on March 09, 2017. On the B-14-216
deck, a few cracks with lengths ranging from 24 in. to 36 in. were documented over the shear keys.
These cracks had originated from the edge of the deck and propagated towards the mid span. A
large number of hairline cracks were observed after spraying water on the bridge deck.
Observation of such hairline cracks is expected with the mix design used for the overlay.
Inspection of the beam soffit showed that the use of flexible foam formwork for shear key grouting
has worked very well. Similar performance was observed with bridge B-14-217. However, an
exceptionally long (12 ft long, 0.013 in. wide) crack was documented at the east abutment and
over the 3rd shear key. Additional observations include some drainage issues at the GRS
abutments, cracking at the approach pavement-bridge deck joint and, in the case of B-14-216, a
significant impact from live load. Observations from these two bridges reveal that, irrespective of
the bridge support types, longitudinal deck cracking persists.
Refined finite element analysis was conducted by incorporating user subroutines to simulate
concrete strength and shrinkage development with time. Further, the temperature gradient effect
was also investigated. Based on the analysis results, the following conclusions can be derived:
Concrete shrinkage develops tensile stresses through the thickness of an overlay, and the
greatest stresses are developed over the abutments.
Thin concrete overlays develop greater stresses compared to thick overlays due to smaller
volume-to-surface ratio.
The temperature gradient load develops tensile stresses at the top surface and over the entire
deck area. A differential temperature of 10 0F between heating up and cooling down can
develop stresses greater than concrete cracking strength.
The combined effect of shrinkage and thermal gradient loads is adequate to develop full-
length longitudinal deck cracking.

103
The end diaphragm provides additional constraints to the system and increases deck slab
stresses compared to a bridge without an end diaphragm.
Construction of the end diaphragm with the slab reduces deck slab stresses due to shrinkage
of the slab as well as the end diaphragm. However, stresses in the deck with an end
diaphragm are slightly greater than the stresses developed in a bridge without an end
diaphragm.
Use of GRS abutments reduces the vertical support stiffness; hence, the deck slab or
overlay stresses. However, the combined effect of shrinkage and thermal gradient load can
develop stresses greater than concrete cracking strength.
6.2 RECOMMENDATIONS
It is recommended to continue implementing the design and construction best practices presented
in Chapter 5 of this report until additional research is conducted to address the following concerns:
The mix designs used for the 6 in. thick cast-in-place concrete slab and 2 in. thick overlay
include ordinary portland cement. These mixes are prone to cracking due to shrinkage.
Since temperature gradient load also develops additional tensile stresses in the system, use
of an overlay with a proven record of crack resistant properties is desired.
An asphalt overlay with a waterproofing membrane has a better performance record
compared to a concrete overlay or a slab. Hence, adoption of such a deck protection system
or a multi-layer protection system, as practiced in Europe, needs to be considered.
Due to lack of field data for developing temperature gradient profiles for adjacent box-
beam bridges, the profiles derived for multi-cell box-beams were used. Hence, field
verification of temperature profile and strain development in the bridge superstructure is
necessary to validate the findings of this study and develop recommendations for reducing
or eliminating longitudinal deck cracking.
Two adjacent box-beam bridges were constructed with Geosynthetic Reinforced Soil
(GRS) abutments. The vertical stiffness of GRS abutments is smaller compared to the
stiffness of traditional abutments. This lower stiffness helps reduce the stresses developed
in the superstructure due to volume change loads. However, the combined effect of
shrinkage and thermal gradient loads can still develop stresses in excess of concrete
cracking strength. Therefore, the above stated recommendations, related to deck protective

104
systems, need to be considered for improving bridge durability. In addition to deck
cracking, drainage problems, and cracking at approach pavement and deck connection were
documented during field inspection. Hence, implementation of an approach slab with a
sleeper slab or a water proofing membrane system, as practiced by the Alberta Ministry of
Transportation, is recommended.
When GRS abutments are used, the current practice is to support the girders directly on
reinforced soil pads. Significant live load impacts were noticed during the inspection of
bridge B-14-216. If differential settlement occurs, an adjacent box-beam bridge
superstructure with a single layer of post-tensioning strands through the depth is not
adequately detailed to carry transverse moments. Hence, it is recommended to evaluate
the use of concrete pads to control potential impacts due to differential settlement.
It is possible to use 1.5 in. by 3 in. wide flat anchorage duct with unbounded, lubricated,
encased strands through top and bottom flanges of the beam. Figure 6-1 shows the
technical details of the post-tensioning system. Figure 6-2 shows the arrangement of
longitudinal and transverse reinforcement with a flat anchorage duct. The changes can be
accommodated by reducing the height of void from 7 in. to 6 in. and increasing the height
of top and bottom flanges from 5 in. to 5.5 in. Top reinforcement has deeper cover than
the cover required for durability. Alternative details (such as having stirrup and
longitudinal steel at the typical location in between the ducts) can be investigated. The
current exterior girder provides adequate space for anchorage as shown in Figure 6-3. The
duct spacing is limited to the smaller of 4 ft or beam width.
Post-tensioning force of 175 to 234 kips can be applied. This unbonded system
allows girder and deck replacement. As needed, post-tensioning can be applied in two
stage with this system to compress the cast-in-place concrete slab to mitigate tensile
stresses due to volume change loads. The temperature effect on strands will be minimum
due to the presence of a plastic duct, air gap between the duct and strands, and sheathing
on the strands, which will be beneficial for maintaining a consistent force in strands during
daily heating and cooling cycles of the superstructure. Thus, this system will allow
maintaining deck slab in compression to mitigate the tensile stresses develop in the deck
slab due to temperature gradient loading. Post-tensioning force magnitudes with two-stage

105
post-tension, cost, stresses at anchor zone, and other design and maintenance requirements
need to be further researched.
(a) Flat anchorage system
(b) Anchorage with 4 - 0.6 in. strands
Tendon configuration 3-0.6 in. or 4-0.6 in. 4-0.6 in. or 5-0.5 in.
Dim
ensi
ons
A (in.) 10.75 13.75 B (in.) 4.5 4.875 C (in.) 5.5 5.875 D (in.) 10 13 E (in.) 4 4 F (in.) 2.25 2.25 ID1 (in.) 1 1 ID2 (in.) 3 3 K (in.) 12.25 -- L (in.) 4.5 8.625
c) Technical detail
Figure 6-1. Flat anchorage geometry and technical detail
a) Current beam details

106
b) Proposed changes to beam details with ducts
Figure 6-2. Interior beam with and without transverse post-tensioning ducts
a) Current beam details
b) Proposed changes to beam details with ducts
Figure 6-3. Exterior beam with and without transverse post-tensioning ducts

107
7 BIBLIOGRAPHY
1. AASHTO LRFD (2013). Bridge Design Specifications. American Association of State
Highway and Transportation Officials, 444 North Capitol Street, NW, Suite 249,
Washington, DC 20001.
2. Abaqus (2013). Abaqus Documentation. Dassault Systèmes Americas Corp., 175 Wyman
Street, Waltham, MA 02451
3. ACI 209.2R-08 (2008). Guide for Modeling and Calculating Shrinkage and Creep in
Hardened Concrete. American Concrete Institute, Farmington Hills, MI 48331.
4. Adams, M., Nicks, J., Stabile, T., Wu, J., Schlatter, W. and Hartmann, J. (2011).
Geosynthetic Reinforced Soil Integrated Bridge System,Synthesis Report, FHWA-HRT-11-
027, Federal Highway Administration, McLean, VA.
5. Alberta MOT (2017). Low Volume Standard Bridge GRS Abutment Alternative Typical
Details. The Ministry of Transportation, Alberta, Canada.
http://www.transportation.alberta.ca/Content/docType30/Production/low_volume_bridge_Geosynthetic_Reinforced_Soil_GRS_foundation_typical_details.pdf (Last accessed: 03/26/2017)
6. Aktan, H., Attanayake, U., Ulku, E., Ahlborn, T. M., and Deshpande, Y. (2009). “Condition
Assessment and Methods of Abatement of Prestressed Concrete Box-Beam Deterioration –
Phase II,” MDOT RC-1527, Michigan Department of Transportation, Detroit, MI 48226.
7. Aktan, H., Ahlborn, T. M., Attanayake, U., and Gilbertson, C. G. (2005). “Condition
Assessment and Methods of Abatement of Prestressed Concrete Box-Beam Deterioration –
Phase I,” MDOT RC-1470, Michigan Department of Transportation, Lansing, MI.
8. Attanayake, U. B. and Aktan, H. (2013). “The First Generation ABC System, Evolving
Design, and Half a Century Performance– Michigan Side-by-Side Box-Beam Bridge," ASCE
Journal of Performance of Constructed Facilities, Vol. 29(3), pp. 1-14.
9. Attanayake, U. and Aktan, H. M. (2009). "Side-by-side Box-beam Bridge Superstructure:
Rational Transverse Posttension Design," 88th TRB Annual Meeting, No. 09-3420, January
11-15, 2009.
10. Attanayake, U., Aktan, H.M., and Ng, S. (2002). “Criteria and Benefits of Penetrating
Sealants for Concrete Bridge Decks,” MDOT RC-1424, CSD 2002-03, Report to the
Michigan Department of Transportation, Lansing, MI.

108
11. Battaglia, I., Whited, G., and Swank, R. (2008). “Eclipse® Shrinkage Reducing Admixture
Product Evaluation.” FEP-01-08, Wisconsin Department of Transportation, WI 53704.
12. Chaunsali, P., Li, S., Mondal, P., Foutch, D., Richardson, D., Tung, Y., and Hindi, R.
(2013). “Bridge Decks: Mitigation of Cracking and Increased Durability.” FHWA-ICT-13-
023, Illinois Department of Transportation, Springfield, IL 62704.
13. Culmo, M.P. (2009). Connection Details for Prefabricated Bridge Elements and Systems,
Technical Report FHWA-IF-09-010, Federal Highway Administration, McLean, VA.
14. Cusens, A. R. (1974). “Load Distribution in Concrete Bridge Decks.” CIRIA Report 53,
Construction Industry Research and Information Association, 6 Storey’s Gate, Westminster,
London SW1P 3AU.
15. Dong, X. (2002). “Traffic forces and temperature effects on shear key connection for
adjacent box girder bridge.” Ph.D Dissertation, University of Cincinnati, Ohio.
16. FHWA (2011). Geosynthetic Reinforced Soil Integrated Bridge System, Synthesis Report,
FHWA-HRT-11-027, Office of Infrastructure Research and Development, the Federal
Highway Administration, McLean, VA 22181.
17. FHWA (1995). Recording and Coding Guide for the Structure Inventory and Appraisal of
the Nation’s Bridges, FHWA-PD-96-001, Office of Engineering, Bridge Division, the
Federal Highway Administration, McLean, VA 22181.
18. French, C.E., Shield, C.K., Klaseus, D., Smith, M., Eriksson, W., Ma, J.Z., Zhu, P., Lewis,
S., and Chapman, C.E. (2011). Cast-in-Place Concrete Connections for Precast Deck
Systems, Contractor's Final Report, NCHRP Project 10-71, Transportation Research Board
of the National Academies, Washington, D.C.
19. Freyne, S., Ramseyer, C., and Giebler, J. (2012). “High-Performance Concrete Designed to
Enhance Durability of Bridge Decks: Oklahoma Experience.” Journal of Materials in Civil
Engineering, Vol. 24, No. 7, pp. 933-936.
20. Grace, N., Jensen, E., and Bebawy, M. R. (2012). “Transverse post-tensioning arrangement
for side-by-side box-beam bridges.” PCI Journal, Spring 2012, pp. 48-63.
21. Grace, N. and Jensen, E. (2008). “Use of Unbonded CFCC for Transverse Post-Tensioning
of Side-by-Side Box-Beam Bridges,” MDOT RC-1509, Report to the Michigan Department
of Transportation, Lansing, MI 48909.

109
22. Gulyas, R. J., Wirthlin, G. J., and Champa, J. T. (1995). “Evaluation of keyway grout test
methods for precast concrete bridges.” PCI Journal, Vol. 40, No. 1, pp. 44-57.
23. Hanna, K. E., Morcous, G., and Tadros, M. K. (2009). “Transverse post-tensioning design
and detailing of precast, prestressed concrete adjacentbox- girder bridges.” PCI Journal, Fall
2009, pp. 160-174.
24. Hansen, J. (2012). Transversely Post-Tensioned Box-Beam System for Precast Parking
Structures. MS thesis, University of Nebraska-Lincoln.
25. Harries, K. A. (2006). “Full-scale Testing Program on De-commissioned Girders from the
LakeView Drive Bridge.” FHWA-PA-2006-008-EMG001, University of Pittsburgh,
Department of Civil and Environmental Engineering, 949 Benedum Hall, Pittsburgh, PA.
26. Hedegaard, B. D, French, C. E. W., and Shield, C. K. (2013). “Investigation of Thermal
Gradient Effects in the I-35W St. Anthony Falls Bridge.” The Journal of Bridge
Engineering, Vol. 18, No. 9, pp. 890–900.
27. Hoomes, L. C., Ozyildirim, C., and Brown, M. C. (2014). “Evaluation of high performance
fiber-reinforced concrete for bridge deck connections, closure pours, and joints.” 93rd Annual
Meeting, Transportation Research Board, Washington, D.C.
28. Huckelbridge, A. A. Jr., El-Esnawi, H., Moses, F. (1995). “Shear Key Performance in
Multibeam Box Girder Bridges.” Journal of Performance of Constructed Facilities, Vol. 9,
No. 4, pp. 271-285.
29. Issa, M.A., Ribeiro do Valle, C.L., Islam, S., Abdalla, H.A., and Issa, M.A. (2003).
“Performance of Transverse Joint Grout Materials in Full-Depth Precast Concrete Bridge
Deck Systems.” PCI Journal, July-August, 2-13.
30. Jones, L. (2017). Geosynthetic Reinforced Soil Integrated Bridge System (GBS-IBS) –
Concepts and Background.
http://www.fdot.gov/design/training/designexpo/2012/Presentations/Jones.Larry.GRS-
IBS.pdf (Last accessed: March 30, 2017)
31. Kasera, S.C. (2014) “Simulation of the effect of deck cracking due to creep and shrinkage in
single span precast/prestressed concrete bridges.” Master’s thesis, University of Cincinnati,
2600 Clifton Ave, Cincinnati, OH 45220.

110
32. Kepler, J. L., Darwin, D., and Locke, C. E. (2000). Evaluation of corrosion protection
methods for reinforced concrete highway structures. Lawrence: The Kansas Department of
Transportation.
33. Kim, J. J., Nam, J. W., Kim, H. J., Kim, J. H., Kim, S. B., and Byun, K. J. (2008).
“Overview and applications of precast, prestressed concrete adjacent box-beam bridges in
South Korea.” PCI Journal, July – August 2008, pp. 83-107.
34. Krauss, P. D., Lawler, J. S., & Steiner, K. A. (2009). Guidelines For Selection Of Bridge
Deck Overlays, Sealers and Treatments. NCHRP Project 20-07 Task 234, National
Cooperative Highway Research Program, Transportation Research Board.
35. Lai, D. (2008). “The Evolution of Bridge Deck Rehabilitation Strategies in Ontario,” the
2008 Annual Conference of the Transportation Association of Canada, Toronto, Ontario.
36. Lall, J., Alampalli, S., and DiCocco, E. F. (1998). “Performance of Full-Depth Shear Keys
in Adjacent Prestressed Box Beam Bridges.” PCI Journal, Vol. 43, No. 2, pp. 72-79.
37. Liang, Y.-c., Zhang, W., and Xi, Y. (2010). Strategic Evaluation of Different Topical
Protection Systems for Bridge Decks and the Associated Life-Cycle Cost Analysis. Colorado:
Colorado Dept. of Transportation
38. MAINROADS, W. A. (2007). Guidelines for the application of waterproof membranes to
bridge decks. Australia: Government of Western Australia.
39. Miller, R., Hlavacs, G. M., Long, T., and Greuel, A. (1999). “Full-Scale Testing of Shear
Keys for Adjacent Box Girder Bridges.” PCI Journal, Vol. 44, No. 6, pp. 80-90.
40. NBI (2014). The National Bridge Inventory.
https://www.fhwa.dot.gov/bridge/nbi/ascii.cfm (Last Accessed: February 6, 2016).
41. NYSDOT (2015). Guidelines for Design and Construction of Geosynthetic Reinforced Soil
Integrated Bridge System. The New York State Department of Transportation, Albany, NY.
42. Oesterle, R. G. and El-Remaily, A. F. (2009). Guidelines for Design and Construction of
Decked Precast, Prestressed Concrete Girder Bridges, Final Report, NCHRP Project No. 12-
69, Transportation Research Board, National Research Council, Washington, D.C.
43. PCI (2011). The State of the Art of Precast/Prestressed Adjacent Box Beam Bridges.
Precast/Prestressed Concrete Institute, 209 West Jackson Boulevard, Chicago, IL 60606.
44. Perry, V., Dykstra, D., Murray, P., and Rajlic, B. (2010). “Innovative Field Cast UHPC
Joints for Precast Bridge Systems - 3-span Live Load Continuous.” Proc., Bridges -

111
Adjusting to New Realities (A) Session, Transportation Association of Canada, Halifax,
Nova Scota.
45. Priestley, M.J.N. (1978). “Design of thermal gradients for concrete bridges,” New Zealand
Engineering, 31 (9), 213-19.
46. Phares, B., Rouse, J., and Miksell, J. (2013). Laboratory and Field Testing of an Accelerated
Bridge Construction Demonstration Bridge: US Highway 6 Bridge over Keg Creek, Report.
InTrans Project 11-411. FHWA and Iowa Department of Transportation Ames, IA.
47. Price, A. R. (1989). A field Trial Of Waterproof Systems For Concrete Bridge Decks.
Bridges Division Structure Group Trasnport and Road Research Laboratory.
48. Ramey, G.E., Pittman, D.W., Webster, G., and Carden, A. (1997). Use of Shrinkage
Compensating Cement in Bridge Decks. Auburn University, Department of Civil Engineering,
Auburn, AL.
49. Royce, M. (2016). “Utilization of Ultra-High Performance Concrete (UHPC) in New York.”
Proceedings of the First International Interactive Symposium on UHPC, July 18-20, Des
Moines, Iowa.
50. Russell, H. G. (2009). Adjacent Precast Concrete Box Beam Bridges: Connection Details.
NCHRP Synthesis 393, Transportation Research Board, Washington D.C.
51. Russell, H. G. (2012). Waterproofing Membranes for Concrete Bridge Decks. NCHRP
Synthesis 425, Transportation Research Board, Washington D.C.
52. Sang, Z. (2010). “A Numerical Analysis of the Shear Key Cracking Problem in Adjacent
Box Beam Bridges.” Master Thesis, the Pennsylvania State University.
53. Scholz, D. P., Wallenfelsz, J. A., Lijeron, C., and Roberts-Wollmann, C. L. (2007).
Recommendations for the Connection Between Full-Depth Precast Bridge Deck Panel
Systems and Precast I-Beams, Final Contract Report, FHWA/VTRC 07-CR17, Virginia
Transportation Research Council, Charlottesville, VA.
54. Sharpe, G. P. (2007). “Reflective cracking of shear keys in multi-beam bridges.” Master
Thesis, Texas A & M University.
55. Storm, T. K., Rizkalla, S. H., and Zia, P. Z. (2013). “Effects of production practices on
camber of prestressed concrete bridge girders.” PCI Journal, Winter 2013, pp. 96-111.

112
56. Tadros, M. K., Hanna, K., Jaber, N., and Hansen, J. (2017). Transversely posstentioned,
pretopped box-slab system for precast concrete parking structures. PCI Journal, Vol. 62, No.
2, March-April.
57. Troli, R., and Collepardi, M. (2011). “Shrinkage-compensating concrete for special
structures.” Proceedings of 4th International Conference on "Non-Traditional Cement &
Concrete”, Brno, Czech Republic 27-30 June.
58. Ulku, E., Attanayake, U., and Aktan, H. M. (2010). "Rationally Designed Staged Posttension
Abates Reflective Cracking on Side-by-Side Box-Beam Bridge Decks," Transportation
Research Record: Journal of the Transportation Research Board, No. 10-1153, Transportation
Research Board of the National Academies, Washington, D.C. pp. 87-95.
59. Yamane, T., Tadros, M. K., and Arumugasamy, P. (1994). “Short to Medium Span Precast
Prestressed Concrete Bridges in Japan.” PCI Journal, Vol. 39, No. 2, pp. 74-100.
60. Yuan, A., Qian, S., He, Y. and Zhu, X. W. (2013). “Capacity Evaluation of a Prestressed
Concrete Adjacent Box Girder with Longitudinal Cracks in the Web.” ASCE Journal of
Performance of Constructed Facilities, Vol. 29, No. 1, pp. 1-9.
DOT DOCUMENTS
1. CONNECTICUT BRIDGE DESING MANUAL (2003 EDITION)
http://www.ct.gov/dot/lib/dot/documents/dpublications/bridge/bdm.pdf (Last Accessed:
January 9, 2014).
2. DELAWARE BRIDGE DESIGN MANUAL (MAY 2005)
http://www.deldot.gov/information/pubs_forms/manuals/bridge_design/ (Last Accessed:
January 9, 2014).
3. ILLINOIS DESIGN GUIDES
http://www.dot.il.gov/bridges/Design%20Guides/Design_Guides_Web.pdf (Last Accessed:
January 9, 2014).
4. INDIANA DESIGN MANUAL 2013
http://www.in.gov/indot/design_manual/design_manual_2013.htm (Last Accessed: January
9, 2014).
5. INDIANA STANDARD DOCUMENT http://www.in.gov/dot/div/contracts/standards/dm-
Archived/07%20Metric/Part%206/Ch%2063/Ch63.pdf (Last Accessed: January 9, 2014).

113
6. KENTUCKY STRUCTURAL DESING MANUAL
http://transportation.ky.gov/Structural-Design/Manuals/Chapters.pdf (Last Accessed:
January 9, 2014).
7. KENTUCKY STANDARD SPECIFICATION (STRUCTURES AND CONCRETE 2012)
http://transportation.ky.gov/Construction/Standard%20amd%20Supplemental%20Specificati
ons/600%20Structures%20and%20Concrete%2012.pdf (Last Accessed: January 9, 2014).
8. KENTUCKY STANDARD DRAWINGS (2012) http://transportation.ky.gov/Highway-
Design/Pages/2012-Standard-Drawings.aspx (Last Accessed: January 9, 2014).
9. MASSACHUSETTS LRFD BRIDGE MANUAL PART I (2017)
http://www.massdot.state.ma.us/highway/DoingBusinessWithUs/ManualsPublicationsForms/
LRFDBridgeManual2013Edition.aspx (Last Accessed: January 9, 2017).
10. MICHIGAN STANDARD SPECIFICATION FOR CONSTRUCTION
http://mdotcf.state.mi.us/public/specbook/2012/ (Last Accessed: January 9, 2014).
11. MICHIGAN BRIDGE DESIGN GUIDE
http://mdotcf.state.mi.us/public/design/englishbridgeguides/ (Last Accessed: January 9,
2014).
12. MICHIGAN BRIDGE DESIGN MANUAL
http://mdotcf.state.mi.us/public/design/englishbridgemanual/ / (Last Accessed: January 9,
2014).
13. MISSOURI LFD AND LRFD BRIDGE DESIGN GUIDELINES
http://www.modot.org/business/manuals/bridgedesign.htm (Last Accessed: January 9, 2014).
14. MISSOURI BRIDGE STANDARD DRAWINGS
http://www.modot.org/business/consultant_resources/bridgestandards.htm (Last Accessed:
January 9, 2014).
15. NEW HAMPSHIRE BRIDGE DESIGN MANUAL (OCT. 2000)
http://www.nh.gov/dot/org/projectdevelopment/bridgedesign/documents.htm (Last Accessed:
January 9, 2014).
16. NEW JERSEY DESIGN MANUAL BRIDGES AND STRUCTURES (5TH EDITION)
http://www.state.nj.us/transportation/eng/documents/BSDM/ (Last Accessed: January 9,
2014).

114
17. NYSDOT CEMENT BASED GROUT MATERIALS FOR SHEAR KEYS (701-06)
https://www.dot.ny.gov/divisions/engineering/technical-services/technical-services-
repository/alme/pages/230-1.html (Last Accessed: September 18, 2016).
18. OHIO BRIDGE DESIGN MANUAL (2007)
http://www.dot.state.oh.us/Divisions/Engineering/Structures/standard/Bridges/BDM/BDM20
07_10-18-13.pdf (Last Accessed: January 9, 2014).
19. PENNSYLVANIA DESIGN MANUAL PART 4- STRUCTURES (MAY 2012 EDITION)
ftp://ftp.dot.state.pa.us/public/Bureaus/design/PUB15M/2012_Edition/DM-4_May_2012.pdf
(Last Accessed: January 9, 2014).
20. PENNSYLVANIA ARCHIVED BRIDGE DESIGN STANDARDS
http://www.dot.state.pa.us/Internet/BQADStandards.nsf/bd-archives?readform (Last
Accessed: January 9, 2014).
21. RHODE ISLAND LRFD BRIDGE DESIGN MANUAL (2007 EDITION)
http://www.dot.ri.gov/documents/engineering/br/RILRFDBridgeManual.pdf (Last Accessed:
January 9, 2014).
22. RHODE ISLAND BRIDGE DESIGN STANDARD DETAILS (2009)
http://www.dot.ri.gov/documents/engineering/BlueBook/BRG_STD_PDF_COMB_1-12-
09.pdf (Last Accessed: January 9, 2014).
23. VIRGINIA PRESTRESSED CONCRETE BEAM STANDARDS (2013)
http://www.extranet.vdot.state.va.us/locdes/electronic%20pubs/Bridge%20Manuals/Volume
V-Part4/VolumeV-Part4.pdf (Last Accessed: January 9, 2014).
24. VIRGINIA STRUCTURE AND BRIDGE MANUALS (2013)
http://www.virginiadot.org/business/bridge-manuals.asp (Last Accessed: January 9, 2013).
25. VERMONT STRUCTURES DESIGN MANUAL (2010)
http://vtransengineering.vermont.gov/sites/aot_program_development/files/documents/struct
ures/Structures_Design_Manual_0.pdf (Last Accessed: January 9, 2013)