Embed Size (px)
Citation preview
Final Report
An Outcomes-Based Approach to Evaluating Service Coordination Models
Award #H324C10147
Principal Investigator:
Richard N. Roberts, Ph.D. [email protected]
Early Intervention Research Institute
6580 Old Main Hill Utah State University
Logan, UT 84322-6580 (435) 797-1172
www.eiri.usu.edu
Project Period:
October 1, 2001 – December 31, 2004
May 31, 2005

ii
Table of Contents
Page
Project Relationship with GPRA Performance Indicators ................................................. 1 Study Overview ....................................................................................................................... 2 Selected Service Coordination Models......................................................................... 5 Conceptual Framework and Methods ........................................................................... 7 Results ...................................................................................................................................... 8 Objective 1: Describe Community Characteristics, System Characteristics, and Service Coordinator Influencing the Implementation of the Service Coordination Model .................................................................. 9 Objective 2: Describe the Systems Outcomes and Direct Service Outcomes Associated with the Three Service Coordination Models ...................... 13 Objective 3: Describe the Child and Family Outcomes Associated with the Three Service Coordination Models....................................................... 22 Objective 4: Describe the Critical Variables Influencing the System Outcomes, Direct Service Outcomes, and Child/Family Outcomes ........................ 30 Objective 5: Disseminate an Evaluation Framework that Will Assist Communities and States in Developing an Efficient, Responsive, Service Coordination Model .................................................................. 31 Conclusions and Discussion ................................................................................................... 33 Summary of Findings and Their Implications for Service Coordination ..................... 34 Outcomes ...................................................................................................................... 36 Future Directions .......................................................................................................... 40 References ................................................................................................................................ 44
1
Final Report
An Outcomes-Based Approach to Evaluating Service Coordination Models
This is the final report of the three-year study entitled “An Outcomes-Based Approach to
Evaluating Service Coordination Models.” The purpose of the study was to investigate three
commonly used Part C service coordination models, examining the degree to which services are
delivered efficiently, including a cost analysis, as well as their effect on child and family
outcomes. The goal of this project was to identify those service coordination strategies that
best support system efficiency and child and family quality of life and developmental
outcomes. This study is in response to the Field-Initiated Research Invitational Priority (d):
Projects that advance knowledge about the coordination of education with health and social
services.
Project Relationship with GPRA Performance Indicators
This project supported the achievement of the following GPRA performance indicators:
1.1: Responsive to needs of children with disabilities and their families. This research
has informed the field by identifying successful service coordination strategies to better meet
child and family needs.
2.1: Highest standards for methods and materials. This project applied high-quality
quantitative and qualitative methods and tools to capture an in-depth assessment of child and
family well-being and systems-level outcomes.
3.1: Communication to improve results. The dissemination strategies have ensured that
successful service coordination strategies are disseminated to families, policymakers,
practitioners, and researchers.
2
3.2: Use results. The findings from this project are useful in guiding personnel
preparation guidelines for service coordinators and interagency coordinating bodies, such as state
and local interagency coordinating councils.
Study Overview
A cornerstone of Part C of the Individuals with Disabilities Education Act (IDEA; PL
105-17) is the recognition of the need to create a coordinated system for families that is
comprehensive, accessible, affordable, and appropriate. At the community level, these system
attributes come together most effectively when families feel supported by educational, health,
and social resources that make a difference in the well-being and developmental outcomes of the
child and his or her family (Roberts, Rule, & Innocenti, 1998). As families discover their
community’s resources, they soon learn that some systems are more responsive to their
individual situations and preferences while others provide more prescribed, narrowly focused
services without awareness of a family’s other priorities or other community efforts that may be
helpful. These differences may have immediate and long-term consequences for children,
families, and the service system itself because they involve two variables that serve as the center
piece of this proposed research—efficiency and effectiveness at each of the levels in a system of
care. The efficiency with which a family is able to utilize services and supports to address their
priorities affects how they use services and impact their overall family well being. At the
agency, community, state, and national levels, efficiency affects how public dollars are spent and
the degree to which private/public partnerships are able to meaningfully and appropriately affect
the outcomes they expect to achieve.
This study investigated three commonly used service coordination models to examine the
degree to which services are delivered efficiently, including a cost analysis, as well as their effect
3
on child and family outcomes. To date, no studies have been reported that relate efficiency, cost
and outcomes for children and families to variations within service coordination models currently
being used. The study was in response to the Field-Initiated Research Project CFDA 84.324C,
Invitational Priority (d): Projects that advance knowledge about the coordination of education with
health and social services. It did so both by testing a conceptual framework to investigate the
relationships of the variables mentioned above while at the same time providing information on the
three most commonly used models of service coordination currently in use in Part C programs.
The goal of this project was to identify those service coordination strategies that best support
system efficiency and child and family quality of life and developmental outcomes.
This section describes the selected service coordination models of this study..
Information regarding the study sites, participants, and general research approach is provided
first, followed by specific accomplishments listed by the originally proposed activities.
Selected Service Coordination Models Three distinct service coordination (SC) models were selected for study. As mentioned
in the original proposal, the Opening Doors Project identified three SC models that reflect the
majority of the 228 communities that were surveyed (Roberts, Behl, & Akers, 1996). These
findings guided the selection of the three models to be studied:
1. The Independent model of service coordination: The service coordinator (SC) provides no other EI services and is not housed/employed by an EI direct service provider.
2. The Combined-Roles Model: A primary EI program provides the SC and most therapeutic services, with the SC also providing direct EI services.
3. One-Stop Shopping model: The center serves as a single point of entry for multiple programs, providing SC as well as multi-agency coordinated services in an integrated infrastructure.
Service coordination model communities. Six communities were identified to represent
4
the three service coordination models studied. The specific communities were:
1. Independent service coordination model: Mesa, AZ, and Brevard County, FL.
2. Blended model: Weber County, UT and Farmers Branch, TX.
3. One-Stop Shopping model: Yakima, WA and Norge, VA.
Sites were selected based on their interest in participation, having a sufficient number of
children enrolled for the sample selection, presence of racial/ethnic diversity in the community,
and the capacity to provide needed data for the study. Descriptions of these communities are
provided under the Results section, Objective 1.
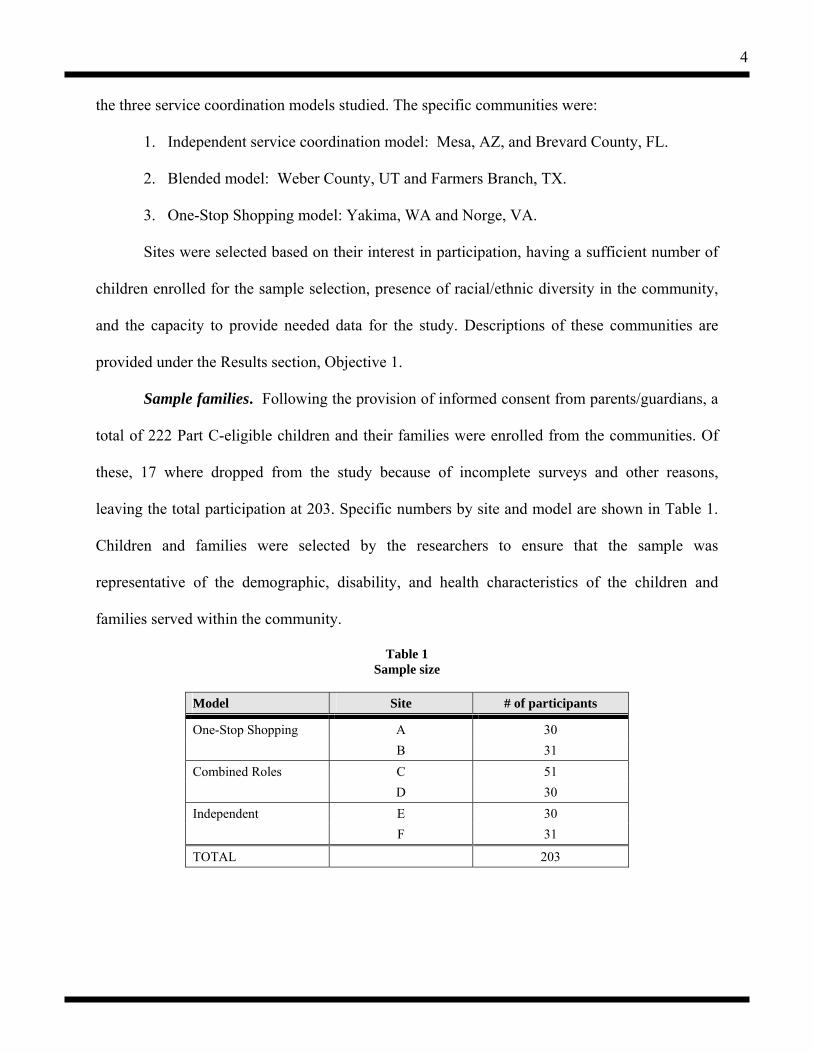
Sample families. Following the provision of informed consent from parents/guardians, a
total of 222 Part C-eligible children and their families were enrolled from the communities. Of
these, 17 where dropped from the study because of incomplete surveys and other reasons,
leaving the total participation at 203. Specific numbers by site and model are shown in Table 1.
Children and families were selected by the researchers to ensure that the sample was
representative of the demographic, disability, and health characteristics of the children and
families served within the community.
Table 1 Sample size
Model Site # of participants
One-Stop Shopping A 30 B 31 Combined Roles C 51 D 30 Independent E 30 F 31
TOTAL 203

5
EIRI staff carefully considered the variables mentioned above as well as other factors that are
important for this study. EIRI staff applied following criteria when randomly selecting children
from the sites:
1. Select those children who are less than 3 years of age during the time of data collection.
2. Select those children who have been enrolled in the Part C program for at least 3 months to ensure that these families have adequate experience within the program.
3. Select those families who are receiving multiple services, which strengthen the importance of service coordination.
4. Select those whose ethnicities match the community demographics while ensuring that each site has representation from families of diverse cultures.
5. Select a fairly equal split by gender. Efforts were made to ensure that no family was excluded from the study due to disability
condition, racial/ethnic heritage, or financial status. For example, alternative response
procedures were developed for families who do not speak English or who cannot read.
Subject recruitment was approached in the following way. The site liaison from each
program took the lead in contacting families and getting the signed informed consent. EIRI has
found that it is more effective and efficient to have one person obtain the consent forms,
provided this is an individual who the family knows and trusts. However, some families who do
not have telephones or perhaps do not speak English required the help of other staff who have
better access and/or skills to communicate with the family. In such cases, the site liaison
requested the help of the service coordinators.
All consents, surveys, interviews, and other instruments were translated into Spanish
since there are a significant number of monolingual Spanish speaking families in the study.
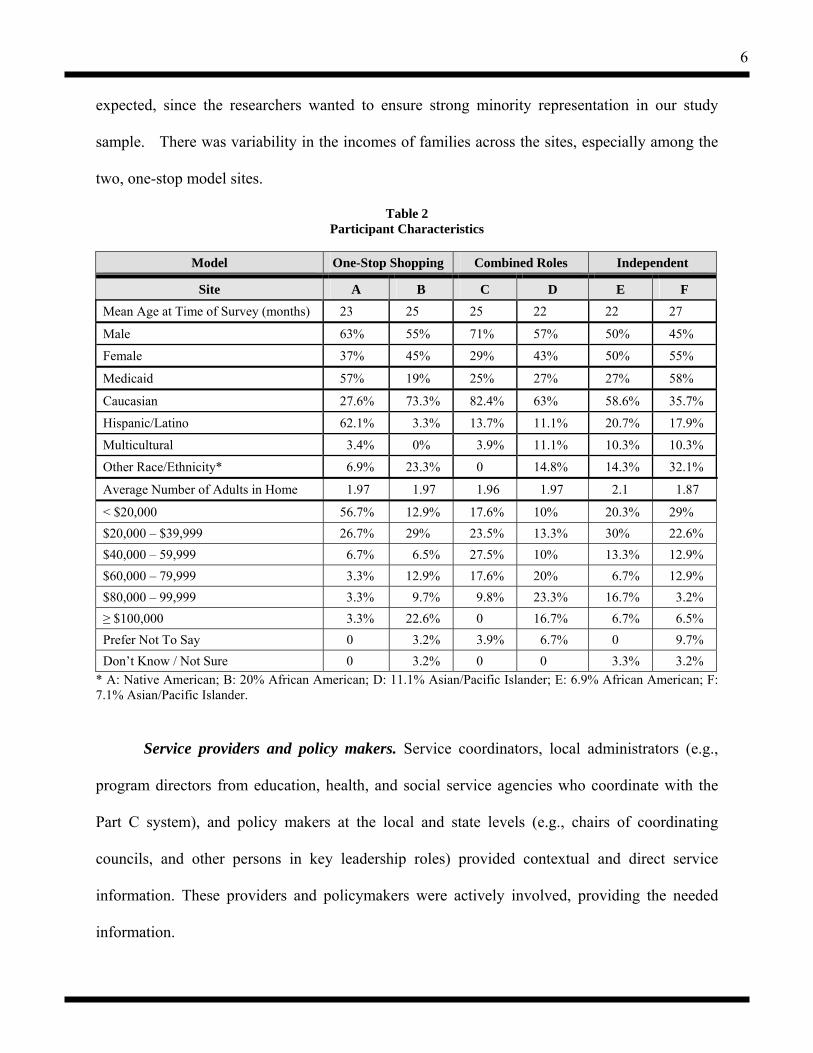
A summary of the subject characteristics is provided in Table 2. As shown in the table,
the sample of children in the study in general was ethnically and economically diverse. This was
6
expected, since the researchers wanted to ensure strong minority representation in our study
sample. There was variability in the incomes of families across the sites, especially among the
two, one-stop model sites.
Table 2 Participant Characteristics
Model One-Stop Shopping Combined Roles Independent
Site A B C D E F
Mean Age at Time of Survey (months) 23 25 25 22 22 27
Male 63% 55% 71% 57% 50% 45%
Female 37% 45% 29% 43% 50% 55%
Medicaid 57% 19% 25% 27% 27% 58%
Caucasian 27.6% 73.3% 82.4% 63% 58.6% 35.7%
Hispanic/Latino 62.1% 3.3% 13.7% 11.1% 20.7% 17.9%
Multicultural 3.4% 0% 3.9% 11.1% 10.3% 10.3%
Other Race/Ethnicity* 6.9% 23.3% 0 14.8% 14.3% 32.1%
Average Number of Adults in Home 1.97 1.97 1.96 1.97 2.1 1.87
< $20,000 56.7% 12.9% 17.6% 10% 20.3% 29% $20,000 – $39,999 26.7% 29% 23.5% 13.3% 30% 22.6% $40,000 – 59,999 6.7% 6.5% 27.5% 10% 13.3% 12.9% $60,000 – 79,999 3.3% 12.9% 17.6% 20% 6.7% 12.9% $80,000 – 99,999 3.3% 9.7% 9.8% 23.3% 16.7% 3.2% ≥ $100,000 3.3% 22.6% 0 16.7% 6.7% 6.5% Prefer Not To Say 0 3.2% 3.9% 6.7% 0 9.7% Don’t Know / Not Sure 0 3.2% 0 0 3.3% 3.2%
* A: Native American; B: 20% African American; D: 11.1% Asian/Pacific Islander; E: 6.9% African American; F: 7.1% Asian/Pacific Islander.
Service providers and policy makers. Service coordinators, local administrators (e.g.,
program directors from education, health, and social service agencies who coordinate with the
Part C system), and policy makers at the local and state levels (e.g., chairs of coordinating
councils, and other persons in key leadership roles) provided contextual and direct service
information. These providers and policymakers were actively involved, providing the needed
information.
7
Contextual Variables
Community Characteristics System Characteristics
*Service Coordinator Characteristics
Outcomes
Child and Family Outcomes2
Demography/Geography, Economy, Politics Involvement, Participation, Approach, Leadership
Expertise, Interpersonal Skill, Role Responsibilities, Case Load
Systems Outcomes1
Funding, Training/Professional Develop., Regulations, Data Collection/Management,
System Point(s) of Entry
Direct Service Outcomes1
*Efficiency (including costs), EquitableDistribution, Abundance, Natural
Environments, Quality
Child Functional Development, Resources, Support, Satisfaction, Family Capacity, Family Quality of Life, Child Quality of Life
* = Additional components/variations on Kagan et al. (1995) model.1 = Relates to OSERS GPRA Part C Objective 12 = Relates to OSERS GPRA Part C Objective 2
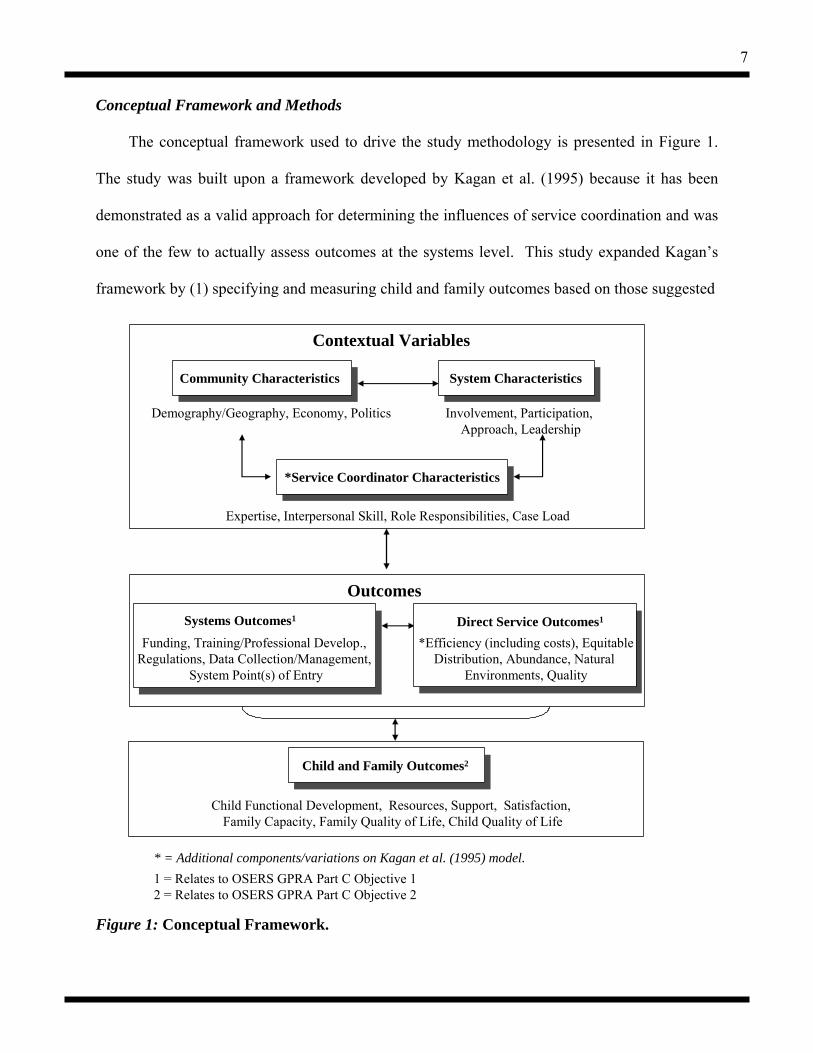
Conceptual Framework and Methods
The conceptual framework used to drive the study methodology is presented in Figure 1.
The study was built upon a framework developed by Kagan et al. (1995) because it has been
demonstrated as a valid approach for determining the influences of service coordination and was
one of the few to actually assess outcomes at the systems level. This study expanded Kagan’s
framework by (1) specifying and measuring child and family outcomes based on those suggested
Figure 1: Conceptual Framework.
8
by Roberts and Wasik (1996) and Konrad (1996), and (2) targeting a population of children with
disabilities, ages birth to three years. This study was the first to apply this conceptual framework
to investigate system and family-level outcomes within three commonly used Part C service
coordination (SC) models. Additionally, this conceptual framework encompasses the outcomes
identified by the Office of Special Education Program’s Government Performance and Results
Act (GPRA) in terms of the targeted outcomes for children and families served by the Part C
system. The application of the conceptual framework was tied to the study objectives; the
specific components of the framework are referenced in the next section in relation to the
objectives.
The study used a multiple-method comparison design to assess the outcomes of three
distinctly different service coordination models. Outcomes was assessed both within each model
and compared between the models to determine the effectiveness of characteristics found across
the models.
Participatory action research (PAR), defined as collaboration with research participants to
drive the study, was applied to the project (i.e., the development of the research methods,
activities, and analysis). The use of PAR has been shown to result in a more sensitive and
comprehensive understanding of the research questions (Innocenti & Roberts, 1999; Jeppson &
Thomas, 1995; Roberts, Rule, & Innocenti, 1998; Turnbull, 1997). A liaison was identified
within each community to facilitate the research activities.
Results
The study objectives are presented below followed by a description of the findings
associated with the objectives. Copies of protocols developed for this study are available upon
request.
9
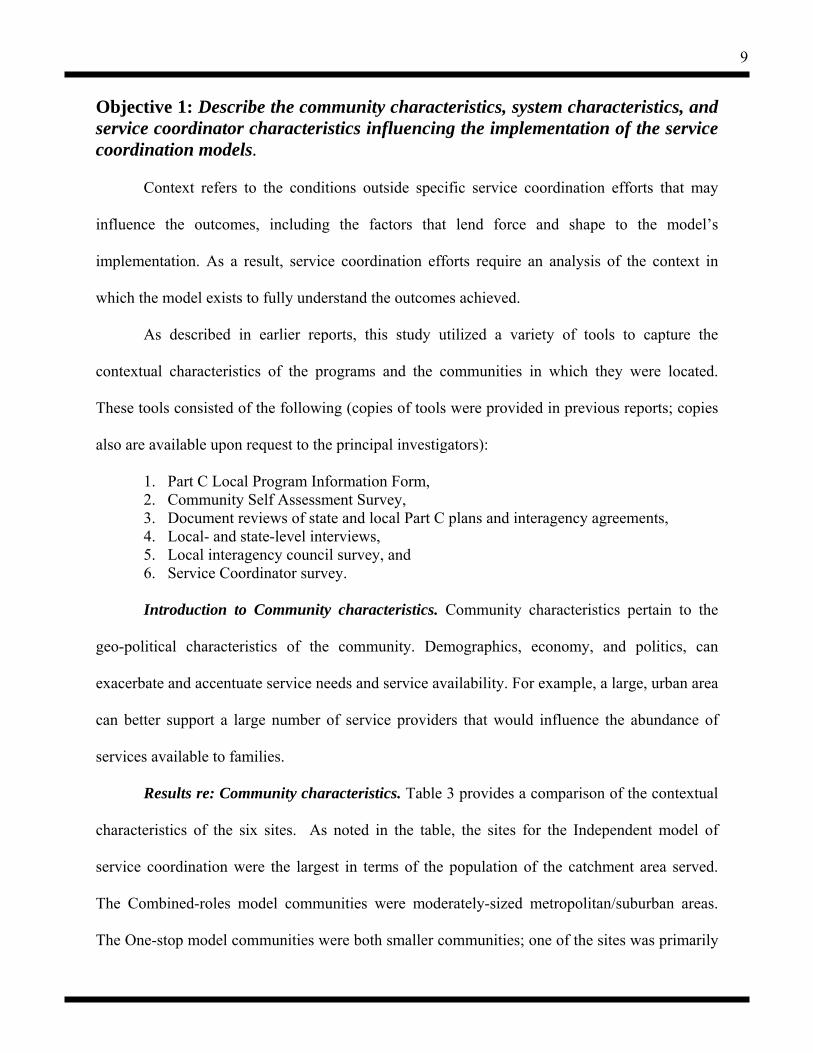
Objective 1: Describe the community characteristics, system characteristics, and service coordinator characteristics influencing the implementation of the service coordination models.
Context refers to the conditions outside specific service coordination efforts that may
influence the outcomes, including the factors that lend force and shape to the model’s
implementation. As a result, service coordination efforts require an analysis of the context in
which the model exists to fully understand the outcomes achieved.
As described in earlier reports, this study utilized a variety of tools to capture the
contextual characteristics of the programs and the communities in which they were located.
These tools consisted of the following (copies of tools were provided in previous reports; copies
also are available upon request to the principal investigators):
1. Part C Local Program Information Form, 2. Community Self Assessment Survey, 3. Document reviews of state and local Part C plans and interagency agreements, 4. Local- and state-level interviews, 5. Local interagency council survey, and 6. Service Coordinator survey.
Introduction to Community characteristics. Community characteristics pertain to the
geo-political characteristics of the community. Demographics, economy, and politics, can
exacerbate and accentuate service needs and service availability. For example, a large, urban area
can better support a large number of service providers that would influence the abundance of
services available to families.
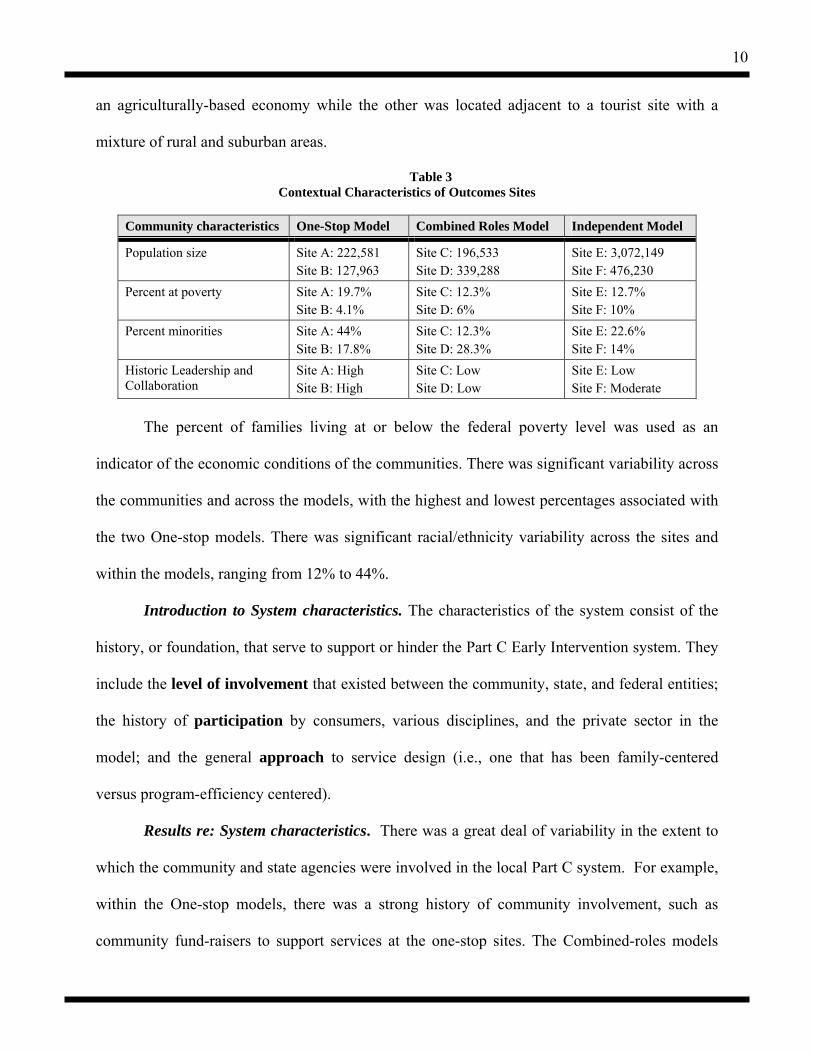
Results re: Community characteristics. Table 3 provides a comparison of the contextual
characteristics of the six sites. As noted in the table, the sites for the Independent model of
service coordination were the largest in terms of the population of the catchment area served.
The Combined-roles model communities were moderately-sized metropolitan/suburban areas.
The One-stop model communities were both smaller communities; one of the sites was primarily
10
an agriculturally-based economy while the other was located adjacent to a tourist site with a
mixture of rural and suburban areas.
Table 3 Contextual Characteristics of Outcomes Sites
Community characteristics One-Stop Model Combined Roles Model Independent Model
Population size Site A: 222,581 Site B: 127,963
Site C: 196,533 Site D: 339,288
Site E: 3,072,149 Site F: 476,230
Percent at poverty Site A: 19.7% Site B: 4.1%
Site C: 12.3% Site D: 6%
Site E: 12.7% Site F: 10%
Percent minorities Site A: 44% Site B: 17.8%
Site C: 12.3% Site D: 28.3%
Site E: 22.6% Site F: 14%
Historic Leadership and Collaboration
Site A: High Site B: High
Site C: Low Site D: Low
Site E: Low Site F: Moderate
The percent of families living at or below the federal poverty level was used as an
indicator of the economic conditions of the communities. There was significant variability across
the communities and across the models, with the highest and lowest percentages associated with
the two One-stop models. There was significant racial/ethnicity variability across the sites and
within the models, ranging from 12% to 44%.
Introduction to System characteristics. The characteristics of the system consist of the
history, or foundation, that serve to support or hinder the Part C Early Intervention system. They
include the level of involvement that existed between the community, state, and federal entities;
the history of participation by consumers, various disciplines, and the private sector in the
model; and the general approach to service design (i.e., one that has been family-centered
versus program-efficiency centered).
Results re: System characteristics. There was a great deal of variability in the extent to
which the community and state agencies were involved in the local Part C system. For example,
within the One-stop models, there was a strong history of community involvement, such as
community fund-raisers to support services at the one-stop sites. The Combined-roles models
11
and the Independent models had a history of some involvement, such as child-find activities,
although little evidence of strong leadership historically to support the broader service system. In
terms of state involvement, the Independent models reported a strong influence by state
regulations in driving their Part C service system; both of these sites also identified themselves
as employees of a state agency. The Combined roles sites and the One-stop sites had some
involvement in terms of the state offices directing funding and parent fees; however, since they
were awarded contracts with the state to provide Part C services, they appeared to have a little
more autonomy than the Independent sites. Additionally, the One-stop sites had involvement at
the federal level in terms of being the recipients of federal grants. Both of the Independent
model sites described some statewide campaigns to support children, such as ensuring healthy
development or school readiness for all children.
The extent to which interagency collaboration and leadership has been in place
historically was assessed via a variety of descriptive survey tools. The combined-roles sites did
not report a strong history of interagency collaboration or any particular leaders that were laying
a foundation for interagency collaboration. Within the Independent model, one of the sites had
little to indicate strong leaders which drove the design of the system at the community level; the
other Independent site had some leadership in place, particularly in terms of agencies and pre-
existing councils to guide the Early Intervention system.
In terms of the approach to services, all of the sites appeared to have a strong focus on
family-centered services. This was most likely due to the policies and regulations established by
Part H and later Part C of IDEA.
Introduction to Service Coordinator Characteristics. Service coordinator characteristics
involve the expertise of the service coordinator in terms of academic degree and area of study
12
and the size of their case load, two factors that have been reported to influence family
satisfaction outcomes. For example, a service coordinator who does not have the expertise in
knowing the range of available services may influence the abundance and quality of services
provided to families. The interpersonal skills in terms of being responsive and culturally
competent in their interactions were evaluated by the families, and these are part of the family
well-being outcomes.
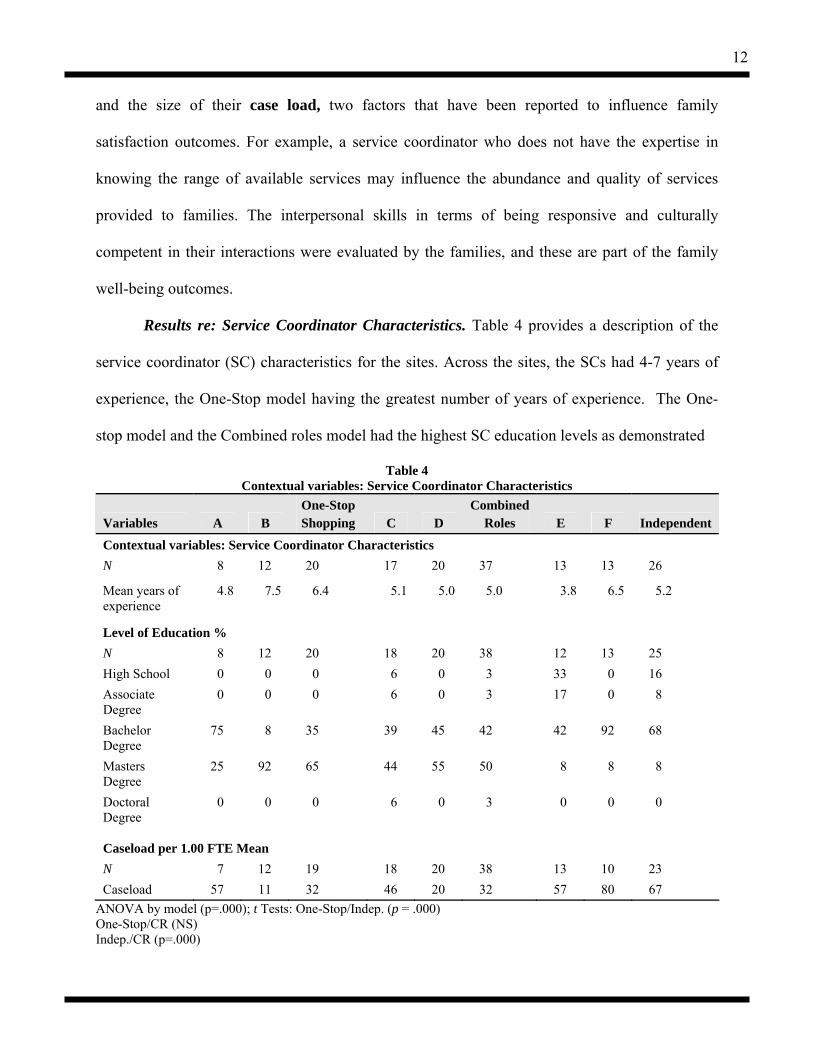
Results re: Service Coordinator Characteristics. Table 4 provides a description of the
service coordinator (SC) characteristics for the sites. Across the sites, the SCs had 4-7 years of
experience, the One-Stop model having the greatest number of years of experience. The One-
stop model and the Combined roles model had the highest SC education levels as demonstrated
Table 4 Contextual variables: Service Coordinator Characteristics
Variables A B One-Stop Shopping C D
Combined Roles E F Independent
Contextual variables: Service Coordinator Characteristics N 8 12 20 17 20 37 13 13 26
Mean years of experience
4.8 7.5 6.4 5.1 5.0 5.0 3.8 6.5 5.2
Level of Education % N 8 12 20 18 20 38 12 13 25 High School 0 0 0 6 0 3 33 0 16 Associate Degree
0 0 0 6 0 3 17 0 8
Bachelor Degree
75 8 35 39 45 42 42 92 68
Masters Degree
25 92 65 44 55 50 8 8 8
Doctoral Degree
0 0 0 6 0 3 0 0 0
Caseload per 1.00 FTE Mean N 7 12 19 18 20 38 13 10 23 Caseload 57 11 32 46 20 32 57 80 67
ANOVA by model (p=.000); t Tests: One-Stop/Indep. (p = .000) One-Stop/CR (NS) Indep./CR (p=.000)

13
by the majority holding master’s degrees. It is important to note that there was variability in who
provided the service coordination among the two One-stop model sites. Site A used a “dedicated
service coordination” model whereby the service coordinator provided only service coordination
services. Site B utilized a “combined roles” model within their One-stop model. Given the nature
of the combined roles model whereby therapists often serve as service coordinators, the higher
education level for those sites using a combined roles model of service coordination is logical.
The Independent Model service coordinators (SC’s) had the lowest education level, with
most having a bachelor’s degree and some with associate degrees. The SC’s from the One-Stop
model also had the most years of experience working with children and families; years of
experience for the Combined Roles and the One-Stop model were essentially the same.
Objective 2: Describe the system outcomes and direct service outcomes associated with the three service coordination models.
Introduction to system outcomes. System outcomes represent the resulting infrastructure
to support the service system, which comprises funding for service coordination and services;
training/professional development in coordinating services; policies to support coordination;
data collection/management to facilitate coordination and avoid duplication; and the system
points of entry to allow families to access services easily and through multiple avenues. Although
the ultimate goal of service coordination is the improved outcomes for children and families,
reforms in improving the infrastructure itself are viewed as interim outcomes (Schorr, 1994).
Results re: System Outcomes. The strength of the community local interagency councils
was assessed for each of the communities via interviews and surveys (see Table 5). Both One-
stop models had active interagency councils, typically containing various subcommittees as well
as an administrative tier and a direct service provider tier. Family participation on councils was
14
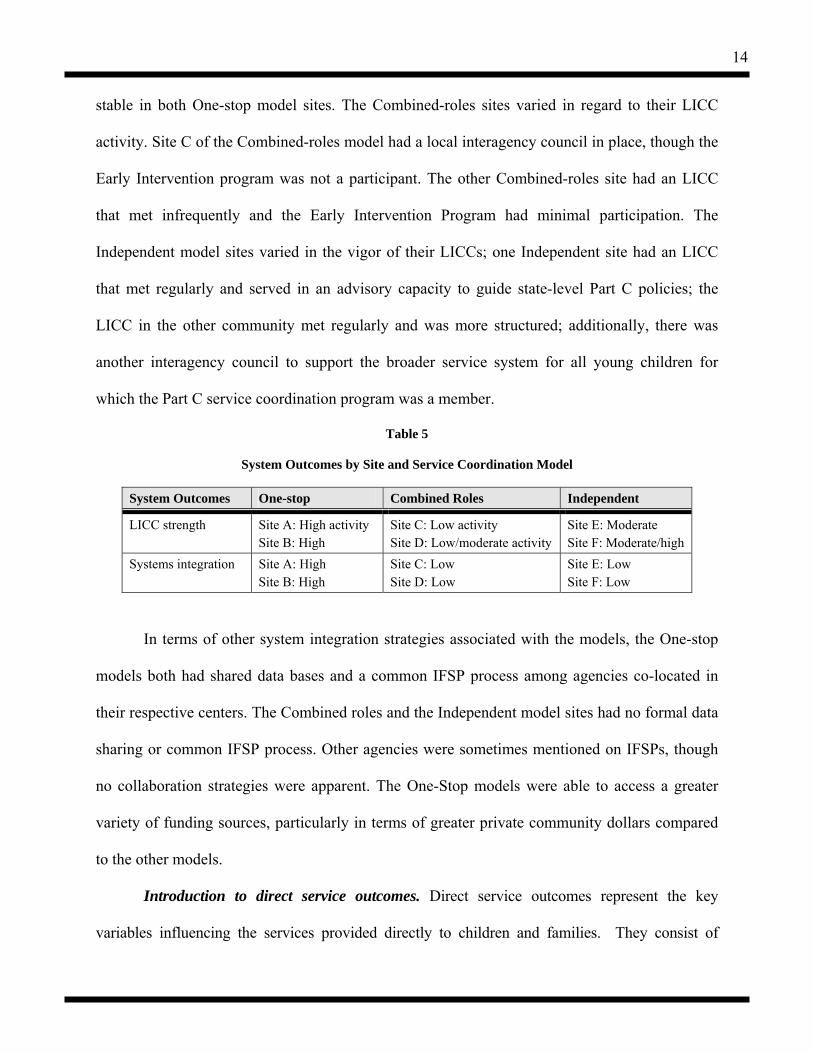
stable in both One-stop model sites. The Combined-roles sites varied in regard to their LICC
activity. Site C of the Combined-roles model had a local interagency council in place, though the
Early Intervention program was not a participant. The other Combined-roles site had an LICC
that met infrequently and the Early Intervention Program had minimal participation. The
Independent model sites varied in the vigor of their LICCs; one Independent site had an LICC
that met regularly and served in an advisory capacity to guide state-level Part C policies; the
LICC in the other community met regularly and was more structured; additionally, there was
another interagency council to support the broader service system for all young children for
which the Part C service coordination program was a member.
Table 5
System Outcomes by Site and Service Coordination Model
System Outcomes One-stop Combined Roles Independent
LICC strength Site A: High activity Site B: High
Site C: Low activity Site D: Low/moderate activity
Site E: Moderate Site F: Moderate/high
Systems integration Site A: High Site B: High
Site C: Low Site D: Low
Site E: Low Site F: Low
In terms of other system integration strategies associated with the models, the One-stop
models both had shared data bases and a common IFSP process among agencies co-located in
their respective centers. The Combined roles and the Independent model sites had no formal data
sharing or common IFSP process. Other agencies were sometimes mentioned on IFSPs, though
no collaboration strategies were apparent. The One-Stop models were able to access a greater
variety of funding sources, particularly in terms of greater private community dollars compared
to the other models.
Introduction to direct service outcomes. Direct service outcomes represent the key
variables influencing the services provided directly to children and families. They consist of
15
efficiency, defined as increased savings in the amount of time required to provide services;
equitable distribution of funds and services more evenly throughout the community to ensure
access to all children and families; abundance in the type and intensity of services provided; the
provision of services in natural environments that are community-based, developmentally
appropriate, and inclusive; and overall quality of services that are coordinated, culturally
competent, and family-centered.
Direct service outcomes results. Direct service outcomes consisted of measuring (a)
direct services provided to children and families measured via family self-report survey and
prescribed services listed on the IFSP’s, and (b) time service coordinators spend on activities
such as accessing services, coordinating services, determining eligibility, and completing
paperwork for monitoring via the Service Coordinator Time Diary Form completed for four one-
week time samples; and (c) costs of service coordination per child for those enrolled in the Part
C program.
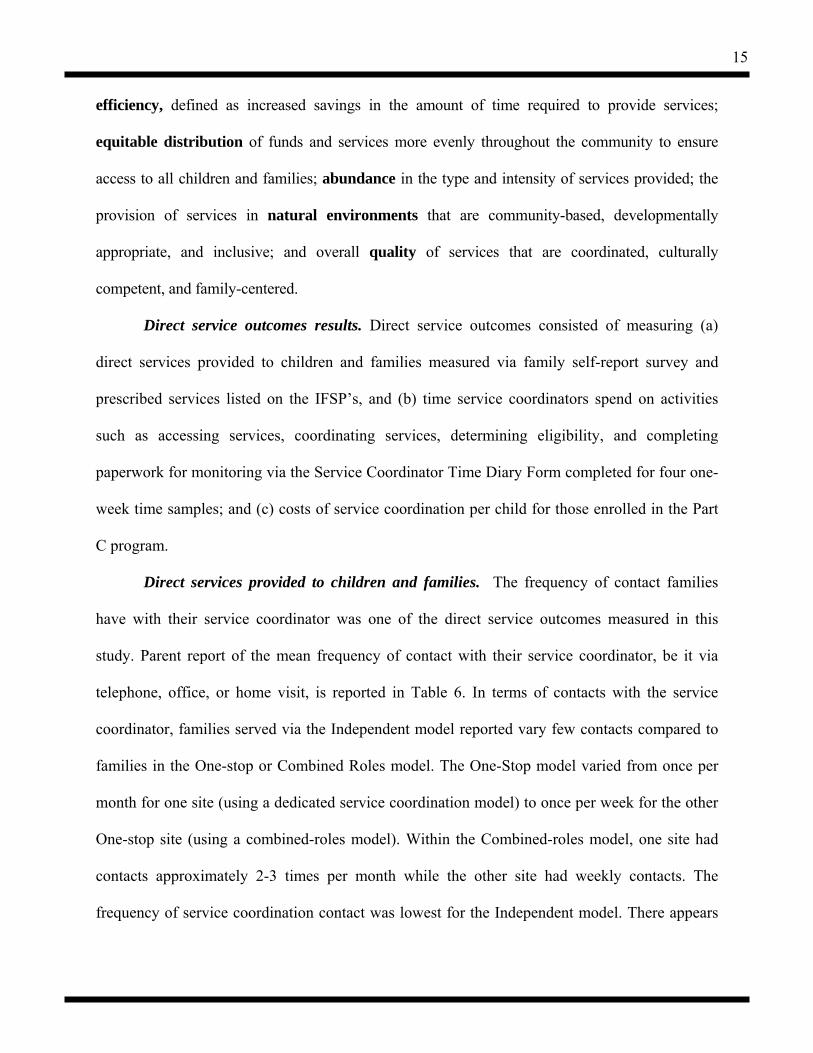
Direct services provided to children and families. The frequency of contact families
have with their service coordinator was one of the direct service outcomes measured in this
study. Parent report of the mean frequency of contact with their service coordinator, be it via
telephone, office, or home visit, is reported in Table 6. In terms of contacts with the service
coordinator, families served via the Independent model reported vary few contacts compared to
families in the One-stop or Combined Roles model. The One-Stop model varied from once per
month for one site (using a dedicated service coordination model) to once per week for the other
One-stop site (using a combined-roles model). Within the Combined-roles model, one site had
contacts approximately 2-3 times per month while the other site had weekly contacts. The
frequency of service coordination contact was lowest for the Independent model. There appears
16
to be a direct, negative relationship between the caseload size of the service coordinators and
frequency of parent contacts.
Table 6 Direct service outcome: Frequency of contact with Service Coordinator
Site Median
One-Stop 3 = Two to three times a month A B
4 = Once a month 2 = Once a week
Combined Roles 3 = Two to three times a month C D
3 = Two to three times a month 2 = Once a week
Independent 5 = Every two to three months E F
5 = Every two to three months 5 = Every two to three months
Note. A Likert Scale was used ranging from 1 = several times a week to 7 = every 7-12 months.
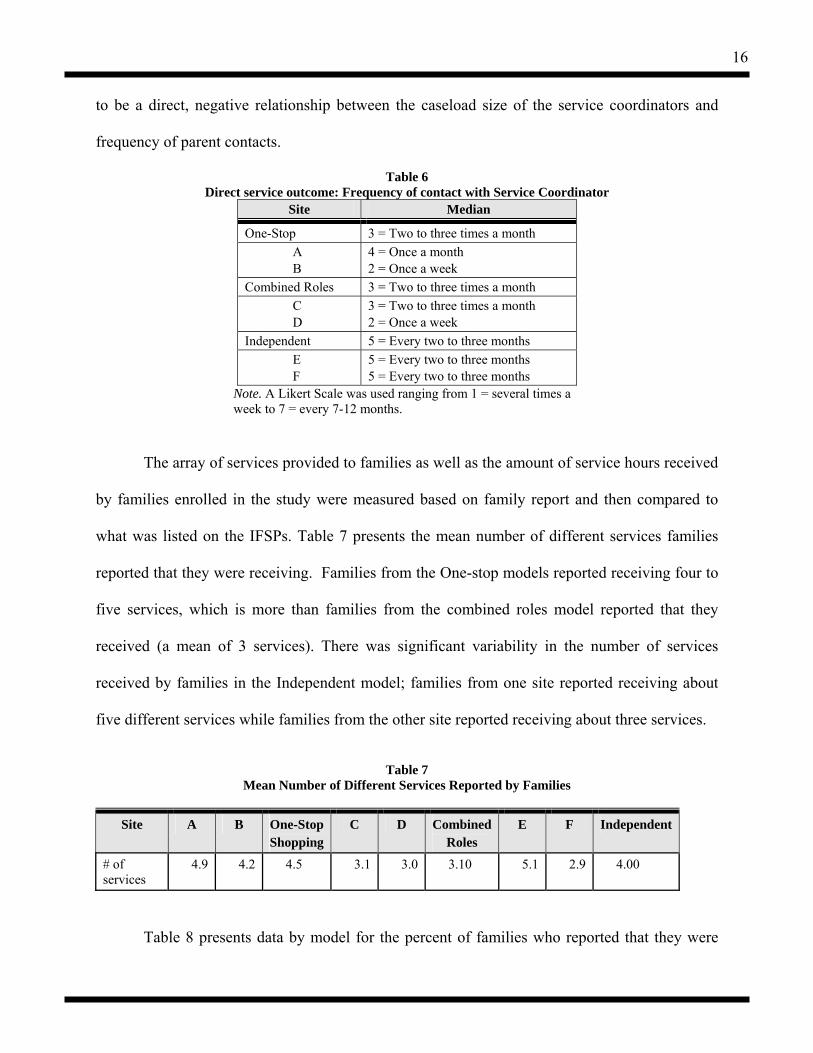
The array of services provided to families as well as the amount of service hours received
by families enrolled in the study were measured based on family report and then compared to
what was listed on the IFSPs. Table 7 presents the mean number of different services families
reported that they were receiving. Families from the One-stop models reported receiving four to
five services, which is more than families from the combined roles model reported that they
received (a mean of 3 services). There was significant variability in the number of services
received by families in the Independent model; families from one site reported receiving about
five different services while families from the other site reported receiving about three services.
Table 7
Mean Number of Different Services Reported by Families
Site A B One-Stop Shopping
C D CombinedRoles
E F Independent
# of services
4.9 4.2 4.5 3.1 3.0 3.10 5.1 2.9 4.00
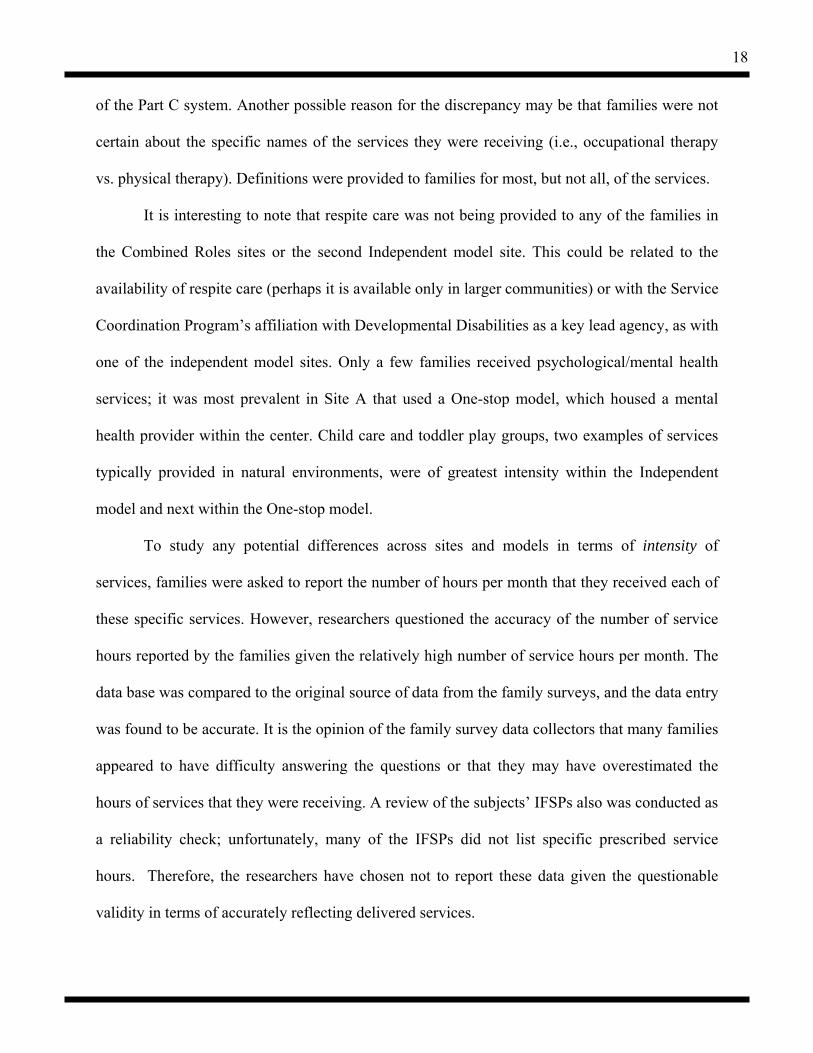
Table 8 presents data by model for the percent of families who reported that they were

17
receiving compared to what was listed as prescribed on their IFSP. These data show
discrepancies between what was listed on the IFSP versus what parents reported that they were
getting. There are multiple theories as to why these differences occurred. First, families may
have accessed services on their own outside of what the Part C program prescribed; however,
families typically responded “no” when asked on the survey, “are there any services that you are
getting that are not on the IFSP.” It could also be that families don’t perceive “child care” or
“respite care” as Part C services per se, but may view them as something they get that is outside
Table 8
Direct Service Outcome: Services Received According to Family and IFSP Report One-Stop Combined Roles Independent
Services % IFSP Reported
% Family Reported
% IFSP Reported
% Family Reported
% IFSP Reported
% Family Reported
Speech/Language 57.4 70.5 60.5 70.4 88.3 75.0 Occupational Therapy 47.5 41.7 40.7 38.8 68.3 65.0 Physical Therapy 57.4 60.0 27.2 42.0 71.7 61.7 Mental Health Counseling 0 0 0 0 1.7 0 Health Services (including in-home nursing) 27.9 15.0 4.9 3.7 0 5.0
Social Work 3.3 11.7 0 3.7 0 3.3 Vision Services 16.4 13.3 3.7 6.2 1.7 13.3 Audiology Services 27.9 18.3 1.2 8.6 6.7 10.0 Nutrition Services 24.6 33.3 1.2 11.1 0 11.7 Assistive Technology 3.3 8.3 0 6.2 10.0 8.3 Toddler Play Groups 1.6 42.6 12.3 32.5 0 11.7 Child Care 0 21.7 0 13.8 0 18.3 Respite Care 0 10.0 0 3.7 21.7 18.3 EI Special Instruction 42.6 26.2 3.7 19.0 63.3 40.0 Family & Parent Training 44.3 11.7 2.5 13.6 0 8.3 Parent-to-Parent Activities 0 23.3 8.6 4.9 1.7 8.3 Psychologist or Behavior Specialist 0 3.3 0 3.7 0 1.7
Psychological Services for Family 1.6 5.0 0 2.5 0 1.7
Transportation 18.0 16.9 0 6.2 0 10.0 Other Services Being Provided 11.5 26.7 16.0 16.0 8.3 23.3
18
of the Part C system. Another possible reason for the discrepancy may be that families were not
certain about the specific names of the services they were receiving (i.e., occupational therapy
vs. physical therapy). Definitions were provided to families for most, but not all, of the services.
It is interesting to note that respite care was not being provided to any of the families in
the Combined Roles sites or the second Independent model site. This could be related to the
availability of respite care (perhaps it is available only in larger communities) or with the Service
Coordination Program’s affiliation with Developmental Disabilities as a key lead agency, as with
one of the independent model sites. Only a few families received psychological/mental health
services; it was most prevalent in Site A that used a One-stop model, which housed a mental
health provider within the center. Child care and toddler play groups, two examples of services
typically provided in natural environments, were of greatest intensity within the Independent
model and next within the One-stop model.
To study any potential differences across sites and models in terms of intensity of
services, families were asked to report the number of hours per month that they received each of
these specific services. However, researchers questioned the accuracy of the number of service
hours reported by the families given the relatively high number of service hours per month. The
data base was compared to the original source of data from the family surveys, and the data entry
was found to be accurate. It is the opinion of the family survey data collectors that many families
appeared to have difficulty answering the questions or that they may have overestimated the
hours of services that they were receiving. A review of the subjects’ IFSPs also was conducted as
a reliability check; unfortunately, many of the IFSPs did not list specific prescribed service
hours. Therefore, the researchers have chosen not to report these data given the questionable
validity in terms of accurately reflecting delivered services.
19
Based on these data, it appears that there is not a strong relationship between the number
of various services received and the service coordination model itself. There appears to be some
variability in the receipt of some specific services; more families served by the One-stop Model
received health-related services, and more families in the Independent Model received respite.
Further analysis is needed to determine other factors that may influence this variability, i.e., the
lead agency, services available in the community.
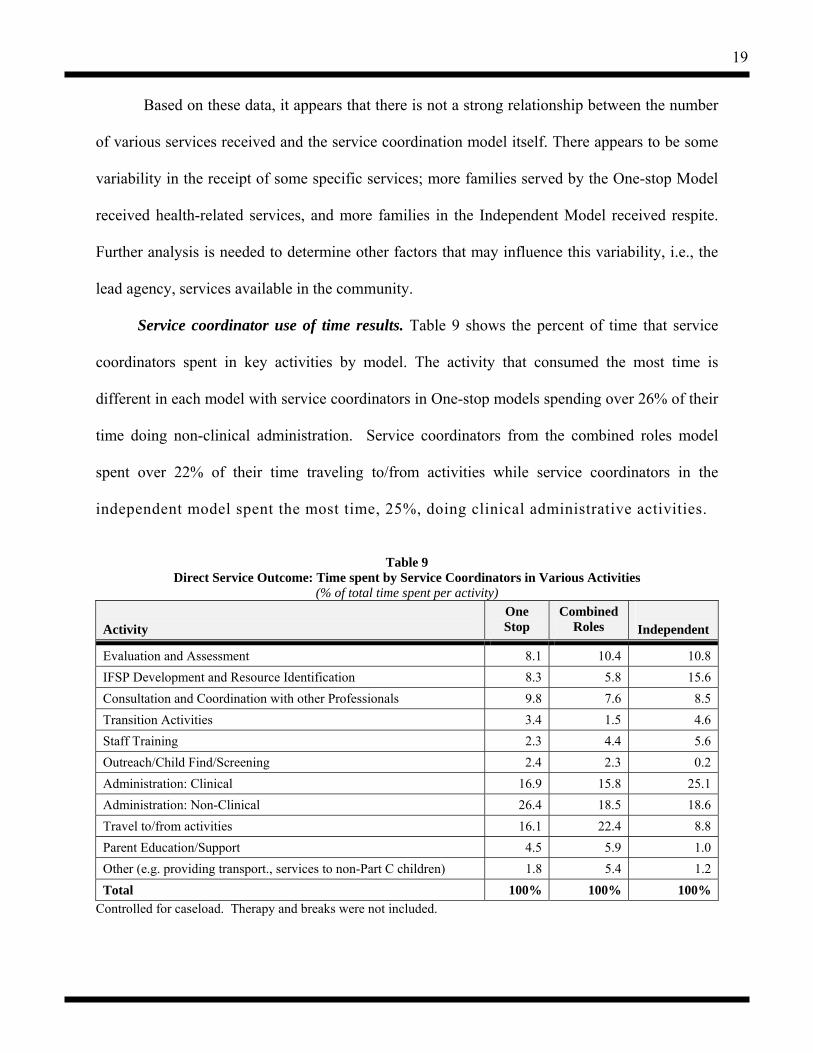
Service coordinator use of time results. Table 9 shows the percent of time that service
coordinators spent in key activities by model. The activity that consumed the most time is
different in each model with service coordinators in One-stop models spending over 26% of their
time doing non-clinical administration. Service coordinators from the combined roles model
spent over 22% of their time traveling to/from activities while service coordinators in the
independent model spent the most time, 25%, doing clinical administrative activities.
Table 9
Direct Service Outcome: Time spent by Service Coordinators in Various Activities (% of total time spent per activity)
Activity
One Stop
Combined Roles
Independent
Evaluation and Assessment 8.1 10.4 10.8 IFSP Development and Resource Identification 8.3 5.8 15.6 Consultation and Coordination with other Professionals 9.8 7.6 8.5 Transition Activities 3.4 1.5 4.6 Staff Training 2.3 4.4 5.6 Outreach/Child Find/Screening 2.4 2.3 0.2 Administration: Clinical 16.9 15.8 25.1 Administration: Non-Clinical 26.4 18.5 18.6 Travel to/from activities 16.1 22.4 8.8 Parent Education/Support 4.5 5.9 1.0 Other (e.g. providing transport., services to non-Part C children) 1.8 5.4 1.2 Total 100% 100% 100%
Controlled for caseload. Therapy and breaks were not included.
20
Administration, clinical and nonclinical consumed a much larger portion of the service
coordinator’s time than other activities—over 40% for the one stop and independent models and
over 34% for the combined role model.
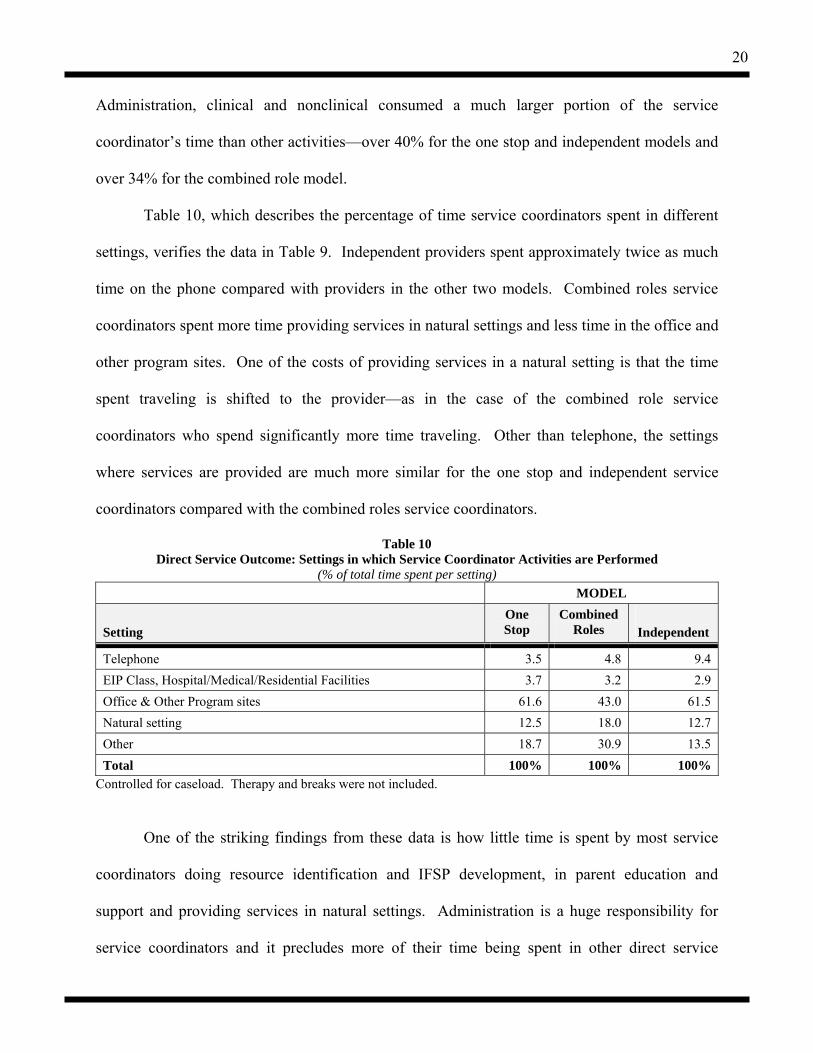
Table 10, which describes the percentage of time service coordinators spent in different
settings, verifies the data in Table 9. Independent providers spent approximately twice as much
time on the phone compared with providers in the other two models. Combined roles service
coordinators spent more time providing services in natural settings and less time in the office and
other program sites. One of the costs of providing services in a natural setting is that the time
spent traveling is shifted to the provider—as in the case of the combined role service
coordinators who spend significantly more time traveling. Other than telephone, the settings
where services are provided are much more similar for the one stop and independent service
coordinators compared with the combined roles service coordinators.
Table 10 Direct Service Outcome: Settings in which Service Coordinator Activities are Performed
(% of total time spent per setting) MODEL
Setting
One Stop
Combined Roles
Independent
Telephone 3.5 4.8 9.4 EIP Class, Hospital/Medical/Residential Facilities 3.7 3.2 2.9 Office & Other Program sites 61.6 43.0 61.5 Natural setting 12.5 18.0 12.7 Other 18.7 30.9 13.5 Total 100% 100% 100%
Controlled for caseload. Therapy and breaks were not included.
One of the striking findings from these data is how little time is spent by most service
coordinators doing resource identification and IFSP development, in parent education and
support and providing services in natural settings. Administration is a huge responsibility for
service coordinators and it precludes more of their time being spent in other direct service
21
activities and in providing services to children and families in a natural environment.
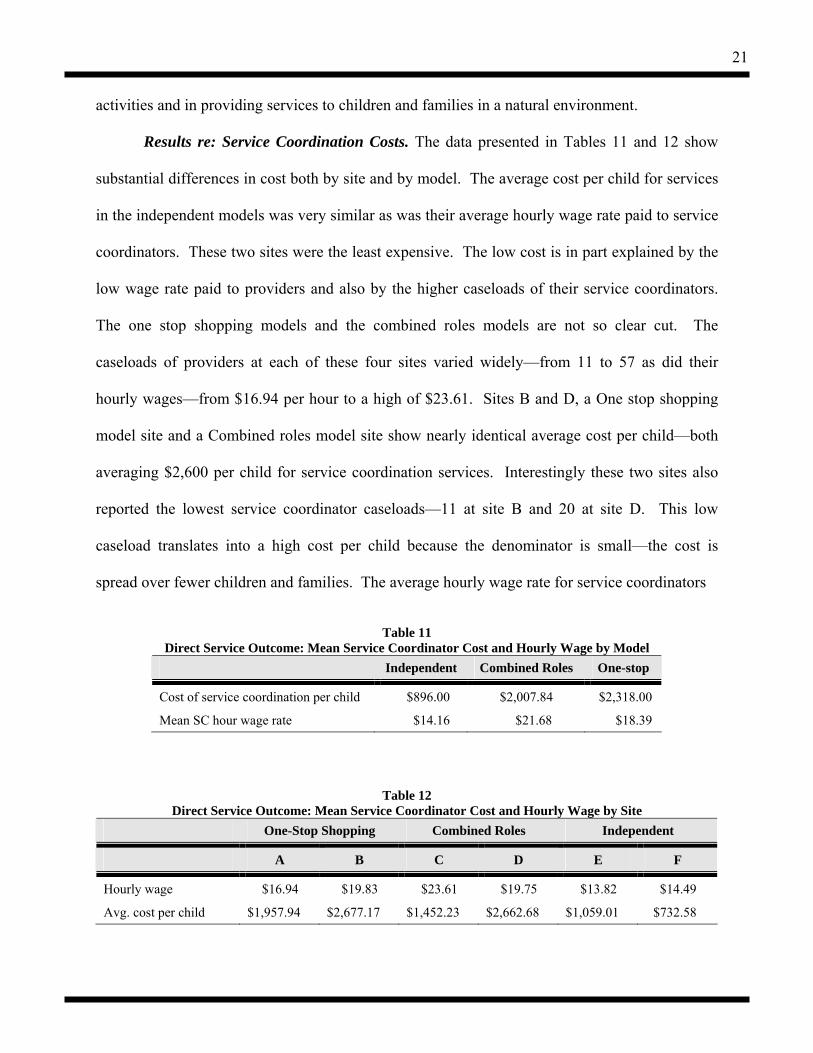
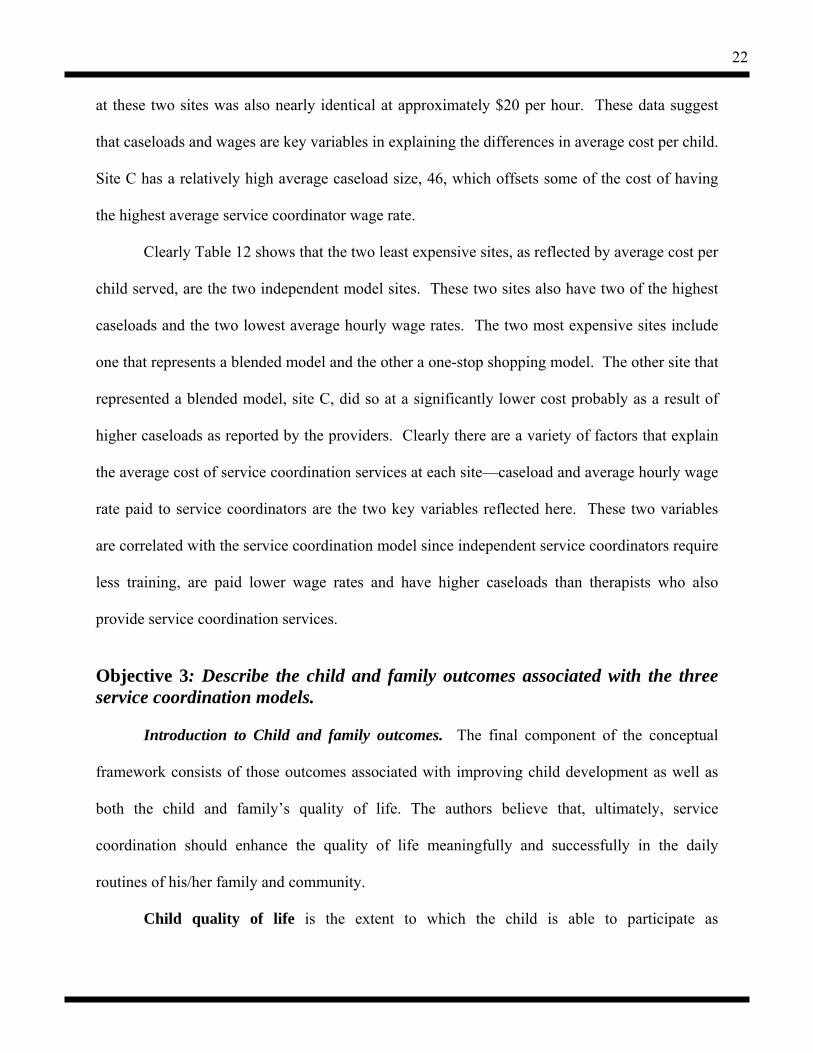
Results re: Service Coordination Costs. The data presented in Tables 11 and 12 show
substantial differences in cost both by site and by model. The average cost per child for services
in the independent models was very similar as was their average hourly wage rate paid to service
coordinators. These two sites were the least expensive. The low cost is in part explained by the
low wage rate paid to providers and also by the higher caseloads of their service coordinators.
The one stop shopping models and the combined roles models are not so clear cut. The
caseloads of providers at each of these four sites varied widely—from 11 to 57 as did their
hourly wages—from $16.94 per hour to a high of $23.61. Sites B and D, a One stop shopping
model site and a Combined roles model site show nearly identical average cost per child—both
averaging $2,600 per child for service coordination services. Interestingly these two sites also
reported the lowest service coordinator caseloads—11 at site B and 20 at site D. This low
caseload translates into a high cost per child because the denominator is small—the cost is
spread over fewer children and families. The average hourly wage rate for service coordinators
Table 11
Direct Service Outcome: Mean Service Coordinator Cost and Hourly Wage by Model Independent Combined Roles One-stop
Cost of service coordination per child $896.00 $2,007.84 $2,318.00
Mean SC hour wage rate $14.16 $21.68 $18.39
Table 12 Direct Service Outcome: Mean Service Coordinator Cost and Hourly Wage by Site
One-Stop Shopping Combined Roles Independent
A B C D E F
Hourly wage $16.94 $19.83 $23.61 $19.75 $13.82 $14.49
Avg. cost per child $1,957.94 $2,677.17 $1,452.23 $2,662.68 $1,059.01 $732.58
22
at these two sites was also nearly identical at approximately $20 per hour. These data suggest
that caseloads and wages are key variables in explaining the differences in average cost per child.
Site C has a relatively high average caseload size, 46, which offsets some of the cost of having
the highest average service coordinator wage rate.
Clearly Table 12 shows that the two least expensive sites, as reflected by average cost per
child served, are the two independent model sites. These two sites also have two of the highest
caseloads and the two lowest average hourly wage rates. The two most expensive sites include
one that represents a blended model and the other a one-stop shopping model. The other site that
represented a blended model, site C, did so at a significantly lower cost probably as a result of
higher caseloads as reported by the providers. Clearly there are a variety of factors that explain
the average cost of service coordination services at each site—caseload and average hourly wage
rate paid to service coordinators are the two key variables reflected here. These two variables
are correlated with the service coordination model since independent service coordinators require
less training, are paid lower wage rates and have higher caseloads than therapists who also
provide service coordination services.
Objective 3: Describe the child and family outcomes associated with the three service coordination models.
Introduction to Child and family outcomes. The final component of the conceptual
framework consists of those outcomes associated with improving child development as well as
both the child and family’s quality of life. The authors believe that, ultimately, service
coordination should enhance the quality of life meaningfully and successfully in the daily
routines of his/her family and community.
Child quality of life is the extent to which the child is able to participate as
23
independently as possible with needed accommodations. Family outcomes are defined in terms
of (1) resources and supports, both formal and informal; (2) perceived satisfaction with the
type, quantity, and appropriateness of the service system with particular attention to coordination
among service entities; (3) the extent to which families report that early intervention services
have increased their capacity to enhance their child’s development, identify service needs,
obtain and influence services provided, advocate for their children; and (4) overall family
quality of life, defined as the extent to which families can maintain meaningful and sustainable
daily routines as defined by individual families. These outcomes reflect GPRA Obj. #2, Indicator
2: the percentage of families that report that EI services have increased their capacity to enhance
their child’s development will increase.
Introductions to Child developmental outcomes. Specific child outcomes consist of
child development defined as those skills which enhance the child’s ability to participate as
independently as possible with any needed accommodations. This outcome directly relates to
GPRA Obj.#2, Indicator 1: the percentage of children participating in the part C program that
demonstrate improved and sustained functional abilities will increase. To measure child
development, the study planned to obtain extant child developmental assessment scores. The
reasons for using existing assessment results are: (a) families report that the child assessment
process is typically a negative experience that emphasizes their child’s delays, (b) families report
frustration with the duplication of assessment efforts rather than relying on currently-existing
information, and (c) the administration of individualized child functioning measures is expensive
both in tester costs and parent time.
Given the strong concurrent validity among most developmental measures, the
researchers intended to use age equivalent domain scores at time of entry into the program and
24
later assessments corresponding with the collection of the study-designed family survey. The
directors at the study sites initially stated that these scores were available and in a data base. The
researchers discovered that in reality several of the sites do not collect comprehensive
assessment data on children enrolled in the study. For one of the Independent model sites, many
children were enrolled based on diagnosis and therefore testing was not necessary for eligibility.
For several of the other sites, testing was conducted only in the domains of suspected delay and
therefore comprehensive data were not available. Based on conversations with other researchers
and providers in the field, this lack of developmental data to document progress is a consistent
problem throughout the country.
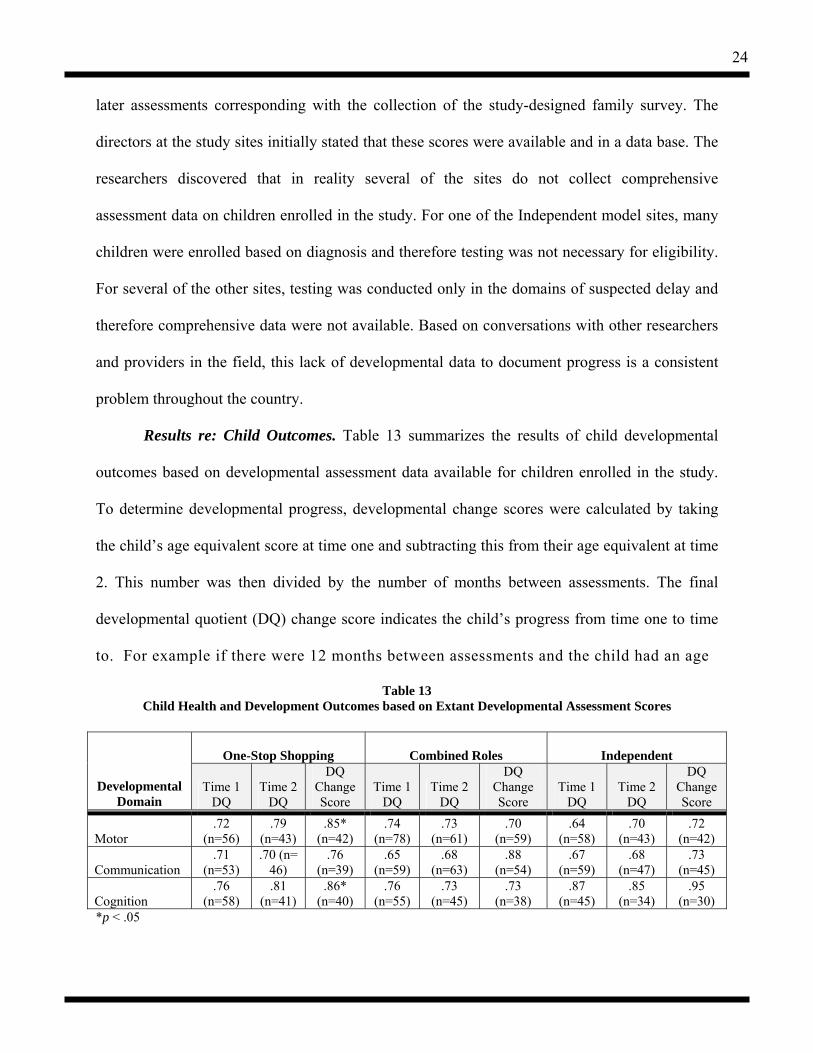
Results re: Child Outcomes. Table 13 summarizes the results of child developmental
outcomes based on developmental assessment data available for children enrolled in the study.
To determine developmental progress, developmental change scores were calculated by taking
the child’s age equivalent score at time one and subtracting this from their age equivalent at time
2. This number was then divided by the number of months between assessments. The final
developmental quotient (DQ) change score indicates the child’s progress from time one to time
to. For example if there were 12 months between assessments and the child had an age
Table 13 Child Health and Development Outcomes based on Extant Developmental Assessment Scores
One-Stop Shopping
Combined Roles
Independent
Developmental Domain
Time 1 DQ
Time 2 DQ
DQ Change Score
Time 1 DQ
Time 2 DQ
DQ Change Score
Time 1 DQ
Time 2 DQ
DQ Change Score
Motor .72
(n=56) .79
(n=43) .85*
(n=42) .74
(n=78) .73
(n=61) .70
(n=59) .64
(n=58) .70
(n=43) .72
(n=42)
Communication .71
(n=53) .70 (n=
46) .76
(n=39) .65
(n=59) .68
(n=63) .88
(n=54) .67
(n=59) .68
(n=47) .73
(n=45)
Cognition .76
(n=58) .81
(n=41) .86*
(n=40) .76
(n=55) .73
(n=45) .73
(n=38) .87
(n=45) .85
(n=34) .95
(n=30) *p < .05
25
equivalent score of 4 months at time one and 16 months at time two the resulting DQ change
score would be 1.0. This would indicate one month’s growth per month of service.
Child development scores were analyzed between and within models. No statistically
significant results were found between models. Statistically significant differences in
developmental change scores were found in both the motor and cognitive domains in the One-
stop model only.
As noted in the n’s reported in the table, domain data were missing for roughly one third
to one half of the subjects across models. Therefore, the researchers are not confident in drawing
conclusions based on these data regarding the relationship among service coordination model
and child development outcomes.
Introduction to Family outcomes. These outcomes consisted of parent/caregiver ratings
of the referral process, service coordination, helpfulness of services, supports, resources, and
perceived parent capacity to support their child’s development. A Family Self Report Survey was
developed and administered via telephone or written responses. This survey goes beyond mere
satisfaction ratings to obtain information on reasons why families are dissatisfied, which will help
guide recommendations for improvements in the service system (Roberts, Innocenti, Judd, Taylor,
& Morris, 1998). The survey obtains responses using discrete counts, Likert-type scales, and
open-ended responses and took approximately 30-40 minutes to complete. The telephone version
of the survey was administered to all of the Spanish-speaking families using a translator well
trained in ensuring that the questions and responses were fully understood and captured.
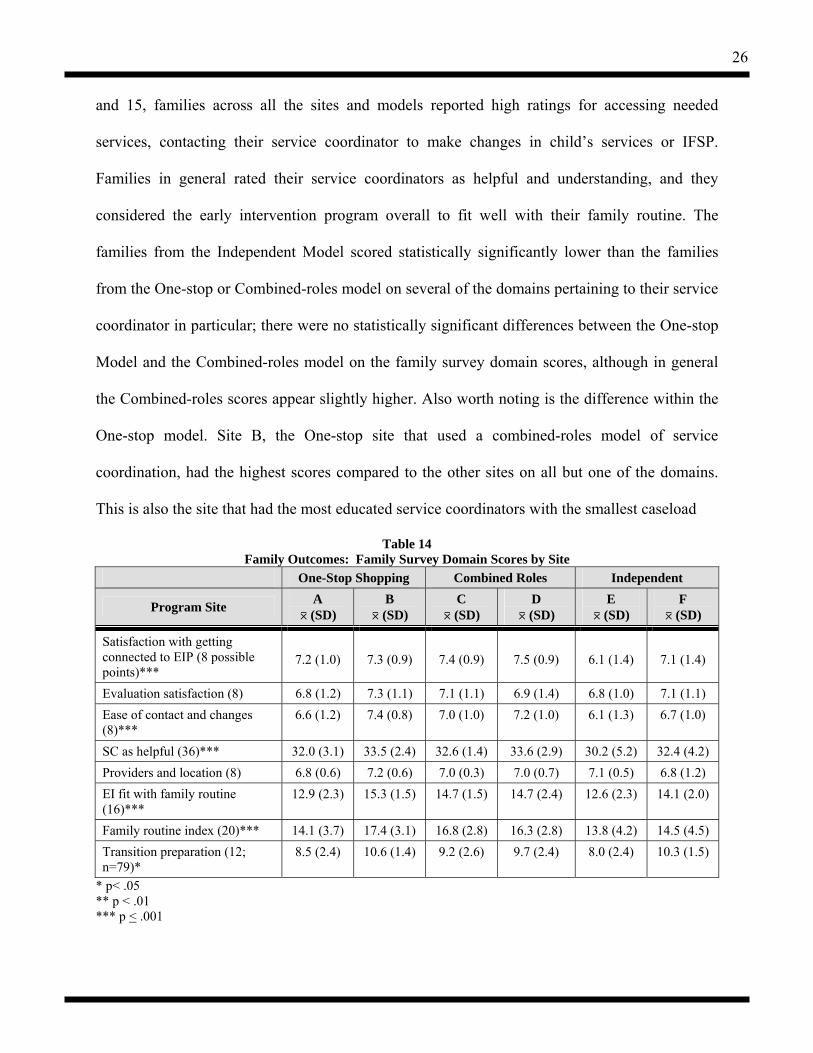
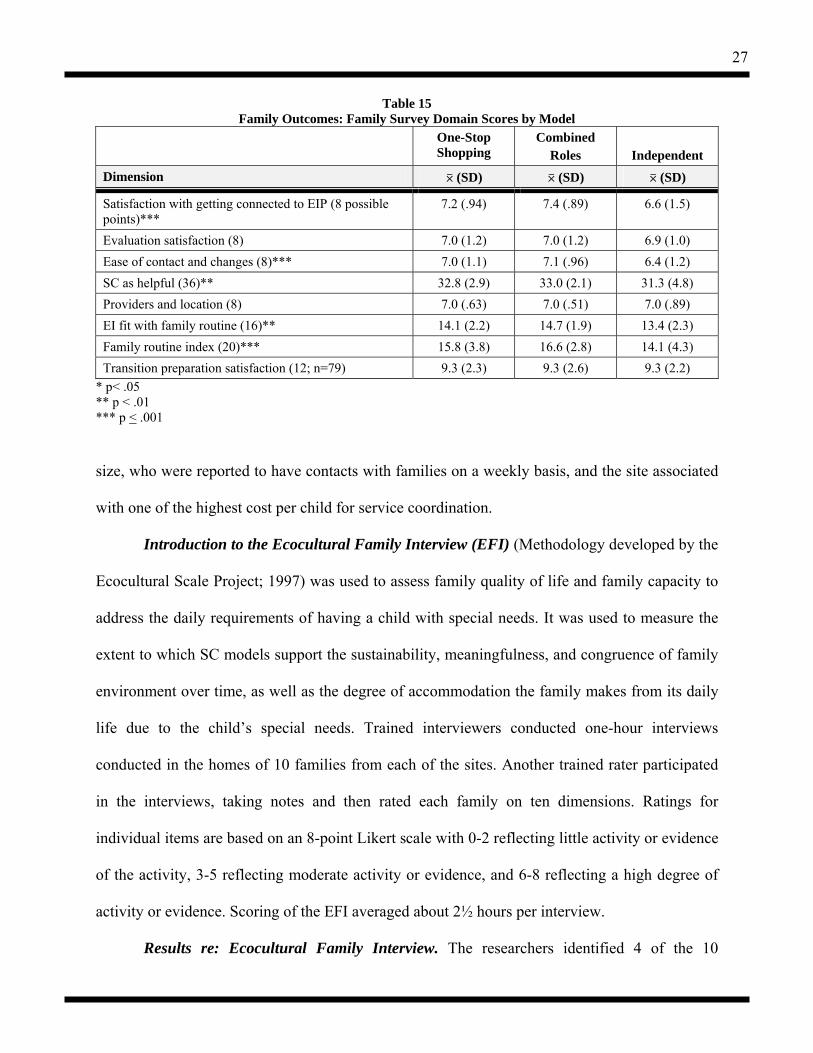
Results re: Family Outcomes. Survey items were analyzed based on “domain” scores
derived from items that had addressed a common aspect of the early intervention system or
service coordination and for which items were strongly inter-correlated. As shown in Tables 14
26
and 15, families across all the sites and models reported high ratings for accessing needed
services, contacting their service coordinator to make changes in child’s services or IFSP.
Families in general rated their service coordinators as helpful and understanding, and they
considered the early intervention program overall to fit well with their family routine. The
families from the Independent Model scored statistically significantly lower than the families
from the One-stop or Combined-roles model on several of the domains pertaining to their service
coordinator in particular; there were no statistically significant differences between the One-stop
Model and the Combined-roles model on the family survey domain scores, although in general
the Combined-roles scores appear slightly higher. Also worth noting is the difference within the
One-stop model. Site B, the One-stop site that used a combined-roles model of service
coordination, had the highest scores compared to the other sites on all but one of the domains.
This is also the site that had the most educated service coordinators with the smallest caseload
Table 14 Family Outcomes: Family Survey Domain Scores by Site
One-Stop Shopping Combined Roles Independent
Program Site A 0 (SD)
B 0 (SD)
C 0 (SD)
D 0 (SD)
E 0 (SD)
F 0 (SD)
Satisfaction with getting connected to EIP (8 possible points)***
7.2 (1.0)
7.3 (0.9)
7.4 (0.9)
7.5 (0.9)
6.1 (1.4)
7.1 (1.4)
Evaluation satisfaction (8) 6.8 (1.2) 7.3 (1.1) 7.1 (1.1) 6.9 (1.4) 6.8 (1.0) 7.1 (1.1) Ease of contact and changes (8)***
6.6 (1.2) 7.4 (0.8) 7.0 (1.0) 7.2 (1.0) 6.1 (1.3) 6.7 (1.0)
SC as helpful (36)*** 32.0 (3.1) 33.5 (2.4) 32.6 (1.4) 33.6 (2.9) 30.2 (5.2) 32.4 (4.2) Providers and location (8) 6.8 (0.6) 7.2 (0.6) 7.0 (0.3) 7.0 (0.7) 7.1 (0.5) 6.8 (1.2) EI fit with family routine (16)***
12.9 (2.3) 15.3 (1.5) 14.7 (1.5) 14.7 (2.4) 12.6 (2.3) 14.1 (2.0)
Family routine index (20)*** 14.1 (3.7) 17.4 (3.1) 16.8 (2.8) 16.3 (2.8) 13.8 (4.2) 14.5 (4.5) Transition preparation (12; n=79)*
8.5 (2.4) 10.6 (1.4) 9.2 (2.6) 9.7 (2.4) 8.0 (2.4) 10.3 (1.5)
* p< .05 ** p < .01 *** p < .001
27
Table 15 Family Outcomes: Family Survey Domain Scores by Model
One-Stop Shopping
Combined Roles
Independent
Dimension 0 (SD) 0 (SD) 0 (SD)
Satisfaction with getting connected to EIP (8 possible points)***
7.2 (.94) 7.4 (.89) 6.6 (1.5)
Evaluation satisfaction (8) 7.0 (1.2) 7.0 (1.2) 6.9 (1.0) Ease of contact and changes (8)*** 7.0 (1.1) 7.1 (.96) 6.4 (1.2) SC as helpful (36)** 32.8 (2.9) 33.0 (2.1) 31.3 (4.8) Providers and location (8) 7.0 (.63) 7.0 (.51) 7.0 (.89) EI fit with family routine (16)** 14.1 (2.2) 14.7 (1.9) 13.4 (2.3) Family routine index (20)*** 15.8 (3.8) 16.6 (2.8) 14.1 (4.3) Transition preparation satisfaction (12; n=79) 9.3 (2.3) 9.3 (2.6) 9.3 (2.2)
* p< .05 ** p < .01 *** p < .001
size, who were reported to have contacts with families on a weekly basis, and the site associated
with one of the highest cost per child for service coordination.
Introduction to the Ecocultural Family Interview (EFI) (Methodology developed by the
Ecocultural Scale Project; 1997) was used to assess family quality of life and family capacity to
address the daily requirements of having a child with special needs. It was used to measure the
extent to which SC models support the sustainability, meaningfulness, and congruence of family
environment over time, as well as the degree of accommodation the family makes from its daily
life due to the child’s special needs. Trained interviewers conducted one-hour interviews
conducted in the homes of 10 families from each of the sites. Another trained rater participated
in the interviews, taking notes and then rated each family on ten dimensions. Ratings for
individual items are based on an 8-point Likert scale with 0-2 reflecting little activity or evidence
of the activity, 3-5 reflecting moderate activity or evidence, and 6-8 reflecting a high degree of
activity or evidence. Scoring of the EFI averaged about 2½ hours per interview.
Results re: Ecocultural Family Interview. The researchers identified 4 of the 10

28
dimensions as most relevant to this service coordination outcomes study, and these results are
provided in Tables 16 and 17.
Table 16
Family Outcomes: Ecocultural Family Interview Composite Score Dimensions by Model
One-Stop Shopping (n=22)
Combined Roles (n=20)
Independent (n=21)
Dimension 0 (SD) 0 (SD) 0 (SD)
Subsistence Resilience of Subsistence Base Adequate Resources for Services Effect of Child on Work
3.5 (2.3) 7.0 (1.2) 3.6 (2.7)
3.9 (1.9) 6.6 (1.8) 3.0 (2.6)
3.5 (2.4) 6.3 (1.7) 3.8 (2.6)
Services Multiple Service Involvement Early Intervention Involvement
3.6 (2.0) 3.2 (1.8)
3.2 (1.8) 3.8 (1.2)
3.8 (1.3) 4.0 (1.6)
Non-disabled Network Involvement of Child in Non-disabled Network 4.6 (2.1) 5.7 (1.9) 4.9 (2.1) Support Religious and Professional Support Mother Household Help Service Coordinator Support
3.5 (2.2) 2.3 (1.8) 4.3 (2.4)
3.4 (2.2) 1.3 (1.3) 4.3 (1.8)
4.2 (2.5) 2.4 (1.7) 3.2 (2.0)
Table 17 Family Outcomes: Ecocultural Family Interview Composite Scoring Dimensions by Site
One-Stop Shopping Combined Roles Independent A B C D E F
Program Site 0 (SD) 0 (SD) 0 (SD) 0 (SD) 0 (SD) 0 (SD)
Resilience of Subsistence Base
2.6 (1.9) 4.6 (2.3) 3.7 (2.3) 4.1 (1.5) 2.8 (2.4) 4.2 (2.3)
Resources for Services 6.3 (1.3) 7.7 (0.5) 6.3 (2.3) 6.8 (1.2) 6.2 (1.6) 6.3 (1.9) Effect of Child on Work 4.0 (2.7) 3.2 (2.7) 3.6 (3.1) 2.4 (1.9) 3.0 (2.2) 4.9 (2.6) Multiple Service Involvement
3.4 (2.2) 3.7 (1.8) 2.9 (1.7) 3.6 (1.8) 3.6 (1.3) 4.0 (1.4)
Early Intervention Involvement
3.3 (1.9) 3.1 (1.8) 3.6 (1.3) 4.1 (1.0) 3.3 (1.0) 4.7 (1.8)
Involvement of child in nondisabled network
5.1 (1.7) 4.1 (2.4) 6.1 (2.1) 5.2 (1.6) 4.8 (2.0) 5.1 (2.3)
Religious and Professional Support
3.3 (2.0) 3.8 (2.4) 2.7 (2.2) 4.1 (2.0) 4.0 (2.6) 4.4 (2.4)
Mother household help 2.2 (2.0) 2.4 (1.6) 1.5 (1.5) 1.2 (1.0) 2.0 (1.6) 2.9 (1.8) Service Coordinator Support
3.7 (2.6) 5.2 (1.9) 4.7 (2.1) 3.9 (1.3) 2.9 (1.7) 3.6 (2.3)
29
No statistically significant differences were found between models or across sites,
although the service coordinator support dimension neared statistical significance for Site B, the
One-stop model which also used combined-roles service coordinators with small caseloads. Still,
these data provide insight into the challenges faced by these families. In terms of subsistence,
families in general were rated as having moderate subsistence in terms of their income, ability to
pay bills, and have adequate resources on which to live. In terms of adequacy of cost and access
to needed health care and intervention, families were rated as having most of these costs covered.
Families needed to make some accommodations in their work arrangements due to the needs of
their child. In regard to the services dimension, families reported some—but not a lot—of
involvement in getting and using services to address their child’s need; families made reference
to being involved in their child’s services, but it was not a dominant activity in the daily lives.
Under the nondisabled network domain, families described moderate activity in getting
intentionally involved with typical, nondisabled activities, although it was not a dominant theme
in their lives. The ratings on the support dimension reflect that religion is somewhat of a support,
but not a strong one. The mothers interviewed reported that they received little help from others
outside the home in managing the domestic workload. The average rating for service coordinator
support reflected moderate support.
The researchers recognize the value of the EFI as a potentially rich qualitative measure
that provides a great deal of insight into the stories behind the quantitative findings, shedding
light on the specific ways that Early Intervention and service coordination plays a role in the
lives of families. Further analysis is planned to explore the relationship among the eco-cultural
family dimension scores, family socioeconomic factors, as well as the other child and family
outcomes. Further analysis will occur with these data beyond the end of this project.
30
Objective 4: Describe the critical variables influencing the system outcomes, direct service outcomes, and child/family outcomes.
This objective explored additional influences beyond the service coordination model
alone and considered other variables that may be attributed to the differences in the outcomes.
The system outcomes appeared to be influenced by the history of inter-agency collaboration and
the presence of strong leadership. In turn, the system outcomes appeared to influence to the
direct service outcomes (i.e., the array of services provided to families as well as the intensity of
hours of service). The One-stop model provided slightly more services than the other models
(although there was great variability within the Independent model) and the One-stop model was
associated with a greater intensity of services.
The characteristics of the service coordinators most likely had the greatest influence on
the cost of service coordination as the direct service outcome. The One-stop Model, followed
next by the Combined Roles model had staff with the greatest years of experience and highest
education levels.
Caseload size also is tied to cost as well as the frequency of contacts with the family (a
direct service outcome). This in turn may be influencing the family well being outcomes; those
families who receive the greatest number of contacts with their service coordinator and who are
served by more experienced coordinators appear to have the highest scores on the measures of
family well being.
To investigate the factors influencing the family outcomes, a regression analysis was
conducted. First, a “reduced-item family well being survey score” was created based on a factor
analysis of the survey’s linear rating-scale items (Chronbach’s Alpa equaled .91). Next, this
reduced-item score was used as the dependent variable in a logistic regression analysis, taking
into consideration variables that were known to vary across models (such as the model itself,
31
caseload size and average number of services provided to families) as well as family
demographic characteristics that are suspected as influencing family outcomes, i.e., income,
mother’s education level. The results showed that the model of service coordination, service
coordinator caseload, family income, and mother’s education did not have a statistically
significant effect on the family well being survey score. However, the number of services
received by the family did have a statistically significant on the dependent variable.
These regression analyses provide valuable insight into one of the key factors that most
likely is driving the differences in family well-being scores, yet this requires further
investigation; future studies are needed that could empirically test the impact of services received
while keeping the model constant.
Objective 5: Disseminate an evaluation framework that will assist communities and states in developing an efficient, responsive service coordination model.
Over the course of the 3-year grant period, numerous presentations were made to the sites
as well as at national conferences. Descriptive information for each of the sites was presented via
onsite visits. A teleconference is scheduled to be conducted with all the sites to share the results
of the model comparisons; this is delayed due to difficulty in coordinating schedules across the
sites. A list of presentations at national conferences is provided below:
Behl, D, Malone, M. D., Bruder, M. B., Gallagher, P. A., Roberts, R. N., Van Buren, M. (2004, December). What does research tell us about implementing effective service coordination strategies? Paper presented at the Division for Early Childhood Conference, Chicago, IL.
Roberts, R. N. (2005, May). Service coordination can make a difference: Families tell us
how. Paper presented at the YAI National Institute for People with Disabilities, New York City, NY.
Roberts, R. N., Behl, D. D., Goetze, L. D., Johnson, R., Gordon, M., & Nordfelt, E.
(2005, March). How Important are Early Intervention Service Coordinators in the Lives of Families? Paper presented at the annual PAC*RIM Conference, Honolulu, HI.
32
Roberts, R. N. (2005, February). Leadership: Setting The Context For Change. Paper presented at the annual Conference of the Association of Maternal and Child Health Programs, Washington, DC.
Roberts, R. N., Behl, D. D., Goetze, L. D., Johnson, R L., Gordon, M., & Nordfelt, E.
(2004, December). An Outcomes-Based Approach to Evaluating Part C Service Coordination Models. Poster presented at the Division for Early Childhood Conference, Chicago, IL.
Roberts, R. N. (2004, May). Fulfilling the promise of the law: A coordinated system of
care for young children and their families. Paper presented at the Interagency Autism Coordinating Committee Meeting, Bethesda, MD.
Roberts, R. N. (2004, April). Critical practices in early intervention and early childhood
special education. Paper presented at the NECTAC Conference, Tampa, FL. Roberts, R. N. (2004, February). R. T. research is like a carnival gopher game: How do
you keep the unexplained variables from popping up? Paper presented at the annual Conference on Research Innovation in Early Intervention (CRIEI), San Diego, CA.
Roberts, R. N., Behl, D. D., Goetze, L. D., & Johnson, R. (2004, February). An
outcomes-based approach to evaluating Part C service coordination models. Paper presented at the annual Conference on Research Innovation in Early Intervention (CRIEI), San Diego, CA.
Roberts, R. N., Behl, D., Goetze, L., Groseclose, C., & Johnson, R. L. (February, 2004). An outcomes-based approach to evaluating Part C service coordination models. Paper presentation at the Conference on Research Innovations in Early Intervention, San Diego, CA.
Behl, D., Goetze, L., Roberts, R. N., & Johnson, R. L. (November, 2003). New methods
to evaluate different service coordination models for infants and toddlers with special needs. Paper presentation at the Annual AEA Conference, Sparks, NV.
2003 Roberts, R. Behl, D., and Akers, A. (October,). Breathing Action Into Research! Using
Participatory Models to Improve Community-Based Systems. Division for Early Childhood Conference, Washington, D.C.
Roberts, R., Behl, D., Goetze, L., & Harlacher, J. (2002, March). An Outcomes-Based
Approach to Evaluating Service Coordination Models. Poster presented at the Early Intervention Research Institute Conference, Utah State University, Logan, UT.
In addition, a telephone conference presentation and discussion was held simultaneously
with the principal investigators and representatives from all six of the research sites. This served
as an opportunity to not only share the findings, but it served to obtain feedback from providers
and administrators in regard to interpreting the results. In general, the response to the results was
33
very positive. Participants said that they found the information extremely valuable in terms of
helping them make future policy decisions regarding service coordination. Another benefit of
this conference call was the initiation of conversation among the research sites. In fact, future
conference calls are planned among these site participants which will serve as a “learning
community” to support community-level issues faced among early intervention programs.
Conclusions and Discussion
This study is one of the first to present a full overview of different models of service
coordination within ongoing community-based early intervention programs. Descriptions of two
different sites for each of three different models have been presented and compared. The sites are
described within the context of: (a) the communities and systems in which the programs operate;
(b) the families enrolled in the programs and the services they receive; (c) the costs of service
coordination for each model distinct from the costs of the services and other supports to families;
(d) the outcomes achieved for families and children; and (e) other factors besides the service
coordination model itself that influence family outcomes. These data provide a realistic picture
of this important component of early intervention services for policy and practice. Examples of
how the results of this study can inform decision making are described in this section.
There is no objective way to determine if the six sites who so graciously allowed us to
work with them for three years while conducting this study are representative of the early
intervention programs with similar models in the field at large. These programs may be different
from other programs using a similar model of service coordination because of the requirement to
meet the criteria for our data collection process and their openness to working collaboratively
with us. Unlike a state level evaluation, these programs had no mandate to cooperate with the
researchers but did so in the interest of moving the field further and by seeing it as an
34
opportunity to learn more about the effectiveness of their particular programs. For their
willingness to participate and the wonderful collaboration that was evidenced in the process, we
thank them profusely.
Summary of Findings and Their Implications for Service Coordination
Contextual variables. Contextual variables are those that represent ecological constraints
and opportunities that help shape the possibilities of successful services and supports for
families. They are not directly causal but do define the history of the community and the
resources that can be drawn upon as programs develop and mature. As we have conducted
interviews at several different levels and reviewed pertinent documents, we have looked for
those examples that set the stage for ongoing program development and change. Tables 2 (p. 6)
and 3 (p.10) clearly suggest that exemplars of each of the models of service coordination exist in
very different community and systems settings. In general, the variability among community and
system characteristics within models is at least as great as that between models.
However, one contextual variable that varies consistently across models involves the
historic leadership and collaboration variable. These two variables describe the history of
working together within the service sector; and, both the type and strength of local leadership.
The two programs in the one-stop model were associated with communities with high ratings in
their history of collaboration and leadership. This distinguishes them from communities that
sponsored combined roles and independent models of service coordination where both of these
variables were rated as low or moderate at best. This difference by model makes sense. The
One-stop model requires that community partners have strong leadership and have learned to
collaborate before the one stop model can be developed into a program. A history of both
leadership and collaboration are setting events for one stop centers to be considered as a viable
35
service model. In earlier work (Roberts, Akers, & Behl, 1999), case studies of service delivery
systems clearly documented the need for a high level of collaboration and leadership prior to and
during the development of communities one-stop centers because the co-location of so many
services and supports within one location is a complex administrative and collaborative exercise.
The choice of which services and supports should be co-located requires both effective
leadership, a willingness to work together that fosters a cultural norm for joint planning funding
and program operations in a collaborative manner, and a thorough understanding of the clientele
who will be served. One stop centers developed with little forethought to these considerations
including the shared costs and finances will lack important services needed by families and
defeat the purpose of the one stop center. Discussions with families and providers are necessary
in order to ensure the appropriate mix (Roberts et al., 1999). These conditions were met by both
examples of the one-stop model in this study.
Combined roles and Independent models may exist within communities where programs
act fairly independently. There may be information sharing and some joint activities such as
training across programs, but the service coordinator is assumed to provide coordination at the
family level while other interagency frameworks must provide it at the agency levels if it is
provided at all. Neither model in this study reflects strong interagency activity, though there is
evidence that the councils do meet and share information. In other work, researchers have used a
continuum of service system integration that moves from no community to very formal models
of integration. Information sharing is the lowest level of the collaborative integration strategies.
The data show demographic descriptors vary widely within each model and may not be related to
the degree of systems integration in place.
The service coordinator characteristics are tied to the models as well the systems

36
characteristics. In this sample, one stop models have more experienced and more educated
service coordinators than the other two models. The independent model is much more likely to
use service coordinators with less formal education (AA degree). The independent model also
has the highest case loads by a factor of at least 1.5. In summary, service coordinator
characteristics such as skill level, job descriptions and the settings in which they worked differed
most dramatically between the Independent model and the other two models.
This suggests that not all contextual variables are associated with specific models of
service coordination. Rather, several key factors seem to be significantly related. These include
the degree to which the community collaborates in service delivery, the strength of program
leadership, and whether the job descriptions/required formal training of the service coordinators.
Each of these variables are contextual factors that appear to discriminate among models.
Outcomes
With respect to systems-level outcomes, it is apparent that history and context matter.
One stop models are much more likely to have strong working local interagency councils with a
history of strong leadership and collaboration. As a result of the co-location, other fruits of the
collaborative process are also evident through shared IFSPs and data systems. Again, these
activities can only be successful and are more likely to be seen as important when agencies have
reason, opportunity and mandates to do so. Being all together in the same location as a function
of a common history of leadership and collaboration provides the conditions for a set of mutually
dependent programs. It is not that the independent or combined roles models somehow constrain
programs in the collaboratives. It is simply there is no strong press mandate or perceived need.
Direct service outcomes. The prime indicator of the frequency of family contacts by
service coordinators appear to be the caseload size, which was somewhat independent of the
37
model. Frequency of SC contacts is discussed more fully in the next section on family and child
outcomes.
Across the board, it is remarkable that relatively little of the service coordinators’ time is
reported to be spent engaged in the critical tasks within their job description. These include:
finding resources, IFSP development, parent education and support, and assisting families to take
advantage of natural settings within the community and the families’ everyday routines to
increase the developmental outcomes for their children.
Though there was some variation across sites, the overall finding is that when the time
spent on these activities is added together, it still makes up less than a quarter of the time SCs
dedicated time to service coordination activities. Given that these tasks are the central reason for
the positions they hold, it is of concern that the time spent in accomplishing them is so minimal.
Rather, the time diary logs suggest other more bureaucratic tasks continue to fill up much of their
time dedicated to service coordination. These findings were confirmed for all three models of
service coordination. In the dedicated service coordination model this finding is particularly
surprising due to the relative lack of conflict with other duties. There may be other influences,
such as extensive travel time and other administrative duties; even so, the percentage for these
core tasks is low.
Child and family outcomes. Since the stated goals of the Part C system include enhancing
child development, increasing parent competence and the overall well being of the family, we
have examined these outcomes as the endpoint in our contextual framework.
Child development outcomes. Several findings are important with respect to this
outcome. To the extent possible within the capacity of these early intervention programs to
assess child developmental outcomes, these data are reported as child developmental change
38
scores spanning roughly the 18 months each site was directly involved in data collection. For a
number of reasons, even these very good sites had limited capacity to report these data. Child
development outcome data based on a review of hardcopy client files had to be constructed by
the research team for almost all of the children in each of the sites. Even though the enhancement
of child development is one of the major rationales for the Part C program, these six sites were
unable to provide evidence to document their effect on child development. Most programs did
not track child development over time in a measurable way. There are many possible reasons for
this. In states were there is presumptive eligibility by diagnostic categories, we frequently found
that programs felt no need to establish a developmental baseline. Developmental testing data was
not relevant for entry into the program, even though it should have been a critical element in the
development of the IFSP. In many cases, parent report and clinical observation were believed to
be more helpful in guiding interventions than more formal evaluations. Based on the traditional
developmental data gathered in this study, there is little evidence that the Part C sites influenced
the developmental growth rates of children. However, it is possible that other measures of child
development (i.e., functional measures) may be more sensitive indicators. However, the use of
such tools by early intervention programs on a large scale is weak. Further studies designed to
capture child development are most likely going to have to administer their own assessments.
Family outcomes. Parent and family data collection involved measures that were
developed and collected by the researchers for each subject enrolled across the sites. These data
were under our control and thus much more complete for the targeted children specific to a given
program. In general, families across all the models and sites reported high ratings of their service
coordination and other services received. The families from the Independent model did report
statistically significantly lower scores on the family survey. As noted in the report of the
39
regression analysis, the number of services families reported they received had the strongest
effect on the family well being survey. However, it important to remember that there were
relatively high survey scores (reflecting generally high ratings of the services and supports
received) among families across all the models, and the degree to which this effect is
functionally meaningful requires further investigation and replication.
The project design was built on the strengths of the existing natural variations in service
coordination models that realistically exist in the field today. Part C law gives states and
localities broad discretion in who can carry out service coordination activities, what their
caseloads will be and the focus of their activities. This means that we have been able to identify
sites that differ on the key variables for the study. As a result we have found that the model is
associated with several key outcome variables. For example, the independent model is less
expensive and services provided to families were rated lower in several key areas, such as
service coordination is helpful, than services provided through the other models. At the same
time it is difficult to hold constant other key variables, such as caseload and training, which
would be theorized as strongly connected to family outcomes and cost without doing a rigorous
randomized experimental trial. There are many challenges to doing randomized trials. One of
those challenges is that they can be very expensive. It would be very interesting to implement
the independent model comparison, for example, with caseloads more similar to those found in
the blended models. However, programs cannot afford to pay for changing those caseloads and
often the grant awards do not come close to awarding adequate funds to pay for such service
differences.
The costs of service coordination. Existing Part C service coordination models have been
adopted without empirical evidence about the costs and outcomes associated with each. Part C

40
administrators looking for cost-saving methods face difficult choices about restricting eligibility
of the children and families served or altering the way that services are delivered. The Part C
law provides flexibility in terms of coordinator education, experience, and caseload size,
providing administrators with ways to reduce costs by substituting expensive therapists for with
less-credentialed lower-salaried service coordinators. Other communities may be faced with
using hiring less experienced, lower-salaries service coordinators because of cost and more
because of a shortage of qualified therapists in their localities. Knowledge about the
consequences of such decisions for services as well as outcomes for family and child outcomes
children and families should really come before such decisions are made.
Future Directions
The findings from this study suggest that the model of service coordination does affect
cost and family outcomes although the results for child outcomes are equivocal. Are the higher
family outcomes worth the additional cost, or is there a service coordination model that can be
implemented that achieves relatively positive family outcomes for an affordable cost? The
combination of variables used in Site F of the Independent Model is a good example of this cost/
effectiveness conundrum. Service coordinators in this is model were the lowest paid and had the
largest case loads of any in the study. Parsing tasks by skills and levels of training may be one
way to deal with this issue though more study is needed to understand the effects of case load
and experience in the service coordination role with respect to such variables as family and
community knowledge and the administrative versus the therapeutic sides of service matching
and coordination with family needs.
There are limitations to this study which point to the need for further research. For
example, we did not evaluate the costs and effects of an independent service coordination model
41
where the service coordinators maintained relatively low caseloads of families. It would not be
surprising if families gave higher ratings to their service coordination services in an independent
model where the providers were spread across fewer families. We also did not document other
key factors that might influence the way that service coordinators in the study spend their time—
such as financing sources and regulations. There may be local and state policies in place in
different areas that are driving paperwork and reducing the amount of time that service
coordinators have available to spend in direct service to families. Future research should include
a more detailed evaluation of the specific administrative activities that are required in each
program. A thorough review of the paperwork requirements of each program would be
worthwhile and might reveal key differences that may or may not be associated with the service
coordination model.
The Part C finance requirements can be burdensome for service coordinators and others
in state and local programs. The law requires that Part C funds be used only as payor of last
resort and requires that other funds, such as Medicaid, be billed prior to Part C dollars. States
and localities vary widely in the degree to which they have adopted these provisions as well as
whether those funds are chased at the local or state level. These differences may have a strong
influence on individual service coordinator paperwork responsibilities. Many have argued that
these Part C finance requirements also have a negative influence on parent-provider relationship
and that discussions of family income are stressful for both the provider and the family. States
and localities vary in their family cost participation policies and Part C allows broad discretion in
how these policies are implemented. These are additional variations that need to be studied to
achieve a more complete understanding of which Part C program model variables are influencing
key outcomes like cost and family well-being and child developmental outcomes.
42
There are many new research questions that the researchers intend to explore with the
data from this study, particularly in terms of the effects of service coordination for
subpopulations. For example, an analysis of the relationship among models, direct service
outcomes, and child severity/diagnosis is of interest. Exploring the influence of other variables,
such as family characteristics, on the outcomes also is warranted.
Replicating this study in other communities to demonstrate consistent findings associated
with these service coordination models is important. Additionally, the researchers are interested
in applying this conceptual framework to the evaluation of other service coordination models,
varying the geopolitical characteristics and political characteristics, such as the lead agency.
Although these findings are preliminary and have yet to be replicated, they do provide
important information to policymakers, providers, and families to help guide early intervention
programming decisions. First, this study speaks to the importance of service coordination in the
lives of families and therefore it deserves critical attention as a key component of the service
system. The findings point to the importance of considering caseload size and the amount of time
that service coordinators are given to establish a relationship with families. Therefore these data
can be valuable when communicating with state and community level policy makers who are
looking toward quality improvement strategies. The findings revealed gaps in the extent to which
the Part C system is providing for the comprehensive needs of families. A very small number of
families in this study received mental health, respite, and collaboration with their medical home;
this points to the need for a critical look at how Part C can address this gap. Finally, early
intervention programs and researchers need to be armed with evidence that service coordination
and early intervention are achieving desired outcomes. States and communities face increasing
demands that they demonstrate accountability for achieving desired outcomes. As demonstrated

43
by this study, too many programs do not have the documentation to monitor child as well as
family outcomes and thus demonstrate their effectiveness. Ultimately, it is the hope of the
researchers that this study has provided insights into the aspects of service coordination and the
broader service system to guide improved services for children and families.
44
References
Ecocultural Scale Project. (1997). Ecocultural Family Interview and Manual. UCLA Sociobehavioral Group, Los Angeles, CA. Available from project staff.
Innocenti, M. S., & Roberts, R. N. (1999). Participatory realism: Defining the role of non-evaluator stakeholders in evaluation. In R. N. Roberts & P. R. Magrab (Eds.), Where children live: Solutions for serving young children and their families (pp. 133-172). Stamford, CT: Ablex.
Jeppson, E. S., & Thomas, J. (1995). Essential allies: Families as advisors. Bethesda, MD: Institute for Family-Centered Care.
Kagan, S. L., Goffin, S. G., Golub, S. A., & Pritchard, E. (1995). Toward systemic reform: Service integration for young children and their families. Falls Church, VA: National Center for Service Integration.
Konrad, E. L. (1996). A multidimensional framework for conceptualizing human services integration initiatives. In J. M. Marquart & E. L. Konrad (Eds.), New directions for evaluation: Evaluating initiatives to integrate human services (pp. 5-19). San Francisco, CA: Jossey-Bass.
Roberts, R. N., Akers, A. L., & Behl, D. D. (1999). Opening Doors through state interagency coordinating councils: A guide for families, communities, and states. Early Intervention Research Institute, Utah State University, Logan.
Roberts, R. N., Behl, D. D., & Akers, A. L. (1996). Community-level service integration within home visiting programs. Topics in Early Childhood Special Education, 16(3), 302-321.
Roberts, R. N., Rule, S., & Innocenti, M. S. (1998). Strengthening the family-professional partnership in services for your children. Baltimore, MD: Brookes.
Roberts, R. N., & Wasik, B. H. (1996). Evaluating the 1992 and 1993 Community Integrated Service System Projects. In J. M. Marquart & E. L. Konrad (Eds.), New directions for evaluation: Evaluating initiatives to integrate human services (pp. 35-49). San Francisco, CA: Jossey-Bass.
Schorr, L. (1994). Shifting to outcome-based accountability: A minimalist approach for immediate use. Washington, DC: National Alliance for Restructuring Education and the Improved Outcomes for Children Project.
Turnbull, A. P. (1997). Session leader for Institute-based participatory action research symposium. Presented at International Division for Early Childhood, New Orleans, LA.