Embed Size (px)
Citation preview
S1
Supplementary Information
An Organometallic Route to Chiroptically
Active ZnO Nanocrystals
Elżbieta Chwojnowska,a,b Małgorzata Wolska-Pietkiewicz, b Justyna Grzonka, a,c and
Janusz Lewiński*,a,b
aInstitute of Physical Chemistry, Polish Academy of Sciences, Kasprzaka 44/52, 01-224 Warsaw,
Poland
bFaculty of Chemistry, Warsaw University of Technology, Noakowskiego 3, 00-664 Warsaw, Poland
cFaculty of Materials Science and Engineering, Warsaw University of Technology, Wołoska 141, 02-
507 Warsaw, Poland
Table of Contents
I Experimental Procedures ............................................................................................................................................ S2
II Characterization of ZnO-“0” ........................................................................................................................................ S3
Transmission Electron Microscopy ................................................................................................................... S3
Powder X-ray diffraction .................................................................................................................................... S4
Dynamic light scattering ................................................................................................................................... S4
UV-Vis absorption and photoluminescence ..................................................................................................... S5
III Characterization of ZnO-1, ZnO-2, ZnO-3 and ZnO-4 ................................................................................................. S6
Dynamic light scattering .................................................................................................................................... S6
Transmission Electron Microscopy ................................................................................................................... S9
Powder X-ray diffraction .................................................................................................................................. S17
Circular dichroism .......................................................................................................................................... S18
Electronic Supplementary Material (ESI) for Nanoscale.This journal is © The Royal Society of Chemistry 2017
S2
I Experimental Procedures
All reactions involving air-sensitive reagents were conducted under an atmosphere of dry oxygen free nitrogen
gas using standard Schlenk technique.
Materials
Tetrahydrofurane (POCh), hexane (POCh) were distilled from sodium-potassium alloy. Diethylzinc (ABCR) was
used as solution in dry hexane. 2-Aminoethanol (Aldrich), (1S)-2-Amino-1-phenylethanol (ABCR), (1R)-2-Amino-
1-phenylethanol (ABCR), (1R,2S)-(+)-cis-1-amino-2-indanolate (Aldrich), (1S,2R)-(-)-cis-1-amino-2-indanolate
(Aldrich), (R)-α,α-diphenyl-2-pyrrolidinemethanol (Aldrich), (S)-α,α-diphenyl-2-pyrrolidinemethanol (Aldrich),
(2S,3R)-(+)-4-Dimethylamino-3-methyl-1,2-diphenyl-2-butanol (Aldrich), were used without further purification.
General synthesis of ZnO NCs
To a tetrahydrofurane solution of selected aminoalcohol (1.0 mmol) diethylzinc in hexane (0.5 ml, 1.0 mmol) was
added dropwise and stirred at -50 ˚C for several minutes. Then the reaction mixture was allowed to warm to room
temperature and stirred for 2 h and exposed to oxygen and water from air for 4-5 days. ZnO-“0”, ZnO-3 and
ZnO-4 NCs were washed several times with THF to remove excess of aminoalcohol liberated during ZnO
synthesis. To separate ZnO-1 and ZnO-2 from THF solution hexane was added. To remove excess of
aminoalcohol from ZnO-1 and ZnO-2, nanocrystals were dissolved in THF and participated by hexane three
times.
S3
II Characterization of ZnO-“0”
Transmission Electron Microscopy
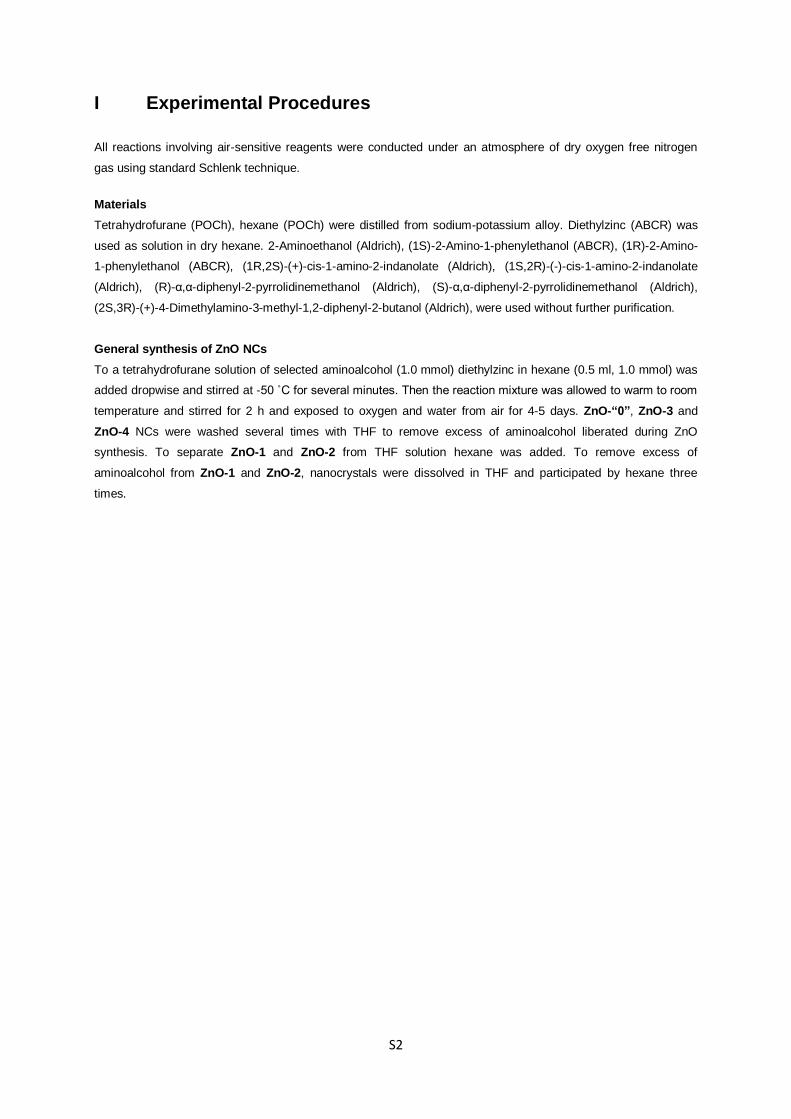
Size, shape and morphology of the nanoparticles were examined by High-Resolution Transmission Electron
Microscopy (HR TEM). Nanoparticle samples were drop-cast (THF or DMSO solution) onto 300-mesh, holey
carbon-coated copper grids (Quantifoil). Afterward, the excess solvent evaporated at room temperature.
Nanoparticle samples were imaged using a Cs corrected scanning transmission electron microscope (STEM,
HITACHI HD2700, 200 kV). The observations were carry on in three modes: SE (images used to study
morphology), HAADF STEM (Z-contrast) and HR TEM (images showing the atomic structure). A wide variety of
magnifications (from x1500 up to x8000000) were used to study the microstructure of ZnO samples. The size of
nanoparticles was calculated by image analyses, using ImageJ2x computer software. For image analyses a
population of 100 particles was used for each sample. Average sizes and standard deviations were calculated
from obtained results.
Figure S1. Representative TEM images (modes: SE left, HR TEM right) of ZnO-“0” dispersed in DMSO.
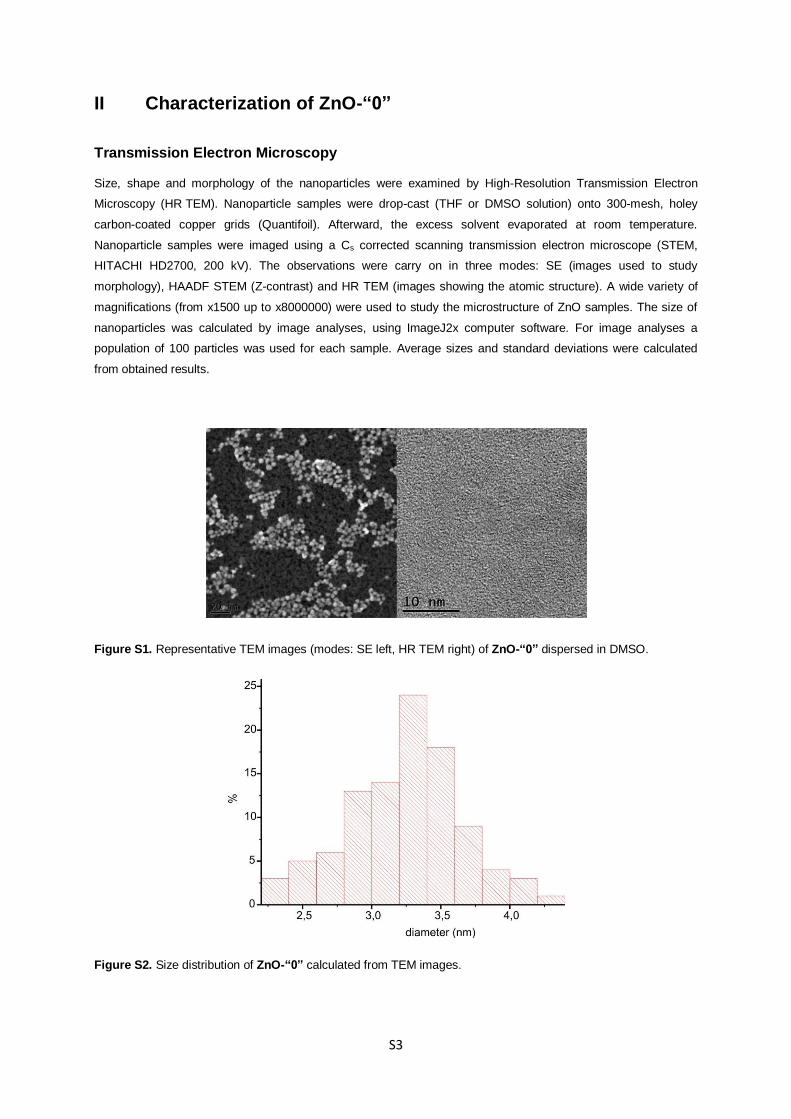
Figure S2. Size distribution of ZnO-“0” calculated from TEM images.
S4
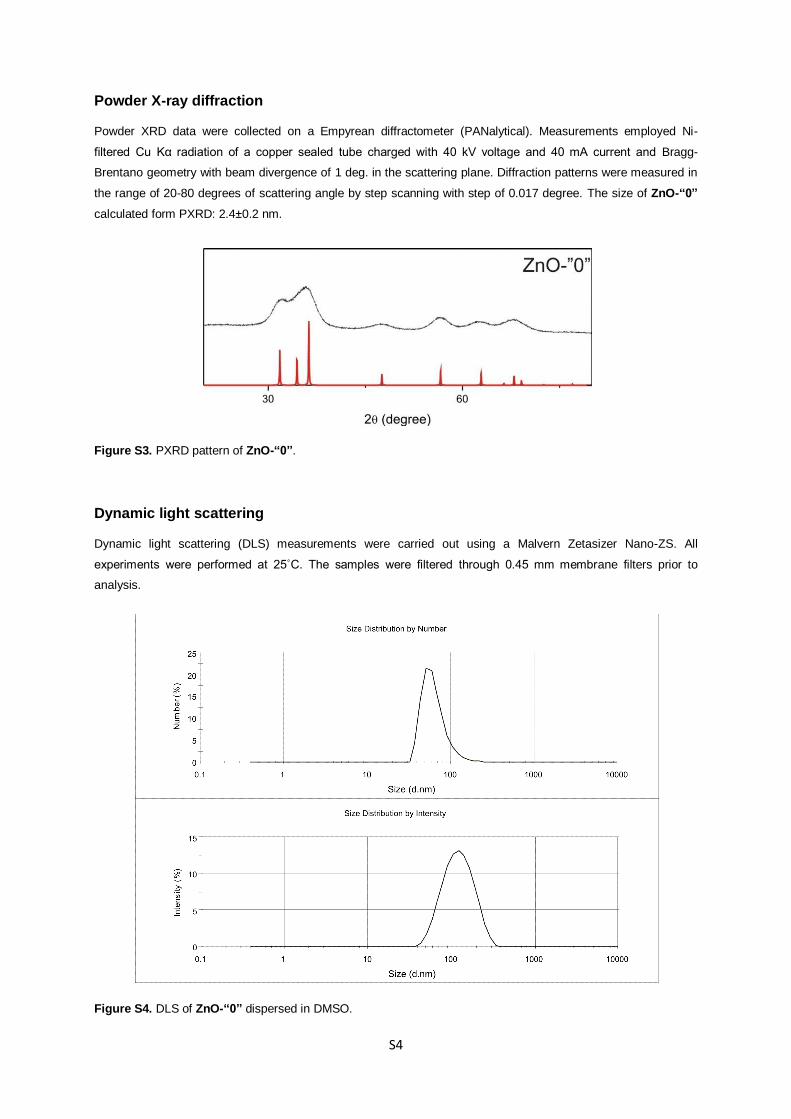
Powder X-ray diffraction
Powder XRD data were collected on a Empyrean diffractometer (PANalytical). Measurements employed Ni-
filtered Cu Kα radiation of a copper sealed tube charged with 40 kV voltage and 40 mA current and Bragg-
Brentano geometry with beam divergence of 1 deg. in the scattering plane. Diffraction patterns were measured in
the range of 20-80 degrees of scattering angle by step scanning with step of 0.017 degree. The size of ZnO-“0”
calculated form PXRD: 2.4±0.2 nm.
Figure S3. PXRD pattern of ZnO-“0”.
Dynamic light scattering
Dynamic light scattering (DLS) measurements were carried out using a Malvern Zetasizer Nano-ZS. All
experiments were performed at 25˚C. The samples were filtered through 0.45 mm membrane filters prior to
analysis.
Figure S4. DLS of ZnO-“0” dispersed in DMSO.
S5
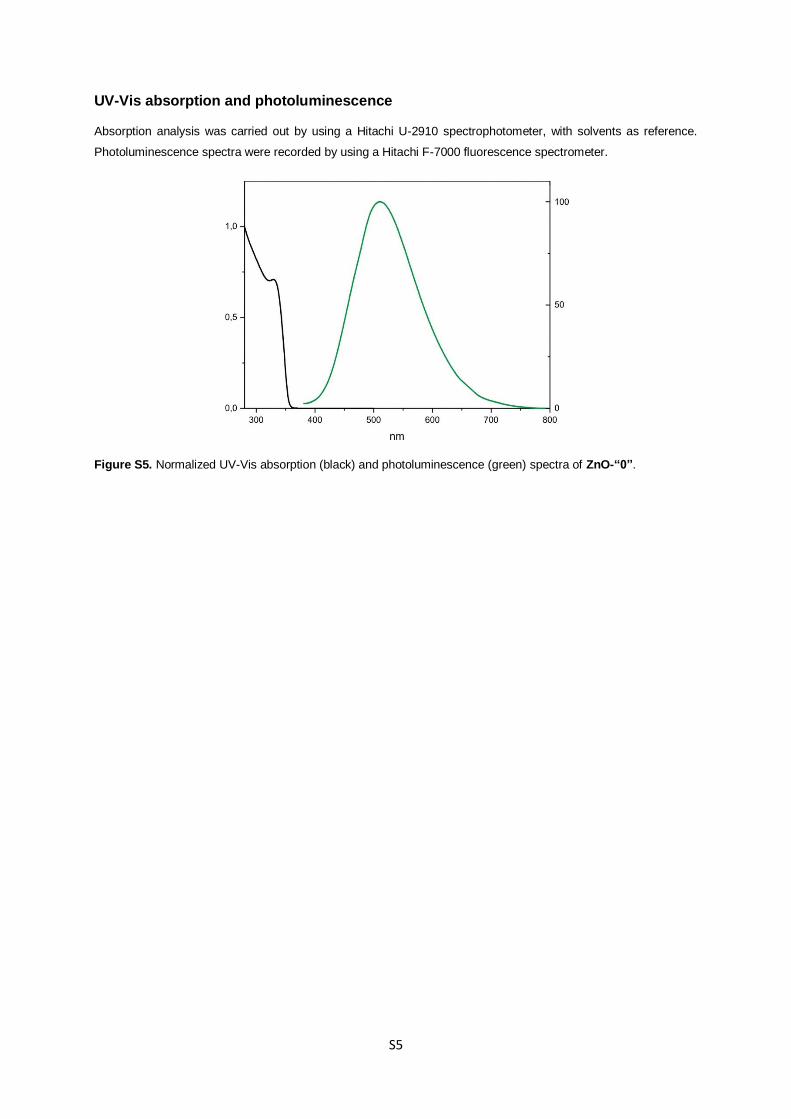
UV-Vis absorption and photoluminescence
Absorption analysis was carried out by using a Hitachi U-2910 spectrophotometer, with solvents as reference.
Photoluminescence spectra were recorded by using a Hitachi F-7000 fluorescence spectrometer.
Figure S5. Normalized UV-Vis absorption (black) and photoluminescence (green) spectra of ZnO-“0”.
S6
III Characterization of ZnO-1, ZnO-2, ZnO-3 and ZnO-4
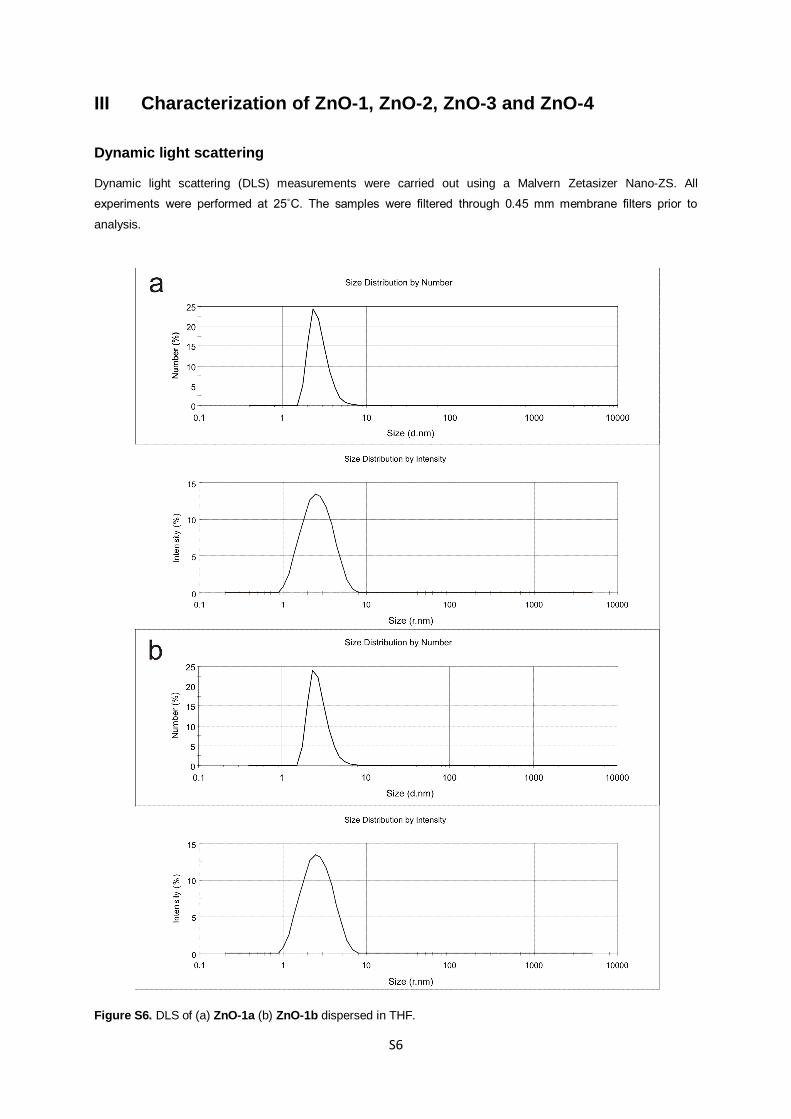
Dynamic light scattering
Dynamic light scattering (DLS) measurements were carried out using a Malvern Zetasizer Nano-ZS. All
experiments were performed at 25˚C. The samples were filtered through 0.45 mm membrane filters prior to
analysis.
Figure S6. DLS of (a) ZnO-1a (b) ZnO-1b dispersed in THF.
S7
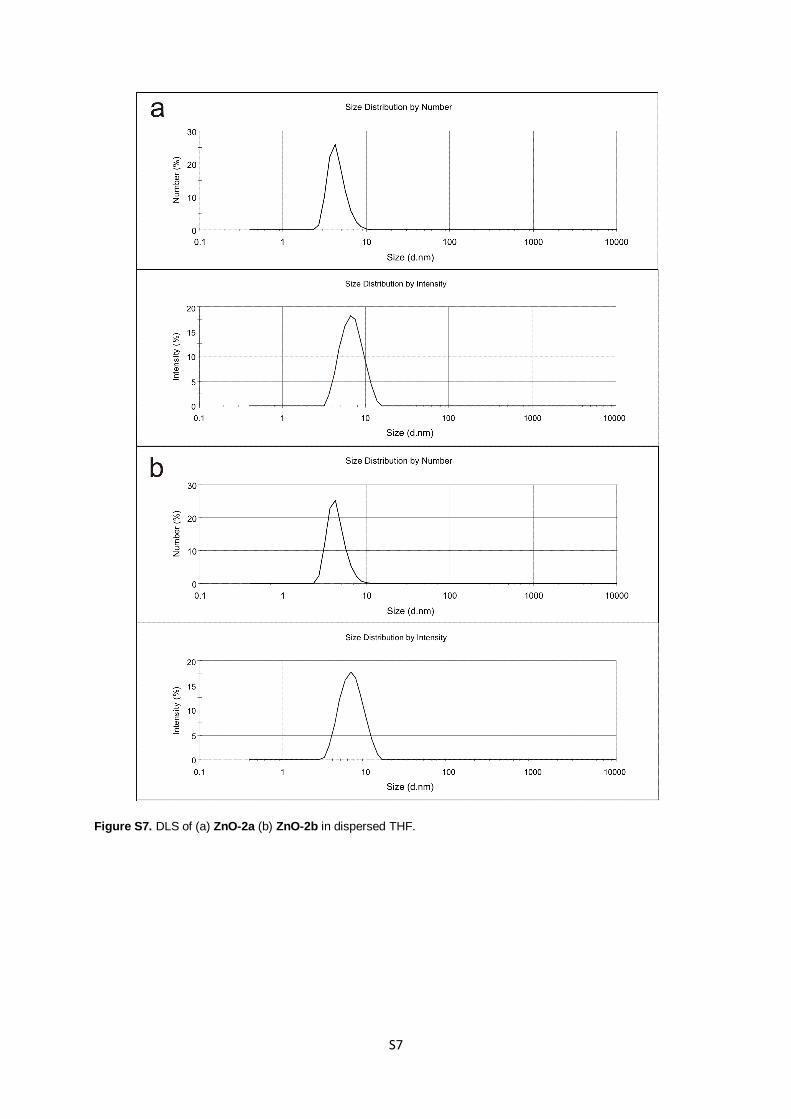
Figure S7. DLS of (a) ZnO-2a (b) ZnO-2b in dispersed THF.
S8
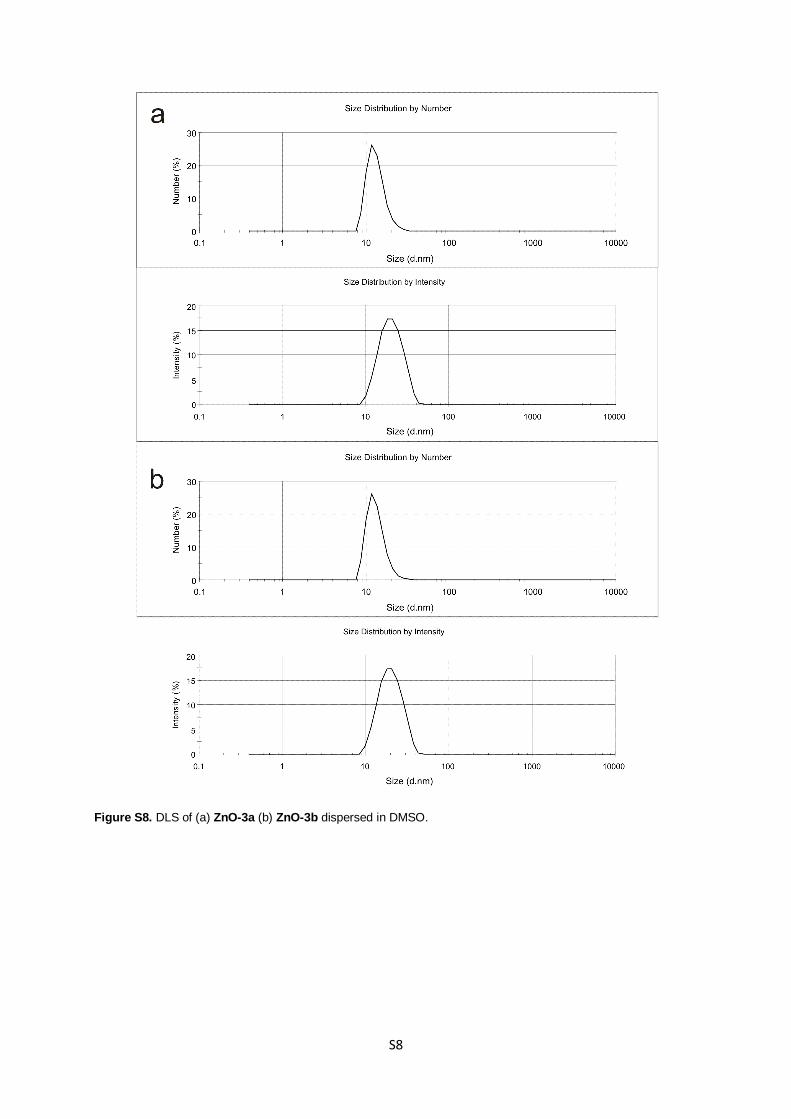
Figure S8. DLS of (a) ZnO-3a (b) ZnO-3b dispersed in DMSO.
S9
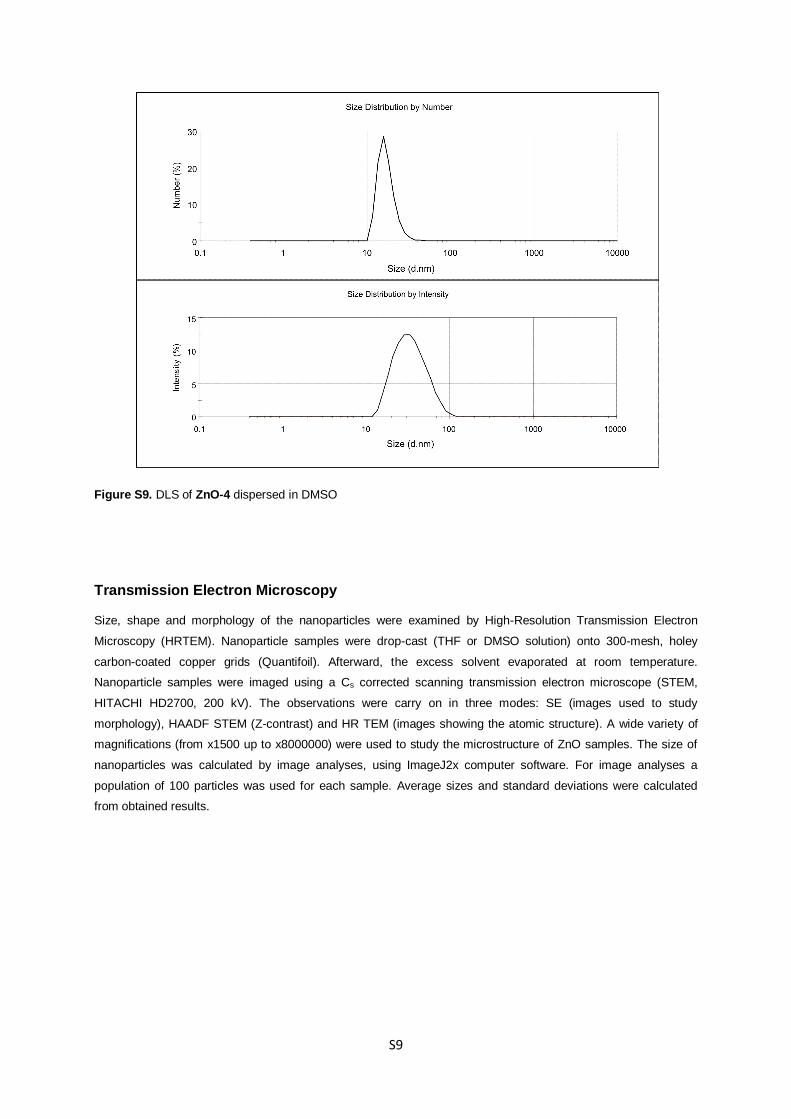
Figure S9. DLS of ZnO-4 dispersed in DMSO
Transmission Electron Microscopy
Size, shape and morphology of the nanoparticles were examined by High-Resolution Transmission Electron
Microscopy (HRTEM). Nanoparticle samples were drop-cast (THF or DMSO solution) onto 300-mesh, holey
carbon-coated copper grids (Quantifoil). Afterward, the excess solvent evaporated at room temperature.
Nanoparticle samples were imaged using a Cs corrected scanning transmission electron microscope (STEM,
HITACHI HD2700, 200 kV). The observations were carry on in three modes: SE (images used to study
morphology), HAADF STEM (Z-contrast) and HR TEM (images showing the atomic structure). A wide variety of
magnifications (from x1500 up to x8000000) were used to study the microstructure of ZnO samples. The size of
nanoparticles was calculated by image analyses, using ImageJ2x computer software. For image analyses a
population of 100 particles was used for each sample. Average sizes and standard deviations were calculated
from obtained results.
S10
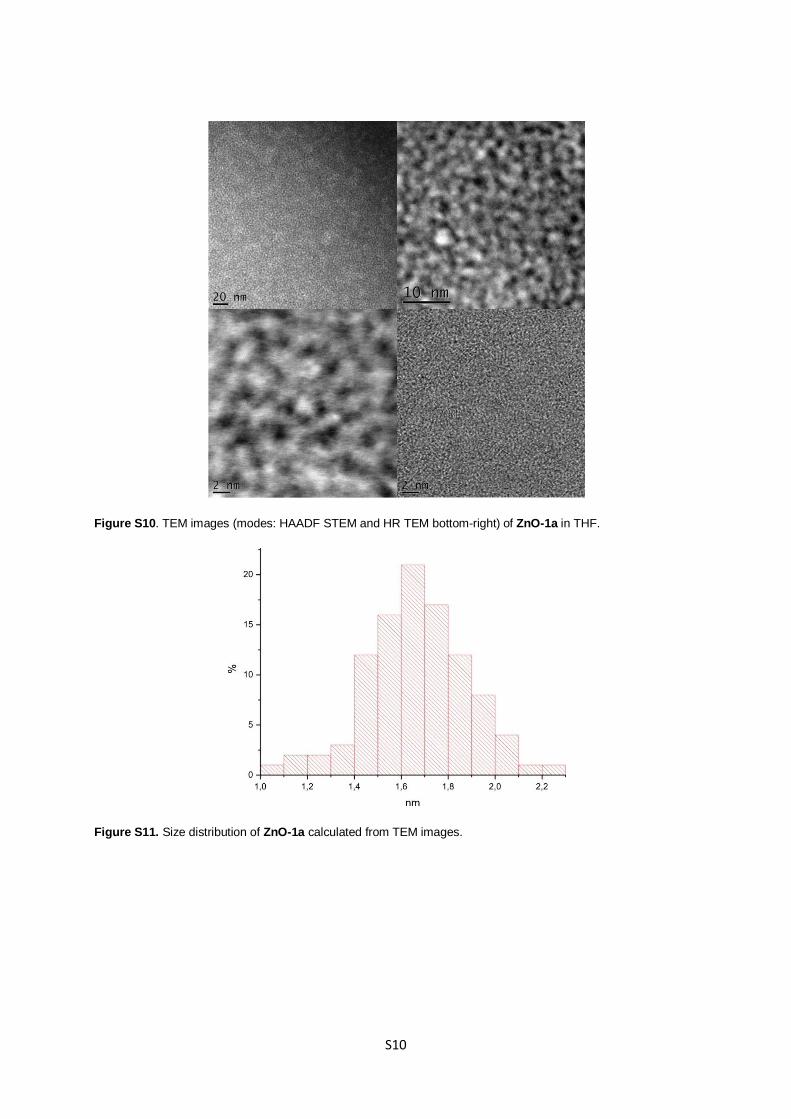
Figure S10. TEM images (modes: HAADF STEM and HR TEM bottom-right) of ZnO-1a in THF.
Figure S11. Size distribution of ZnO-1a calculated from TEM images.
S11
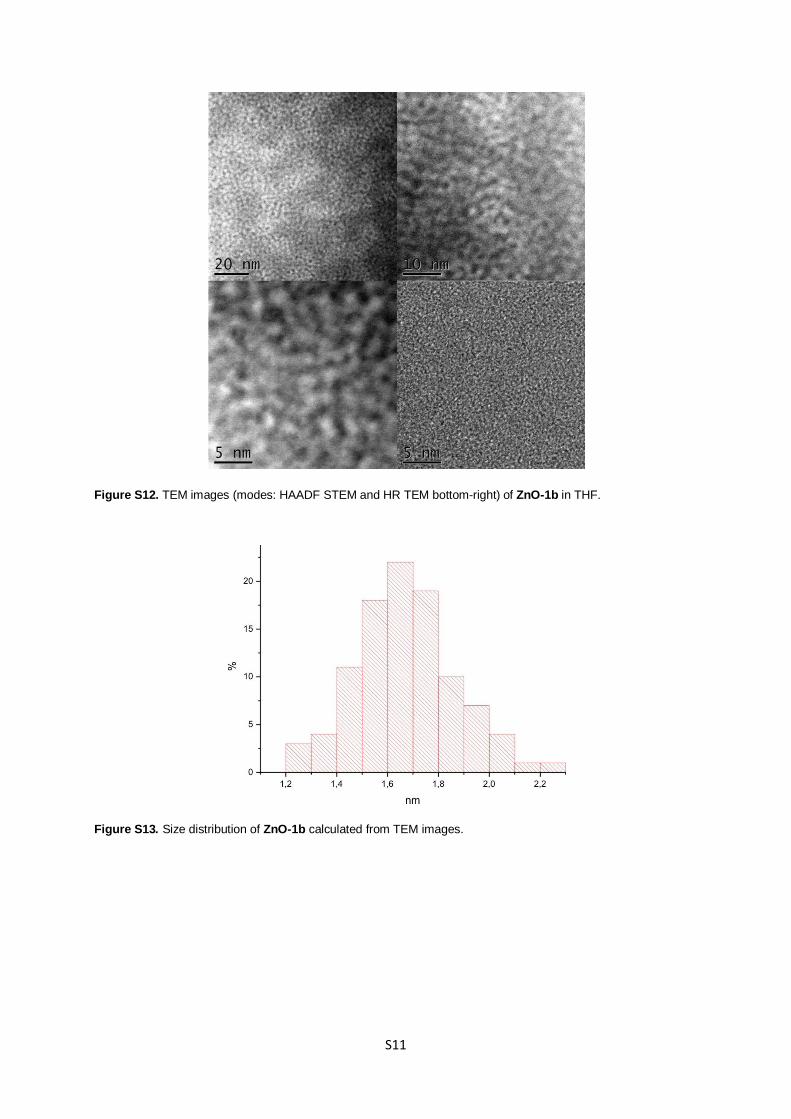
Figure S12. TEM images (modes: HAADF STEM and HR TEM bottom-right) of ZnO-1b in THF.
Figure S13. Size distribution of ZnO-1b calculated from TEM images.
S12
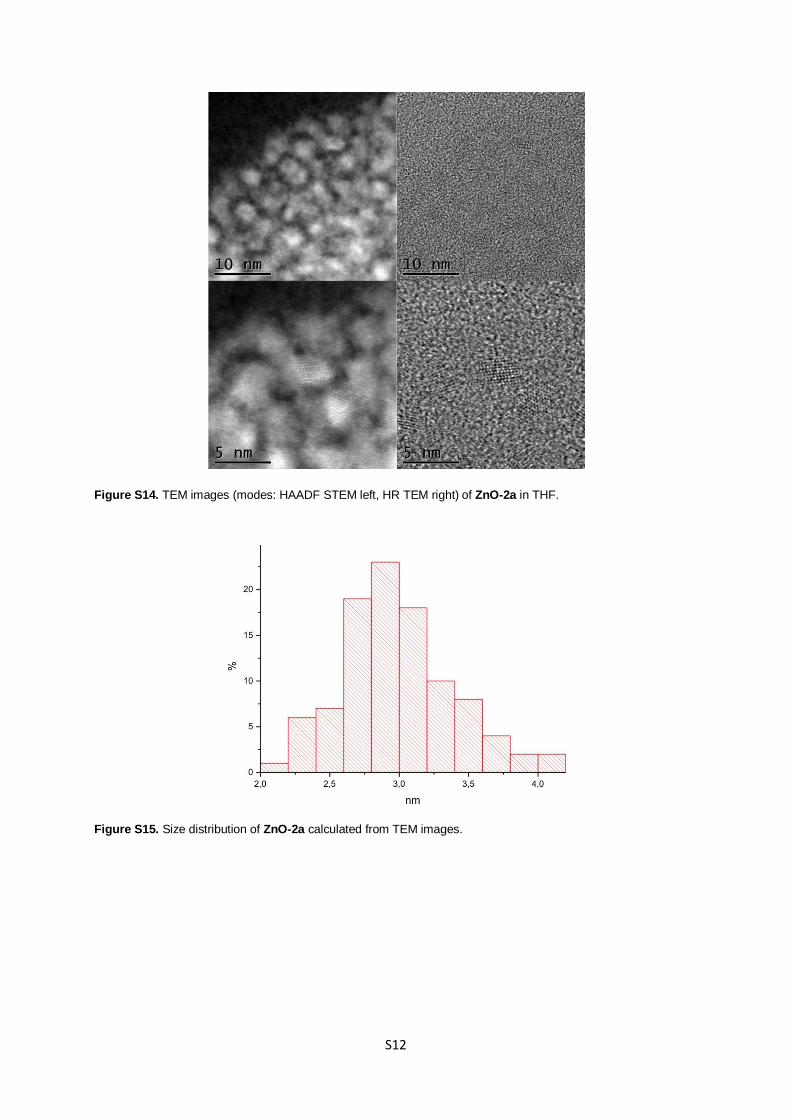
Figure S14. TEM images (modes: HAADF STEM left, HR TEM right) of ZnO-2a in THF.
Figure S15. Size distribution of ZnO-2a calculated from TEM images.
S13
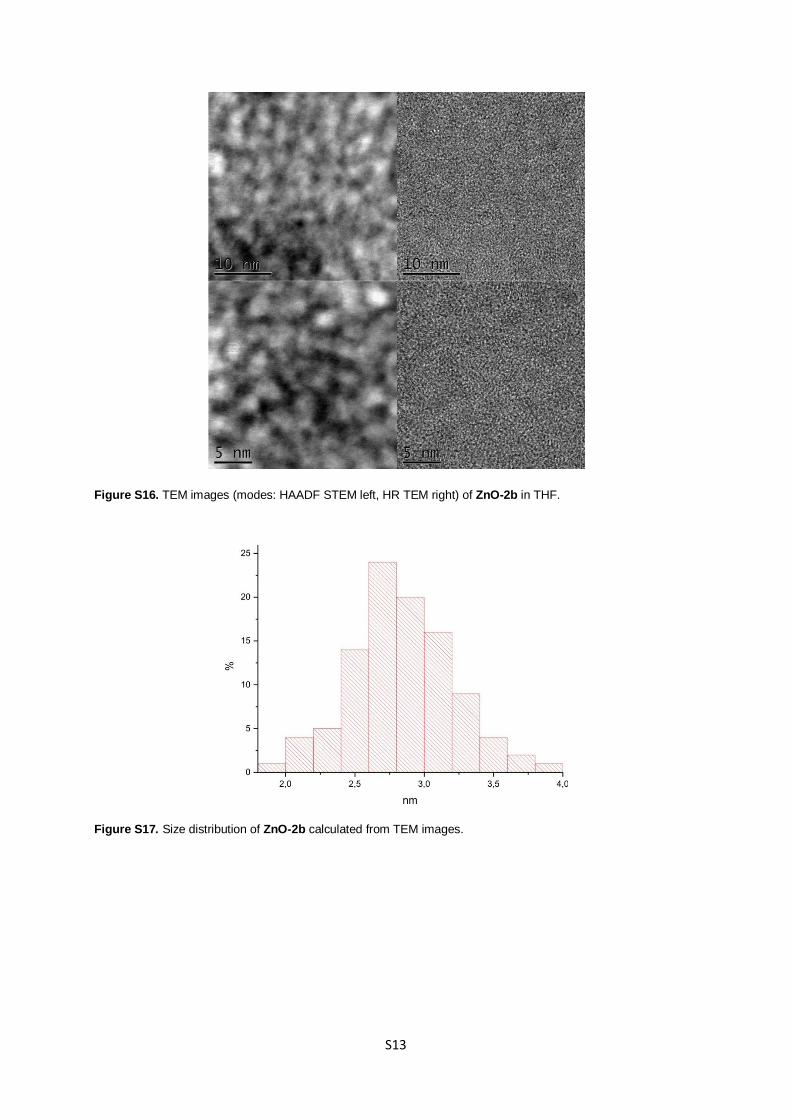
Figure S16. TEM images (modes: HAADF STEM left, HR TEM right) of ZnO-2b in THF.
Figure S17. Size distribution of ZnO-2b calculated from TEM images.
S14
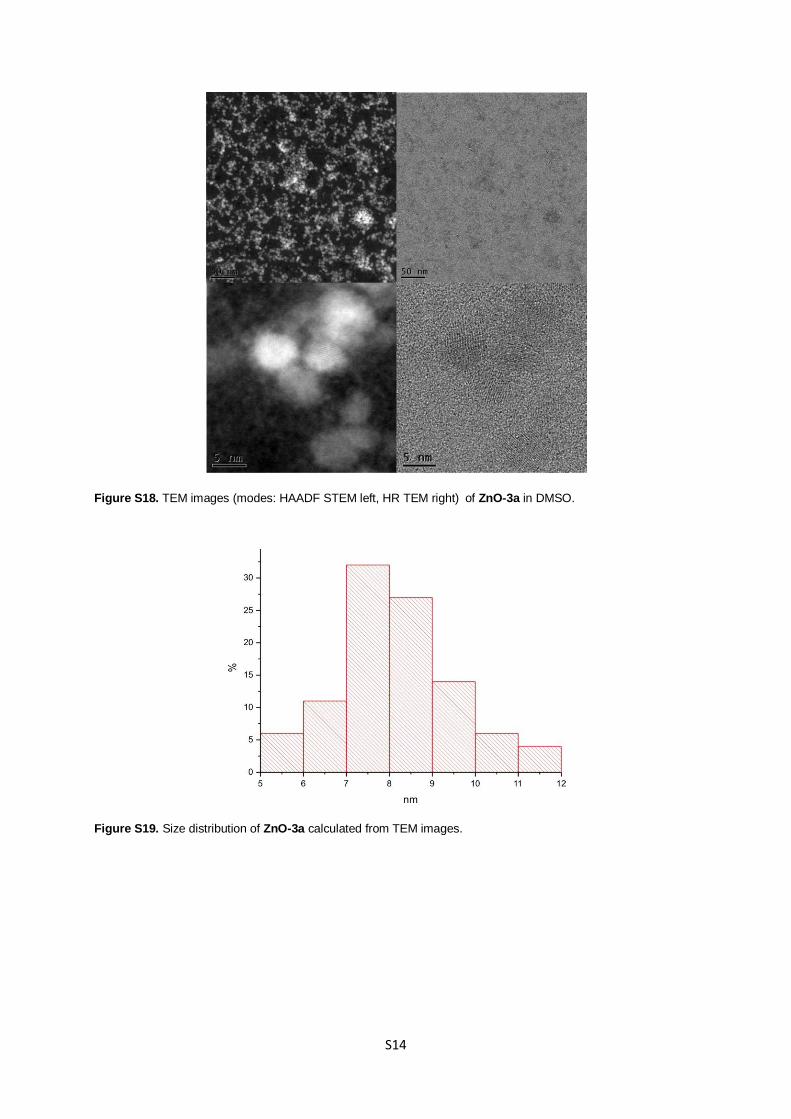
Figure S18. TEM images (modes: HAADF STEM left, HR TEM right) of ZnO-3a in DMSO.
Figure S19. Size distribution of ZnO-3a calculated from TEM images.
S15
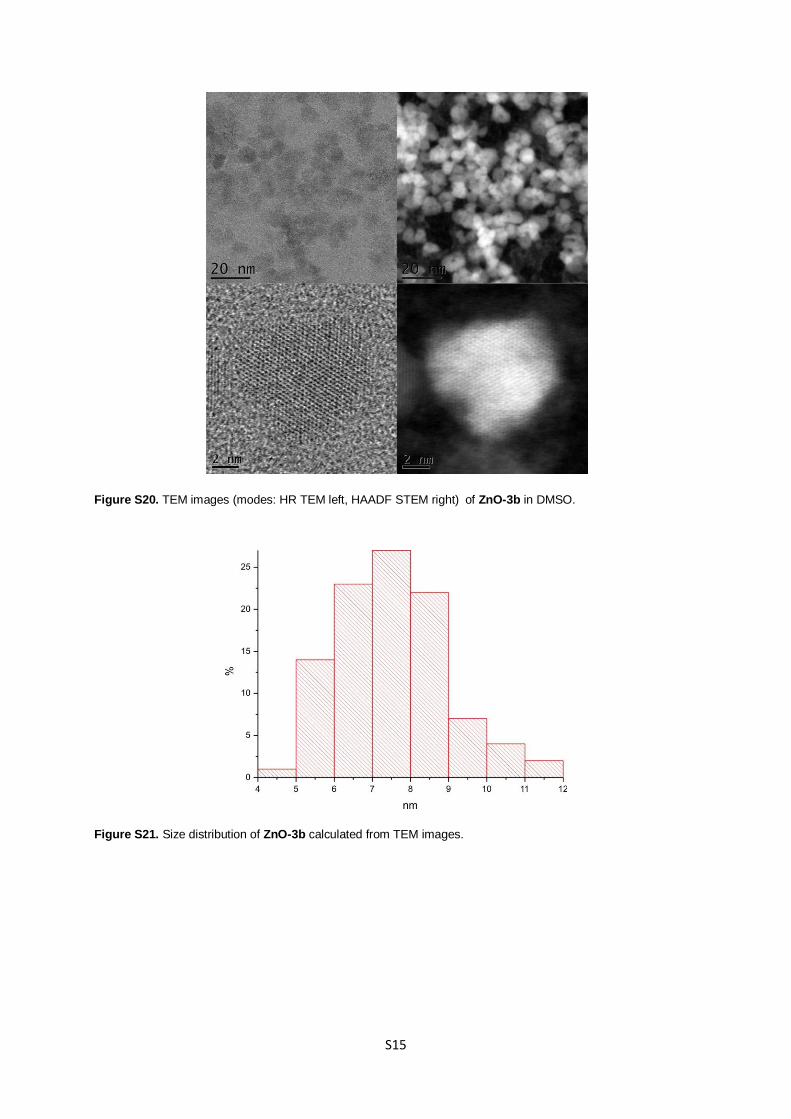
Figure S20. TEM images (modes: HR TEM left, HAADF STEM right) of ZnO-3b in DMSO.
Figure S21. Size distribution of ZnO-3b calculated from TEM images.
S16
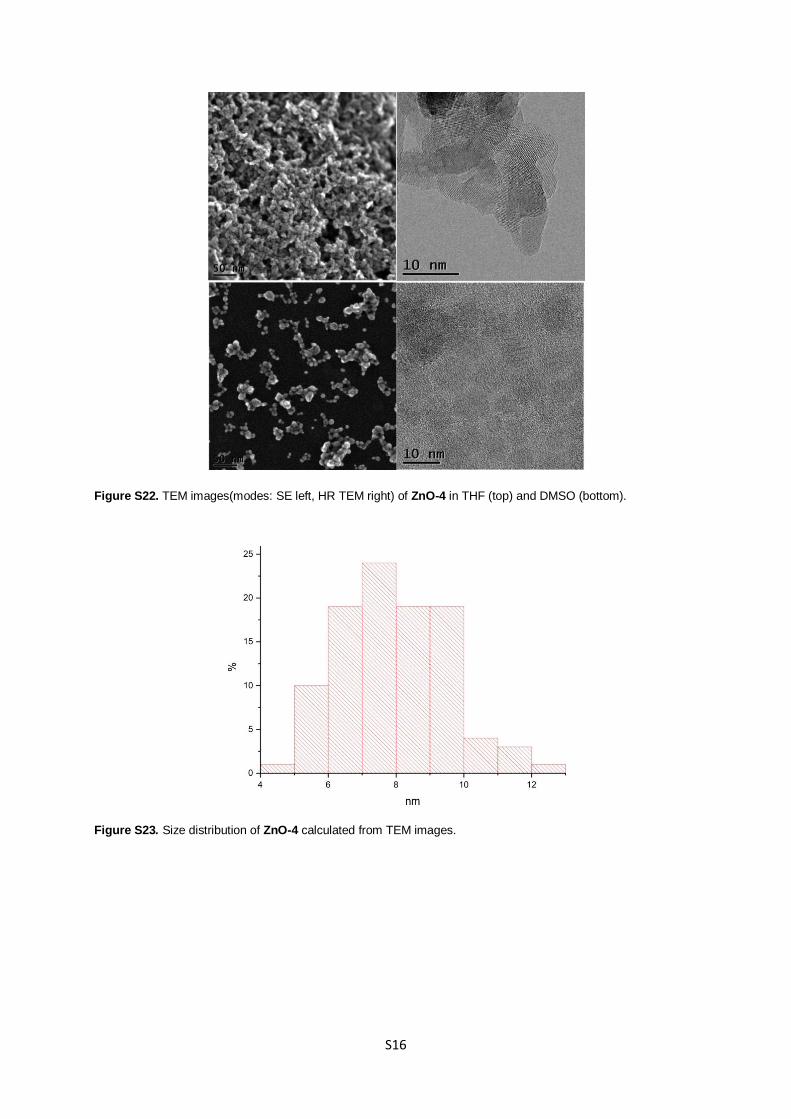
Figure S22. TEM images(modes: SE left, HR TEM right) of ZnO-4 in THF (top) and DMSO (bottom).
Figure S23. Size distribution of ZnO-4 calculated from TEM images.
S17
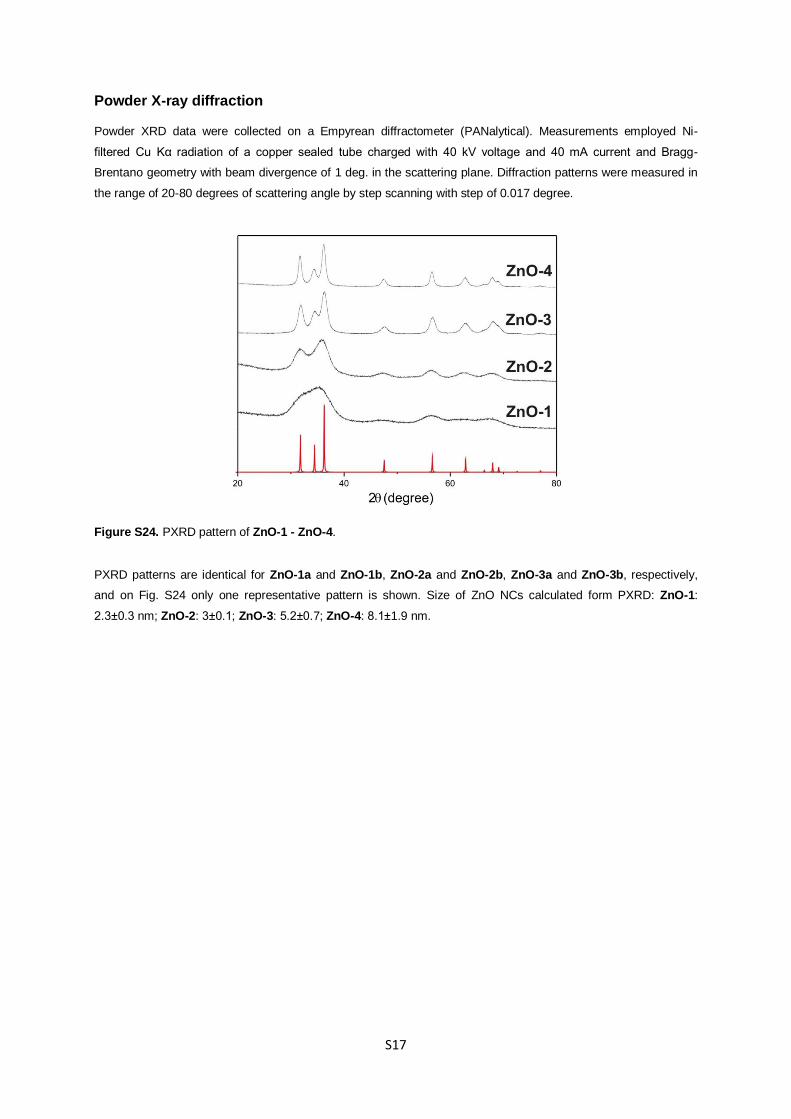
Powder X-ray diffraction
Powder XRD data were collected on a Empyrean diffractometer (PANalytical). Measurements employed Ni-
filtered Cu Kα radiation of a copper sealed tube charged with 40 kV voltage and 40 mA current and Bragg-
Brentano geometry with beam divergence of 1 deg. in the scattering plane. Diffraction patterns were measured in
the range of 20-80 degrees of scattering angle by step scanning with step of 0.017 degree.
Figure S24. PXRD pattern of ZnO-1 - ZnO-4.
PXRD patterns are identical for ZnO-1a and ZnO-1b, ZnO-2a and ZnO-2b, ZnO-3a and ZnO-3b, respectively,
and on Fig. S24 only one representative pattern is shown. Size of ZnO NCs calculated form PXRD: ZnO-1:
2.3±0.3 nm; ZnO-2: 3±0.1; ZnO-3: 5.2±0.7; ZnO-4: 8.1±1.9 nm.
S18
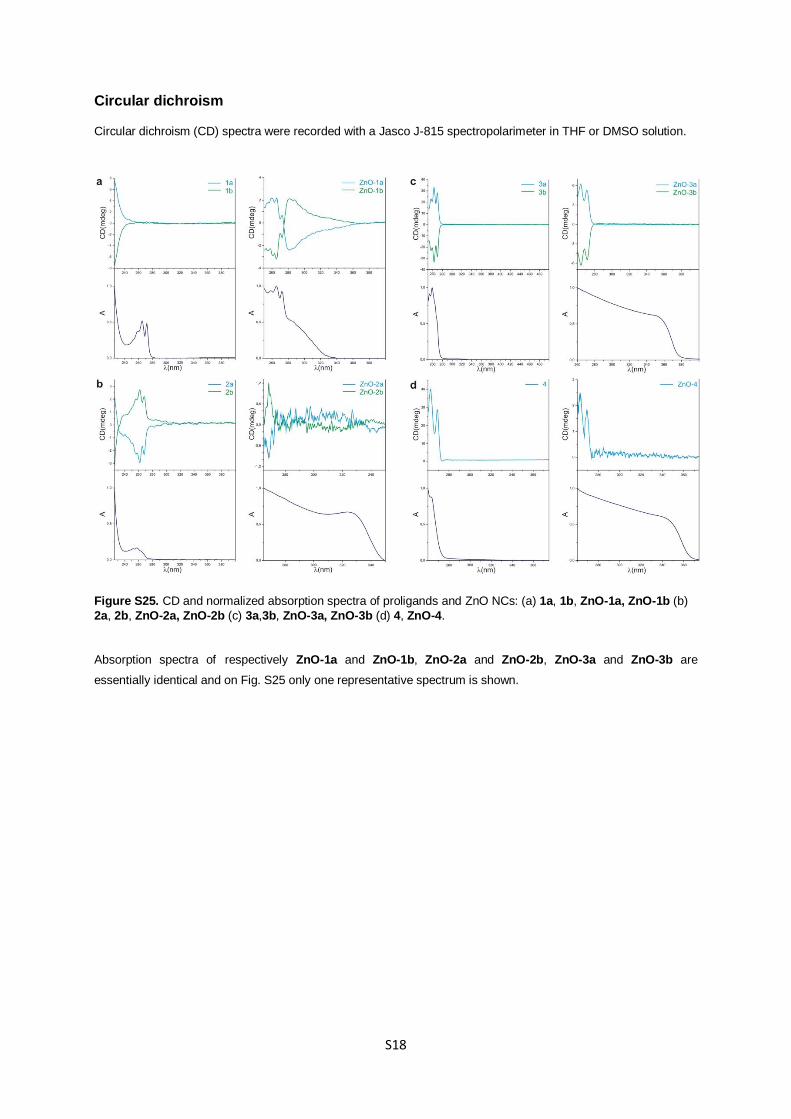
Circular dichroism
Circular dichroism (CD) spectra were recorded with a Jasco J-815 spectropolarimeter in THF or DMSO solution.
Figure S25. CD and normalized absorption spectra of proligands and ZnO NCs: (a) 1a, 1b, ZnO-1a, ZnO-1b (b)
2a, 2b, ZnO-2a, ZnO-2b (c) 3a,3b, ZnO-3a, ZnO-3b (d) 4, ZnO-4.
Absorption spectra of respectively ZnO-1a and ZnO-1b, ZnO-2a and ZnO-2b, ZnO-3a and ZnO-3b are
essentially identical and on Fig. S25 only one representative spectrum is shown.