Embed Size (px)
Citation preview
AANN OOBBJJEECCTT OORRIIEENNTTEEDD MMOODDEELLIINNGG FFRRAAMMEEWWOORRKK FFOORR TTHHEE
AARRTTEERRIIAALL WWAALLLL
by
Manuel Ignacio Balaguera Jiménez MSc
DDOOCCTTOORR AALL TTHHEE SSII SS
DDOO CCTTOORRAALL PPRROOGGRRAAMM IINN EENNGGIINN EEEE RR IINNGG
GGRROO UUPP OO FF BB IIOOMMEEDDIICCAALL EENNGGIINNEEEE RR IINNGG
DDEEPPAARRTT MMEENNTT OOFF MMEE CCHH AANNIICCAALL EENNGGIINNEEEERR IINN GG
UUNNIIVVEERRSS II TT YY OO FF LLOOSS AANN DDEESS
Juan Carlos Briceño T., PhDDirector
Professor, Department of Mechanical Engineering;Director, Group of Biomedical Engineering School of Engineering, University of Los Andes, Bogotá, Colombia.
James Alexander Glazier, PhDCo-director
Professor, Physics Department; Adjunct Professor , School of Informatics; Adjunct Professor, Biology Department; Director, Biocomplexity InstituteIndiana University, Bloomington, Indiana, USA.
BBOOGGOOTTÁÁ,, DDCC,, CCOO LLOO MMBB IIAA ,, MMAARRCCHH 22000077
UUNN GGEENNEERRAADDOORR DDEE MMOODDEELLOO SS OORR II EENN TTAADD OO AA OOBBJJ EETTOO SS
PPAARRAA LLAA PPAARREEDD AARRTTEERR IIAALL
Por
Manuel Ignacio Balaguera Jiménez, MSc
TTEESS II SS DDOOCCTTOORRAALL
PPRROOGGRRAAMMAA DDEE DDOO CCTT OORRAADDOO EENN IINNGGEENNII EERR ÍÍAA
GGRRUUPPOO DD EE IINN GGEENNII EERR ÍÍAA BBIIOO MMÉÉDDIICCAA
DDEEPPAARRTT AAMMEENNTTOO DD EE IINN GGEENNII EERR ÍÍAA MMEE CCÁÁNN IICCAA
UUNNIIVVEERRSS IIDD AADD DDEE LLOO SS AANN DDEESS
Juan Carlos Briceño T., PhDDirector
Profesor Titular, Departamento de Ingeniería Mecánica,Director del Grupo de Ingeniería BiomédicaFacultad de Ingeniería, Universidad de Los AndesBogotá, Colombia
James Alexander Glazier, PhDCodirector
Profesor, Departamento de Física; Profesor Adjunto, Escuela de Informática; Profesor Adjunto, Departamento de Biología; Director, Instituto de Biocomplejidad, Universidad de Indiana, Bloomington, Indiana, EE.UU.
BBOOGG OOTTÁÁ,, DD.. CC.. ,, CCOOLLOOMMBB IIAA.. MMAARRZZOO DDEE 22000077

To God: the Holy Trinity: Father, Son, Holy Spirit
To my Heavenly Mother Mary
IV
Acknowledgements
There are many people I would like to thank, for several reasons.
First, I would like to thank my Director and Co-director, Dr. Juan Carlos Briceño
and Dr. James A. Glazier. Their support, in all aspects, was fundamental in every
moment and step of my doctorate. It has been a life gift to find them on my
way.
Second, thanks to the University of Los Andes, Javeriana University and Indiana
University for all their support and trust, without which it would have been
impossible even to start my doctorate.
To Dr. Marcela Hernandez. Her help in the computational aspects of the work
was strategically important.
To Dr. Felipe Uriza for his advice at the time of my doctoral candidacy
examination.
Finally, to my family and friends for all the things that only can be called love.
To my wife Cristina, my daughters Ana María and María Camila, my son Manuel
Felipe, because their many sacrifices and prayers gave me the desire,
commitment and Holly Spirit necessary to walk the way.
To my parents, Manuel Ignacio and Lilia Graciela, the root of my being.
To my brothers and sisters, Carlos, Alejandro, Elisa, Pilar, Nubia y Enrique
Antonio, again, because of their love.
To my uncle, José Antonio Balaguera O. P. because of his love and help.
To my master and friend, Milciades Díaz, because of his friendship and guidance.
V
Abstract
A general object oriented framework for the modeling of the arterial wall is presented and
illustrated by the use of a toy model, an ideal case study. The main utility and novelty of the
presented framework is the possibility to design, develop and implement highly customizable
artery models, taking advantage of the continuously improving field of imaging technology.
Additional strategic uses of the presented framework are:
The implementation of simulators to optimize the design and production of biomedical
solutions such as vascular grafts and vascular angioplasty devices and procedures.
The implementation of hemodynamics simulators.
The development of artery models to be included in higher scope whole body models
such as Physiome, injury and trauma simulators.
The implementation of case studies for educational purposes.
In our present knowledge, this is the first initiative leading to model the arterial wall from the
object oriented perspective. The existing models do not allow a close structural mapping with
the real artery as in the present object oriented modeling framework. In the other hand,
object oriented models are highly portable, upgradable and understandable. The arterial wall,
differs substantially from a homogeneous or composite material. It is composed of a great
variety of autonomous living and nonliving objects. The passive behavior of arterial wall was
considered and in this way, the tunica adventitia was the objective system. In the case
study, an object oriented model of arterial wall was designed, developed and implemented.
The model implementation was made first in UML (Unified Modeling Language), in order to
facilitate its study, communication and maintenance, and then implemented in JAVA.
Together with the model, a simulation engine, based on matrix structural mechanics was
implemented. In order to verify the model, two series of simulation experiments were
conducted: one series for axial loading and the other one for pressure-volume. Each series
began with a sensitivity analysis in order to determinate the best parameter combination that
will produce both physically meaningful results as close to pre-determined analog controls:
one calves’ artery in the case of axial loading and one rat mesenteric artery. The truss
structures that best reproduced the control analog plots were a truss with one layer and four
rings for axial loading and a truss with one layer and three rings for pressure-volume loading.

VI
In both cases the simulated results reproduced qualitatively and quantitatively the analog
stress-strain plots: calves’ artery and rat mesenteric artery. After some improvements and an
additional testing, this model can be used for explore and evaluate the validity of a set of
hypothesis on arteries microstructure, its long term dynamical behavior, and modified to
include new components such as tunica adventitia ground substance, tunica media and
tunica intima. In the case of tunica media, the model can be used to explore active arteries
behavior under pulsatile regime.
VII
Resumen
Se presenta una metodología general, orientada a objetos, para el modelado de la pared
arterial y es ilustrada mediante el uso de un prototipo, un caso de estudio idealizado. La
principal utilidad y novedad de la metodología presentada es la posibilidad de diseñar,
desarrollar e implementar modelos arteriales altamente adaptables a casos particulares,
sacando provecho de la tecnología de imágenes en permanente evolución.
Otros usos estratégicos de la presente metodología son:
La implementación de simuladores para el diseño y producción óptima de soluciones
biomédicas tales como los injertos vasculares y los dispositivos y procedimientos usados
en angioplastia vascular
La implementación de simuladores de hemodinámica
El desarrollo de modelos de arterias para ser incluidos en modelos de cuerpo humano
completo tales como el Fisioma y los simuladores de lesiones y trauma.
La implementación de casos de estudio para propósitos educativos.
Según lo que conocemos actualmente, esta es la primera propuesta para el modelado
orientado a objetos de la pared arterial. Los modelos existentes no permiten una
representación estructural tan próxima a la real como lo hace la presente metodología
orientada a objetos. De otra parte, los modelos orientados a objetos son altamente
portables, actualizables y entendibles. La pared arterial difiere substancialmente de un
material homogéneo o de uno compuesto. Dicha pared está conformada por una gran
variedad de objetos autónomos tanto vivos como no vivos. En una primera aproximación al
modelado orientado a objetos de la pared arterial, solo se consideró el comportamiento
pasivo de la pared arterial y, de esta forma, la túnica adventicia fue el sistema objeto. En el
presente trabajo se diseñó, desarrolló e implementó un modelo orientado a objetos de pared
arterial. La implementación del modelo fue realizada, en primera instancia, en UML (Lenguaje
Unificado de Modelado) para facilitar su estudio, comunicación y mantenimiento, y luego fue
implementado en JAVA. Junto al modelo se implementó un motor de simulación con base en
la teoría de la mecánica estructural matricial. Con el fin de verificar el modelo, se realizaron
dos series de experimentos de simulación: una serie para carga axial y la otra para presión-
volumen. Cada serie comenzó con un análisis de sensibilidad para determinar la mejor
VIII
combinación de parámetros que diese como producto resultados físicamente significativos y
con la mayor aproximación a aquellos reportados por las muestras análogas de control
predeterminadas: una arteria de ternero y una arteria mesentérica de rata. La armadura
espacial que mejor reprodujo las gráficas correspondientes a las muestras análogas de
control fue una estructura con una capa y cuatro anillos para la carga axial y una armadura
de una capa y tres anillos para el caso de presión-volumen. En ambos casos los resultados
de las simulaciones reprodujeron en una buena aproximación, tanto cualitativa como
cuantitativamente las gráficas correspondientes a las muestras de control análogas. Tras
algunas mejoras y pruebas adicionales, este modelo puede usarse para realizar ensayos
sobre la validez de hipótesis referentes a la micro estructura de las arterias, su
comportamiento dinámico de largo plazo, y modificado para incluir nuevos componentes
como por ejemplo la substancia base de la túnica adventicia, la túnica media, y la túnica
íntima. En el caso de la túnica media, el modelo puede usarse para explorar el
comportamiento activo de las arterias bajo régimen pulsátil.
IX
TTAABBLLEE OOFF CCOONN TTEENNTTSS
Introduction 1
1. Theoretical Framework 5
1.1. Anatomy and physiology of arterial wall 5
1.2. Hemodynamics and the arterial wall 9
1.3. Constitutive models of the arterial wall 11
1.4. Arterial wall microstructure: collagen fibrils 19
1.5. Arterial wall microstructure: elastin fibrils 21
1.6. Arterial wall microstructure: ground substance 21
1.7. The arterial wall as a complex system 22
1.8. Epistemological framework: Object Oriented Modeling 24
2. Methodology and tools 27
2.1. Model design and implementation 27
2.2. Ontology of the artery in the universe of discourse
of arterial wall simulator 29
2.3. Simulation system implementation 30
2.4. Verification simulation experiments protocol 31
3. Results 32
3.1. Model design and implementation 32
3.2. Simulation system 39
3.3. Simulation experiments results 42
4. Discussion 50
4.1. Model design and implementation 50
4.2. Simulation system 50
4.3. Axial loading experiments 51
4.4. Pressure volume experiments 53
5. Conclusions 55
Bibliography 60
1
AANN OOBBJJEECCTT OORRIIEENNTTEEDD MMOODDEELLIINNGG FFRRAAMMEEWWOORRKK
FFOORR TTHHEE AARRTTEERRIIAALL WWAALLLL
Introduction
The cardiovascular system, composed by the heart, blood vessels and blood, has as
main functions:
1. Transportation of oxygen and nutrients to all body tissues.
2. Transportation of carbon dioxide and metabolic waste products from the tissues
to the lungs and excretory system organs.
3. Distribution of water, electrolytes and functional proteins throughout the body.
4. Contribute to the function of immune system
5. Thermoregulation.
In order to accomplish those functions, the heart acts as a pump giving to the blood
the necessary kinetic energy in order to reach all the body tissues.
In each phase of the heart’s mechanical cycle (pulsatile regime), the mechanical
energy generated as a result of the work done by the heart on the blood is
dynamically driven (transported, buffered, and dissipated) as blood’s kinetic energy,
vessels strain energy and dissipative work (heat) due to the blood´s viscosity.
Any change, in the shape of a vessel or in its mechanical properties, leads to an
abnormal physiological state of the whole cardiovascular system and as a
consequence to pathological temporary states such as ischemia, in some cases to
irreversible damage to and organ (chronic diseases) and in another cases to death.
Changes in a vessel shape, mainly an abrupt radius change (narrowing: stenosis,
widening: aneurism) produces turbulence in the motion of the blood.
When blood is in an appropriate physiological state, its motion is laminar: the velocity
field lines of the fluid are all parallel with minimal loss of fluid’s kinetic energy. In the
2
case of turbulence, velocity field lines curls and there is a high loss of fluid’s kinetic
energy slowing down the transport processes in the blood together with local
production of heat which activates bio-physical-chemical processes leading to local
phase transitions, thrombus formation: ischemia and causing tissue poor irrigation
and tissue death.
On the other hand, when there is arterial wall hardening or softening, the strain
energy buffering function of the vessel is altered and as a consequence its
compliance (impedance) changing the interference patterns of pressure waves in
the blood and, again, a slowing down of transport processes.
The dynamical state of the blood and the shape and mechanical properties of the
vessels are therefore interdependent features of the cardiovascular system which is
quantitatively represented by the mathematical and computational models of
hemodynamics.
As every science, hemodynamics knowledge is a set of models: an abstract
representation of cardiovascular system’s attributes and behaviors.
In the case of blood, there are well established mathematical models to represent its
mechanical behavior (motion): Navier-Stokes equations for short range fluid motion,
Moens-Korteweg equation for pulsatile regime transport processes (pressure waves)
and Poiseuille equation, the master equation relating blood flux, (blood volume per
second across an unitary volume), with the axial pressure gradient P, the local inner
radius, r, and the local transport resistance, R, due to the vessel’s wall.
Actually, Poiseuille equation considers vessel’s resistance just as a function of blood’s
viscosity and do not take into account the mechanical properties of the wall. Also,
the local inner radius is considered as uniform which is not true in the real life,
specially in the case of diseased vessels.
Those limitations and the critical importance of the mechanical behavior of the
arterial wall in hemodynamics have given rise to the field of arterial wall constitutive
modeling.
Different models of the mechanical behavior of the arterial wall have been proposed
3
and implemented.
Deterministic models such as Kelvin–Voight, Maxwell and the linear standard solid
have been obtained from analogies with lumped parameters mechanical systems
composed by springs and dashpots.
Those models give a relation between applied forces and resulting deformations in
the form of a constitutive equation obtained by combining the elementary
constitutive relations = for the springs and = for the dashpots, where
represents the stress supported by the element, the elastic modulus of the spring,
the strain of the element, the damping constant of a dashpot and its strain rate.
In order to produce analytically solvable differential equations for the variables under
investigation, materials are considered as hyper-elastic, homogeneous and isotropic.
Of course, arterial wall differs substantially of a material with those characteristics.
To overcome this difference, a great variety of modifications have been introduced,
such as consider the wall as an orthotropic material and to express its elastic property
in terms of parameters given as functions of position. Those modified models are
studied under the general field of finite element models.
All those deterministic and probabilistic models have limitations when used in
situations where the arterial wall composition and microstructure changes in time. For
example, after angioplasty, the wall remodels changing geometry and composition.
Therefore, a static model can not predict accurately the final diameter of the wall
post angioplasty.
To produce dynamical models, different strain energy functions have been
introduced by Fung, Takamizawa, Holzapfel and others allowing the implementation
of probabilistic constitutive models for the wall expressing its mechanical properties
as probability functions of position and time.
Strain energy function based models have improve the modeling capabilities but still
generic in nature and do not allow to explode the growing benefits of imaging
technology in order to produce specific case models.
4
In consequence, the objective of this work is to design, propose and illustrate an
objet oriented modeling framework that allow the construction of specific case
models by considering microstructure and micro-structural components properties.
The specific objectives of the present work are:
To acquire the knowledge in Anatomy and Physiology, Cardiovascular Dynamics
and Complex Systems Modeling required undertaking the project.
To design an arterial wall model, a simulation system, simulation experiments, a
data analysis system and verification experiments.
To implement the previously obtained arterial wall model, a simulation system and
to perform simulation experiments, data analysis and verification simulation
experiments.
To summarize and synthesize the obtained results.
5
1. Theoretical Framework
In this chapter, at a first stage the macroscopic anatomy and physiology of
arterial wall are reviewed. At a second stage, there is an outline of the main facts
about classical hemodynamics. Third, a short discussion on continuum mechanics,
structural mechanics and constitutive models of arterial wall whose state of the
art is reviewed. Following, there is an outline of the tunica adventitia and its
micro structural components and organization. The complexity of arterial wall is
discussed having as framework the up to the date definitions and criteria on
complexity. The chapter finishes with a description of the epistemological and
theoretical foundations of the methodology used to design and develop the
object oriented model of arterial wall.
1.1. Anatomy and Physiology of the Arterial Wall
Arteries are vessels that transport blood from the heart to the tissues and organs
and supply these tissues with nutrients and oxygen. The arterial vessels are
prominent organs composed of soft tissues which transform the pulsatile heart
output into a flow of moderate fluctuations serving as an elastic energy buffer.
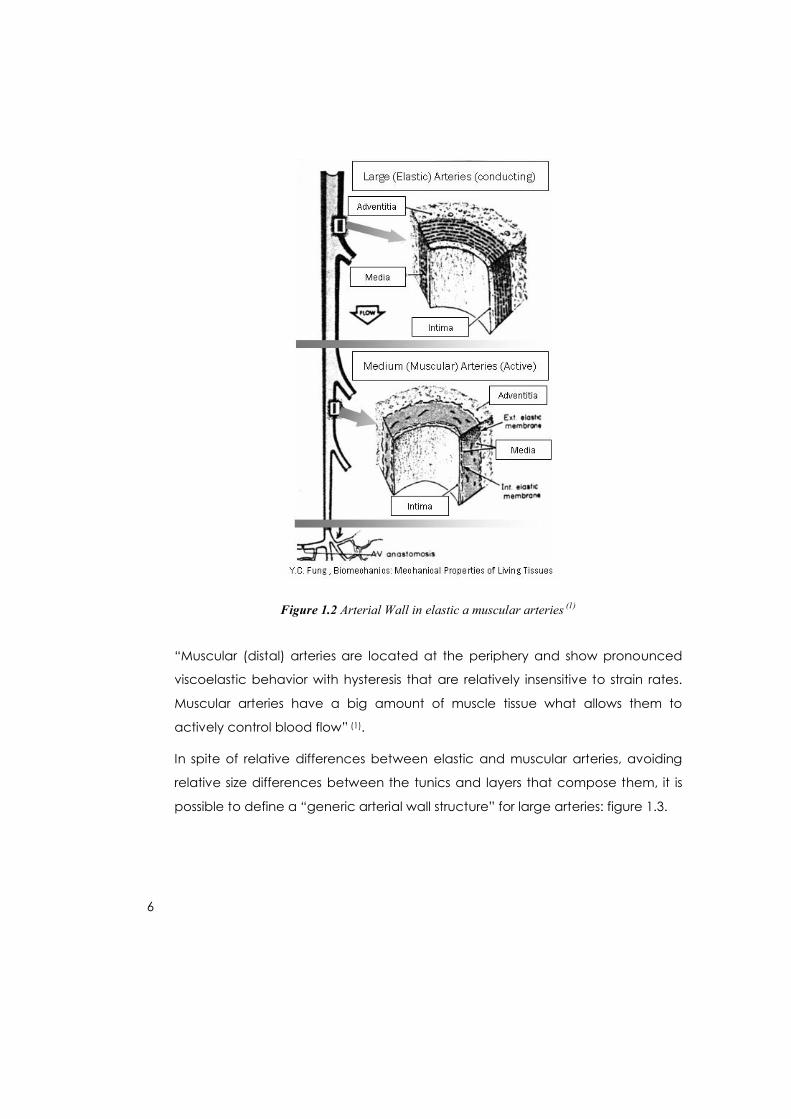
As shown in figure 1.2, along the vascular network, beginning in the heart and
ending in the capillaries, the arterial wall changes in geometry and composition,
giving as a result a broad classification of arteries as elastic, muscular and
capillaries.
“Elastic (proximal) arteries, proximal to the heart, have relatively large diameters
and their composition includes a great amount of elastic fibers (collagen and
elastin) and a lower measure of muscular tissue. The main function of elastic
arteries is the transport of a high flux of blood and in this way, they must support
high pressure (1)”.
6
Figure 1.2 Arterial Wall in elastic a muscular arteries (1)
“Muscular (distal) arteries are located at the periphery and show pronounced
viscoelastic behavior with hysteresis that are relatively insensitive to strain rates.
Muscular arteries have a big amount of muscle tissue what allows them to
actively control blood flow” (1).
In spite of relative differences between elastic and muscular arteries, avoiding
relative size differences between the tunics and layers that compose them, it is
possible to define a “generic arterial wall structure” for large arteries: figure 1.3.
7
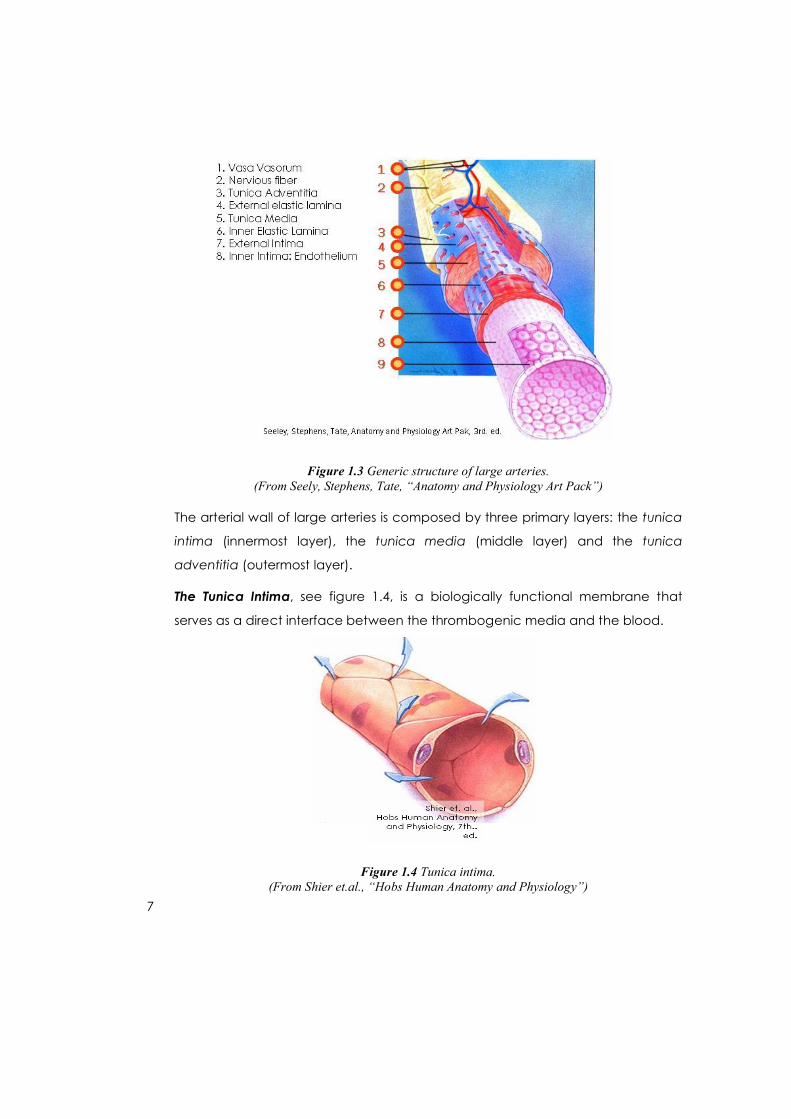
Figure 1.3 Generic structure of large arteries.(From Seely, Stephens, Tate, “Anatomy and Physiology Art Pack”)
The arterial wall of large arteries is composed by three primary layers: the tunica
intima (innermost layer), the tunica media (middle layer) and the tunica
adventitia (outermost layer).
The Tunica Intima, see figure 1.4, is a biologically functional membrane that
serves as a direct interface between the thrombogenic media and the blood.
Figure 1.4 Tunica intima.(From Shier et.al., “Hobs Human Anatomy and Physiology”)
8
In healthy young arteries the intima is a very thin layer and does not contribute to
the mechanical behavior of the arterial wall. The intima thickens and stiffens with
age (atherosclerosis) and in this way, its mechanical behavior and properties
become relevant. The main components of tunica intima are epithelial cells,
and a ground substance mostly composed of proteoglycans and scarce
amounts of elastic fibers.
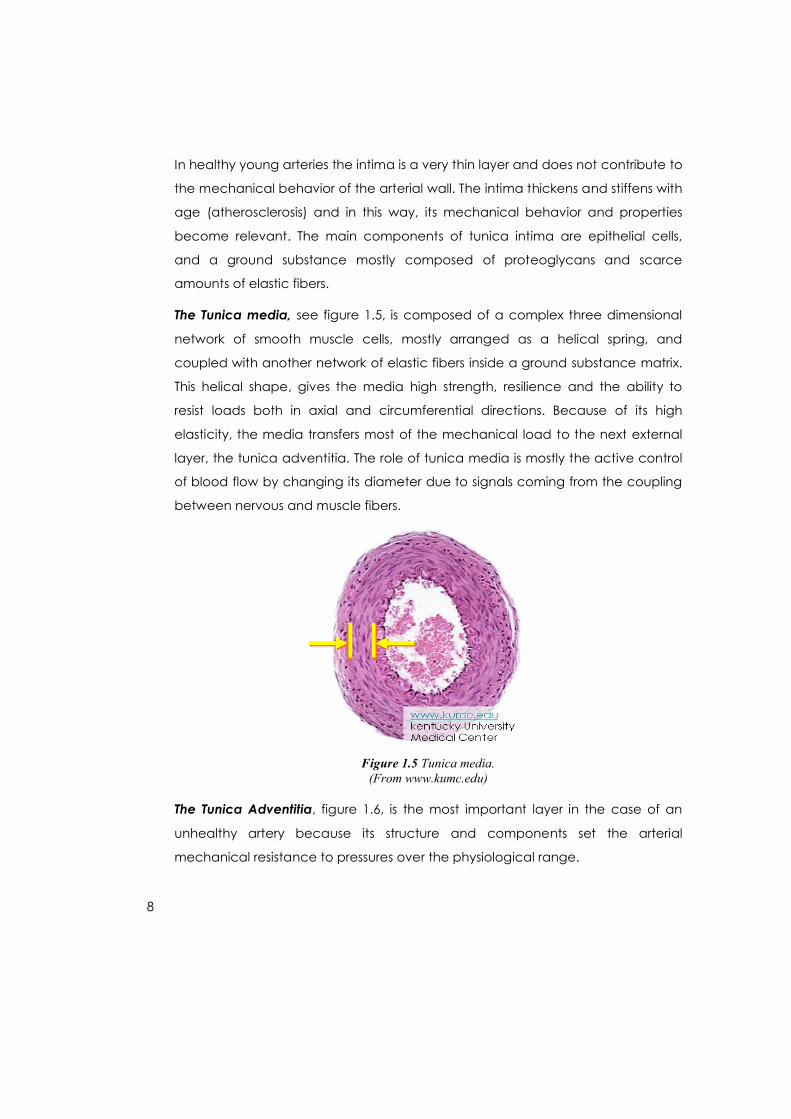
The Tunica media, see figure 1.5, is composed of a complex three dimensional
network of smooth muscle cells, mostly arranged as a helical spring, and
coupled with another network of elastic fibers inside a ground substance matrix.
This helical shape, gives the media high strength, resilience and the ability to
resist loads both in axial and circumferential directions. Because of its high
elasticity, the media transfers most of the mechanical load to the next external
layer, the tunica adventitia. The role of tunica media is mostly the active control
of blood flow by changing its diameter due to signals coming from the coupling
between nervous and muscle fibers.
Figure 1.5 Tunica media.(From www.kumc.edu)
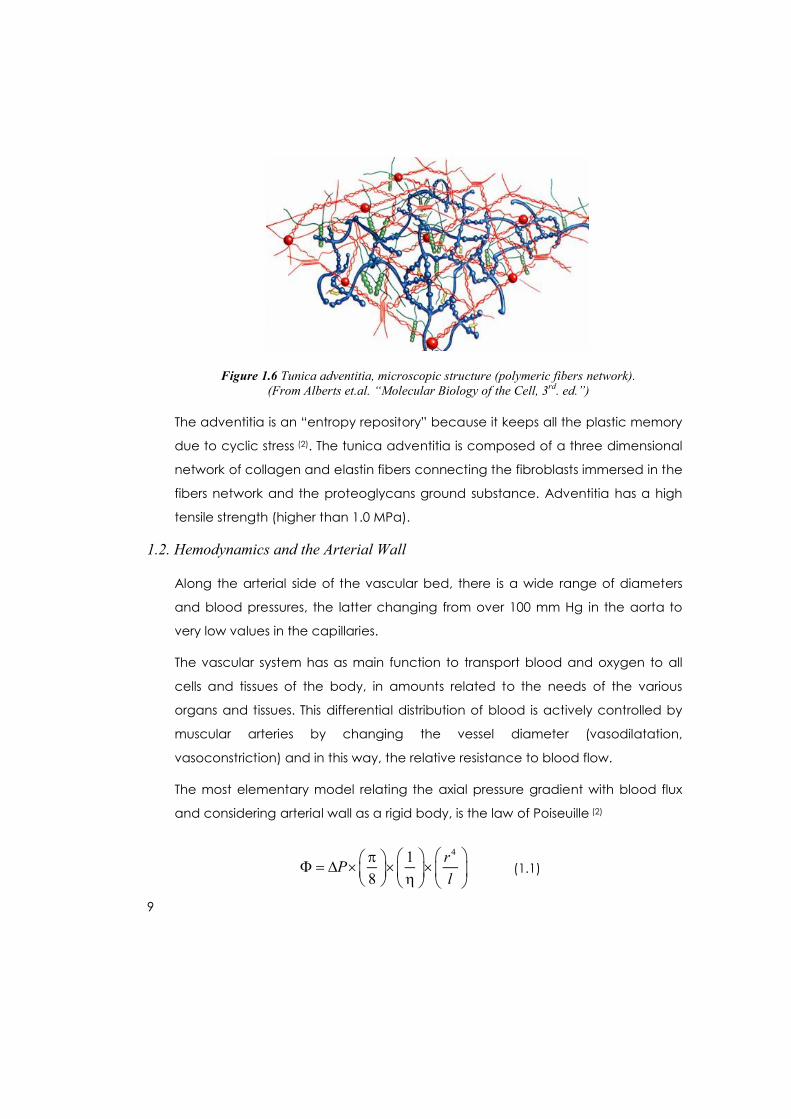
The Tunica Adventitia, figure 1.6, is the most important layer in the case of an
unhealthy artery because its structure and components set the arterial
mechanical resistance to pressures over the physiological range.
9
Figure 1.6 Tunica adventitia, microscopic structure (polymeric fibers network).(From Alberts et.al. “Molecular Biology of the Cell, 3rd. ed.”)
The adventitia is an “entropy repository” because it keeps all the plastic memory
due to cyclic stress (2). The tunica adventitia is composed of a three dimensional
network of collagen and elastin fibers connecting the fibroblasts immersed in the
fibers network and the proteoglycans ground substance. Adventitia has a high
tensile strength (higher than 1.0 MPa).
1.2. Hemodynamics and the Arterial Wall
Along the arterial side of the vascular bed, there is a wide range of diameters
and blood pressures, the latter changing from over 100 mm Hg in the aorta to
very low values in the capillaries.
The vascular system has as main function to transport blood and oxygen to all
cells and tissues of the body, in amounts related to the needs of the various
organs and tissues. This differential distribution of blood is actively controlled by
muscular arteries by changing the vessel diameter (vasodilatation,
vasoconstriction) and in this way, the relative resistance to blood flow.
The most elementary model relating the axial pressure gradient with blood flux
and considering arterial wall as a rigid body, is the law of Poiseuille (2)
(1.1)41
8
rP
l
10
Where represents blood flow, P the axial pressure gradient, 1
is the
“viscosity factor” and 4r
l
is the “geometrical factor” involving r , the mean
arterial radius and l , the length of the considered vessel segment. By definition,
the “resistance to flow”, R is the ratio of the driving force (the pressure gradient)
to the flow, which results in
(1.2)
The resistance depends on the two factors, the viscosity factor , and the
geometrical factor 4
l
r
. This “fourth power law” expresses a highly sensitive
control of the distribution of blood flow by the geometry of the vessels (mainly
diameter). One important limitation of the Poiseuille model is that the viscosity is
constant (Newtonian fluid) and therefore, does not consider the rate of flow and
diameter dependence of and so, of the resistance. However, it has been
found that in the physiological range of blood flow for a healthy vessel, blood
behaves as if it were Newtonian.
In opposition to Poiseuille model, blood vessels are distensible and their geometry
depend upon the transmural pressure, TMP , within them. In this way, the
Poiseuille model becomes inadequate to define a flow – pressure relation and
does not contain all the information to determine the flow. It is necessary to add
an equation which recognizes the dependence of the vessels geometry with the
transmural pressure (a “constitutive” equation) with the shape:
(1.3)
Where TMf P represents some function, which may be called “distensibility
function”. It becomes very important to build this function (again, which later will
be called “constitutive equation” or, as in the present project, the “Arterial Wall
4
8 P l
Rr
4
1 TMf P
r
11
Model”).
Laplace’s law relates transmural pressure with vessel’s surface tension, which is
instrumentally measurable, and wall thickness.
(1.4)
Where T represents vessel’s surface tension, 1r and 2r represent the inner and
outer vessel radius. Additional geometry – transmural pressure are available, but
mostly made to express active (muscle driven) wall behavior.
1.3. Constitutive Models of Arterial Wall
Due to the unlimited diversity of material objects, physics classifies them in a small
set of abstract material bodies categories: particles, rigid solids, deformable
solids, fluids, viscoelastic bodies and some additional specialized categories.
Actually, this is an artificial classification because depending upon the spatial
and temporary scales of observation and on the range of applied forces, any
body may be classified in any category.
In agreement with the spatial scales, temporary scales and forces ranges
present in physiological conditions, arteries are considered as deformable solids
and the most common used models are those coming from continuum
mechanics.
In addition to continuum mechanics, the experimental methods used to
characterize deformable bodies will be briefly exposed. However, in order to
comply with the proposed epistemological approach of the present work,
object orientation, structural mechanics will be used in the design of the arterial
wall modeling framework and in the implementation of the simulation engine
used for the model framework verification.
Continuum mechanics
“A material continuum is a material for which the densities of mass, momentum
and energy exist in the mathematical sense. The mechanics of such a material
1 2
1 1
TMP T
r r
12
continuum is continuum mechanics” (3)
When a given set of forces or a force field is applied to an elastic body, there is a
“volumetric distribution of force” in the body which is characterized by a stress
field and a strain field. Those fields together represent the complete mechanical
state of the body.
From a general perspective, stress and strain are mathematically represented by
one tensor respectively. A tensor is a 3x3 matrix, where each row is a vector that
quantify the tensor in a specific address, generally normal to a symmetry plane
of the body.
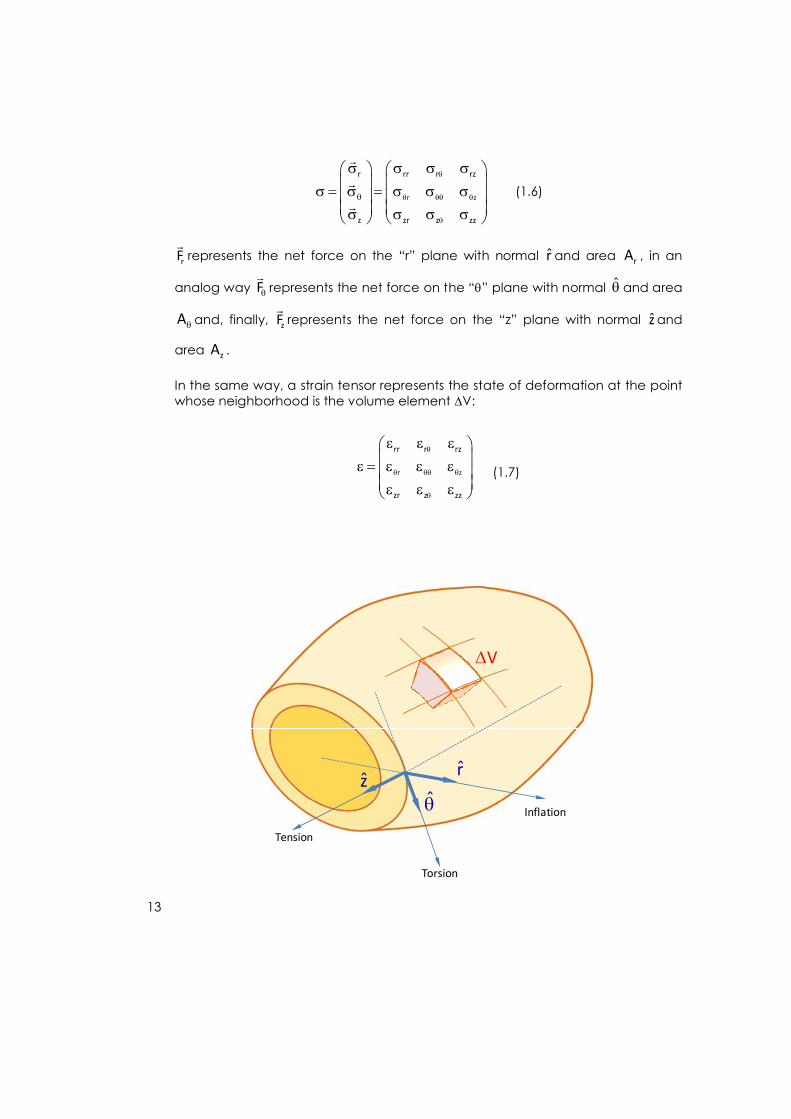
In order to illustrate what tensors are and how to represent them, let us consider
what occurs with a hollow cylinder with a thick wall (an ideal model of an arterial
segment).
The cylinder has three symmetry directions: radial, circular and axial. Each
direction corresponds to one point cylindrical coordinate: r, and z, respectively
and to a deformation mode: volumetric (inflation): change in “r”, torsion:
change in “” and tension (traction, axial): change in “z”, see figure 1.7.
As illustrated by figure 1.8, the stress tensor is the matrix composition of three
stress vectors, each one corresponding to a plane of symmetry:
r
r rr r rz rr r r r rz rr r
ˆ ˆ ,1 1 1ˆ ˆˆ ˆr z where = F.r, = F . = F.zA A A
(1.5.a)
r z r zˆ ˆ,
1 1 1ˆ ˆˆ ˆr z where = F .r, = F . = F .zA A A
(1.5.b)
z z z zz z z
z
r r z z zz zz z
ˆ ˆ,1 1 1ˆ ˆˆ ˆr z where = F .r, = F . = F .zA A A
(1.5.c)
And the complete stress tensor is:
13
r z
r rr r rz
z zr z zz
(1.6)
rF
represents the net force on the “r” plane with normal r and area rA , in an
analog way F
represents the net force on the “” plane with normal and area
A and, finally, zF
represents the net force on the “z” plane with normal z and
area zA .
In the same way, a strain tensor represents the state of deformation at the point whose neighborhood is the volume element V:
(1.7)
Torsion
Tension
Inflation
r
z
V
r z
rr r rz
zr z zz
14
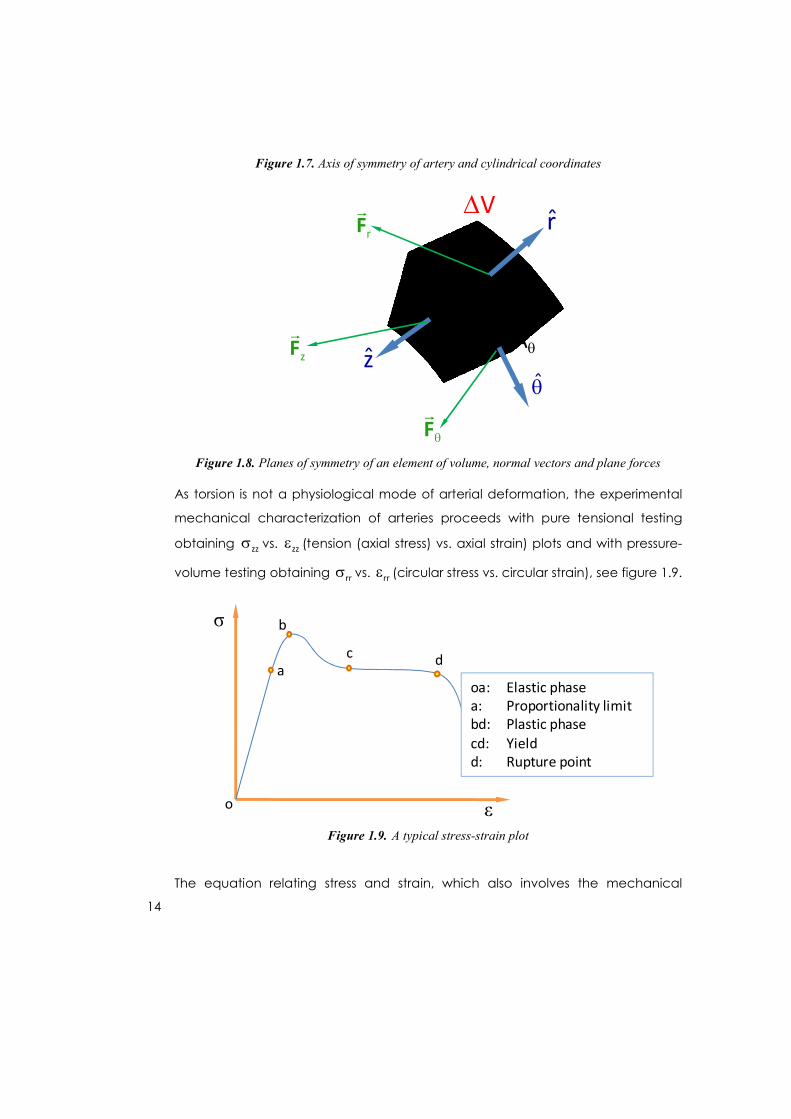
Figure 1.7. Axis of symmetry of artery and cylindrical coordinates
Figure 1.8. Planes of symmetry of an element of volume, normal vectors and plane forces
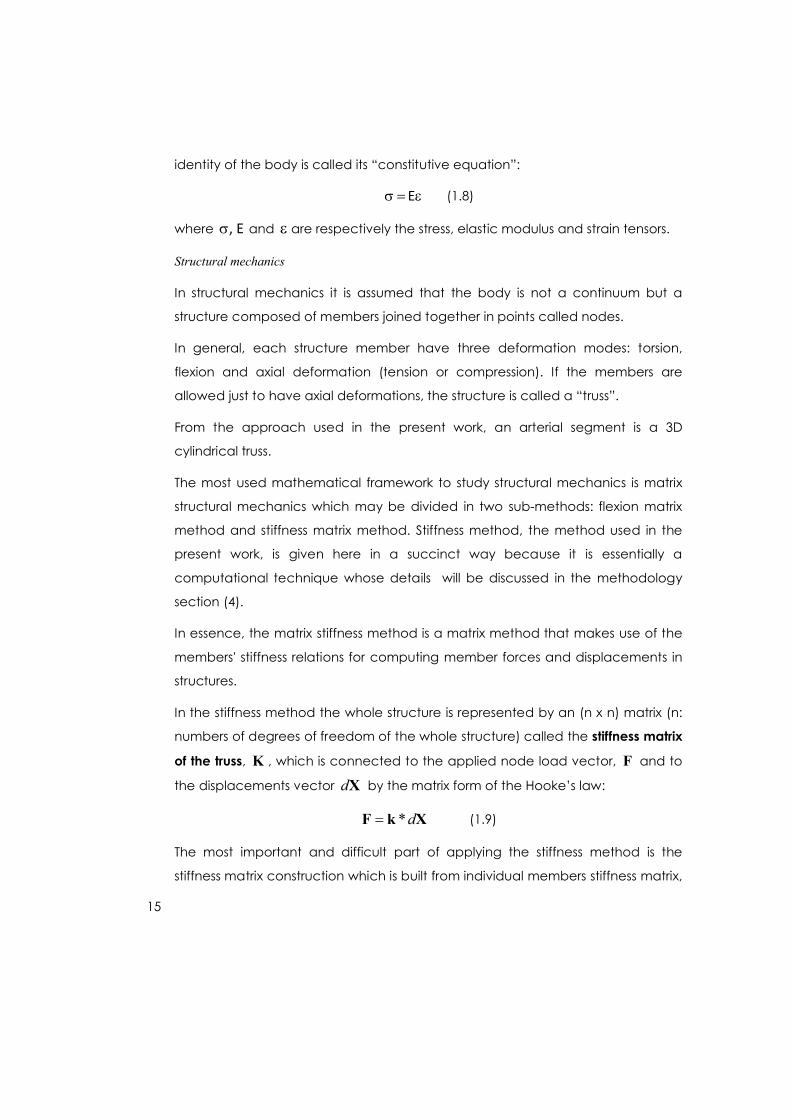
As torsion is not a physiological mode of arterial deformation, the experimental
mechanical characterization of arteries proceeds with pure tensional testing
obtaining zz vs. zz (tension (axial stress) vs. axial strain) plots and with pressure-
volume testing obtaining rr vs. rr (circular stress vs. circular strain), see figure 1.9.
Figure 1.9. A typical stress-strain plot
The equation relating stress and strain, which also involves the mechanical
r
z
rF
zF
F
V
AzAr
A
σ
ε
a
b
c d
oa: Elastic phasea: Proportionality limitbd: Plastic phasecd: Yieldd: Rupture point
o
15
identity of the body is called its “constitutive equation”:
E (1.8)
where , E and are respectively the stress, elastic modulus and strain tensors.
Structural mechanics
In structural mechanics it is assumed that the body is not a continuum but a
structure composed of members joined together in points called nodes.
In general, each structure member have three deformation modes: torsion,
flexion and axial deformation (tension or compression). If the members are
allowed just to have axial deformations, the structure is called a “truss”.
From the approach used in the present work, an arterial segment is a 3D
cylindrical truss.
The most used mathematical framework to study structural mechanics is matrix
structural mechanics which may be divided in two sub-methods: flexion matrix
method and stiffness matrix method. Stiffness method, the method used in the
present work, is given here in a succinct way because it is essentially a
computational technique whose details will be discussed in the methodology
section (4).
In essence, the matrix stiffness method is a matrix method that makes use of the
members' stiffness relations for computing member forces and displacements in
structures.
In the stiffness method the whole structure is represented by an (n x n) matrix (n:
numbers of degrees of freedom of the whole structure) called the stiffness matrix
of the truss, K , which is connected to the applied node load vector, F and to
the displacements vector dX by the matrix form of the Hooke’s law:
*dF k X (1.9)
The most important and difficult part of applying the stiffness method is the
stiffness matrix construction which is built from individual members stiffness matrix,
16
a six by six (space members) matrix.
Once the stiffness matrix has been built, the unknown displacements matrix Xd
may be obtained from the known nodal forces vector, F, and the inverse of the
stiffness matrix, 1k from the matrix solution equation:
1d X k F (1.10)
Since the cylindrical truss is a statically determined system and because of
symmetry (translational invariance of local groups) it may be shown (4) that the
stiffness matrix is upper triangular and easily solved by the Gauss Jordan method.
Constitutive equation and constitutive model
The passive mechanical behavior of the arterial wall is governed mainly by its
microstructure: the configuration of its fibrous network and the mechanical state
and properties of its micro-components such as collagen and elastin fibrous
bundles (fibrils).
However, up to the date, all the proposed constitutive models describe the wall
in an artery as a macroscopic system avoiding small regional variations which
being small in size influence greatly the whole cardiovascular system.
From a general standpoint, a constitutive equation is an equation relating
external actions or agents (i.e. force, magnetic field) with the objects response
(acceleration, deformation, magnetization) and with the material properties of
the object (mass, elastic modulus, magnetic susceptibility).
In recent days the concept of “constitutive model” has been isolated from the
“constitutive equation” in order to represent the object without dependence of
the external agents condition.
In this way, the term “arterial wall constitutive model” refers to the representation
of the mechanical identity of the wall of a particular artery by a mathematical
structure (a number, a matrix) or a computational data structure, not the cause-
consequence equation or computational function.
17
The closer the constitutive model to the real artery, better (more useful and
accurate) the predictions or prognostics made by the use of a constitutive
equation or a simulation computer program.
Present constitutive models of arterial wall may be classified in:
C1. Models with deterministic, global, time independent parameters: Maxwell,
Voigt, Standard Linear solid (4).
C2. Models with deterministic, position dependent, time independent
parameters: Fung, Takamizawa (1).
C3. Models with probabilistic, position dependent, time independent
parameters: Holzapfel, Baajiens, Barocas and Tranquillo (2) (6) (7).
C4. Empirical models
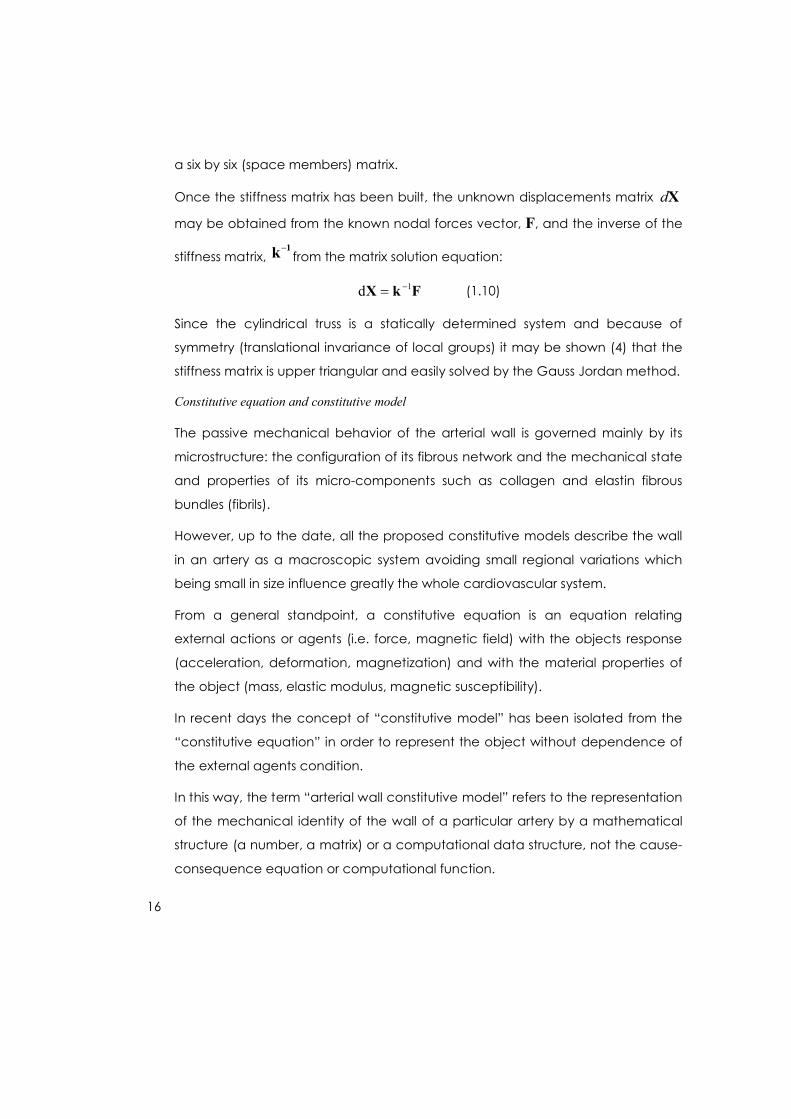
Deterministic parameters models are derived from analogy between an arterial
segment and a mechanical analog model made of springs and dashpots. The
main used analog models are Maxwell solid model, Voigt model and Standard
Linear Solid, which are shown in figure 1.7:
Figure 1.7 Models of linear viscoelastic solids: (a) Maxwell, (b) Voigt, (c) Standard Linear Solid
(From Y. C. Fung: “Continuum Mechanics” (3))
Those models have as parameters: the stiffness constant, , of each used spring
and the coefficient of viscosity, , of each used dashpot.
Deterministic, global, time independent parameters are used under
homogeneity and isotropy hypothesis and allow to explore, from a general
standpoint, hysteresis, relaxation and creep behaviors of the modeled arterial
segment. As an example, see figures 1.8 and 1.9:
18
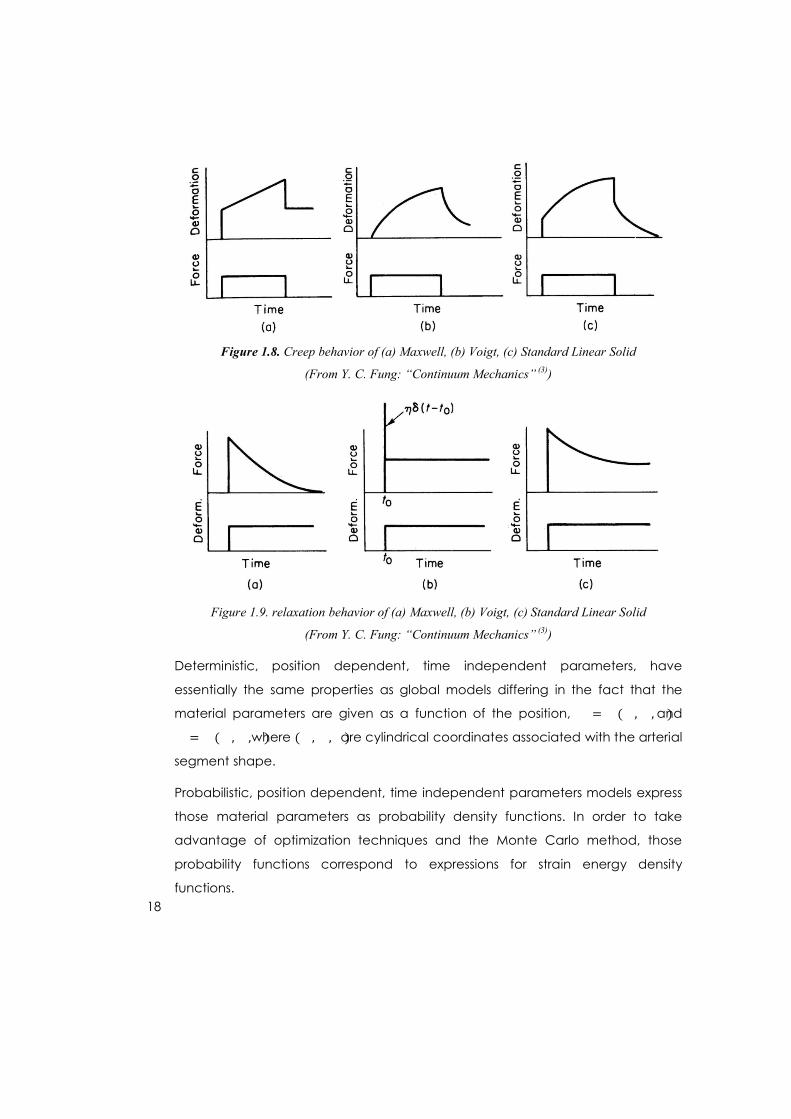
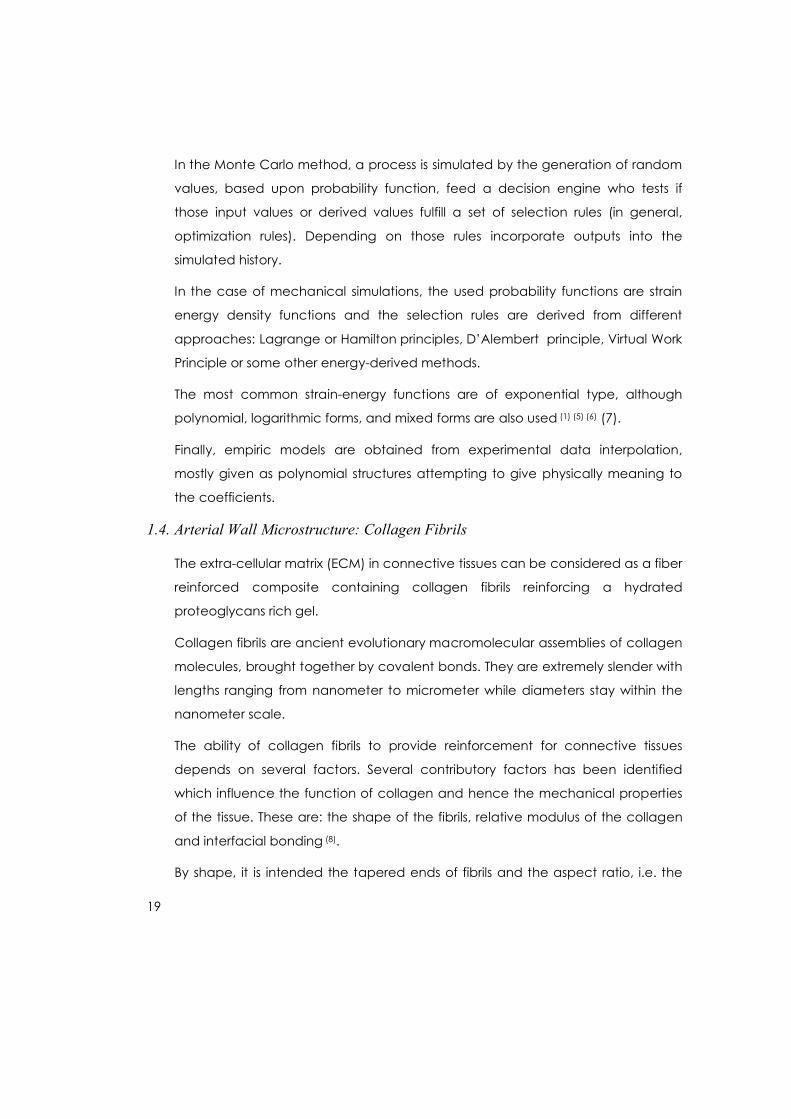
Figure 1.8. Creep behavior of (a) Maxwell, (b) Voigt, (c) Standard Linear Solid
(From Y. C. Fung: “Continuum Mechanics” (3))
Figure 1.9. relaxation behavior of (a) Maxwell, (b) Voigt, (c) Standard Linear Solid
(From Y. C. Fung: “Continuum Mechanics” (3))
Deterministic, position dependent, time independent parameters, have
essentially the same properties as global models differing in the fact that the
material parameters are given as a function of the position, = ( , , )and
= ( , , )where ( , , )are cylindrical coordinates associated with the arterial
segment shape.
Probabilistic, position dependent, time independent parameters models express
those material parameters as probability density functions. In order to take
advantage of optimization techniques and the Monte Carlo method, those
probability functions correspond to expressions for strain energy density
functions.
19
In the Monte Carlo method, a process is simulated by the generation of random
values, based upon probability function, feed a decision engine who tests if
those input values or derived values fulfill a set of selection rules (in general,
optimization rules). Depending on those rules incorporate outputs into the
simulated history.
In the case of mechanical simulations, the used probability functions are strain
energy density functions and the selection rules are derived from different
approaches: Lagrange or Hamilton principles, D’Alembert principle, Virtual Work
Principle or some other energy-derived methods.
The most common strain-energy functions are of exponential type, although
polynomial, logarithmic forms, and mixed forms are also used (1) (5) (6) (7).
Finally, empiric models are obtained from experimental data interpolation,
mostly given as polynomial structures attempting to give physically meaning to
the coefficients.
1.4. Arterial Wall Microstructure: Collagen Fibrils
The extra-cellular matrix (ECM) in connective tissues can be considered as a fiber
reinforced composite containing collagen fibrils reinforcing a hydrated
proteoglycans rich gel.
Collagen fibrils are ancient evolutionary macromolecular assemblies of collagen
molecules, brought together by covalent bonds. They are extremely slender with
lengths ranging from nanometer to micrometer while diameters stay within the
nanometer scale.
The ability of collagen fibrils to provide reinforcement for connective tissues
depends on several factors. Several contributory factors has been identified
which influence the function of collagen and hence the mechanical properties
of the tissue. These are: the shape of the fibrils, relative modulus of the collagen
and interfacial bonding (8).
By shape, it is intended the tapered ends of fibrils and the aspect ratio, i.e. the
20
ratio of length to the diameter.
The relative modulus refers to the ratio of stiffness of collagen fibrils to that of the
hydrated gel.
Interfacial adhesion is pointed out because when a tissue is subjected to an
external load, interfacial adhesion plays an important role in regulating effective
stress transfer from the hydrated gel to the fibrils.
Common general properties of collagen molecules and fibrils are:
Composition: groups of tropocollagen units formed by 3 procollagen polypeptide
chains ( chains) coiled about each other into left-handed triple helixes.
Collagen molecule length: ~280 nm, diameter: ~1.5 nm.
Collagen fibril length: from 1 to 10 times collagen molecule length, diameter:110-
120 nm in young adults.
Types of collagen fiber:
Type I: found in bone, tendon, ligament, and skin
Type II: found in articular cartilage, nasal septum, and sternal cartilage
Type III: found in loose connective tissues, the dermis of the skin, and blood
vessel walls
Tensile strength of collagen fiber:
closely associated with the number and quality of the cross-links within and
between the collagen molecules
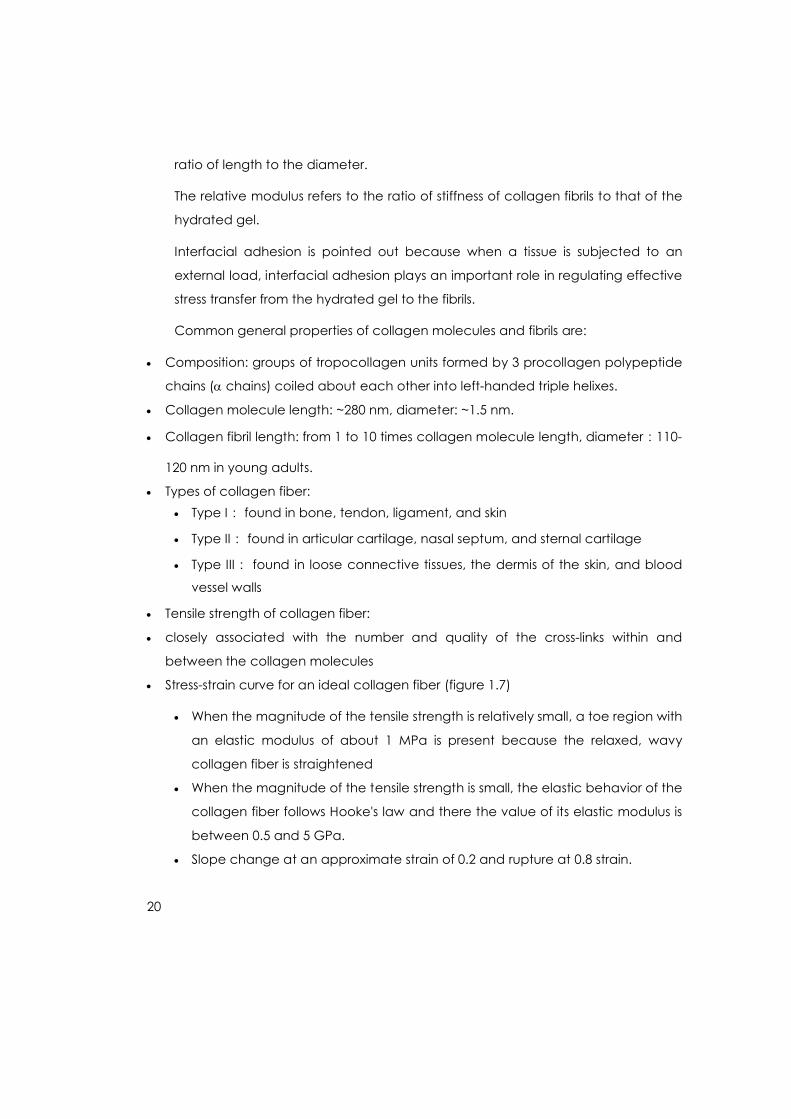
Stress-strain curve for an ideal collagen fiber (figure 1.7)
When the magnitude of the tensile strength is relatively small, a toe region with
an elastic modulus of about 1 MPa is present because the relaxed, wavy
collagen fiber is straightened
When the magnitude of the tensile strength is small, the elastic behavior of the
collagen fiber follows Hooke's law and there the value of its elastic modulus is
between 0.5 and 5 GPa.
Slope change at an approximate strain of 0.2 and rupture at 0.8 strain.
21
Figure 1.10 Stress-strain curve of single collagen fibril.(From http://www.pt.ntu.edu.tw/hmchai/Biomechanics/BMmaterial/Collagen.htm)
1.5. Arterial Wall Microstructure: Elastin Fibrils
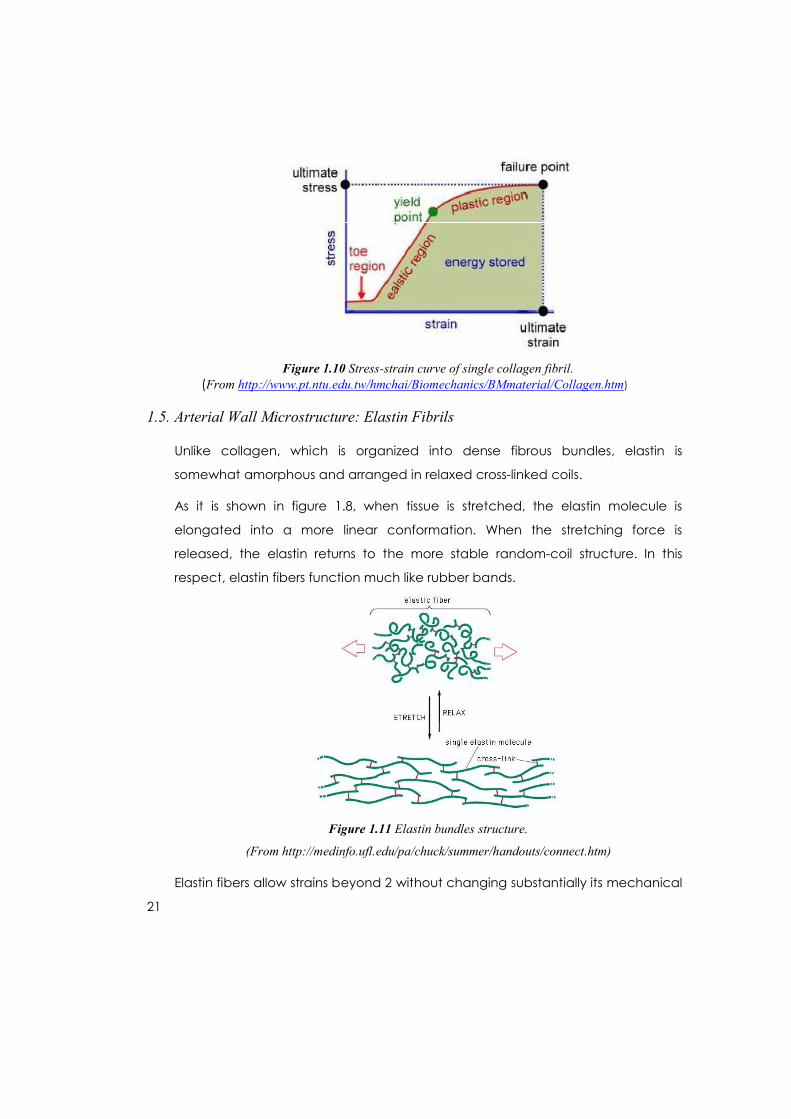
Unlike collagen, which is organized into dense fibrous bundles, elastin is
somewhat amorphous and arranged in relaxed cross-linked coils.
As it is shown in figure 1.8, when tissue is stretched, the elastin molecule is
elongated into a more linear conformation. When the stretching force is
released, the elastin returns to the more stable random-coil structure. In this
respect, elastin fibers function much like rubber bands.
Figure 1.11 Elastin bundles structure.
(From http://medinfo.ufl.edu/pa/chuck/summer/handouts/connect.htm)
Elastin fibers allow strains beyond 2 without changing substantially its mechanical
22
properties, mainly maintaining its elastic modulus which is between 0.5 and 5
MPa.
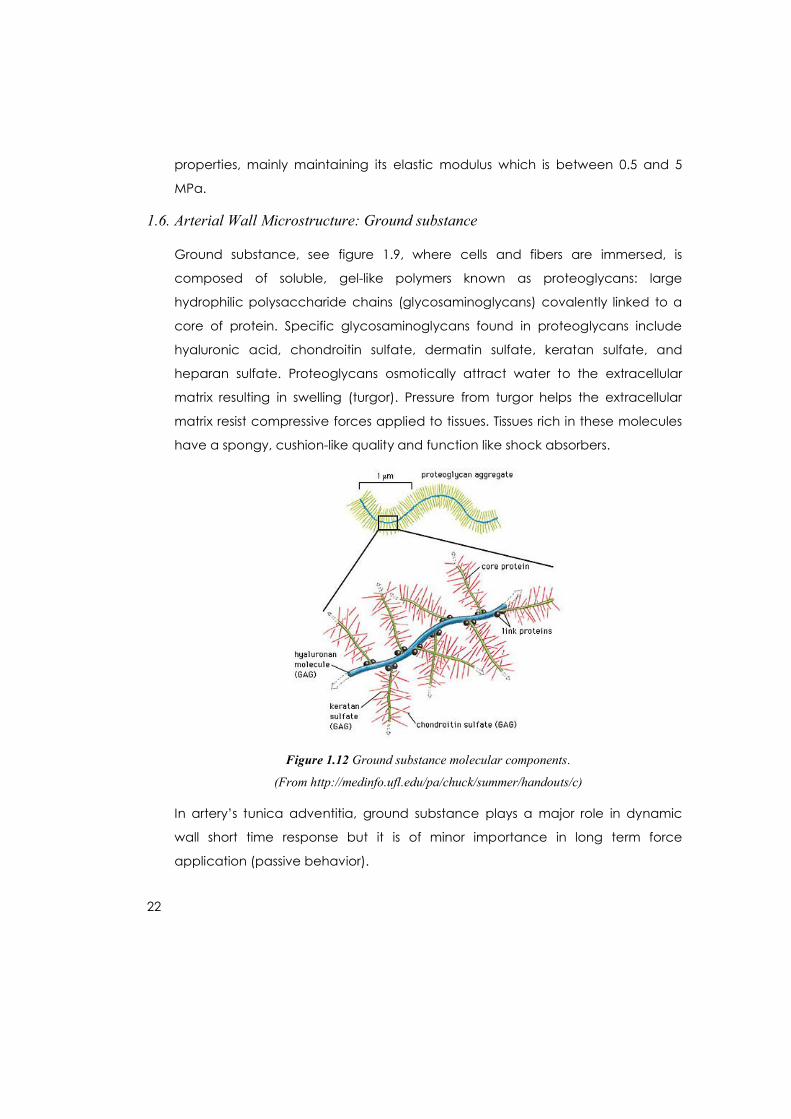
1.6. Arterial Wall Microstructure: Ground substance
Ground substance, see figure 1.9, where cells and fibers are immersed, is
composed of soluble, gel-like polymers known as proteoglycans: large
hydrophilic polysaccharide chains (glycosaminoglycans) covalently linked to a
core of protein. Specific glycosaminoglycans found in proteoglycans include
hyaluronic acid, chondroitin sulfate, dermatin sulfate, keratan sulfate, and
heparan sulfate. Proteoglycans osmotically attract water to the extracellular
matrix resulting in swelling (turgor). Pressure from turgor helps the extracellular
matrix resist compressive forces applied to tissues. Tissues rich in these molecules
have a spongy, cushion-like quality and function like shock absorbers.
Figure 1.12 Ground substance molecular components.
(From http://medinfo.ufl.edu/pa/chuck/summer/handouts/c)
In artery’s tunica adventitia, ground substance plays a major role in dynamic
wall short time response but it is of minor importance in long term force
application (passive behavior).
23
1.7. Arterial Wall as a complex system
In spite of the lack of consensus about what are the main concepts defining the
emerging science of complexity, what they mean and how to quantify them, it is
possible to establish a minimum set of features which a system needs in order to
be called a “complex system” (9) (10) (11):
Instability: Complex systems tend to have many possible modes of behavior,
often shifting between these modes as the result of small changes in some factors
governing the system.
Arterial wall is a perfect instance of instability: it behaves as a perfect elastic body
when supports loads in the physiological range but gets stiffer as the load
increases beyond a threshold. Also, as it will be shown in the present work, the
rupture process has a special dynamics revealing its structural levels.
Irreducibility: Complex systems come as a unified whole; they cannot be studied
just by breaking them into their component parts, looking at them in isolation and
superposing the resulting variables. The behavior of the system is determined by
the interaction among the parts, and the problem of integration of the individual
part models into a global one is of major importance.
Adaptability: Complex systems tend to be composed of many intelligent agents,
who take decisions and actions on the basis of partial information about the entire
system. Moreover, these agents are capable of changing their decision rules on
the basis of such information. In the case of arterial wall, it is possible to find to
different levels of autonomy: first in the relay between elastin and collagen fibers
when supporting loading and second in a much higher complexity level, the
biological response mainly leaded by fibroblasts consisting in the expression of
fibrogens and other extracellular matrix remodeling factors.
Emergence: Complex systems produce surprising behavior; in fact, they produce
behavioral patterns and properties that just cannot be predicted from knowledge
of their parts taken in isolation. These so-called “emergent properties” are
probably the single most distinguishing feature of complex systems. In arterial wall,
one highly remarkable instance of emergence is atherosclerosis: changes in the
24
mechanical behavior of one small region produce critical events in
hemodynamics and in the systemic physiology of a human being.
When considering the problem of complex systems modeling it is possible to find
two main currents of thinking and working: One, the “physical science
approach”, still reductionist and by using ideas as chaos, continues in search of
a minimum set of principles to explain every natural process. The second one,
which will be followed in the present work, the “cybernetic (systemic) approach”
sees complexity as the feature of a system consisting in the fact that it is
impossible to reduce a high diversity of causal relations (input –output) along the
hierarchy of system components to just one causal relation, or at least a
minimum set of macro causal relations.
Cybernetic approach works upon the idea that a complex system can be
modeled as the integration of a set of autonomous subsystems which will be
modeled in an independent way and integrated by considering those parts as
part of a control system.
It is possible to think that this cybernetic approach may be unreal because puts
aside synergistic (mostly chemical and biological) phenomena. However, it is
more realistic than the approach of considering that it is possible to reduce a
high diversity of autonomous objects and subsystems to just one.
To follow the cybernetic line of thinking and working, Arterial Wall as a complex
system means that it is considered as a system composed of subsystems
(collagen fibers, elastin fibers, ground substance and with a higher level of
autonomy, fibroblasts) In order to predict the global system impact of individual
subsystem properties and behaviors, it is necessary to first abstract and model
individual subsystems, then integrate the subsystem models into just one system
model and finally, to simulate its behavior exploring one diversity of possible
scenarios: loading conditions.
1.8. Epistemological Framework: Object Oriented Modeling
Up to the present, after a deep bibliographical search, an object oriented
25
model of arterial wall or of artery has not been developed. Because of that,
another reason to justify the present work it is the exploration consisting in the
construction of a pure object oriented model, where the behavior of the
modeled system is reproduced by the intercommunication of individual
autonomous objects instead of using an analytical approach where the
simulated system’s states come from the solution of a set of equations written on
the hypothesis of continuity in space and time of the variables used to abstract
the identity of the modeled system (12) (13) (14) (15) (16).
Object oriented modeling deals with two central concepts in science: object
and model.
In the present work one object is one entity that is matter of knowledge and that
have identity: attributes, behaviors and states.
A model is one object used as representation of another object called “the real
object”.
A system is a composed object: one object that has as main attribute its
structure.
The action ok knowing always involves two main steps: one, to discretize reality
into separate units and specify what of those units will be the matter of
knowledge: to interpose (objicere verb in Latin) between reality and the
observer just one entity: the object of knowledge.
The second major step is to extract the main features of the object: those
attributes and behaviors that will allow to the observer to assign one identity to
the object. This step, abstraction of the object’s identity, gives as a result one
idealized representation of the object: an object’s model.
Galileo’s idea, considered as the start of modern science, was to catch the
knowledge, just on the behavior of things, by using structures (mainly equations)
involving variables which represent features of its behavior more than its very
identity.
26
In this way of thinking, object oriented modeling is not just a programming
methodology but a new form (or one coming from the beginning of humankind
but made explicit) of representing knowledge, not about the behavior of the
things, but about the things in themselves by constructing a computer
encapsulation of data and behavior: an object oriented object’s model.
In object oriented modeling the object’s identity is abstracted into a new object,
the model (a “virtual object”) which, in computer science, is an encapsulation of
data structures (the object’s attributes) and programs (the object’s behavior).
The act of knowing in object oriented modeling begins by specifying the
system’s components to be considered, the result of this step depends strongly
on the phenomenological context (the universe of discourse) where the model is
built and on the available measurement resources.
It is important, however, to remark that this second restriction, the measurement
possibility, may be replaced at a first gross stage, by the introduction of
“imaginative elements” such as what was done in the modeling of the atom with
the introduction of the concepts of “electron”, “proton”, “neutron”, etc.
27
2. Methodology and Tools
In order to accomplish the planned objectives, the used methodology is
composed of three main steps, which are described in this chapter:
Model design and implementation
Simulation system implementation
Verification experiments and results
The model design and implementation section begins by the requirements
specification and establishing the boundaries of the context. Then a description of
the model is given and also a discussion on the used tools. Following to the
general description of the model, individual UML object component models are
described. A description of the implemented simulation engine is given, a matrix
structural mechanics program implemented from the Weaver-Gere book
referenced in the bibliography. Finally, an account of the model verification
protocol is specified.
2.1 Model design and implementation
In addition to the reasons exposed at the previous section, about modeling the
arterial wall as a complex system, the objectives established in the present work
impose the necessity to design, develop and test an object oriented computer
model of arterial wall under the following premises:
The contribution of this work is a first implementation and should serve just as a
backbone to be extended, improved and used. In this way of thinking,
completeness is not, at this stage, the main objective but maintainability.
The simulation engine uses matrix structural mechanics as the background
theory and the implemented structure deformation engine is a previously
developed program for the field of structural analysis (5). This simulation engine
will be used just for the controlled manipulation of the project’s kernel: the
model. The simulation engine will be only described but not discussed.
28
The model should be simple enough as to allow maintainability and
understandability but complex enough as to show the main complexity
features of arterial wall
The model should allow straightforward inclusion of biological objects such as
fibroblasts represented by automata. In the same way of thinking, it should
allow easy modification, inclusion, deletion and replacement of component
models
The model should allow easy discussion and analysis in interdisciplinary
contexts
The model should be independent of the simulation engines and produce
equivalent results
The model should be highly portable between different computer platforms.
Regarding those premises, the model will be designed by using UML as the
modeling language, JAVA as the implementation language and, just because
of easy implementation of visual interfaces and because of UML embedding,
Microsoft Visual J# (“jay sharp”) 2005 has been used as the development system.
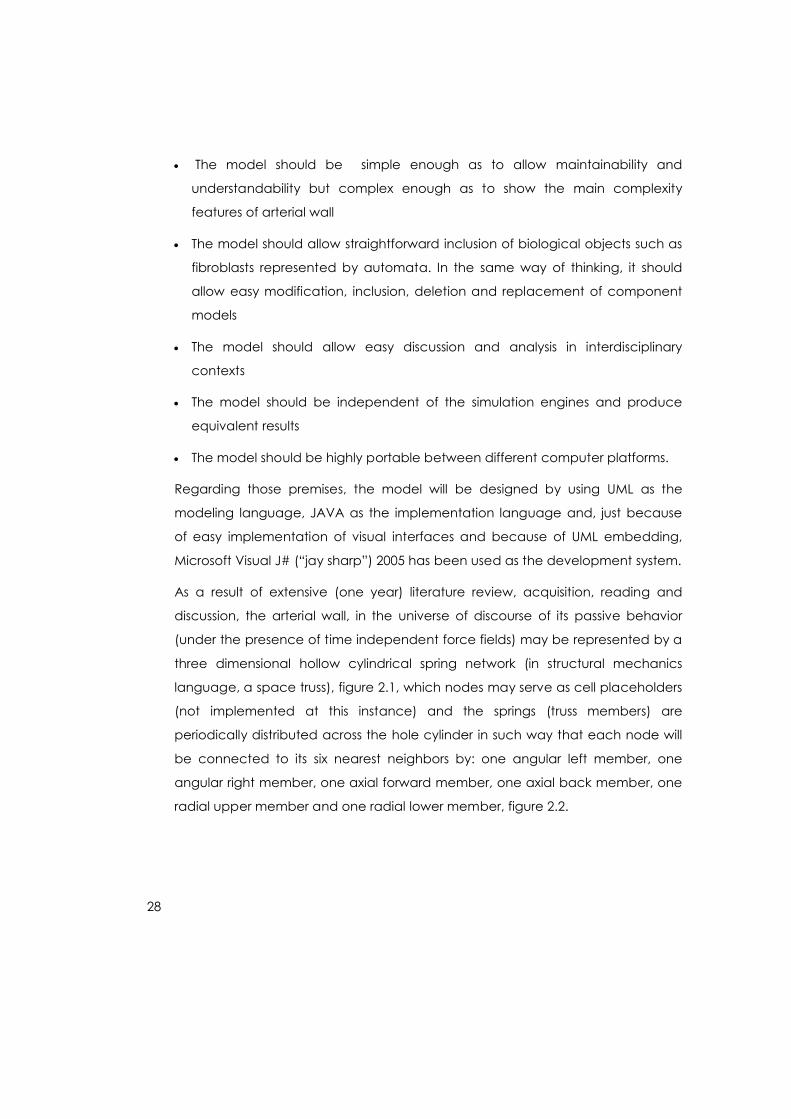
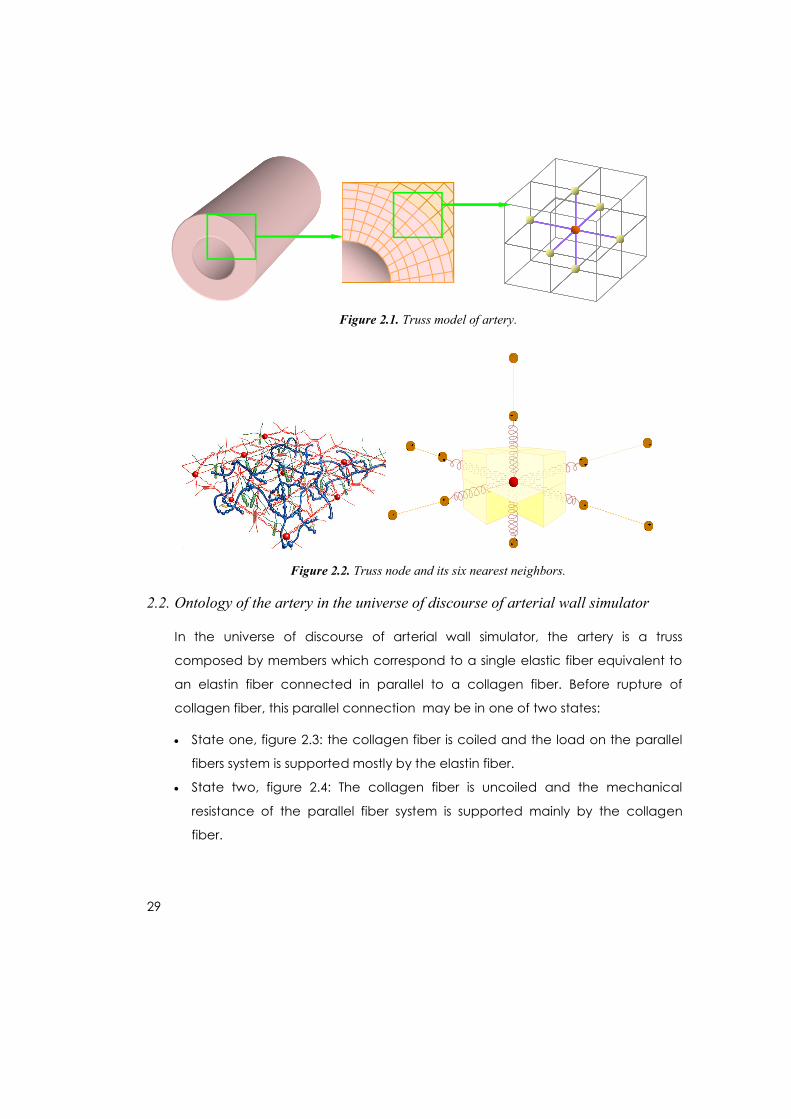
As a result of extensive (one year) literature review, acquisition, reading and
discussion, the arterial wall, in the universe of discourse of its passive behavior
(under the presence of time independent force fields) may be represented by a
three dimensional hollow cylindrical spring network (in structural mechanics
language, a space truss), figure 2.1, which nodes may serve as cell placeholders
(not implemented at this instance) and the springs (truss members) are
periodically distributed across the hole cylinder in such way that each node will
be connected to its six nearest neighbors by: one angular left member, one
angular right member, one axial forward member, one axial back member, one
radial upper member and one radial lower member, figure 2.2.
29
Figure 2.1. Truss model of artery.
Figure 2.2. Truss node and its six nearest neighbors.
2.2. Ontology of the artery in the universe of discourse of arterial wall simulator
In the universe of discourse of arterial wall simulator, the artery is a truss
composed by members which correspond to a single elastic fiber equivalent to
an elastin fiber connected in parallel to a collagen fiber. Before rupture of
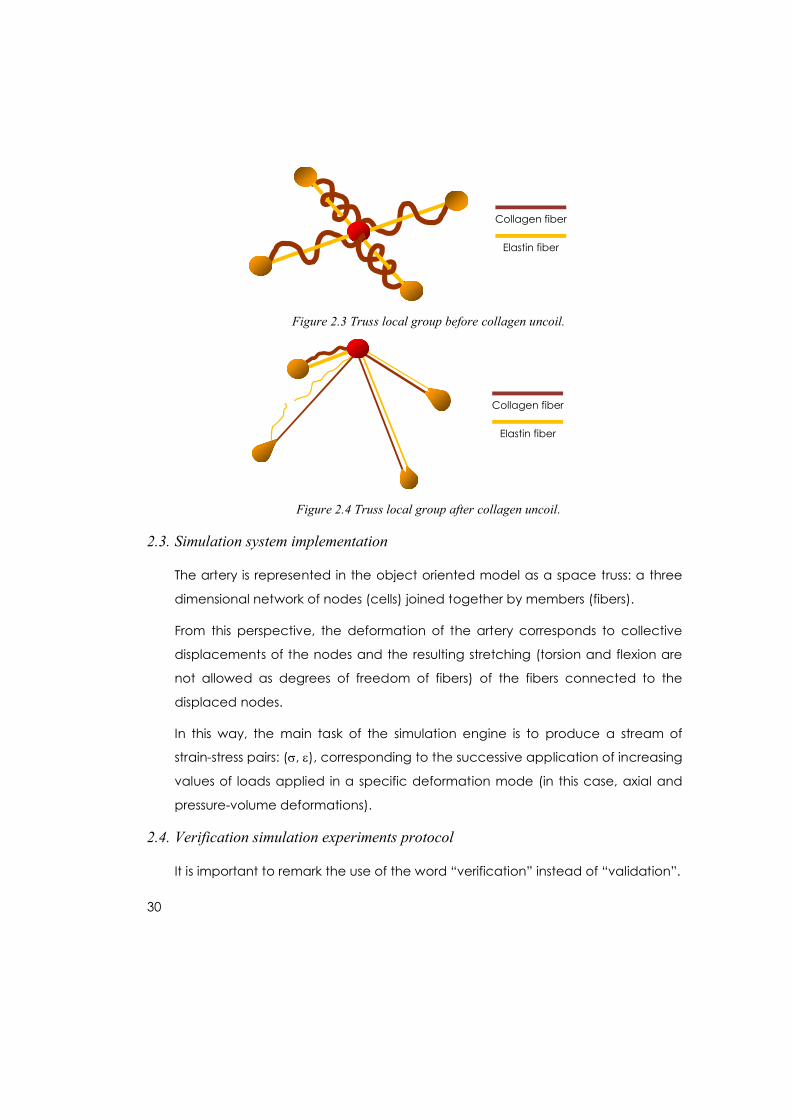
collagen fiber, this parallel connection may be in one of two states:
State one, figure 2.3: the collagen fiber is coiled and the load on the parallel
fibers system is supported mostly by the elastin fiber.
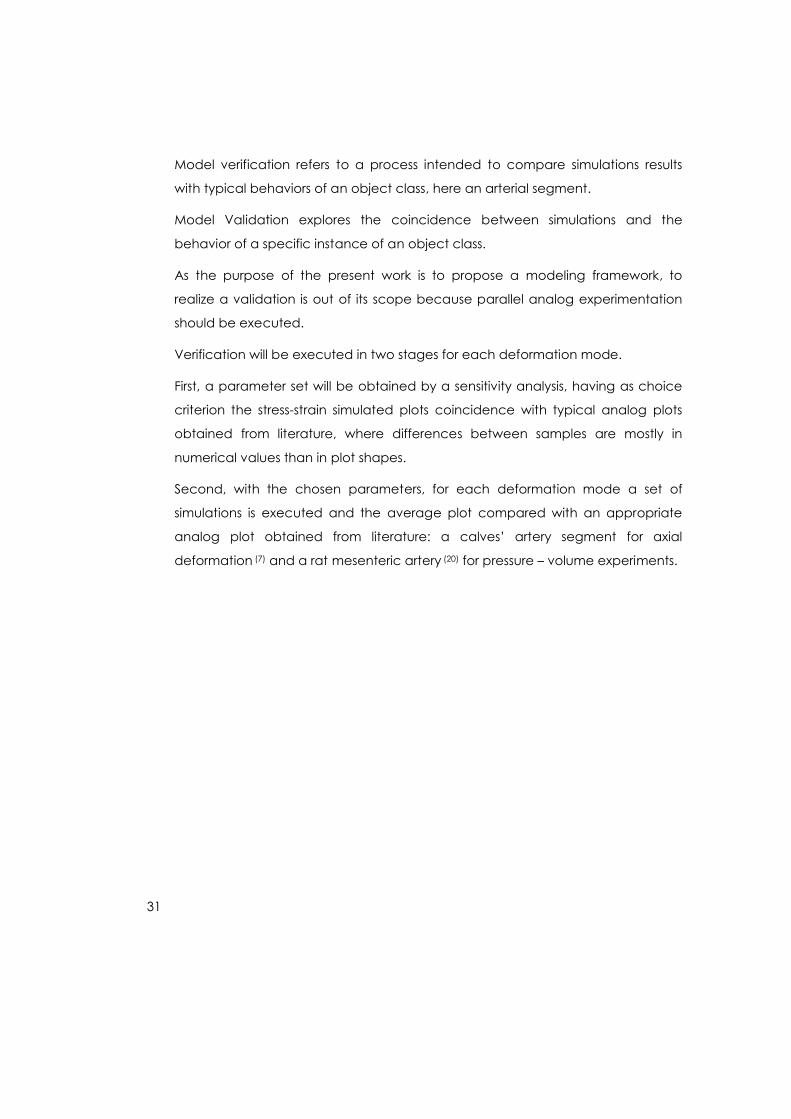
State two, figure 2.4: The collagen fiber is uncoiled and the mechanical
resistance of the parallel fiber system is supported mainly by the collagen
fiber.
30
Figure 2.3 Truss local group before collagen uncoil.
Figure 2.4 Truss local group after collagen uncoil.
2.3. Simulation system implementation
The artery is represented in the object oriented model as a space truss: a three
dimensional network of nodes (cells) joined together by members (fibers).
From this perspective, the deformation of the artery corresponds to collective
displacements of the nodes and the resulting stretching (torsion and flexion are
not allowed as degrees of freedom of fibers) of the fibers connected to the
displaced nodes.
In this way, the main task of the simulation engine is to produce a stream of
strain-stress pairs: (, ), corresponding to the successive application of increasing
values of loads applied in a specific deformation mode (in this case, axial and
pressure-volume deformations).
2.4. Verification simulation experiments protocol
It is important to remark the use of the word “verification” instead of “validation”.
Collagen fiber
Elastin fiber
Collagen fiber
Elastin fiber
31
Model verification refers to a process intended to compare simulations results
with typical behaviors of an object class, here an arterial segment.
Model Validation explores the coincidence between simulations and the
behavior of a specific instance of an object class.
As the purpose of the present work is to propose a modeling framework, to
realize a validation is out of its scope because parallel analog experimentation
should be executed.
Verification will be executed in two stages for each deformation mode.
First, a parameter set will be obtained by a sensitivity analysis, having as choice
criterion the stress-strain simulated plots coincidence with typical analog plots
obtained from literature, where differences between samples are mostly in
numerical values than in plot shapes.
Second, with the chosen parameters, for each deformation mode a set of
simulations is executed and the average plot compared with an appropriate
analog plot obtained from literature: a calves’ artery segment for axial
deformation (7) and a rat mesenteric artery (20) for pressure – volume experiments.
32
3. Results
In this chapter, the model design and implementation results are presented. The
simulator engine is also presented as a result. The verification simulation
experiments results are reported. Two kinds of verification experiments have
been done: axial loading (axial stress-strain) and pressure-volume (circular
stress-strain). First, the axial sensitivity analysis results are presented ending with
the simulation to analog plot comparison. Second, the pressure-volume
simulation results are reported, both sensitivity analysis and simulation to analog
comparison.
3.1. Model design and implementation
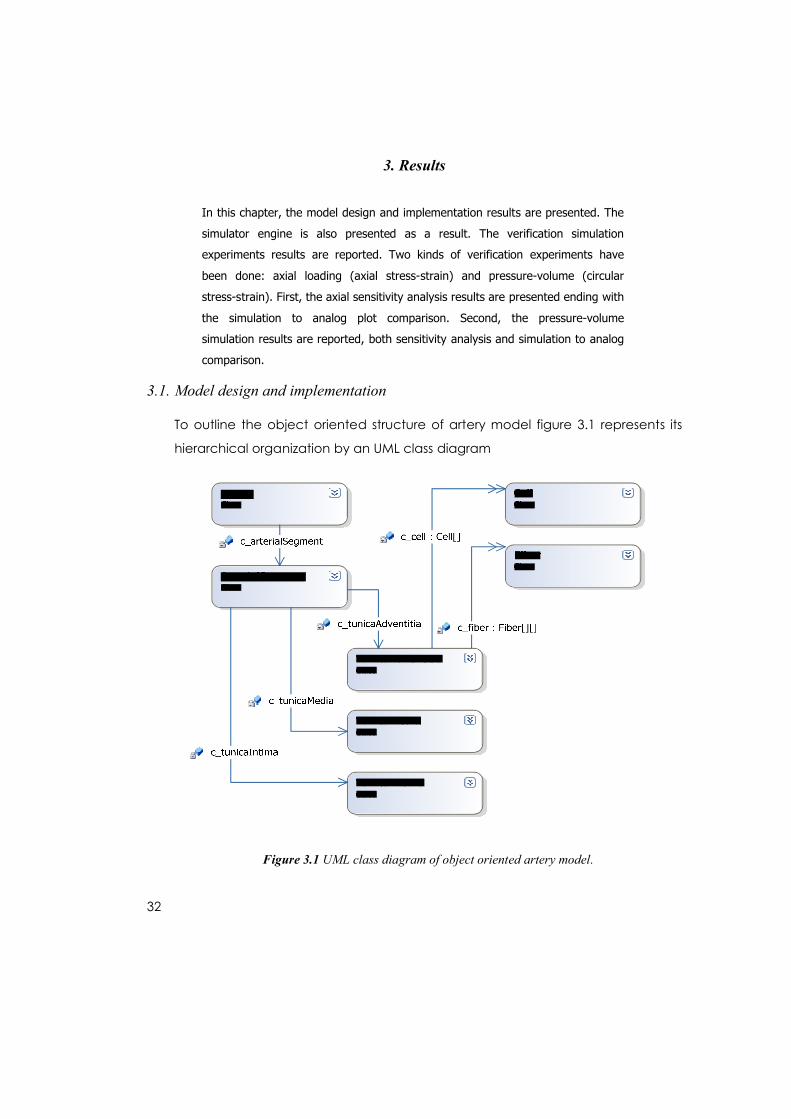
To outline the object oriented structure of artery model figure 3.1 represents its
hierarchical organization by an UML class diagram
Figure 3.1 UML class diagram of object oriented artery model.
33
Each box in the UML object oriented model of artery represents a class: a
template to create objects as instances of the class.
Each class include a set of data fields abstracted to represent the attributes of
the class objects in the given universe of discourse.
In addition, the class includes a set of methods (code blocks to modify attributes
values and in this way upgrade object’s states) to represent class objects
behaviors.
In the following paragraphs, going across the hierarchical structure of the model
a short description of each class will be done.
As some object oriented programmers use, a prefix convention to identify the
field type that it represents: 1. the prefix “a_” means that the field represents an
attribute, 2. the prefix “c_” means that the field represents a component and 3.
the prefix “s_” means that the field represents a state variable.
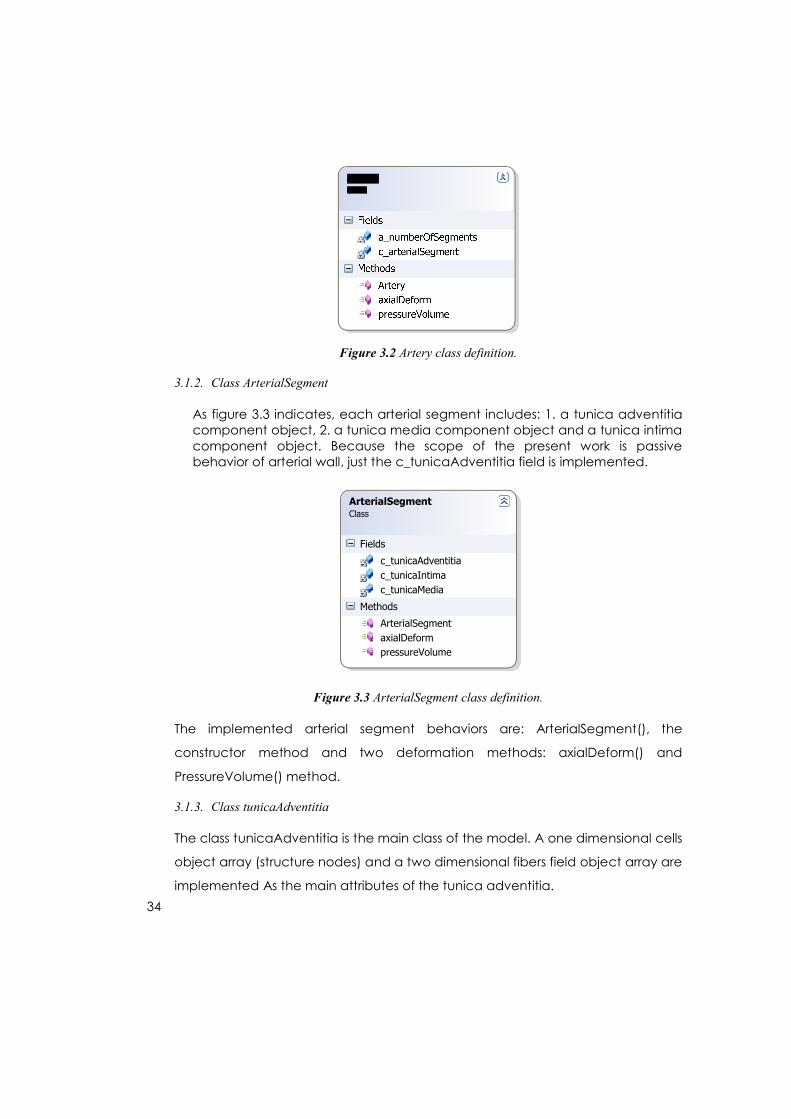
3.1.1. Class Artery
In the context of the model, an artery is a composition of arterial segments. The
fields (attributes) included in the class are: 1. the number of segments in which
the artery is divided for the model construction and 2. the set of implemented
segments, the segment[] field (a “segment” objects array). Because of the
nature and objectives of the present work, in the verification section of the
model just one segment arteries will be considered.
As every class, there is a constructor method to create instances of the class, the
Artery() method.
To represent the main deformation behaviors of an artery, there are two
methods called axialDeform() and PressureVolume() which produce data points
to construct a stress-strain plot. Figure 3.2 gives a close up of Artery class
definition.
34
Figure 3.2 Artery class definition.
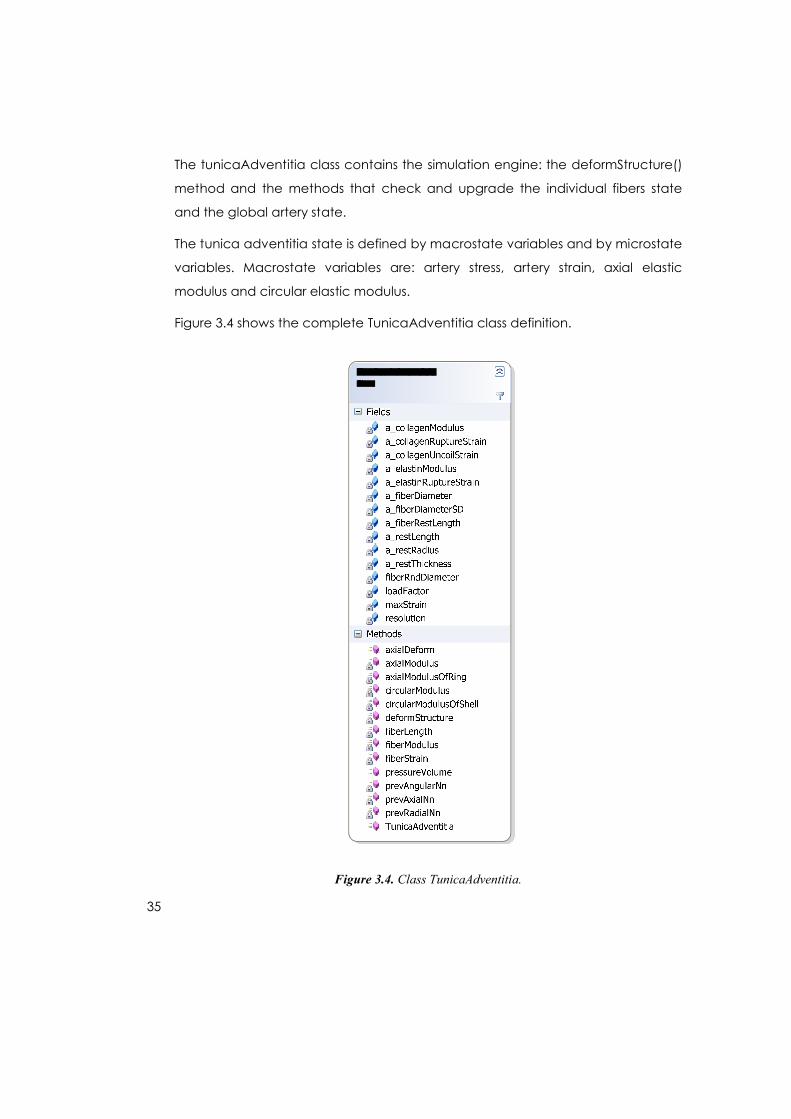
3.1.2. Class ArterialSegment
As figure 3.3 indicates, each arterial segment includes: 1. a tunica adventitia component object, 2. a tunica media component object and a tunica intima component object. Because the scope of the present work is passive behavior of arterial wall, just the c_tunicaAdventitia field is implemented.
Figure 3.3 ArterialSegment class definition.
The implemented arterial segment behaviors are: ArterialSegment(), the
constructor method and two deformation methods: axialDeform() and
PressureVolume() method.
3.1.3. Class tunicaAdventitia
The class tunicaAdventitia is the main class of the model. A one dimensional cells
object array (structure nodes) and a two dimensional fibers field object array are
implemented As the main attributes of the tunica adventitia.
ArterialSegmentClass
Fields
c_tunicaAdventitiac_tunicaIntimac_tunicaMedia
Methods
ArterialSegmentaxialDeformpressureVolume
35
The tunicaAdventitia class contains the simulation engine: the deformStructure()
method and the methods that check and upgrade the individual fibers state
and the global artery state.
The tunica adventitia state is defined by macrostate variables and by microstate
variables. Macrostate variables are: artery stress, artery strain, axial elastic
modulus and circular elastic modulus.
Figure 3.4 shows the complete TunicaAdventitia class definition.
Figure 3.4. Class TunicaAdventitia.
36
Microstate adventitia state is defined by a set of methods that read individual
fibers attributes values, upgrade them and combines them to produce
macrostate values.
The set of unloaded attributes values (artery rest length, rest inner radius, rest
thickness, rest fibers length, fibers diameter) are also part of the fields necessary
to compute micro and macro state variables values.
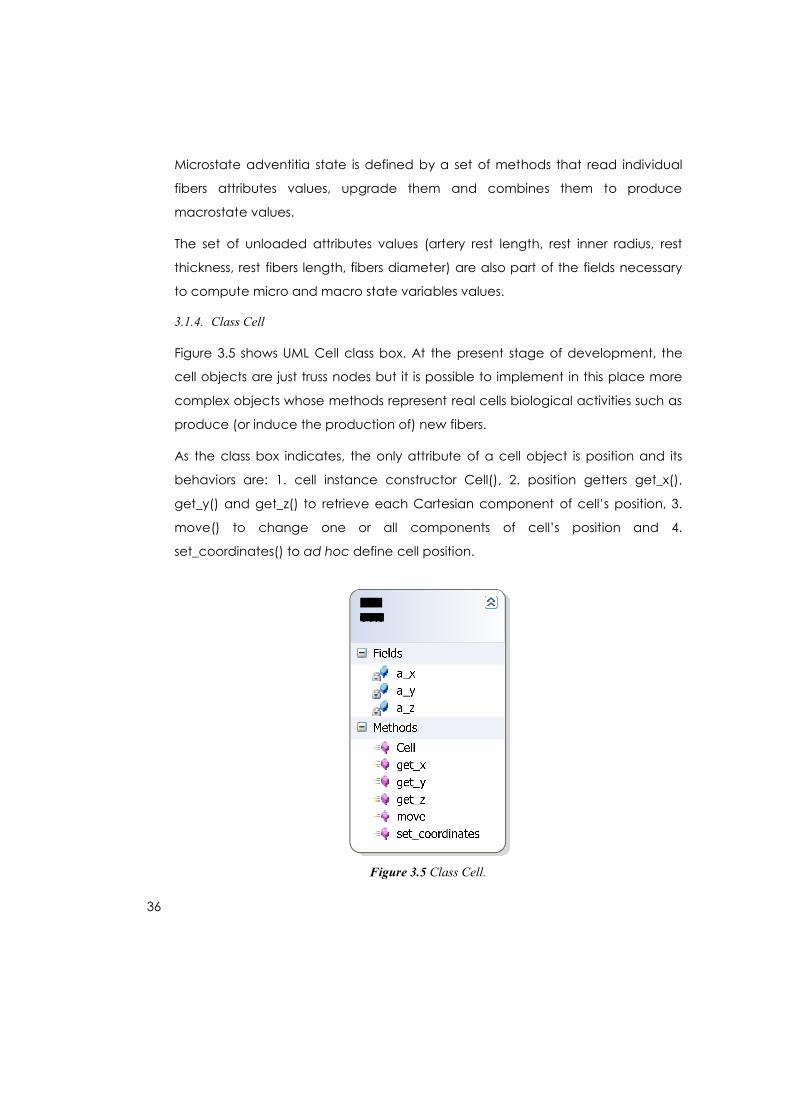
3.1.4. Class Cell
Figure 3.5 shows UML Cell class box. At the present stage of development, the
cell objects are just truss nodes but it is possible to implement in this place more
complex objects whose methods represent real cells biological activities such as
produce (or induce the production of) new fibers.
As the class box indicates, the only attribute of a cell object is position and its
behaviors are: 1. cell instance constructor Cell(), 2. position getters get_x(),
get_y() and get_z() to retrieve each Cartesian component of cell’s position, 3.
move() to change one or all components of cell’s position and 4.
set_coordinates() to ad hoc define cell position.
Figure 3.5 Class Cell.
37
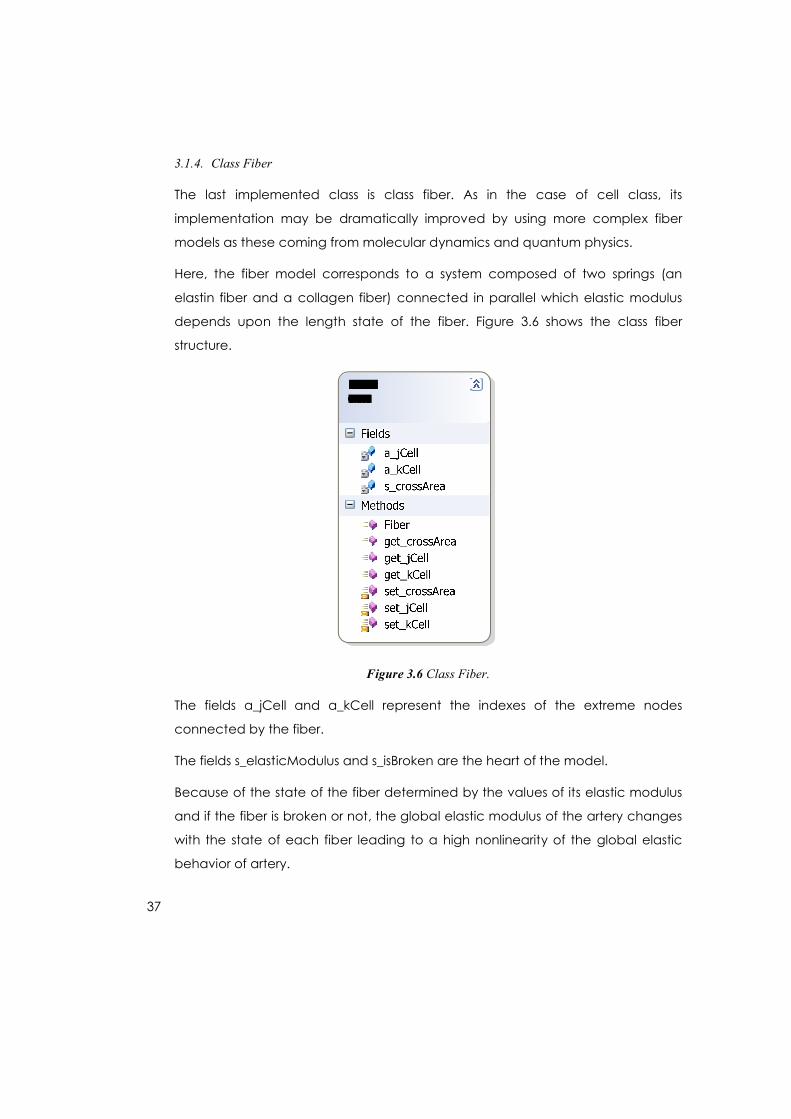
3.1.4. Class Fiber
The last implemented class is class fiber. As in the case of cell class, its
implementation may be dramatically improved by using more complex fiber
models as these coming from molecular dynamics and quantum physics.
Here, the fiber model corresponds to a system composed of two springs (an
elastin fiber and a collagen fiber) connected in parallel which elastic modulus
depends upon the length state of the fiber. Figure 3.6 shows the class fiber
structure.
Figure 3.6 Class Fiber.
The fields a_jCell and a_kCell represent the indexes of the extreme nodes
connected by the fiber.
The fields s_elasticModulus and s_isBroken are the heart of the model.
Because of the state of the fiber determined by the values of its elastic modulus
and if the fiber is broken or not, the global elastic modulus of the artery changes
with the state of each fiber leading to a high nonlinearity of the global elastic
behavior of artery.
38
The remaining components of the Fiber Class are the constructor method, the
getter and setter methods (methods to retrieve and set the field values of the
class).
The code implementation of the model is given as an appendix, together with
the simulation engine code and the simulations data files.
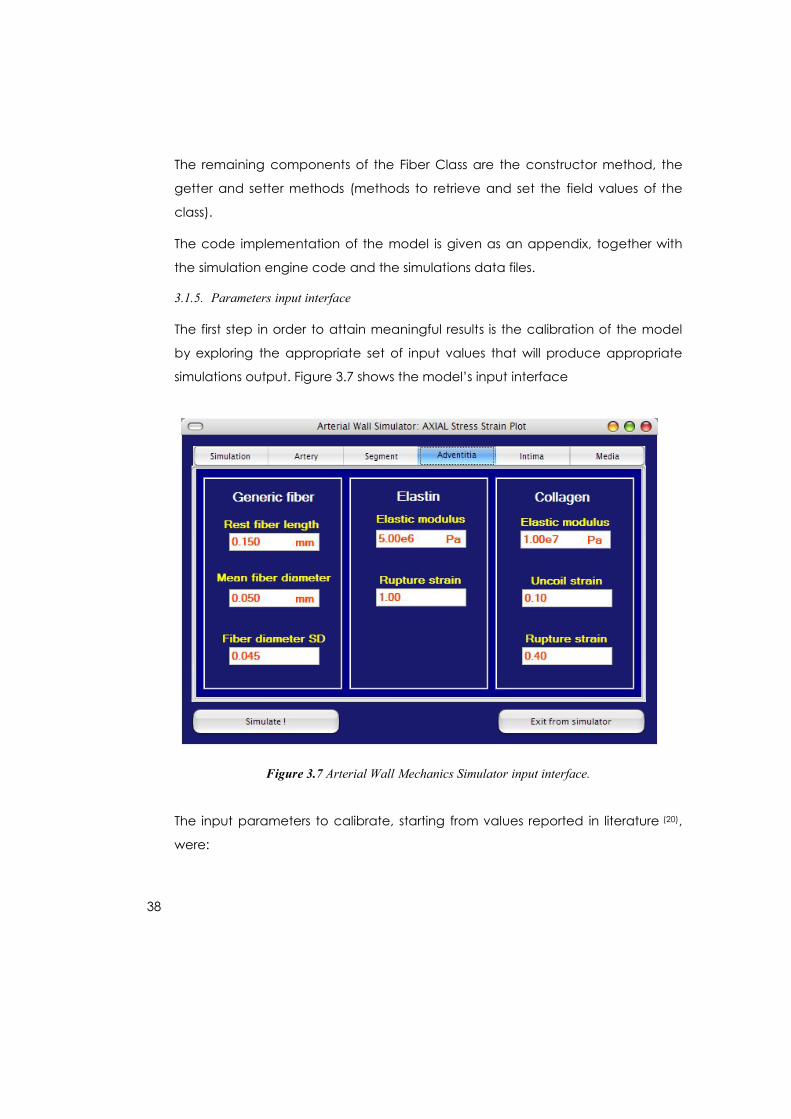
3.1.5. Parameters input interface
The first step in order to attain meaningful results is the calibration of the model
by exploring the appropriate set of input values that will produce appropriate
simulations output. Figure 3.7 shows the model’s input interface
Figure 3.7 Arterial Wall Mechanics Simulator input interface.
The input parameters to calibrate, starting from values reported in literature (20),
were:
39
Macroscopic geometrical arterial segment parameters:
Segment length, default value: 10 mm
Segment inner radius: default value: 1 mm
Segment thickness: default value: 0.5 mm
Microscopic arterial components properties:
Generic fiber rest (unloaded) length: default value: 0.01 mm
Generic fiber diameter default value: 0.001 mm
Elastin fibers modulus of elasticity: default value: 0.6x10⁶ Pa
Standard deviation of elastin modulus: default value: 0.1x10⁶
Collagen fibers modulus of elasticity 1: default value: 1.0x10⁵ Pa
Standard deviation of collagen modulus 1: default value: 0.5x10⁵ Pa
Collagen fibers modulus of elasticity 2: default value: 1.0x10⁹ Pa
Standard deviation of collagen modulus 2: default value: 0.5x10⁹ Pa
Collagen fibers uncoil strain: default value: 0.20
Collagen fibers rupture strain: default value: 0.40
Experimental conditions depending upon the type of deformation load (axial
or pressure): Load factor, which is a combined account of strain rate and
ground substance mechanical properties not included individually as
experimental parameters, maximum strain and strain resolution.
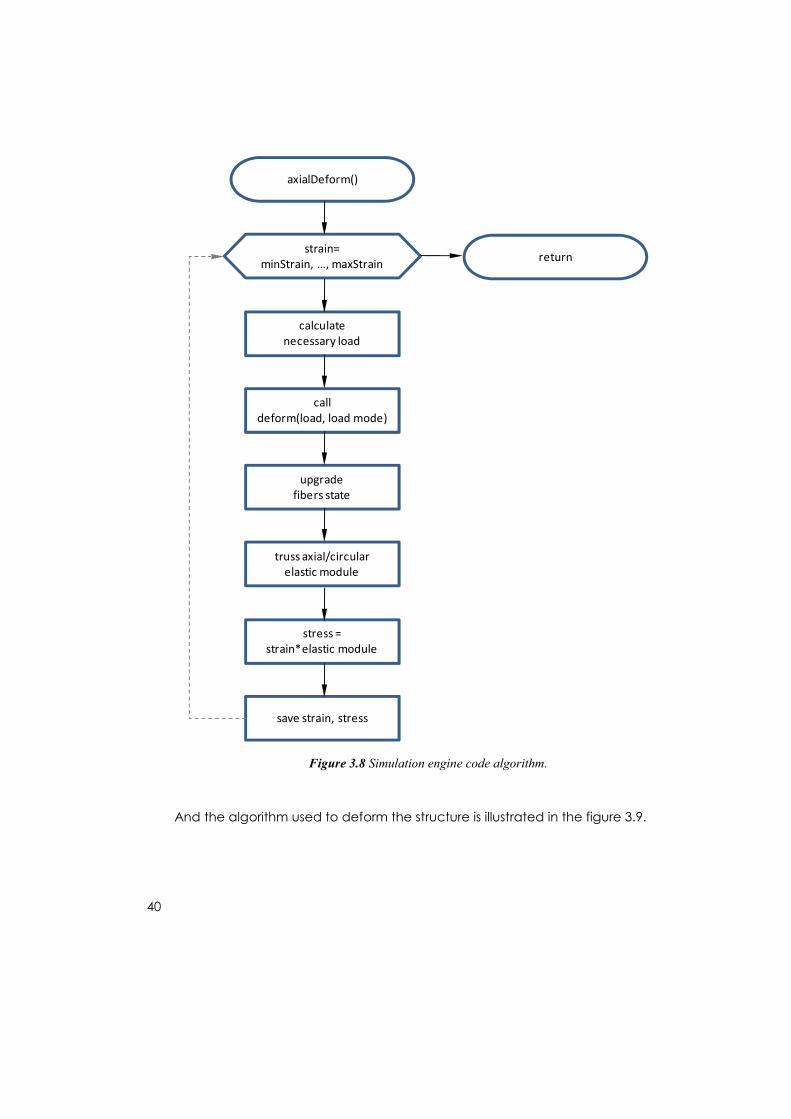
3.2. Simulation system
The main simulation algorithm implemented in JAVA code used to generate the
stream of successive strain-stress pairs is shown in figure 3.8.
40
axialDeform()
strain=minStrain, …, maxStrain
calculate necessary load
call deform(load, load mode)
upgradefibers state
truss axial/circularelastic module
stress =strain*elastic module
save strain, stress
return
Figure 3.8 Simulation engine code algorithm.
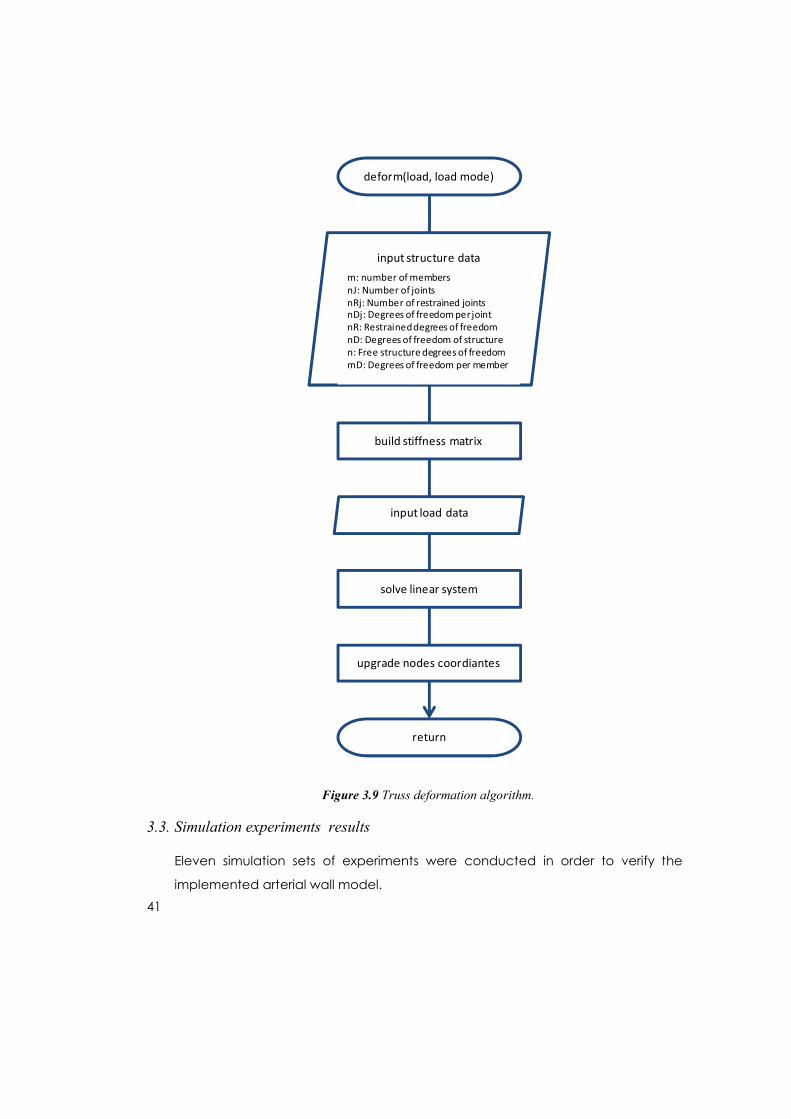
And the algorithm used to deform the structure is illustrated in the figure 3.9.
41
Figure 3.9 Truss deformation algorithm.
3.3. Simulation experiments results
Eleven simulation sets of experiments were conducted in order to verify the
implemented arterial wall model.
deform(load, load mode)
input structure datam: number of membersnJ: Number of jointsnRj: Number of restrained joints nDj: Degrees of freedom per jointnR: Restrained degrees of freedomnD: Degrees of freedom of structuren: Free structure degrees of freedommD: Degrees of freedom per member
build stiffness matrix
input load data
solve linear system
upgrade nodes coordiantes
return
42
Six sets of experiments for axial deformation: five stress strain sensitivity simulations
sets for number of structural components (rings, layers), load factor which
includes non-specified factors such as strain rate, elastin modulus of elasticity,
collagen modulus of elasticity, and fiber diameter standard deviation. For axial
deformation, a set of simulations with the chosen parameters from sensitivity
analysis were conducted and an average plot obtained.
In the case of pressure-volume deformation, sensitivity analysis were executed
for pressure - volume load factor, elastin rupture strain, collagen uncoil strain,
collagen rupture strain.
Finally, as in the axial deformation case, a set of simulations with the sensitivity
chosen parameters were executed and averaged in a pressure – volume stress-
strain plot.
3.3.1. Parameters Sensitivity analysis for axial deformation
Structural parameters sensitivity
The cylindrical 3D truss that represents an arterial segment is composed of three
structural patterns: arcs, rings and layers (shells). Needed computational
resources are very sensible to the number of structural components, mainly to
the number of arcs.
In order to be able to explore simulations sensitivity to the relations: segment
length to fiber length (number of rings), and segment thickness to fiber length
(number of layers), the segment inner radius and in this way, the number of arcs
were maintained as a constant while modifying the number of rings and the
number of layers of the model.
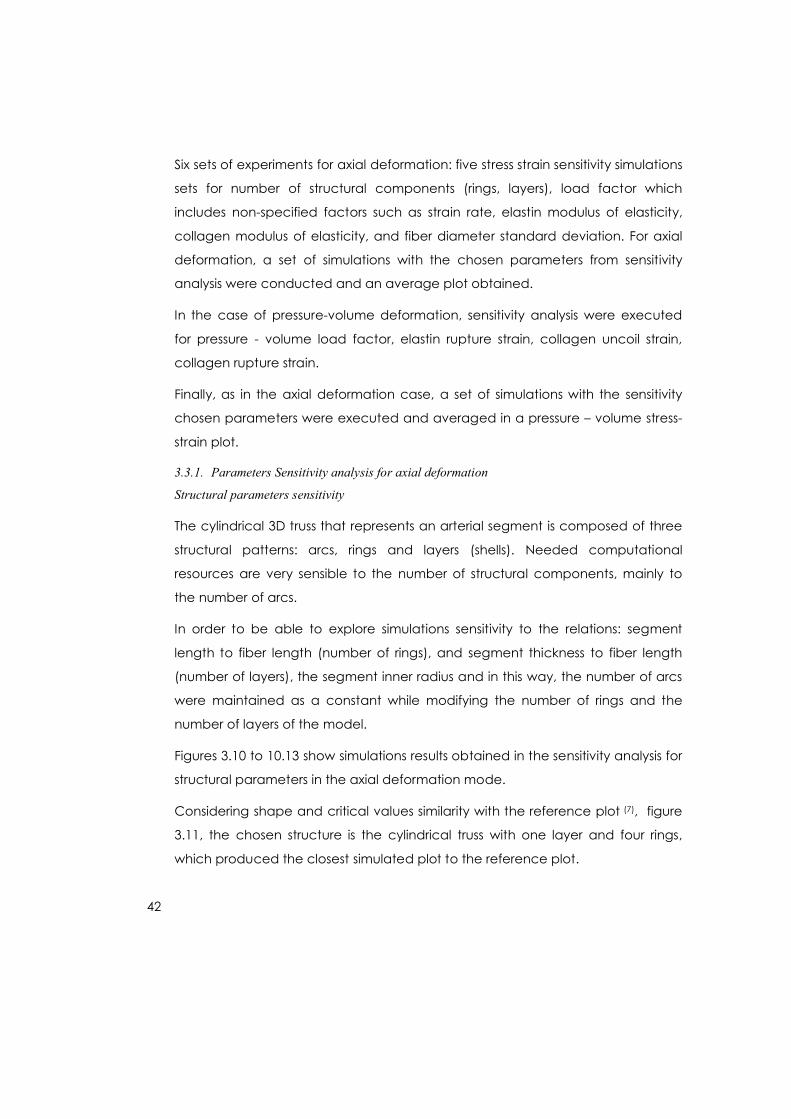
Figures 3.10 to 10.13 show simulations results obtained in the sensitivity analysis for
structural parameters in the axial deformation mode.
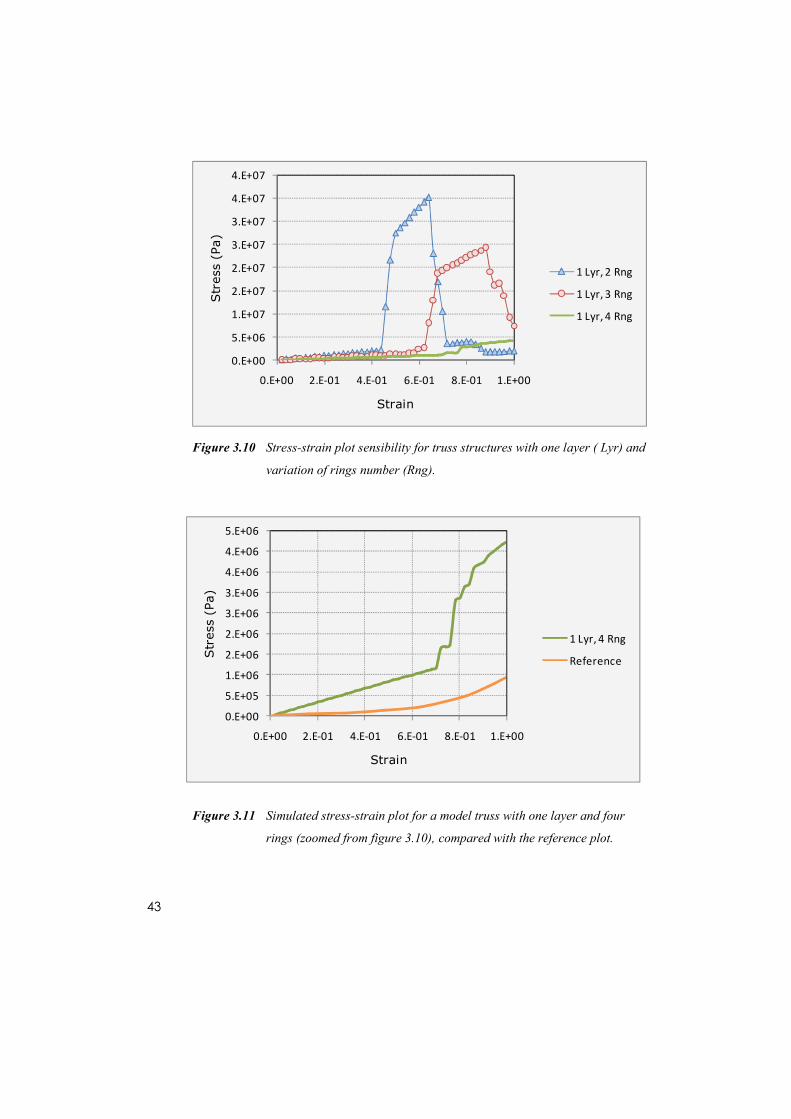
Considering shape and critical values similarity with the reference plot (7), figure
3.11, the chosen structure is the cylindrical truss with one layer and four rings,
which produced the closest simulated plot to the reference plot.
43
Figure 3.10 Stress-strain plot sensibility for truss structures with one layer ( Lyr) and
variation of rings number (Rng).
Figure 3.11 Simulated stress-strain plot for a model truss with one layer and four
rings (zoomed from figure 3.10), compared with the reference plot.
0.E+00
5.E+06
1.E+07
2.E+07
2.E+07
3.E+07
3.E+07
4.E+07
4.E+07
0.E+00 2.E-01 4.E-01 6.E-01 8.E-01 1.E+00
Str
ess
(Pa)
Strain
1 Lyr, 2 Rng
1 Lyr, 3 Rng
1 Lyr, 4 Rng
0.E+00
5.E+05
1.E+06
2.E+06
2.E+06
3.E+06
3.E+06
4.E+06
4.E+06
5.E+06
0.E+00 2.E-01 4.E-01 6.E-01 8.E-01 1.E+00
Str
ess
(Pa)
Strain
1 Lyr, 4 Rng
Reference
44
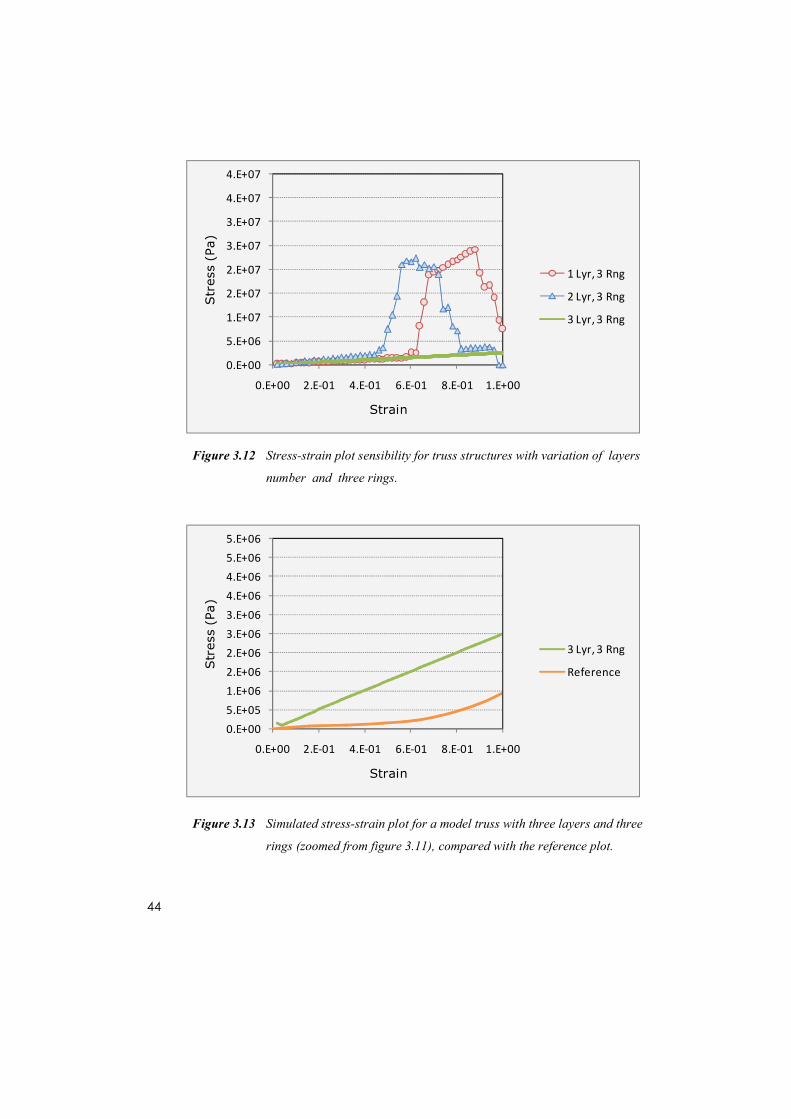
Figure 3.12 Stress-strain plot sensibility for truss structures with variation of layers
number and three rings.
Figure 3.13 Simulated stress-strain plot for a model truss with three layers and three
rings (zoomed from figure 3.11), compared with the reference plot.
0.E+00
5.E+06
1.E+07
2.E+07
2.E+07
3.E+07
3.E+07
4.E+07
4.E+07
0.E+00 2.E-01 4.E-01 6.E-01 8.E-01 1.E+00
Str
ess
(Pa)
Strain
1 Lyr, 3 Rng
2 Lyr, 3 Rng
3 Lyr, 3 Rng
0.E+00
5.E+05
1.E+06
2.E+06
2.E+06
3.E+06
3.E+06
4.E+06
4.E+06
5.E+06
5.E+06
0.E+00 2.E-01 4.E-01 6.E-01 8.E-01 1.E+00
Str
ess
(Pa)
Strain
3 Lyr, 3 Rng
Reference
45
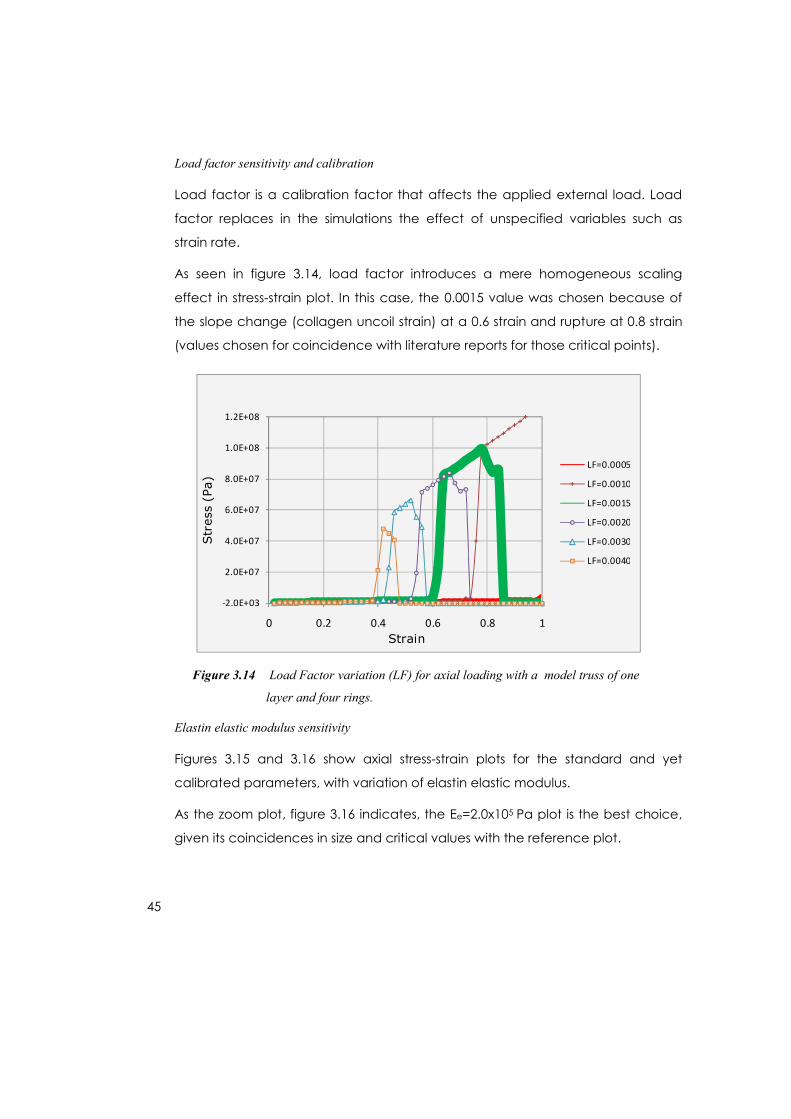
Load factor sensitivity and calibration
Load factor is a calibration factor that affects the applied external load. Load
factor replaces in the simulations the effect of unspecified variables such as
strain rate.
As seen in figure 3.14, load factor introduces a mere homogeneous scaling
effect in stress-strain plot. In this case, the 0.0015 value was chosen because of
the slope change (collagen uncoil strain) at a 0.6 strain and rupture at 0.8 strain
(values chosen for coincidence with literature reports for those critical points).
Figure 3.14 Load Factor variation (LF) for axial loading with a model truss of one
layer and four rings.
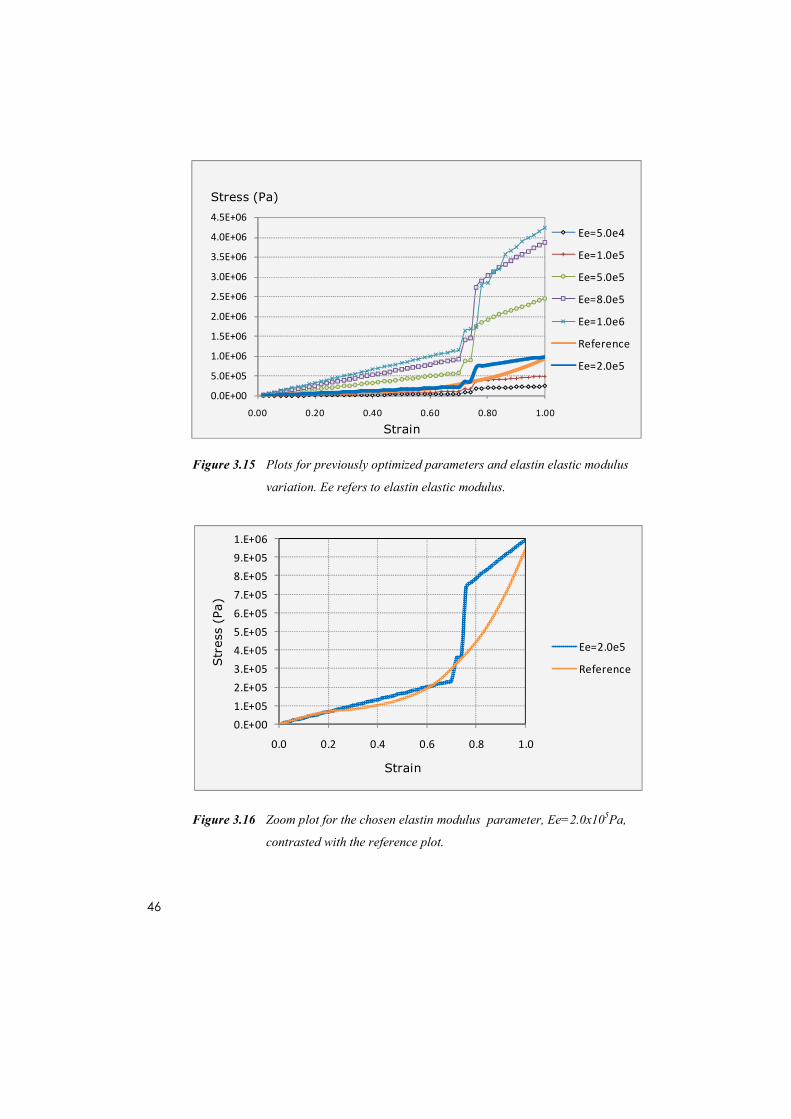
Elastin elastic modulus sensitivity
Figures 3.15 and 3.16 show axial stress-strain plots for the standard and yet
calibrated parameters, with variation of elastin elastic modulus.
As the zoom plot, figure 3.16 indicates, the Ee=2.0x10⁵ Pa plot is the best choice,
given its coincidences in size and critical values with the reference plot.
-2.0E+03
2.0E+07
4.0E+07
6.0E+07
8.0E+07
1.0E+08
1.2E+08
0 0.2 0.4 0.6 0.8 1
Str
ess
(Pa)
Strain
LF=0.0005
LF=0.0010
LF=0.0015
LF=0.0020
LF=0.0030
LF=0.0040
46
Figure 3.15 Plots for previously optimized parameters and elastin elastic modulus
variation. Ee refers to elastin elastic modulus.
Figure 3.16 Zoom plot for the chosen elastin modulus parameter, Ee=2.0x10⁵Pa,
contrasted with the reference plot.
0.0E+00
5.0E+05
1.0E+06
1.5E+06
2.0E+06
2.5E+06
3.0E+06
3.5E+06
4.0E+06
4.5E+06
0.00 0.20 0.40 0.60 0.80 1.00
Stress (Pa)
Strain
Ee=5.0e4
Ee=1.0e5
Ee=5.0e5
Ee=8.0e5
Ee=1.0e6
Reference
Ee=2.0e5
0.E+00
1.E+05
2.E+05
3.E+05
4.E+05
5.E+05
6.E+05
7.E+05
8.E+05
9.E+05
1.E+06
0.0 0.2 0.4 0.6 0.8 1.0
Str
ess
(Pa)
Strain
Ee=2.0e5
Reference
47
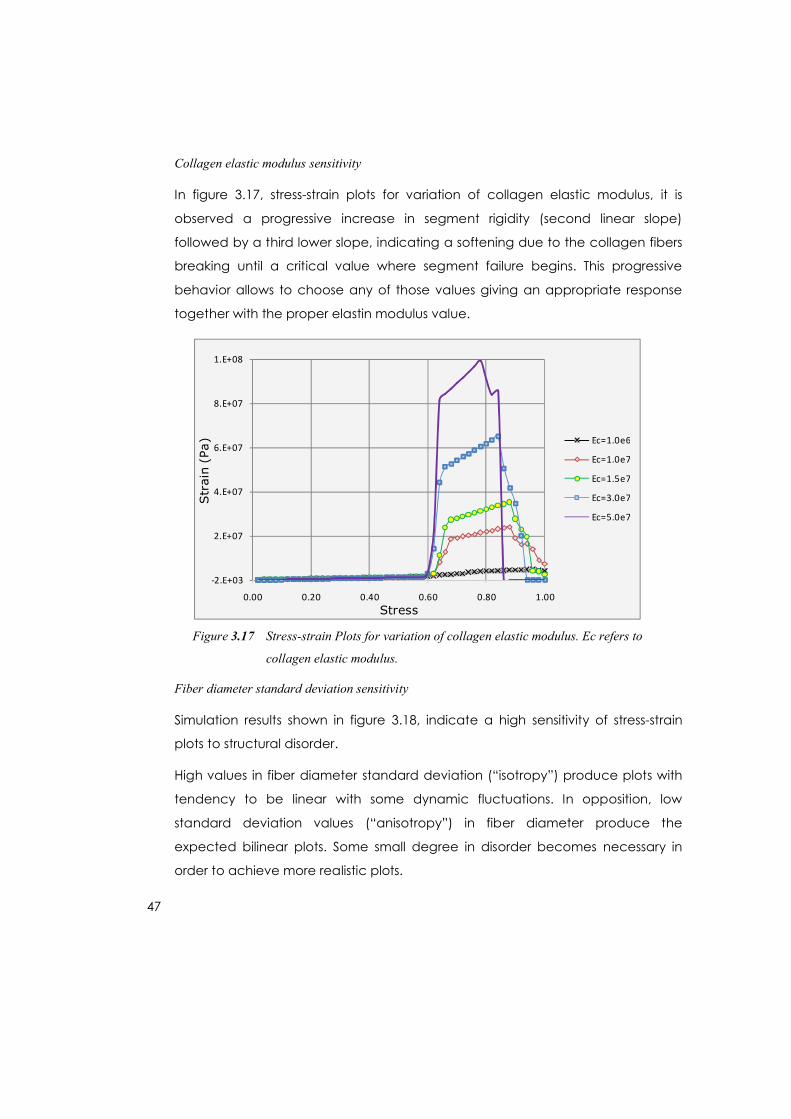
Collagen elastic modulus sensitivity
In figure 3.17, stress-strain plots for variation of collagen elastic modulus, it is
observed a progressive increase in segment rigidity (second linear slope)
followed by a third lower slope, indicating a softening due to the collagen fibers
breaking until a critical value where segment failure begins. This progressive
behavior allows to choose any of those values giving an appropriate response
together with the proper elastin modulus value.
Figure 3.17 Stress-strain Plots for variation of collagen elastic modulus. Ec refers to
collagen elastic modulus.
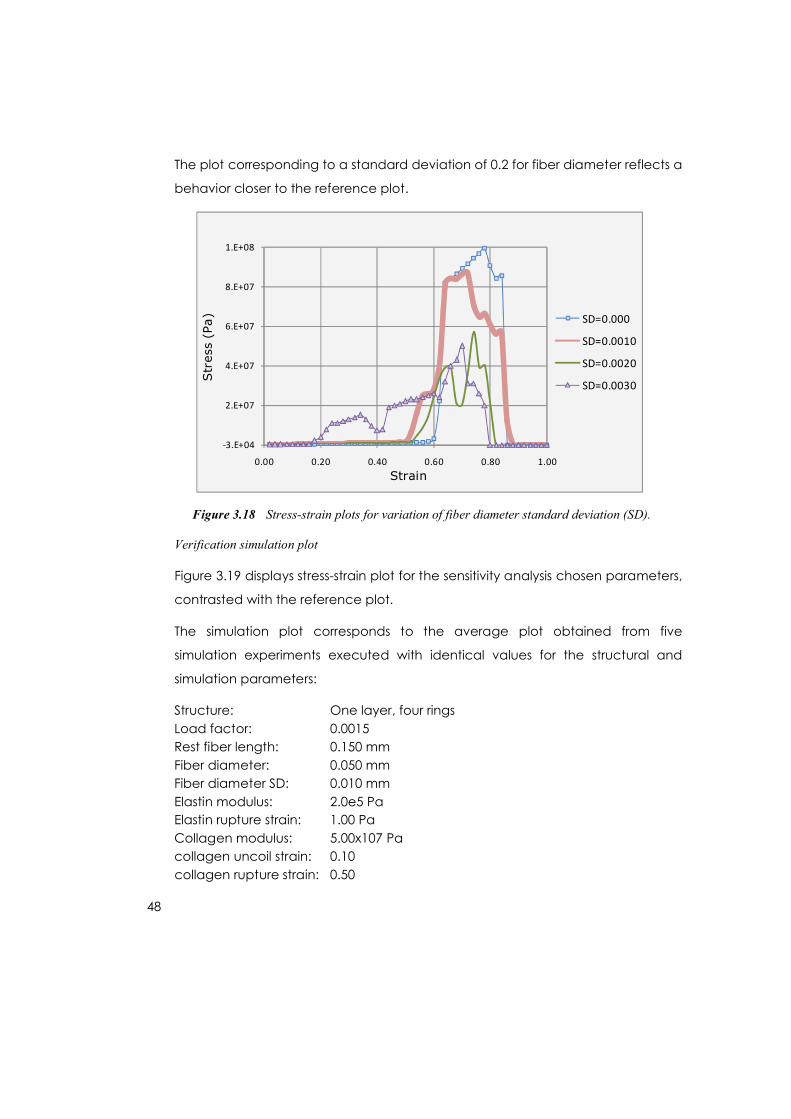
Fiber diameter standard deviation sensitivity
Simulation results shown in figure 3.18, indicate a high sensitivity of stress-strain
plots to structural disorder.
High values in fiber diameter standard deviation (“isotropy”) produce plots with
tendency to be linear with some dynamic fluctuations. In opposition, low
standard deviation values (“anisotropy”) in fiber diameter produce the
expected bilinear plots. Some small degree in disorder becomes necessary in
order to achieve more realistic plots.
-2.E+03
2.E+07
4.E+07
6.E+07
8.E+07
1.E+08
0.00 0.20 0.40 0.60 0.80 1.00
Str
ain
(Pa)
Stress
Ec=1.0e6
Ec=1.0e7
Ec=1.5e7
Ec=3.0e7
Ec=5.0e7
48
The plot corresponding to a standard deviation of 0.2 for fiber diameter reflects a
behavior closer to the reference plot.
Figure 3.18 Stress-strain plots for variation of fiber diameter standard deviation (SD).
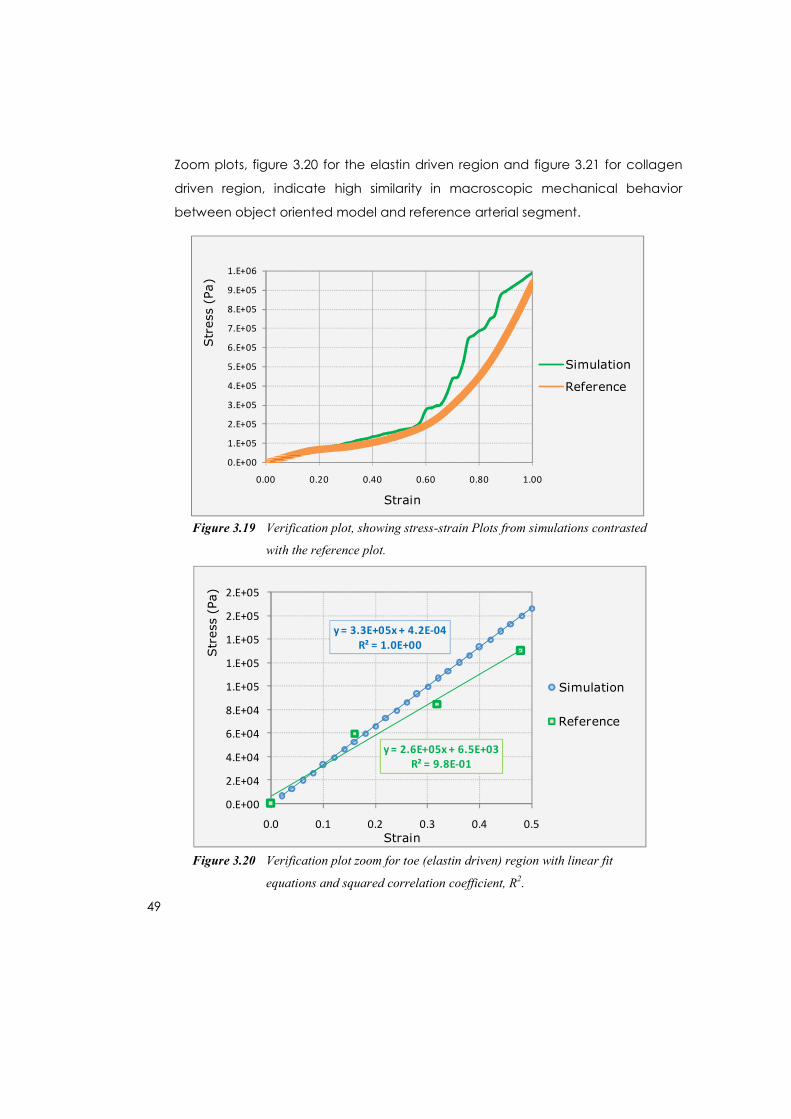
Verification simulation plot
Figure 3.19 displays stress-strain plot for the sensitivity analysis chosen parameters,
contrasted with the reference plot.
The simulation plot corresponds to the average plot obtained from five
simulation experiments executed with identical values for the structural and
simulation parameters:
Structure: One layer, four ringsLoad factor: 0.0015Rest fiber length: 0.150 mmFiber diameter: 0.050 mmFiber diameter SD: 0.010 mmElastin modulus: 2.0e5 PaElastin rupture strain: 1.00 PaCollagen modulus: 5.00x10⁷ Pacollagen uncoil strain: 0.10collagen rupture strain: 0.50
-3.E+04
2.E+07
4.E+07
6.E+07
8.E+07
1.E+08
0.00 0.20 0.40 0.60 0.80 1.00
Str
ess
(Pa)
Strain
SD=0.000
SD=0.0010
SD=0.0020
SD=0.0030
49
Zoom plots, figure 3.20 for the elastin driven region and figure 3.21 for collagen
driven region, indicate high similarity in macroscopic mechanical behavior
between object oriented model and reference arterial segment.
Figure 3.19 Verification plot, showing stress-strain Plots from simulations contrasted
with the reference plot.
Figure 3.15 Axial loading simulations verification plot.
Figure 3.20 Verification plot zoom for toe (elastin driven) region with linear fit
equations and squared correlation coefficient, R2.
0.E+00
1.E+05
2.E+05
3.E+05
4.E+05
5.E+05
6.E+05
7.E+05
8.E+05
9.E+05
1.E+06
0.00 0.20 0.40 0.60 0.80 1.00
Str
ess
(Pa)
Strain
Simulation
Reference
y = 3.3E+05x + 4.2E-04R² = 1.0E+00
y = 2.6E+05x + 6.5E+03R² = 9.8E-01
0.E+00
2.E+04
4.E+04
6.E+04
8.E+04
1.E+05
1.E+05
1.E+05
2.E+05
2.E+05
0.0 0.1 0.2 0.3 0.4 0.5
Str
ess
(Pa)
Strain
Simulation
Reference
50
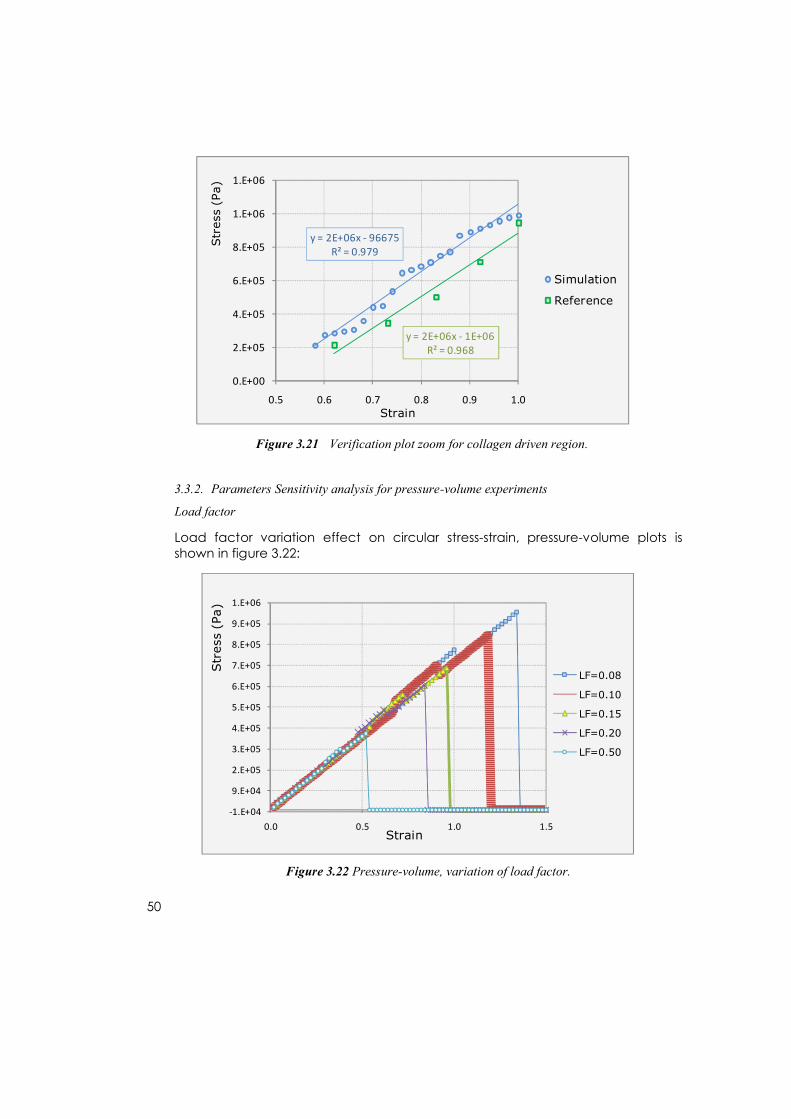
Figure 3.21 Verification plot zoom for collagen driven region.
3.3.2. Parameters Sensitivity analysis for pressure-volume experiments
Load factor
Load factor variation effect on circular stress-strain, pressure-volume plots is shown in figure 3.22:
Figure 3.22 Pressure-volume, variation of load factor.
y = 2E+06x - 96675R² = 0.979
y = 2E+06x - 1E+06R² = 0.968
0.E+00
2.E+05
4.E+05
6.E+05
8.E+05
1.E+06
1.E+06
0.5 0.6 0.7 0.8 0.9 1.0
Str
ess
(Pa)
Strain
Simulation
Reference
-1.E+04
9.E+04
2.E+05
3.E+05
4.E+05
5.E+05
6.E+05
7.E+05
8.E+05
9.E+05
1.E+06
0.0 0.5 1.0 1.5
Str
ess
(Pa)
Strain
LF=0.08
LF=0.10
LF=0.15
LF=0.20
LF=0.50
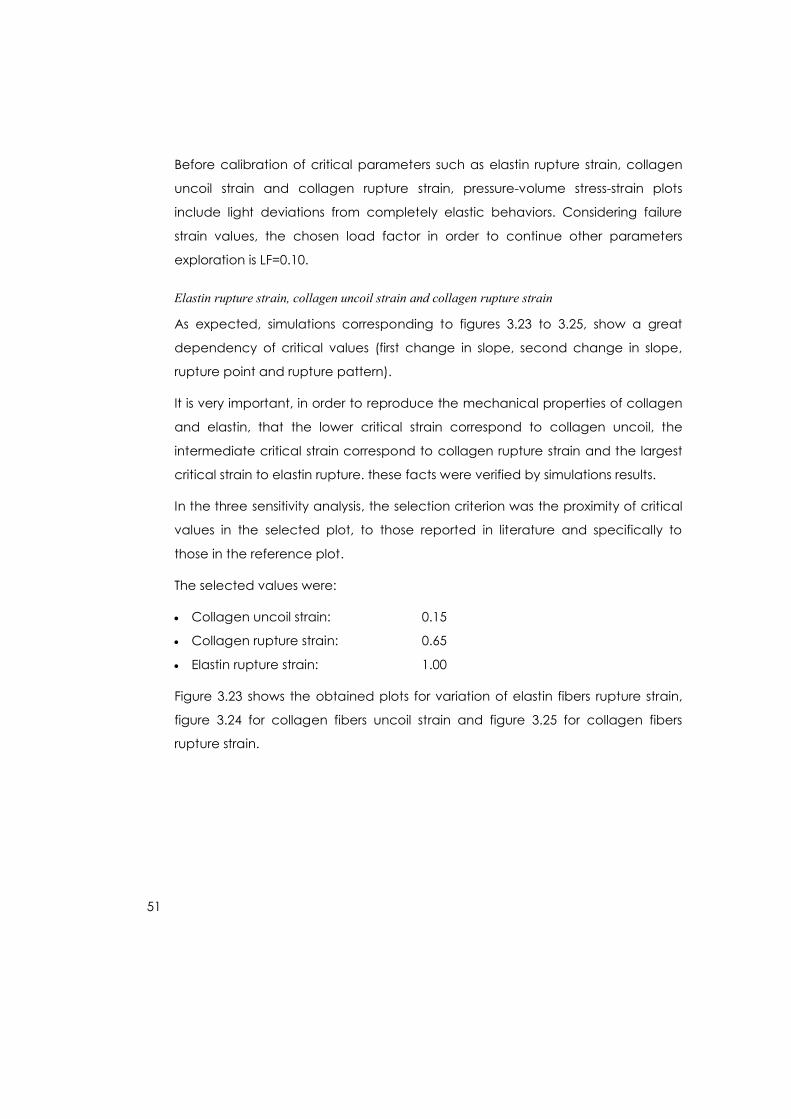
51
Before calibration of critical parameters such as elastin rupture strain, collagen
uncoil strain and collagen rupture strain, pressure-volume stress-strain plots
include light deviations from completely elastic behaviors. Considering failure
strain values, the chosen load factor in order to continue other parameters
exploration is LF=0.10.
Elastin rupture strain, collagen uncoil strain and collagen rupture strain
As expected, simulations corresponding to figures 3.23 to 3.25, show a great
dependency of critical values (first change in slope, second change in slope,
rupture point and rupture pattern).
It is very important, in order to reproduce the mechanical properties of collagen
and elastin, that the lower critical strain correspond to collagen uncoil, the
intermediate critical strain correspond to collagen rupture strain and the largest
critical strain to elastin rupture. these facts were verified by simulations results.
In the three sensitivity analysis, the selection criterion was the proximity of critical
values in the selected plot, to those reported in literature and specifically to
those in the reference plot.
The selected values were:
Collagen uncoil strain: 0.15
Collagen rupture strain: 0.65
Elastin rupture strain: 1.00
Figure 3.23 shows the obtained plots for variation of elastin fibers rupture strain,
figure 3.24 for collagen fibers uncoil strain and figure 3.25 for collagen fibers
rupture strain.
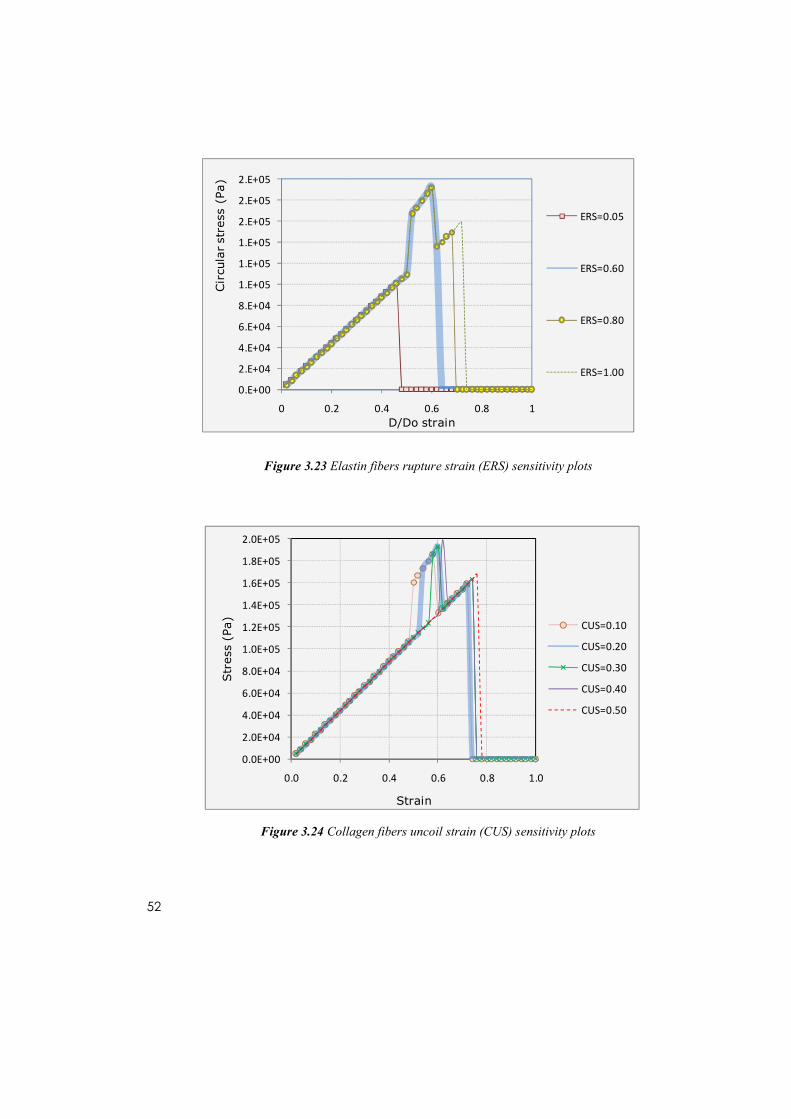
52
Figure 3.23 Elastin fibers rupture strain (ERS) sensitivity plots
Figure 3.24 Collagen fibers uncoil strain (CUS) sensitivity plots
0.E+00
2.E+04
4.E+04
6.E+04
8.E+04
1.E+05
1.E+05
1.E+05
2.E+05
2.E+05
2.E+05
0 0.2 0.4 0.6 0.8 1
Cir
cula
r st
ress
(Pa)
D/Do strain
ERS=0.05
ERS=0.60
ERS=0.80
ERS=1.00
0.0E+00
2.0E+04
4.0E+04
6.0E+04
8.0E+04
1.0E+05
1.2E+05
1.4E+05
1.6E+05
1.8E+05
2.0E+05
0.0 0.2 0.4 0.6 0.8 1.0
Str
ess
(Pa)
Strain
CUS=0.10
CUS=0.20
CUS=0.30
CUS=0.40
CUS=0.50
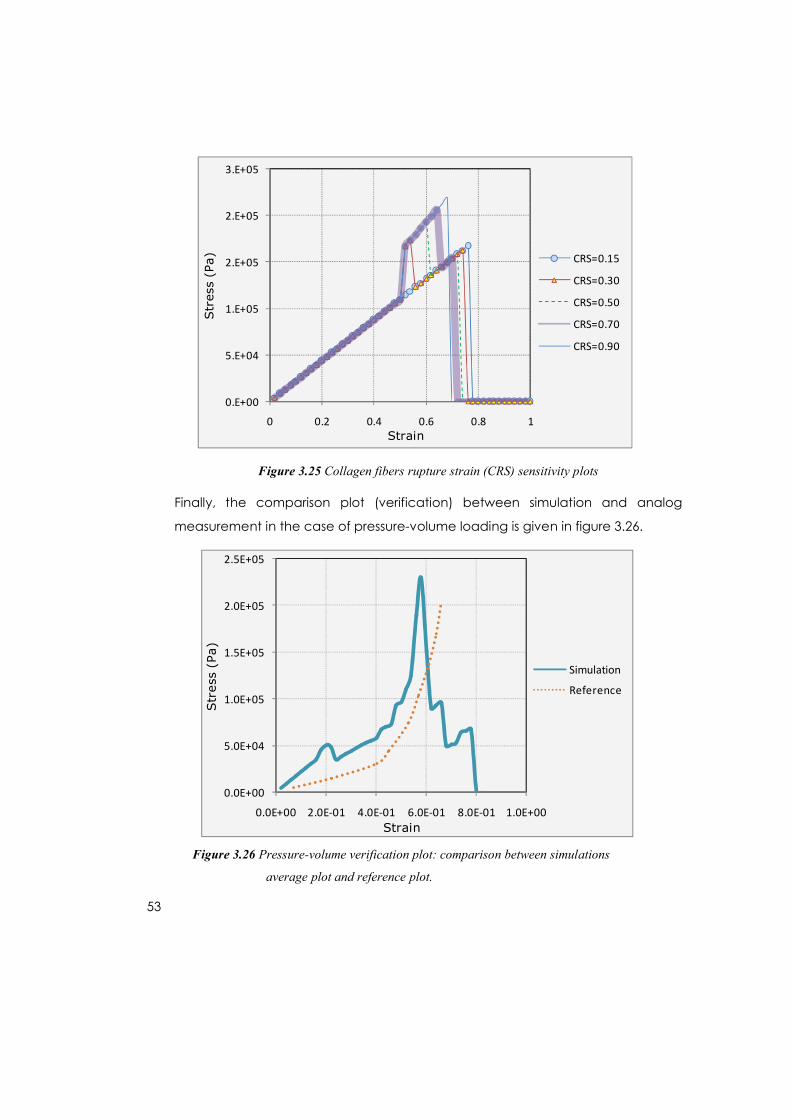
53
Figure 3.25 Collagen fibers rupture strain (CRS) sensitivity plots
Finally, the comparison plot (verification) between simulation and analog
measurement in the case of pressure-volume loading is given in figure 3.26.
Figure 3.26 Pressure-volume verification plot: comparison between simulations
average plot and reference plot.
0.E+00
5.E+04
1.E+05
2.E+05
2.E+05
3.E+05
0 0.2 0.4 0.6 0.8 1
Str
ess
(Pa)
Strain
CRS=0.15
CRS=0.30
CRS=0.50
CRS=0.70
CRS=0.90
0.0E+00
5.0E+04
1.0E+05
1.5E+05
2.0E+05
2.5E+05
0.0E+00 2.0E-01 4.0E-01 6.0E-01 8.0E-01 1.0E+00
Str
ess
(Pa)
Strain
Simulation
Reference
54
4. Discussion
The implemented arterial wall model is reviewed and discussed considering its
importance and difference with other models. The model utility is explored. The
simulation system is discussed. The obtained simulation plots are analyzed. Each
step in the sensitivity analysis is described.
4.1. Model design and implementation
An object oriented model of arterial wall has been designed, developed,
implemented and verified. Despite of the verification results, which into the
scope of the proposed objectives are satisfactory, the main result of the thesis
work is the object oriented nature of the model which allows a modular and
progressive extension, improvement and refinement. Another important benefit
of the object oriented nature of the model is the possibility to individually focus
the study attention into each wall component, both microscopic and
macroscopic. By parameter sensitivity analyses it is possible to set and refine
hypothesis on micro component attributes and organization. To our best
knowledge, this the first object oriented model of the arterial wall, including
micro structural components, with results and verification. Even in the field of
structural mechanics, there are few references giving account of the use of
object oriented methodologies as an alternative to the continuum approach.
The presented arterial wall model might be used as starting point to model
another collagenous tissue organic structures such as lung, eye, pericardium,
and skin. In these structures the long term behavior is strategically important.
4.2. Simulation system
The implemented simulation system belongs to the field of matrix structural
mechanics. This is a well established field and in permanent growth. Because of
the periodic nature of the truss model and the orthogonality of the members, the
stiffness matrix was well behaved, allowing a good solution approach by simple
methods such as Gauss-Jordan method. If structural disorder is included into the
model, (which in the present work has been successfully replaced by the
55
dynamical disorder introduced by the randomness in fibers diameter) the
mathematical tools should be highly improved. It would be of a great
importance to explore the use of stochastic mechanics methodologies and
optimization theory.
4.3. Axial loading experiments
Sensitivity analysis
Two were the conditions of choice:
The J-shaped pattern of the plot, with the critical points located close to a
strain of 0.3 for the first change in slope (the end of the “toe” region) and to
0.8 for the beginning of the rupture pattern
The similarity of the plot with the plot coming from analog experimental
characterization of the calves’ artery, reported by Leondes38.
The first step in the sensitivity analysis was to find an appropriate truss structure:
number of rings and number of arcs. The plot closer to the previously established
criteria, was the one corresponding to one layer and four rings. The plots
indicated that for a lower number of rings the global rigidity of artery was
substantially higher than 1 MPa, the most common value found in literature for
maximum stress of small arteries. For a number of layers greater than one, no
changes in the slope of the plots were obtained, which differs from the common
behavior of small arteries and in general, collagenous tissues. The best simulation
parameters, for axial loading found by the sensitivity analysis were:
Load factor: 0.0015 Fiber diameter mean: 0.050 mm Fiber diameter SD: 0.010 mm Elastin modulus: 2.0e5 Pa Elastin rupture strain: 1.00 Collagen modulus: 5.0e7 Pa Collagen uncoil strain: 0.10 Collagen rupture strain: 0.50
The global elastic modulus of artery from simulations is 30 kPa for the toe region,
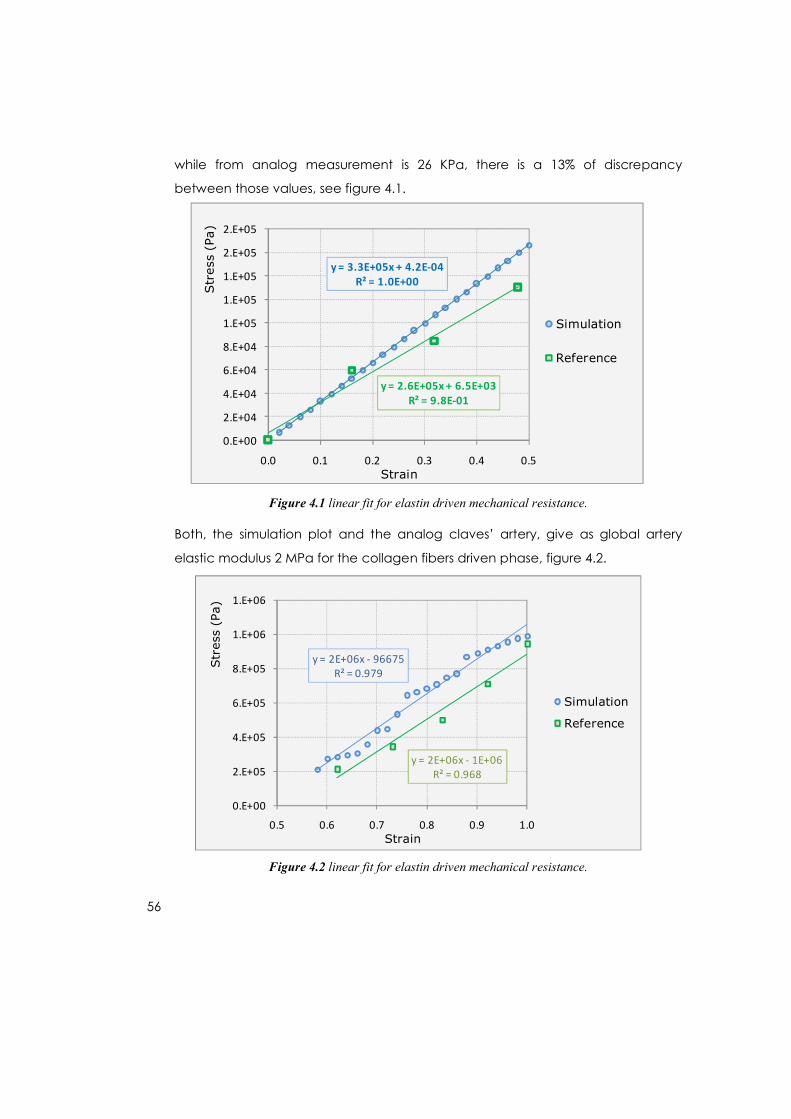
56
while from analog measurement is 26 KPa, there is a 13% of discrepancy
between those values, see figure 4.1.
Figure 4.1 linear fit for elastin driven mechanical resistance.
Both, the simulation plot and the analog claves’ artery, give as global artery
elastic modulus 2 MPa for the collagen fibers driven phase, figure 4.2.
Figure 4.2 linear fit for elastin driven mechanical resistance.
y = 3.3E+05x + 4.2E-04R² = 1.0E+00
y = 2.6E+05x + 6.5E+03R² = 9.8E-01
0.E+00
2.E+04
4.E+04
6.E+04
8.E+04
1.E+05
1.E+05
1.E+05
2.E+05
2.E+05
0.0 0.1 0.2 0.3 0.4 0.5
Str
ess
(Pa)
Strain
Simulation
Reference
y = 2E+06x - 96675R² = 0.979
y = 2E+06x - 1E+06R² = 0.968
0.E+00
2.E+05
4.E+05
6.E+05
8.E+05
1.E+06
1.E+06
0.5 0.6 0.7 0.8 0.9 1.0
Str
ess
(Pa)
Strain
Simulation
Reference
57
4.4. Pressure-volume experiments
The same criteria were used in order to verify pressure-volume simulation results.
The analog measurement control in this case was a stress-strain plot
corresponding to a rat’s small mesenteric artery reported in the paper by Adrian
et. al. (21)
Sensitivity analysis
The best simulation parameters, for pressure-volume experiments found by the
sensitivity analysis were:
Load factor: 0.100
Fiber diameter mean: 0.050 mm
Fiber diameter SD: 0.050 mm
Elastin modulus: 0.6 MPa
Elastin rupture strain: 1.00
Collagen modulus: 1.0 GPa
Collagen uncoil strain: 0.15
Collagen rupture strain: 0.65
Verification plot for pressure-volume
From the simulation data, at the toe (elastin driven) region, the global circular
elastic modulus of artery is 0.14 MPa, while from rat artery characterization is 0.11
MPa, which means that there is a 25% of discrepancy between those values.
At the collagen driven region there is a good similarity between the plots,
however, because of the curvature of the plots, a linear fit comparison is not
representative.
Considering the obtained results in both deformation models, some facts are
worth of remark:
The best structure approach was for one layer
There is a notorious difference in the standard deviation between axial and
circular deformation modes, which may mean that the fiber bunches are

58
preferentially axially aligned.
The range of extensibility in the circular deformation is greater than in axial
deformation.
59
5. Conclusions
Arterial wall object oriented model
An object oriented model of arterial wall has been designed, implemented and
verified. This model brings up into the world of tissue mechanics modeling the object
oriented paradigm and, with that, the possibility to start evolutionary modeling of
collagenous structures.
Despite that the purpose of the present work was not a pursue for accuracy on
prediction, the obtained results were not just physically meaningful but insightful on
exploring the best possible structure of adventitia fibrous network.
The truss arterial segment models that gave better results, in agreement with the
established verification criteria, were: one layer, four rings for axial loading mode and
one layer, three rings for pressure-volume mode.
Tacitly, it becomes remarkable the necessity to work on the inclusion of ground
substance into the arterial wall model, surely relevant in order to use the model in the
active behavior of artery, as the inclusion of a tunica media model too.
The verification results proved the importance of having stochasticity as an essential
element when modeling real complex systems, as in the case of arterial wall. One
fruitful strategy in order to include stochasticity into the models is the “permutation”
between structural and dynamical disorder. This idea, becomes from the world of
spin glass materials and was extensively worked in the author’s masters’ thesis (22).
The implementation of the model using UML gives the opportunity to explore these
modeling paradigm advantages to implement and communicate interdisciplinary
knowledge.
60
Simulation system
The implemented simulation engine, together with the object oriented arterial wall
model, produced physically meaningful results. These results were in a general
approach, close to the results obtained by experimental characterization of the
considered specimens.
The idea of representing the mechanical identity of a complex system (a structure in
the context of civil, mechanical and aerospace engineering) by a stiffness matrix is
useful and intellectually beautiful. That idea, allows the researcher to take
advantage of the linear algebra, and in general, modern algebra legacy.
The simulation engine program was composed by two nested procedures: one first
level estimating the necessary applied load to produce a given whole segment
strain, then calling the second level: a truss analysis procedure whose function was to
propagate the calculated macro load across all the micro members of the truss and
calculate the entire strain field. This two nest process was repeated at successive
equal strain increments, producing after each iteration a stress-strain point.
A secondary contribution, but strategically important, of the present work is to bring
up structural mechanics into the world of tissue and organs mechanics.
Simulation experiments
Despite that in the scope of the present work, predictability was not a main target,
the obtained results were similar to the chosen verification controls.
The best simulation parameters, for axial loading found by the sensitivity analysis
were:
Load factor: 0.0015 Fiber diameter mean: 0.050 mm Fiber diameter SD: 0.010 mm
61
Elastin modulus: 0.2 MPa Elastin rupture strain: 1.00 Collagen modulus: 50 MPa Collagen uncoil strain: 0.10 Collagen rupture strain: 0.50
Also, in the axial case of loading, the global elastic modulus of artery from simulations
was 30 kPa for the toe region, while from analog measurement was 26 kPa giving a
13% of discrepancy between those values.
In the case of pressure-volume deformation mode, the best simulation parameters
found by the sensitivity analysis were:
Load factor: 0.100 Fiber diameter mean: 0.050 mm Fiber diameter SD: 0.050 mm Elastin modulus: 0.6 MPa Elastin rupture strain: 1.00 Collagen modulus: 1.0 GPa Collagen uncoil strain: 0.15 Collagen rupture strain: 0.65
In pressure–volume mode, from the simulation data at the toe (elastin driven) region,
the global circular elastic modulus of artery was 0.15 MPa, while from rat artery
characterization is 0.11 MPa, a 25% of discrepancy between these values.
The simulations results support the idea that computer simulation should become a
strategically important tool to be used in activities where instrumentation is expensive
or sometimes inexistent, as in the case of cell, and tissue engineering.
It is possible to realize, by the obtained results, the importance of sensitivity analyses in
order to calibrate computer models of complex systems.
Of course, there is a lot of work in front of us in order to take full advantage of the
ideas presented at the present work:
Improve mathematical method to solve the deformation problem, possibly by
implementing energy optimization algorithms
Improve individual fiber models
62
Implement 2D and 3D graphical outputs, mainly 3D representation of stress
and strain fields
In addition to already available dynamical disorder representation, it would
be useful to introduce controlled structural disorder into the model.
Execute further analog verification experiments
And, what is most important, to introduce all this ideas into the clinical world.
These ideas and methods will allow to explore a deeper level of control of
arterial wall state, with this, to design more effective solutions and, less
traumatic clinical interventions.
63
Epilogue
The present work just pretended to be a seed, but a fresh and fruitful seed.
After the lived experience by the author during the time that doing this thesis took,
the best advice is that projects on complex system modeling should be teamwork,
and mainly interdisciplinary teamwork.
Because of that necessary interdisciplinariety, culture: teamwork values, a common
epistemological platform and a common knowledge representation language (as
UML is) is a matter of transcendental and strategic importance.
There is no reversal for the humankind in the XXI century in order to deal with its
emergent challenges: isolation is important (the analytical method) but is useless if
not finished up by good integration. In the other hand, good integration will always
preserve identity.
Philosophy, culture and humbleness are and always will be the root of humankind work in science and engineering
64
Bibliography
1. Fung, Y. C. Biomechanics: Mechanical Properties of Living Tissues. s.l. : Springer,
2005.
2. Holzapfel, Gerhard A, Gasser, Thomas C y Ogden, Ray W. A new constitutive
framework for arterial wall mechanics and comparative studies of materials models.
[aut. libro] Stephen C Cowin y Jay D Humphrey. Cardiovascular Soft Tissue
Mechanics. s.l. : Springer, 2004, Vol. 61.
3. Society, American Physiological. Handbook of Physiology. s.l. : Lippincot, Williams &
Wilkins, 1965.
4. Fung, Y. C. A First Course in Continuum Mechanics. s.l. : Prentice Hall, 1969.
5. Gere, W. y Weaver, J. M. Matrix Analysis of Framed Structures. s.l. : Kluwer
Academic Publishers Group, 1990.
6. Driessen N, Bouten C, Baaijens F. A computational model for collagen fibre
remodelling in the arterial wall. Journal of Theoretical Biology. 2004, Vol. 226, 1.
7. Barocas, V y R, Tranquillo. A finite element solution for the anisotropic biphasic
theory of tissue-equivalent mechanics: the effect of contact guidance on isometric
cell traction measurement. Journal of Biomechanical Engineering. 1997, Vol. 119, 3.
8. Strain energy density function and uniform strain hypothesis for arterial mechanics.
Takamizawa, K. y Hayashi, K. 7-17, s.l. : Journal of Biomechanics, 1987, Vol. 20.
9. Leondes, C. Biomechanical Systems Techniques and Applications Volume II:
Cardiovascular Techniques. s.l. : CRC Press, 2001.
10. Nordin, M., Lorenz, T. y Campello, M. Biomechanics of tendons and ligaments.
[aut. libro] M. Nordin y V. H. Frankel. Basic Biomechanics of the Musculoskeletal
System. s.l. : Lippincott Williams & Wilkins, 2002.
11. B., Pullman. The Emergence of Complexity in Mathematics, Physics, Chemistry
and Biology. s.l. : PONTIFICIA ACADEMIA SCIENTIARVM, 1996.
65
12. Frauenfelder, H. y Wolynes, P. G. Biomolecules where the physics of complexity
and simplicity meet. Physics Today. February, 1994.
13. Casti, J. L. The simply complex: "Biologizing" control Theory: How to make a control
system come alive , The big problems of control theory. Complexity. Vol. 7.
14. Seiffert, H. Introducción a la Teoría de la Ciencia. s.l. : Herder, 1977.
15. Singh, J. Teoría de la Información del Lenguaje y de la Cibernética. s.l. : Alianza
Editorial, 1972.
16. Whyte, L. L. Las Estructuras Jerárquicas. s.l. : Alianza Editorial, 1970.
17. Weisfeld, M. The Object-Oriented Thought Process, Second Edition. s.l. : SAMS,
2003.
18. Larman, C. Applying UML and Patterns: An Introduction to Object-Oriented
Analysis and Design and Iterative Development (3rd Edition). s.l. : Prentice Hall, 2004.
19. Adrian, M., Laurant, P. y Berthelot, A. Effect of magnesium on mechanical
properties of pressurized mesenteric small arteries from old and adult rats. Clinical
and Experimental Pharmacology and Physiology. 2004, Vol. 31.
20. Bronzino, J.D. Handbook of Biomedical Engineering. s.l. : CRC Press, 2000.
21. Balaguera, M. I., Díaz, J. M. y Guzmán, J. O. Fenómenos de relajación en vidrios
de espín bidimensionales. Revista Colombiana de Física. 2000, Vol. 20.
22. Vito, Raymond P. y Dixon, Stacey A. Blood Vessel Constitutive Models 1995–2002.
2003, Vol. 5.
23. Stefan, Sigfried. Understanding Object-Oriented Software Engineering. New York :
IEEE Press, 1996.
24. Object oriented framework development. Markiewicz, Marcus E y de Lucena,
Carlos J. 4, New York : Crossroads, ACM Press, 2001, Vol. 7.
25. Kiousis, Dimitrios. Computer Aided Angioplasty: Patient-specific arterial modeling
and smooth 3D contact analysis of the stent-balloon-artery interaction. Stockholm :
The Royal Institute of Technology, Sweden, 2007.
66
26. G., Brill. CodeNotes for J#. s.l. : Random House, 2003.
27. Chung, Christopher A. Simulation Modeling Handbook: A Practical Approach. s.l. :
CRC Press, 2003.
28. Barnes, D. J. y M., Kölling. Objects First With Java. s.l. : Prentice Hall, 2006.
29. Arlow, J. y Neustadt, I. UML 2 and the Unified Process: Practical Object-Oriented
Analysis and Design (2nd Edition). s.l. : Addison Wesley, 2005.